Chapter 14 Echocardiography in Respiratory Medicine
Echocardiographic Planes and Right-Sided Heart Structures
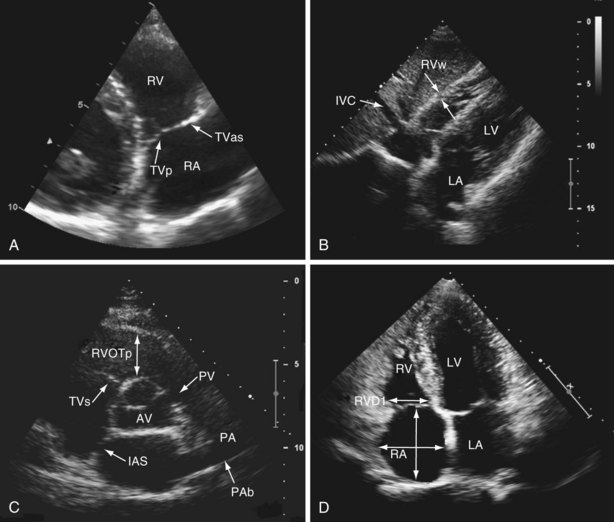
The right ventricle (RV) is located anterior to the left ventricle (LV) and is positioned just behind the sternum. When viewed anteriorly, the right ventricular cavity appears triangular in shape; however, it takes a crescentic shape in cross section. This anatomic orientation means that no single acoustic window allows visualization of the whole of the RV, so multiple transducer positions must be used. Standard echocardiography of the right side of the heart includes use of the parasternal (long-axis, right ventricular inflow, short-axis) (see Videos 1 and 2), apical (four-chamber) (see Video 3  ) and (modified four-chamber), and subcostal acoustic windows (see Video 4), generating a report that includes a qualitative description of right-sided heart anatomy and function, with at least one measurement of right atrial and right ventricular size, and a quantitative assessment of right ventricular function (Table 14-1). The venous inflow to the right side of the heart comprises the coronary sinus, superior vena cava, and inferior vena cava. The venous inflow is easily visualized from the parasternal acoustic window, in the right ventricular inflow view (Figure 14-1, A, and Video 5) and from the parasternal acoustic window, in the right ventricular inflow view (see Figure 14-1, B, and Video 4). The right atrium, tricuspid valve, and RV (inlet, free wall, apex, and infundibulum) are seen from the parasternal short axis (see Figure 14-1, C) and modified apical four-chamber views (see Figure 14-1, D). The tricuspid valve comprises septal, anterosuperior, and posterior leaflets, attached by chordae tendineae to papillary muscles located within the septum and lateral walls of the RV. Unlike with the aortic and mitral valves, it is not possible to see all three leaflets of the tricuspid valve from any single two-dimensional view—the septal and anterosuperior leaflets are seen in the apical four-chamber view, with the posterior and anterosuperior leaflets seen in the right ventricular inflow view. The pulmonary valve consists of three cusps without subvalvular apparatus and, along with the main pulmonary artery and proximal branch pulmonary arteries, is best seen on the parasternal short axis (see Figure 14-1, C, and Video 6) and rotated subcostal views. Normal ranges for right ventricular and right atrial size have been derived from normal healthy populations. An important point in this context is that these measures are not indexed to body surface area, so reported values may lose discriminatory power in assessment of these structures at either end of the normal distribution curve for size.
Table 14-1 Normal Limits for Recommended Measurements of Right-Sided Heart Structure and Function
| Variable | Abnormal | Illustrated in: |
|---|---|---|
| Chamber Dimensions | ||
| RV subcostal wall thickness | >0.5 cm | Figure 14-1, B |
| RVOT PLAX proximal diameter | >3.3 cm | Figure 14-1, C |
| RV basal diameter (RVD1) | >4.2 cm | Figure 14-1, D |
| RA major diameter | >5.3 cm | Figure 14-1, D |
| RA minor diameter | >4.4 cm | Figure 14-1, D |
| Systolic Function | ||
| Tricuspid annular plane systolic excursion (TAPSE) | <1.6 cm | Figure 14-2, A |
| Peak lateral TV annular velocity, S′ | <10 cm/s | Figure 14-2, B |
| Myocardial performance index (MPI) | ||
| Pulsed-wave Doppler imaging | >0.40 | |
| Tissue Doppler imaging | >0.55 | Figure 14-2, C |
| Fractional area change (FAC) | <35% | Figure 14-2, D |
| Diastolic Function | ||
| E/A | <0.8 or >2.1 | Figure 14-3, A |
| E/E′ | >6 |
A, velocity of active ventricular filling (see Figure 14-3, A); E, velocity of passive right ventricular filling (see Figure 14-3, A); E′, a tissue Doppler measurement of the motion of the lateral tricuspid valve annulus during early diastole (see Figure 14-2, B); PLAX, parasternal long axis; RV, right ventricle; RVOT, right ventricular outflow tract; RA, right atrium; TV, tricuspid valve.
Data from Rudski L, Lai W, Afilalo J, et al: Guidelines for the echocardiographic assessment of the right heart in adults: a report from the American Society of Echocardiography, J Am Soc Echocardiogr 23:685–713, 2010.
Assessment of Right Ventricular Function by Echocardiography
Tricuspid Annular Plane Systolic Excursion
Tricuspid annular plane systolic excursion (TAPSE) is measured using M-mode echocardiography in the apical four-chamber view to generate an image that illustrates the systolic longitudinal displacement of the lateral tricuspid annulus toward the apex (Figure 14-2, A). Because the septal attachment of the tricuspid annulus is relatively fixed, the major component of longitudinal systolic motion occurs at this point. The greater the displacement, the better is right ventricular function—a value less than 16 mm is considered abnormal. TAPSE correlates closely with right ventricular ejection fraction (RVEF) measured by radionuclide angiography, the “gold standard” modality for assessment of right ventricular function. TAPSE is simple to perform, with reproducible results, and is less dependent on optimal image quality than other measurements. It does not require complex calculations (the result obtained may be multiplied by 3.2 to give a value for RVEF, if desired) and can predict likelihood of death among patients with pulmonary arterial hypertension (PAH). However, TAPSE makes the assumption that displacement of a single segment represents function of the entire RV, which does not apply in the presence of regional dysfunction, particularly that affecting the septum. TAPSE is afterload dependent and falls with increasing severity of PAH.
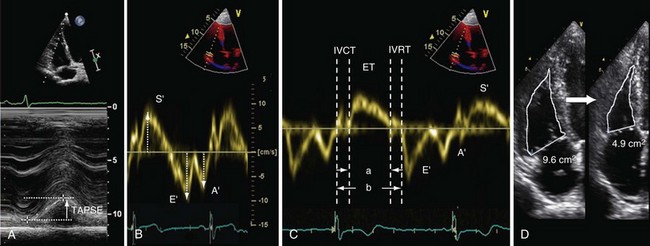
Figure 14-2 Assessment of right ventricular systolic function by various modalities: A, tricuspid annular plane systolic excursion (TAPSE); B, S′ wave measurement by tissue Doppler imaging; C, myocardial performance index (MPI), or Tei index, calculated as isovolumetric relaxation time (IVRT) plus isovolumetric contraction time (IVCT) divided by ventricular ejection time (ET), or a/b − a; D, fractional area change (FAC)—here, from 9.6 cm2 to 4.9 cm2 = 49%. E/E′ is calculated as follows: peak velocity of pulsed-wave Doppler E wave (measured at the tips of the tricuspid valve; see Figure 14-3, A) divided by peak velocity of the E′ wave (measured using tissue Doppler imaging at the lateral tricuspid valve annulus).
Peak Systolic Velocity of Lateral Tricuspid Annulus Displacement
Tissue Doppler imaging (TDI) can be used to measure the velocity of longitudinal displacement of the lateral tricuspid valve annulus during systole (S′) (see Figure 14-2, B). S′ values correlate closely with radionuclide angiography findings, and population-based validation studies indicate that a value less than 10 cm/s is abnormal. The data share the disadvantage of TAPSE in assuming that the velocity of a single wall region reflects the entire function of the complex three-dimensional shape of RV. Velocities are measured using Doppler imaging and therefore can underestimate function if measured off-angle by more than 20 degrees.
Myocardial Performance Index
The right ventricular myocardial performance index (MPI), also known as the Tei index, is the ratio of isovolumetric relaxation time (IVRT) plus isovolumetric contraction time (IVCT) to ventricular ejection time (see Figure 14-2, C). This index gives an accurate, global estimate of both systolic and diastolic right ventricular function. It avoids the need to use the geometric assumptions that are required for volumetric measurement of global right ventricular function, because MPI is based on time intervals from either blood pool Doppler (right ventricular outflow tract [RVOT] and tricuspid valve inflow) or tissue Doppler (lateral tricuspid valve annulus) measurements. A value greater than 0.4 is abnormal for blood pool Doppler, and a value greater than 0.55 is abnormal for tissue Doppler. Advantages of this technique include high reproducibility and the fact that it is relatively unaffected by variation in heart rate. The MPI can be falsely low under conditions of raised right atrial pressure, which may decrease the IVRT.
Fractional Area Change
Fractional area change (FAC) is obtained by tracing the endocardial border of the right ventricle in systole and diastole in the apical four-chamber view (see Figure 14-2, D). The percent FAC is then calculated using the formula (end-diastolic area − end-systolic area/end-diastolic area) × 100%, with a value below 35% considered abnormal. This method correlates closely with magnetic resonance imaging (MRI) assessment of right ventricular function, and reduced FAC is an independent predictor of adverse outcome after pulmonary embolism. The main practical disadvantage arises in defining contours in highly trabeculated RVs.
Right Ventricular Diastolic Function
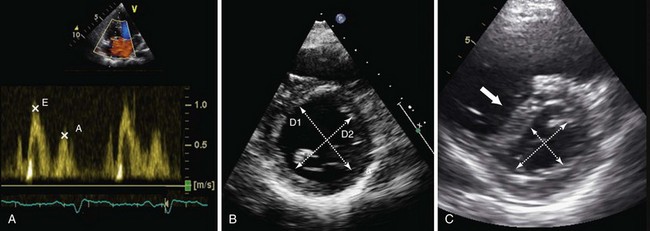
Diastolic function, which reflects the relaxation and filling of the RV, can be a useful early marker predicting deterioration in right ventricular function and may be of prognostic utility in patients with a number of acute and chronic respiratory conditions, although further data are needed. The parameters used for assessment of right ventricular diastolic function are essentially the same as those used in left ventricular diastolic assessment, including pulsed-wave Doppler-derived transtricuspid E/A ratio, tissue Doppler–derived E/E′ ratio, IVRT, and right atrial size (Figure 14-3, A). IVRT is a tissue Doppler measurement of the time taken for the right ventricle to relax, which is made at the basal right ventricular free wall. This relaxation period occurs after pulmonary valve closure (end of the S′ wave) and before tricuspid valve opening (beginning of the E′ wave) (see Figure 14-2, C). A prolonged IVRT (longer than 75 ms) may represent impaired myocardial relaxation and can be highly suggestive of PAH. Diastolic measurements should be acquired in end-expiration, and interpretation of the results should take account of the age of the patient (see Table 14-1). One additional important finding is the presence of late antegrade flow measured by pulsed-wave Doppler midway between the pulmonary valve leaflets and the pulmonary artery bifurcation, which is a sign of restrictive right ventricular filling and is associated with a poor prognosis.
Hemodynamic Assessment of the Right side of the Heart By Echocardiography
In health, the right side of the heart ejects blood into a low-resistance, highly distensible pulmonary vascular bed. The RV is thin-walled and more compliant than the LV (so it adapts well to increases in volume) but demonstrates heightened sensitivity to change in afterload (so it adapts poorly to increases in pulmonary vascular resistance). The LV and RV interact with one another during systole, and this ventricular interdependence is mediated mainly by the motion of the IVS. Both changes in volume (preload) or pressure (afterload) within the right side of the heart will have an impact on the motion of the IVS. Under normal conditions, the higher intracavity pressure in the LV, as compared with that in the RV, helps to maintain a circular shape of the LV when imaged in cross section (see Video 2). Pressure loading of the RV results in a “flattening” of the IVS during systole, creating a more D-shaped left ventricular cavity. Volume loading of the RV results in a “flattening” of the IVS during diastole (see Figure 14-3, B and C; see also Video 7  ). This is an important marker of loading conditions within the RV, which can be measured by calculating the “eccentricity index” of the LV in the parasternal short-axis view (i.e., the ratio of the anterior-posterior dimension to septal-lateral dimension of the left ventricular cavity).
A number of direct parameters can be used for hemodynamic assessment of the right ventricular and pulmonary circulations, the most common being measurement of right ventricular systolic pressure (RVSP) estimated from the velocity of the jet of the tricuspid regurgitation (Figure 14-4, A and B, and Video 8). Using the simplified Bernoulli equation,
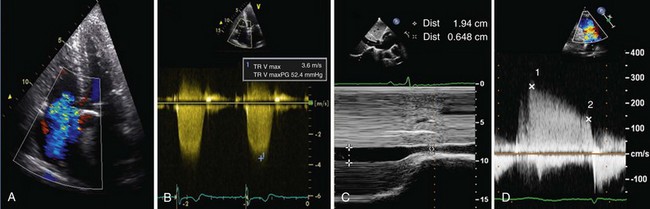
where v = maximal velocity of the jet of tricuspid regurgitation (in m/s) and right atrial pressure is estimated from resting inferior vena cava diameter taking into account the degree of inspiratory collapse (see Figure 14-4, C, and Video 9  ). In the absence of a gradient across the pulmonary valve or RVOT, RVSP equals the systolic pulmonary artery pressure (PAP). Care must be taken to ensure that this measurement is made with an adequate Doppler signal; if the signal is not clear, it can be improved with the injection of an agitated mixture of blood, saline, and air for contrast. The measurement should be made several times, and the highest velocity obtained used in calculation. A normal value for a peak tricuspid regurgitation signal is less than 2.6 m/s (equivalent to a pressure of 27 mm Hg + right atrial pressure), but this value increases with age and with increasing body mass index. This method may underestimate RVSP when severe tricuspid regurgitation is present.
The simplified Bernoulli equation also can be used to estimate diastolic PAP from the end-diastolic velocity of the pulmonary regurgitant jet: diastolic PAP = 4v2 + right atrial pressure (see Figure 14-4, D), where v = terminal velocity of the regurgitant jet (in m/s). Mean PAP can then be calculated using a standard formula: mean PAP = 1/3 systolic PAP + 2/3 diastolic PAP. It also can be estimated directly from the early peak of the regurgitant jet velocity: mean PAP = 4v2 (v = early maximal velocity of the regurgitant jet [in m/s]) plus right atrial pressure (see Figure 14-4, D). Echocardiography also can deliver measurements of pulmonary vascular resistance, pulmonary capillary wedge pressure, and pulmonary capacitance, although these are not in routine use. These measurements provide important insights into right ventricular and pulmonary hemodynamic status, although any conclusions should be based not only on a single hemodynamic parameter, such as jet velocity in tricuspid regurgitation, but also in the context of a full assessment of right ventricular and right atrial size, shape, and function.
Echocardiography in Evaluation of Specific Disease States
 ), the presence of right ventricular hypertrophy (greater than 5 mm in cross section) measured from the subcostal acoustic window, early systolic flattening of the IVS, and dilatation of the pulmonary artery. The sensitivity of such findings is likely to be low, as they are late pathologic consequences of PAH. Other indirect measures resulting from high afterload in the pulmonary circulation are useful and include prolongation of the right ventricular IVRT (greater than 75 ms) and shortening of the acceleration time of right ventricular ejection into the pulmonary artery (less than 105 ms). High afterload also results in a fall in longitudinal contraction within the RV, resulting in a negative correlation with S′ wave velocity on TDI (less than 12 cm/s) and TAPSE (less than 18 mm). Finally, the degree of PAH correlates with an increase in the velocity of the jet of pulmonary regurgitation, measured on pulsed Doppler in the parasternal short-axis view.
Acute Right-Sided Heart Failure
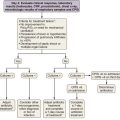
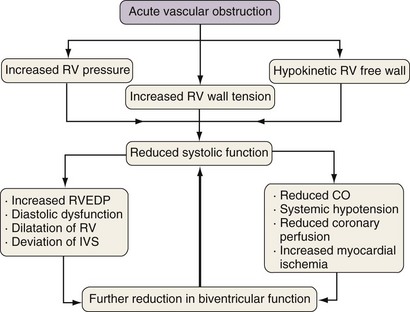
Acute right ventricular dysfunction may occur as a consequence of various disease processes, which include ischemic heart disease, myocarditis, and pulmonary embolism. Among patients presenting with suspected acute pulmonary embolism, neither TTE nor TEE have sufficient sensitivity to be used as the primary imaging modality for diagnosis but may provide useful supportive data and can identify those persons at high risk for adverse outcomes. Typically, the abrupt vascular obstruction sets up a cascade of adverse hemodynamic effects that not only exert strain on the RV but also may impair left ventricular function and coronary artery perfusion (Figure 14-5).
Pericardial Effusion and Tamponade
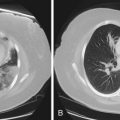
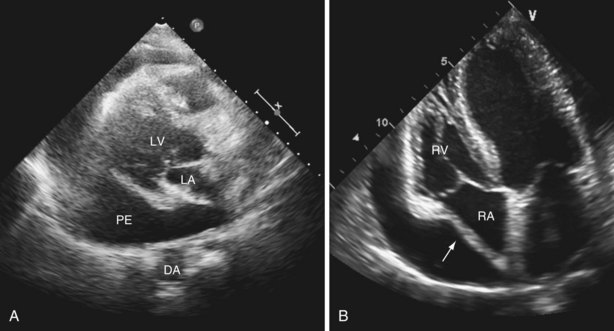
Pericardial effusion is detected easily by TTE and is distinguished from pleural fluid by its presence anterior to the descending aorta in the parasternal long-axis view (Figure 14-6 and Video 13  ). Pericardial fluid almost never overlaps the left atrium and usually collects behind the right atrium and then the RV and extends to the lateral wall of the LV. This localization obviously depends on patient position, but the effusion can be a focal process with a localized accumulation of fluid—for example, after cardiothoracic surgery. Assessing the size of a pericardial effusion is important for prognostication: The larger the collection, the worse the outcome. The presence of even a small pericardial effusion, however, is a marker for increased risk of death.
 ). Abnormal posterior motion of the anterior right ventricular free wall during diastole seen in the parasternal long-axis view should prompt urgent review, with consideration of pericardiocentesis. TTE can then play a vital role in guiding percutaneous needle aspiration, or drain insertion, which may rapidly alleviate symptoms. Echocardiography-guided aspiration has a high procedural success rate and carries a risk of major complications of only 1% to 2%.
 ). Being compliant chambers, both the left and right atria are considered “barometers” of ventricular filling pressure. This means that biatrial enlargement is often present in restrictive cardiomyopathy as a result of increased biventricular filling pressures. The RV may be hypertrophied and ultimately dilated, in the presence of elevated pulmonary artery pressure. Right-sided heart failure is a final common pathway, often as a sequel to chronic PAH driven by the underlying respiratory disorder.
Arcasoy S, Christie J, Ferrari V, et al. Echocardiographic assessment of pulmonary hypertension in patients with advanced lung disease. Am J Respir Crit Care Med. 2003;167:735–740.
Forfia P, Fisher M, Mathai S, et al. Tricuspid annular displacement predicts survival in pulmonary hypertension. Am J Respir Crit Care Med. 2006;174:1034–1041.
2009 Guidelines for the diagnosis and treatment of pulmonary hypertension. The Task Force for the Diagnosis and Treatment of Pulmonary Hypertension of the European Society of Cardiology and the European Respiratory Society, endorsed by the International Society of Heart and Lung Transplantation. Eur Heart J. 2009;30:2493–2537.
Haddad F, Doyle R, Murphy D, et al. Right ventricular function in cardiovascular disease, part II: pathophysiology, clinical importance, and management of right ventricular failure. Circulation. 2008;117:1717–1731.
Haddad F, Hunt S, Rosenthal D, et al. Right ventricular function in cardiovascular disease, part I: anatomy, physiology, aging, and functional assessment of the right ventricle. Circulation. 2008;117:1436–1448.
McConnell M, Solomon S, Rayan M, et al. Regional right ventricular dysfunction detected by echocardiography in acute pulmonary embolism. Am J Cardiol. 1996;78:469–473.
McQuillan B, Picard M, Leavitt M, et al. Clinical correlates and reference intervals for pulmonary artery systolic pressure among echocardiographically normal subjects. Circulation. 2001;104:2797–2802.
Milan A, Magnino C, Veglio F. Echocardiographic indexes for the non-invasive evaluation of pulmonary hemodynamics. J Am Soc Echocardiogr. 2010;23:225–239.
Rudski L, Lai W, Afilalo J, et al. Guidelines for the echocardiographic assessment of the right heart in adults: a report from the American Society of Echocardiography. J Am Soc Echocardiogr. 2010;23:685–713.
Vieillard-Baron A, Page B, Augarde R, et al. Acute cor pulmonale in massive pulmonary embolism: incidence, echocardiographic pattern, clinical implications and recovery rate. Intensive Care Med. 2001;27:1481–1486.