17 Echocardiography and Its Role in Cardiac Resynchronization Therapy
Cardiac resynchronization therapy (CRT) has an established role in the care of people with severe left ventricular (LV) systolic dysfunction, heart failure (HF) symptoms, and evidence of electrical dyssynchrony manifest as a wide QRS complex on the 12-lead electrocardiogram (ECG).1–7 The main principle of CRT is to attempt to normalize the electrical and mechanical ventricular activation sequence by strategically positioning a pacing lead in a coronary sinus tributary. This positioning allows for LV pre-excitation and may favorably alter the timing of LV events, thereby improving LV systolic function. Currently established indications for CRT include LV ejection fraction (LVEF) <35%, New York Heart Association (NYHA) class III or IV HF symptoms, and ECG evidence of dyssynchrony with a QRS duration of >120 ms.8 People selected for CRT in clinical trials using these criteria have shown significant improvement in NYHA class, 6-minute walk distance, peak oxygen consumption (VO2 max), reduced HF hospitalizations, and reduced total mortality.1–7 In addition, people undergoing CRT have shown significant improvement in LV reverse-remodeling parameters, such as a reduction in LV end-systolic volume and mitral regurgitation (MR).9 Unfortunately, not all patients with HF benefit from CRT. Overall, approximately 25% to 35% of patients selected for CRT using standard criteria do not show objective improvement over long-term follow-up.10 Since the advent of CRT echocardiography techniques have evolved in an attempt to further refine the selection, optimization, and follow-up of CRT candidates. This chapter summarizes the current role of echocardiography in patients referred for CRT.
Precardiac Resynchronization Therapy Patient Selection Using Echocardiography
The main goal of echocardiography in the pre-CRT implantation time frame is to identify and quantify dyssynchrony. Dyssynchrony refers to an alteration in both the electrical and mechanical cardiac activation sequences. Three types of dyssynchrony pertain to echocardiography and CRT: inter-, intra-, and atrioventricular.11 Interventricular dyssynchrony refers to an alteration in the timing sequence between the right and left ventricles. Interventricular dyssynchrony may be identified using conventional echo-Doppler methods preimplantation and does have modest predictive value in terms of predicting CRT response.7 Intraventricular dyssynchrony refers to alteration of the activation sequence within the left ventricular myocardium. For example, in left bundle branch block (LBBB) the interventricular septum is often activated significantly before the LV posterior and lateral walls. Such dyssynchrony may lead to impaired coordination of myocardial contractility, decrease in LVEF, and MR.12 Quantification of pre-CRT intraventricular dyssychrony may assist with pre-CRT selection of patients. Atrioventricular dyssynchrony refers to an alteration in the timing of atrial and ventricular activation and contraction that may have adverse effects on cardiac function. For example, first-degree atrioventricular (AV) block may lead to a significant delay between the end of atrial contraction and the onset of ventricular contraction. In HF patients, such a delay can result in higher left ventricular end-diastolic pressure (LVEDP) and diastolic MR.
Quantification of Interventricular Dyssynchrony
Measurement of interventricular dyssynchrony aims to quantify the temporal difference between the onset of right ventricle (RV) and LV activation by measurement of both LV and RV pre-ejection intervals. Some techniques report only the left ventricular pre-ejection interval (LVPEI),7 whereas others report the difference between the right ventricular pre-ejection interval (RVPEI) and the LVPEI to yield a measurement of interventricular dyssynchrony.11
Technique
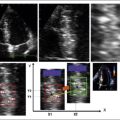
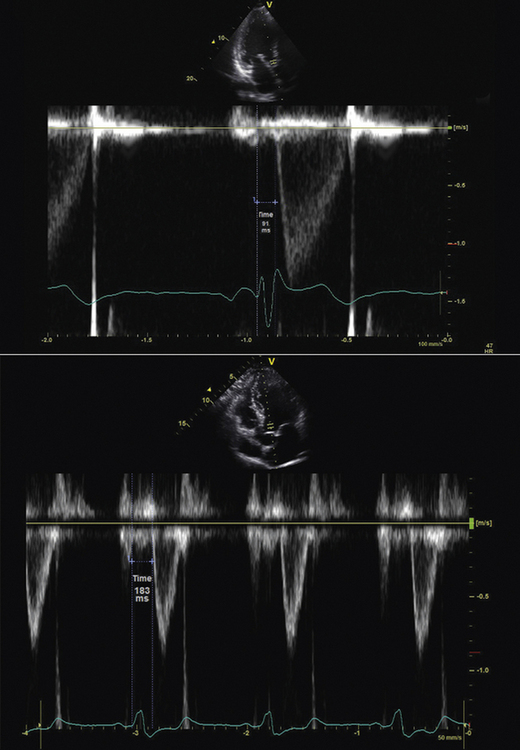
Using conventional Doppler imaging, pulsed-wave Doppler measurements are obtained sequentially in the right ventricular outflow tract (parasternal short-axis view) and left ventricular outflow tract (apical five-chamber view). Continuous ECG measurement is recorded. For each outflow tract, the time from the onset of the QRS complex to the onset of Doppler flow is measured (Fig. 17-1). The difference between the measurements is recorded as the measurement of interventricular dyssynchrony. A difference of >40 msec is considered evidence of significant interventricular dyssynchrony.11 LVPEI measured >140 msec is also considered evidence of significant interventricular dyssynchrony.7,10
Evidence
In the Cardiac Resynchronization in Heart Failure (CARE-HF) study,7 quantification of interventricular dyssynchrony was used as an inclusion criterion for study participants with a QRS width from 120 to 149 msec. In a subgroup analysis of this study, the presence of interventricular dyssynchrony with a cut-off value of ≥49.2 msec in those subjects who received CRT predicted a lower hazard ratio (HR) (0.50; 0.36–0.70) of outcome events when compared to those without interventricular dyssynchrony (0.77; 0.58–1.02). However, in terms of predicting CRT response, results have been variable. The Predictors of Response to CRT (PROSPECT) study13 found that in a multicenter setting, the predictive value of interventricular dyssynchrony was modest. An interventricular mechanical dyssynchrony of >40 msec was only 55.2% sensitive and 56.4% specific for CRT response, yielding an area-under-the-curve (AUC) of 0.58. Similarly, measurement of LVPEI was only 66.3% sensitive and 47.1% specific, yielding an AUC of 0.60. The PROSPECT investigators suggested that measurements of interventricular dyssynchrony should not be used as a basis for clinical decisions regarding CRT implantation.
Quantification of Intraventricular Dyssynchrony
Intraventricular dyssynchrony is present in a significant majority of people with HF and wide QRS complexes. The proportion of individuals with dyssynchrony increases as QRS duration increases and is especially prevalent when the QRS duration is >150 msec. The primary aim of a pre-CRT echocardiogram for intraventricular dyssynchrony is to identify those individuals who do not have significant mechanical dyssynchrony and therefore may be less likely to respond to CRT. Furthermore, echocardiography may identify a subset of individuals with QRS duration <120 msec who have significant mechanical dyssynchrony and therefore may benefit from CRT. However, the Resynchronization Therapy In Normal QRS (RETHINQ) trial,14 published in 2007, failed to demonstrate a significant benefit of CRT in people with NYHA class III HF symptoms, severe LV systolic dysfunction, QRS duration <120 msec, or echocardiographic evidence of mechanical dyssynchrony. There are registry and other nonrandomized data that suggest people with HF and wide QRS but no evidence of dyssynchrony have a relatively poor prognosis.11 In addition, in the absence of identifiable dyssynchrony, they may be less likely to respond to CRT. However, the PROSPECT study, published in 2008, suggested that the sensitivity, specificity, and AUC of current echocardiographic techniques to identify CRT nonresponders are inadequate to influence clinical decision-making.13 Other than the absence of dyssynchrony, there are several potential reasons for nonresponse to CRT. Extensive myocardial scar, suboptimal LV lead placement, and post-CRT myocardial infarction may influence CRT response.13 Newer techniques that combine both radial and longitudinal evaluation of dyssynchrony have improved sensitivity and specificity to identify dyssynchrony or its absence.15 Radial speckle tracking16 and real-time three-dimensional echocardiography (RT3DE)17 show some promise as improved techniques for precisely quantifying intraventricular dyssynchrony.
Two-Dimensional Imaging Technique
In some people with intraventricular dyssynchrony, certain hallmark features are seen on the two-dimensional (2D) images. Early septal contraction, often described as a septal flash or bounce, has been described. However, this method lacks sensitivity; therefore, more quantitative methods are required.10
M-Mode Imaging Techniques
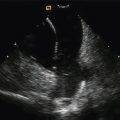
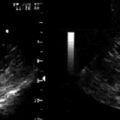
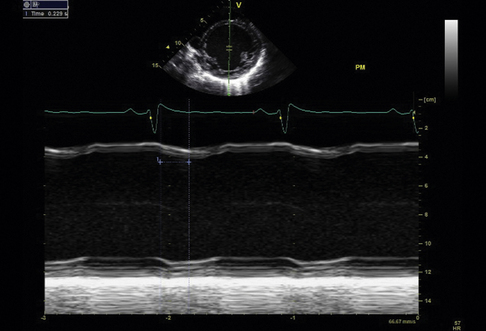
M-mode imaging is useful for temporal resolution of the synchrony of LV wall motion. Pitzalis et al.18 have described a technique that quantifies the difference in timing of contraction between the septal and posterior walls. Using this technique, septal-to-posterior wall motion delay (SPWMD) of >130 msec defines intraventricular dyssynchrony (Fig. 17-2).
Technique
2D images are obtained of the septal and posterior walls in the parasternal long-axis view. M-mode imaging is activated. Continuous ECG recording is obtained. Using the M-mode images, the time difference between the onset of septal wall contraction and the onset of posterior wall contraction is obtained. Some investigators also perform this M-mode measurement using the parasternal short-axis 2D image. A similar analysis of the M-mode images is performed. Color M-mode may, in some cases, improve temporal resolution.
Evidence
The evidence for this technique is weak. Two studies done at the same center18,19 showed an apparently significant predictive value of the SPWMD to predict CRT response as measured by reverse remodeling and symptomatic improvement. However, a study published in 2005 that evaluated the predictive value of the SPWMD in a large cohort from the VENTAK CHF/CONTAK CD Biventricular Pacing Study did not find this measurement to be predictive of CRT response.20 In the PROSPECT study, only 60.7% of echocardiograms were evaluable for SPWMD.13 The sensitivity and specificity for predicting CRT response were 6.3% and 91.7% for clinical improvement and 9.5% and 92.9% for improvement in left ventricular end-systolic volume (LVESV), yielding an AUC of 0.52 and 0.50, respectively.13 This technique is significantly limited by the fact that nearly 40% of patients in a multicenter setting were not evaluable. In people with nonischemic cardiomyopathy, the technique may have more utility. However, the predictive value overall for CRT response using this technique is poor.
Tissue Doppler Imaging Techniques
Tissue Velocity Imaging
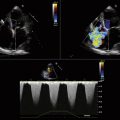
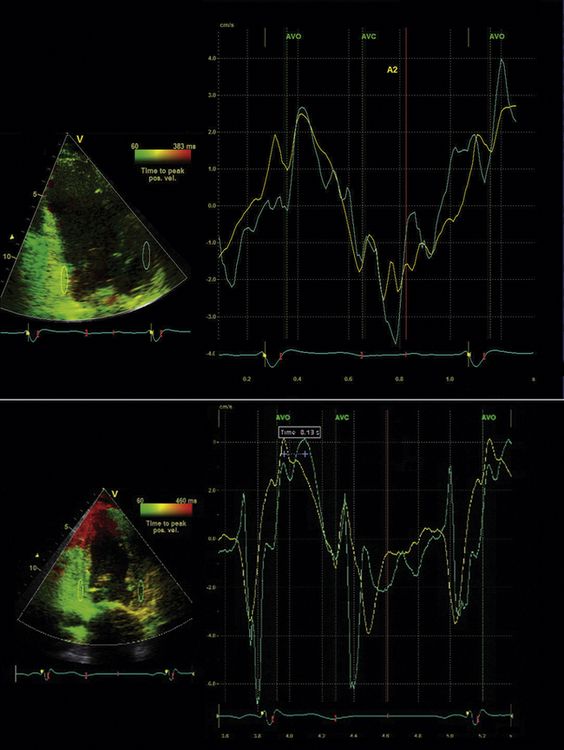
Tissue Doppler (TD) imaging techniques measure the velocity of myocardial contraction at the base and mid-regions of the LV in the longitudinal plane. These measurements are performed in the standard apical four-chamber, two-chamber, and three-chamber long-axis views. There are two types of tissue velocity imaging (TVI): color-coded and pulsed. The preferred method is color-coded TVI because it allows for offline analysis of data, and this is the technique that is reviewed here. A 1-cm sampling volume is obtained in each region of interest, and the tissue velocity in this region is sampled. In this way, differences in tissue velocity between opposing walls in each view can be obtained (Fig. 17-3).15 Alternatively, all longitudinal velocity measurements may be compared by calculating the standard deviations among the 12 segments measured.21 These methods are used to quantify intraventricular dyssynchrony of the left ventricle. Using the Bax method, any difference in opposing ventricular walls >65 msec is defined as intraventricular dyssynchrony.15 The corresponding cut-off for intraventricular dyssynchrony using the Yu index is a standard deviation of 12 segments >33 msec.21


Color Doppler Tissue Analysis
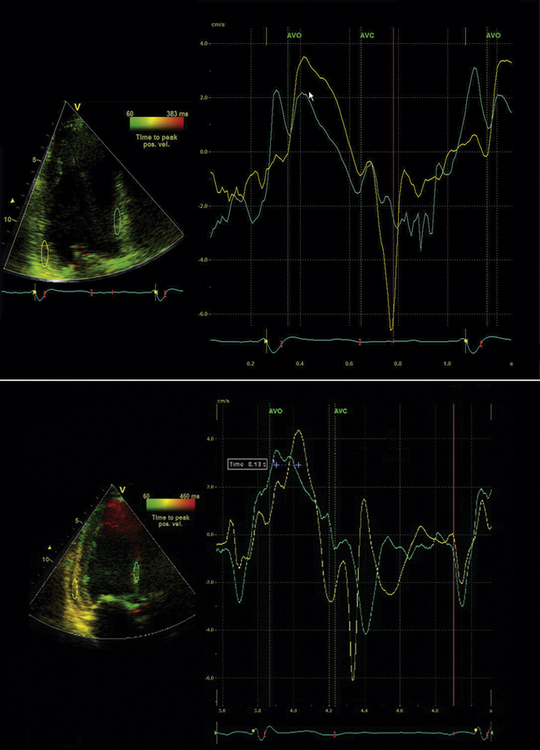
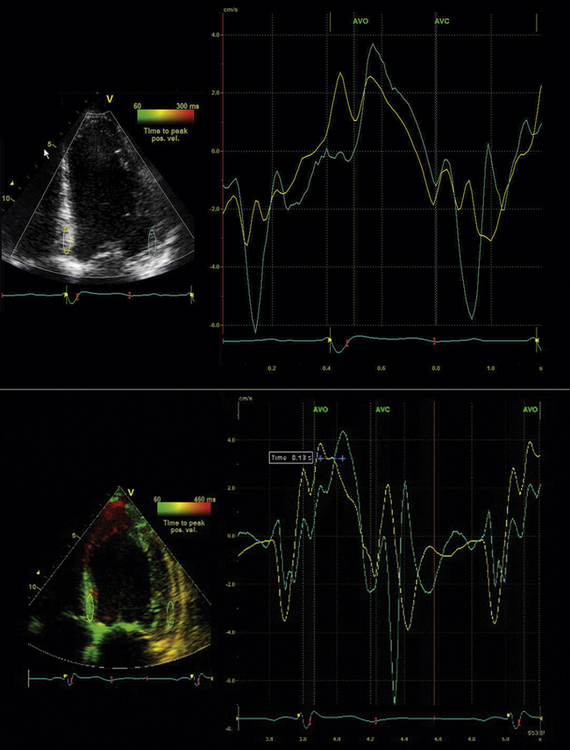
Identify components of the time–velocity curve to ensure physiologic signal quality. These components include the isovolumic contraction velocity (<60 msec from QRS onset), the systolic (S) wave (a positive deflection occurring during LV ejection), the early diastolic (E) wave, and the late diastolic (A) wave, both negative deflections (Figs. 17-4 and 17-5)
Evidence
The simplest approach to TVI involves measuring the basal segments of the apical four-chamber view to measure the septal-to-lateral delay. Bax et al.15 established a four-segment model that involved the basal segments of the septal, lateral, inferior, and anterior LV walls.15 An opposing wall delay of ≥65 msec predicted clinical response to CRT (improvement in NYHA class and 6-minute walking distance) as well as reverse remodeling (≥15% reduction in LVESV). Similarly, subjects with LV dyssynchrony ≥65 msec had a better prognosis post-CRT when compared to subjects without dyssynchrony.15 Yu et al.21 developed a 12-segment model that derives information from all three apical LV views. The Yu index is derived by calculating the standard deviation (SD) of the time to peak systolic velocity in the LV ejection phase. The 12-site SD cutoff value to define dyssynchrony is 33 msec.21 This value was obtained using measurements from healthy subjects. To predict LV reverse remodeling (≥15% reduction in LVESV) in subjects with QRS duration >150 msec, the cutoff SD value of 33 msec has a sensitivity of 83% and a specificity of 86%.21 In the multicenter PROSPECT study, TVI did not perform as well in predicting CRT clinical and reverse remodeling outcomes. For the Bax method, 66.8% of echocardiograms were evaluable.13 The predictive values for clinical composite score improvement and for improvement in LVESV were poor, with an AUC of 0.50 and 0.61, respectively.13 The Yu method was difficult to reproduce in a multicenter setting, with only 50% of echocardiograms evaluable.13 AUC for improvement in clinical composite score was 0.60; for improvement in LVESV it was 0.55.13 Thus, it appears that performance of these methods in single centers where the technique has been practiced and refined is much superior to a multicenter setting in terms of prediction of CRT outcomes.
Tissue synchronization imaging (TSI) uses color-coded time-to-peak-velocity data and superimposes this information on the standard 2D apical LV images. In this way, a visual rendering of the latest activated myocardial region is displayed. It is important to focus on peak tissue velocity during the early ejection period and to exclude early isovolumic contraction and late post-systolic shortening. Gorscan et al.22 used color TSI to guide placement of regions of interest and assess an anteroseptal-to-posterior wall delay ≥65 msec. This technique was able to predict an acute improvement in stroke volume post-CRT. Yu et al. also used TSI in 56 patients and found the SD of 12-segment tissue velocities had a receiver operating curve of 0.90 to predict CRT response.23 However, as shown in the PROSPECT study, such techniques may not perform as well in a multicenter setting.
Strain and Strain Rate Imaging
Evidence
Sogaard et al.24 showed that basal segment measurement of delayed longitudinal contraction measured by myocardial strain predicted improvement in LVEF after CRT. However, Yu et al.21 compared TVI data and strain rate imaging and showed that strain rate imaging failed to predict improvement in LVESV post-CRT. Furthermore, in the PROSPECT study, strain imaging data performed poorly in a multicenter setting, with 81.4% of echocardiograms evaluable and an AUC of only 0.51 for predicting both clinical improvement and improvement in LVESV post-CRT.13 Currently, tissue strain and strain rate imaging are limited by a poor signal-to-noise ratio and, therefore, are not the preferred methods for determination of intraventricular dyssynchrony.
Radial Strain
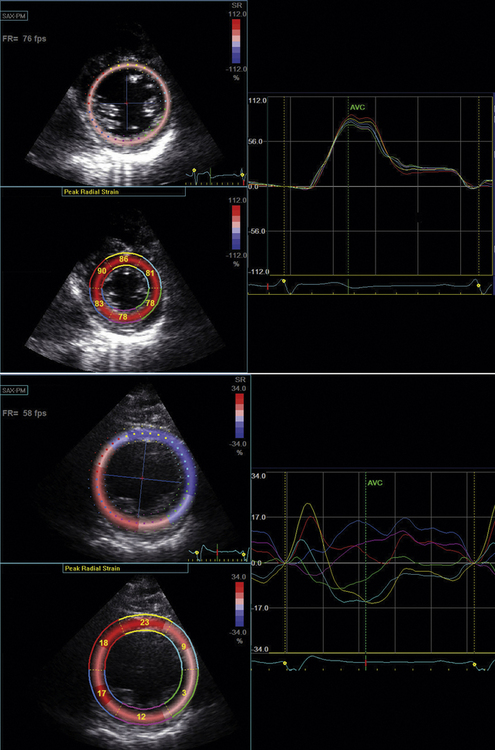
Tissue Doppler radial strain imaging was first described in 2005 by Dohi et al.25 They studied 38 patients who underwent CRT and measured radial dyssynchrony derived from TVI data. Their technique was limited by poor signal-to-noise ratio associated with poor image quality and by the Doppler angle of incidence. In 2006, Suffoletto et al.16 described a new technique of radial strain imaging that tracked the motion of “speckles” derived from the raw radiofrequency tissue signal from the LV mid–short-axis image. The motion of grayscale speckles is tracked in the radial plane. This tracking allows for the quantification of tissue velocity and, therefore, strain in the radial plane. This technique has the major advantage of not being limited by the Doppler angle of interrogation. Also, unlike M-mode measurements, radial strain imaging is able to distinguish between passive movement related to tethering and active myocardial movement. Radial strain is measured using a mid-LV short-axis image at the papillary muscle level. Time to peak percent thickening of the septal and posterior wall segments is determined.
Technique
In radial speckle tracking, 2D images are obtained in the parasternal short axis at the level of the papillary muscle. Frame rate is optimized to >100 fps. Radial speckle tracking software is run that allows selection of epicardial and endocardial borders.Then the software color-codes each segment. Analysis of radial strain is performed in the septal and posterior walls to quantify intraventricular dyssynchrony (Fig. 17-6). A difference in radial strain of >130 msec between the septal and posterior walls defines radial intraventricular dyssynchrony.16
Evidence
In the original description of radial strain measurement using speckle tracking, Suffolleto et al.16 studied 64 patients who were to undergo CRT. A baseline measurement of septal-to-posterior delay measured as radial strain >130 msec predicted an improvement in LVEF with a sensitivity of 89% and a specificity of 83% in 50 subjects who were followed up for 8 ± 5 months post-CRT. Another study of 176 subjects combined measurement of longitudinal dyssynchrony using TVI and radial dyssynchrony using radial strain speckle tracking.15 This study found that there was an additive predictive value to measurement of both longitudinal and radial dyssynchrony for prediction of post-CRT improvement in LVEF. Also, subjects who had no dyssynchrony detectable by either method showed a very low incidence of LVEF improvement post-CRT, while those subjects with a variable pattern of dyssynchrony had an intermediate improvement in LVEF.
Other Techniques to Quantify Intraventricular Dyssynchrony
Two other techniques have been used to quantify intraventricular dyssynchrony. Breithardt et al.26 described a semi-automatic method of endocardial border detection using the apical four-chamber LV view. This method used mathematical Fourier transformation to detect septal-to-lateral wall dyssynchrony. Another method used a technique called vector velocity imaging, which measures LV myocardial velocities in reference to a reference point in the center of the LV cavity.27 This method showed modest success in predicting LVEF improvement post-CRT in 23 patients.
Real-Time Three-Dimensional Echocardiography to Analyze Dyssynchrony
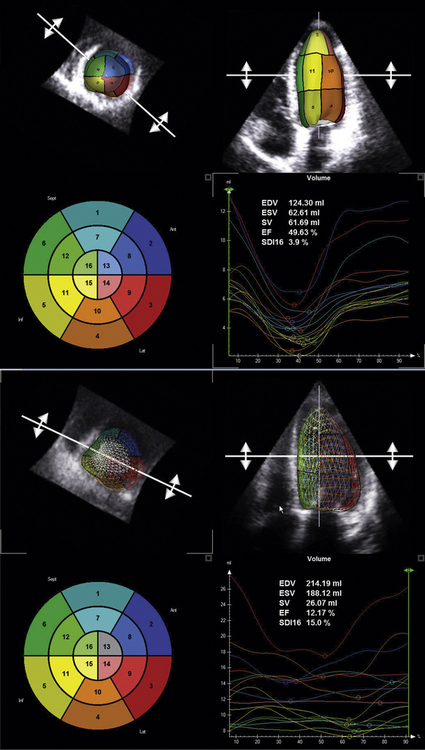
Real-time 3D echocardiography (RT3DE) has been demonstrated to be an effective and feasible tool to analyze intraventricular dyssynchrony.17 The advantages of RT3DE include its integration of longitudinal, transverse, and radial dyssynchrony into a single measure, the systolic dyssynchrony index (SDI).17 The SDI is described as a percentage in relation to components of the 16-segment LV model. Time to minimal volume is measured and integrated over the 16 segments to generate the SDI. The SDI has been shown to inversely correlate with LV ejection independent of QRS duration.17 Furthermore, measurement of the SDI using RT3DE has been shown to predict response to CRT. CRT candidates who have a higher SDI are more likely to show improvement in NYHA class and LVESV.17
The following description of RT3DE technique is derived from Kapetanakis et al.17 RT3DE uses the X4 matrix array to obtain a pyramidal volume in real time. There are 3000 active elements sending and receiving simultaneously. The initially acquired volumes have a relatively narrow sector width (30 degrees × 50 degrees). To visualize the entire LV, full volume acquisition (FVA) is used. For acquisition of a full-volume data set, four smaller real-time sets, acquired from alternate cardiac cycles, are combined to provide a larger pyramidal volume (up to 90 degrees × 90 degrees). FVA is performed during breathhold and requires a relatively stable R-R interval to minimize translation artifacts among the four acquired subvolumes. Apical FVA is acquired and used to measure time to minimal volume over the cardiac cycle. To optimize the frame rate of acquisition, depth is minimized and includes only the mitral and aortic valves. In patients with a significantly dilated LV, the scan line density is reduced to provide a larger pyramidal volume of acquisition. Quantitative analysis involves defining a number of 2D slices through the voxel-based 3D data set. In each of the slices, the endocardial border is traced using a semi-automated detection program to create a “cast” of the LV cavity. This cast serves as a mathematical model and provides time–volume data for the entire cardiac cycle. By dividing this volume into pyramidal subvolumes based around a nonfixed central point, it is possible to gain an estimation of time–volume data corresponding to each of the 16 standard myocardial segments, as defined by the American Society of Echocardiography (Fig. 17-7).
Dyssynchrony Index Using Real-Time Three-Dimensional Echocardiography
Kapetanakis et al.17 devised a dyssynchrony index using RT3DE. The index was derived by calculating the time taken to reach minimum regional volume for each segment as a percentage of the cardiac cycle. The SDI was defined as the standard deviation of these timings. Higher SDI signifies increasing intraventricular dyssynchrony. To allow comparisons between subjects with different heart rates, SDI is expressed as a percentage of the duration of the cardiac cycle rather than in milliseconds.
The evidence for the use of RT3DE to analyze dyssynchrony and to predict CRT outcomes is limited. Kapetanakis et al.17 studied 26 subjects who received CRT after dyssynchrony analysis using RT3DE. At 10 months follow-up, CRT responders, defined by improvement in NYHA functional class (mean improvement = 1.2), demonstrated LV reverse remodeling and improvement in their SDI from baseline. Furthermore, responders had a greater degree of baseline dyssychrony as measured by SDI when compared to nonresponders.
Pacing Lead Placement: Role of Echocardiography
TVI Doppler techniques have been used to guide LV lead placement for CRT by identifying the site of latest myocardial activation. Ansalone et al.28 demonstrated that LV lead placement at the site of latest activation demonstrated by TVI echocardiography was associated with a more favorable response to CRT. In this study, the inferior or posterolateral wall was identified as the site of latest myocardial activation in 75% of cases. Murphy et al.29 also identified the site of latest mechanical activation pre-CRT to guide lead placement. These investigators showed a gradient of response to CRT. Those subjects with lead placements near or at the site of latest activation had the most significant improvement in LV remodeling parameters, symptoms, and immediate hemodynamic response. In subjects with lead placement more than one segment away from the site of latest activation, there was no significant improvement in LV remodeling parameters at 6 months post-CRT. Suffoletto et al.16 evaluated the site of latest myocardial activation using 2D speckle tracking to quantify LV radial strain. In 22 patients who had LV leads placed in the region of latest activation, there was a modest improvement in LVEF (10 ± 5%) compared to the 24 patients who had leads positioned in other sites (6 ± 5%; P < 0.05). It is not yet clear what the role of echocardiography will be in guiding LV lead placement.
Optimizing Cardiac Resynchronization Therapy: Atrioventricular and Biventricular Optimization
Techniques for Determining Atrioventricular Optimization
Electrocardiogram-Derived Algorithm
An ECG-based algorithm for AV optimization has been described. One algorithm uses both the PR and QRS interval to determine the programmed AV delay. In this algorithm, the optimal AV delay is defined as [PR (msec) × 0.50] if QRS >150 msec or [PR (msec) × 0.70] if QRS <150 msec.30
Echocardiography Algorithms for Atrioventricular Delay Optimization
Ritter Method
The Ritter method uses analysis of the mitral inflow pattern to optimally time the end of the Doppler A wave with the mitral closure click (a surrogate for the onset of LV systole.)31 The AV delay is first programmed short (50 msec) to truncate the A wave and obtain a measure of the time to onset of LV contraction. Next, the AV delay is programmed long (200–250 msec) to measure intra-atrial conduction time. The optimal AV delay is then derived by subtracting the difference in time to mitral valve closure for each AV delay from the programmed long AV delay. Because of its complexity, many centers have replaced the Ritter method by other, more empiric methods.
Iterative Method
The iterative method uses principles similar to the Ritter method but is simpler in practice. The CRT device is programmed in atrial synchronous V pacing mode to allow empiric testing of a series of AV intervals while observing the effect on the mitral inflow pattern. The goal is to achieve E and A wave separation and completion of the A wave at 40 to 60 msec prior to the onset of the QRS complex or mitral valve closure click.10 This goal often corresponds with an E/A ratio <1. Technical factors that are important for this method include the following:
 Placing the sampling volume deep toward the left atrium to better identify mitral closure click


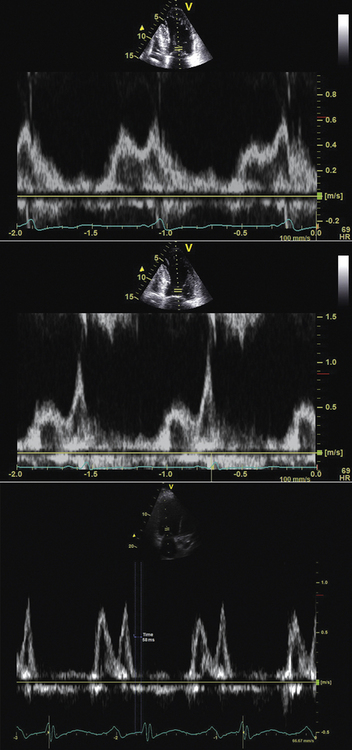
Another empiric method uses the LV outflow tract VTI at six selected paced and sensed AV delays. For example, the VTI is measured at AV delays of 60, 80, 100, 120, 140, and 160 msec, with each setting separated by a rest period of 10 to 15 beats. The AV delay setting with the largest VTI is the optimal AV delay (Fig. 17-8).10
Simplified Doppler Screening for Atrioventricular Optimization
Gorscan et al.,10 as part of the American Society of Echocardiography position statement in relation to CRT and echocardiography, recommended the adoption of a simplified protocol for AV optimization:
 Optimize the ECG input signal.
 Optimize pulsed Doppler mitral inflow velocity analysis by using high sweep speeds, low filters, and pulse sample volume set near mitral annulus to detect closure clicks.
 Examine mitral inflow pattern. No AV optimization is required if


Evidence
Sawhney et al.32 evaluated the role of AV optimization in a randomized controlled trial of 40 patients. An empiric AV delay setting of 120 msec was compared to AV optimization using an iterative method. The patients randomized to AV optimization had improvement in NYHA class and quality of life but no improvement in 6-minute walk or LV remodeling parameters at 3 months follow-up. Another larger study of 215 patients failed to demonstrate a significant difference in optimized versus empirically programmed AV delay (120 versus 135 msec).33 Furthermore, only a minority of patients showed hemodynamic improvement. Patients with intra-atrial conduction delay at baseline appeared to benefit most by prolonging the AV delay.33 Thus, at present, the evidence in support of echocardiography-guided AV optimization of CRT devices is weak.
Biventricular Optimization
Evidence
Sogaard et al.34 showed a small improvement in LVEF in 20 patients who underwent CRT and subsequent V-V optimization (30 ± 5% after CRT to 34 ± 6% after V-V optimization; P < 0.01) Other investigators have shown a significant reduction in mitral regurgitation.35 Future studies are planned to analyze V-V optimization using radial speckle tracking to measure and optimize myocardial torsion. Optimization of V-V timing during low-grade exercise also has been considered. Overall, the role of V-V optimization to improve long-term CRT outcomes has yet to be determined.
Left Ventricular Dyssynchrony and Narrow QRS Complex: Role of Echocardiography
LV dyssynchrony is not restricted to people with wide QRS complexes. In fact, up to 30% of people with QRS duration <120 msec may have evidence of mechanical dyssynchrony.14 In people with QRS duration <120 msec, severe LV dysfunction, and HF symptoms, echocardiography may have a role to assess the degree of dyssynchrony and predict CRT response. Bleeker et al.36 performed a study on 33 consecutive patients with QRS duration <120 msec, severe LV dysfunction, HF symptoms, and evidence of intraventricular dyssynchrony documented by a basal septal to lateral delay of >65 msec. The comparison group consisted of 33 consecutive patients with standard criteria for CRT, including a QRS duration >120 msec. At baseline, the groups were comparable in terms of the degree of LV dyssynchrony. In fact, there was no significant correlation between the QRS duration and the degree of intraventricular dyssynchrony. Patients with narrow QRS duration showed a similar symptomatic improvement compared to the wide QRS duration population.36 In a similar study, Yu et al.37 evaluated 102 CRT candidates who had both narrow and wide QRS duration. Each patient was assessed for intraventricular dyssynchrony using the Yu index described earlier in this chapter. At 3 months follow-up, patients with both narrow and wide QRS complexes had similar responses to CRT in terms of improvement in HF symptoms, peak exercise capacity, 6-minute walk test, ejection fraction, and degree of mitral regurgitation.37 The conclusion of these preliminary studies was that patients with narrow QRS duration and intraventricular dyssynchrony showed a similar response to CRT to those with a wide QRS duration and a similar degree of dyssynchrony. In 2007, the RethinQ clinical trial randomized 172 patients with a narrow QRS duration (<130 msec), evidence of intraventricular dyssynchrony, and otherwise standard indications for CRT to either receive CRT implantation or not.14 Patients were followed up for 6 months. The primary outcome was the proportion of patients having an increase in VO2 max of 1 mL/kg/min on exercise testing. Secondary end-points included improvement in NYHA HF class, 6-minute walk test, and quality-of-life score. There was no difference between the CRT and control groups in terms of the primary outcome. In a pre-specified analysis of patients with QRS duration of 120 to 130 msec, there was a modest but statistically significant difference in the primary outcome; however, the subgroup with a QRS duration of <120 msec showed no significant change. In another pre-specified analysis, the patients with nonischemic cardiomyopathy who received CRT did show modest improvement in NYHA HF class and 6-minute walk time but no improvement in quality of life score. Overall, this trial did not suggest any benefit of CRT, even when intraventricular dyssynchrony is identified in patients with a QRS duration <120 msec. However, in the subgroup with a QRS duration between 120 and 130 msec, it may be possible to predict response to CRT with dyssynchrony assessment.
Summary
Transthoracic Echocardiography
ACCF/ASE/AHA/ASNC/HFSA/HRS/SCAI/SCCM/SCCT/SCMR 2011 Appropriate Use Criteria for Echocardiography38
Device Evaluation (Including Pacemaker, ICD, or CRT) with TTE
 Initial evaluation or re-evaluation after revascularization and/or optimal medical therapy to determine candidacy for device therapy and/or to determine optimal choice of device
Appropriateness criteria: A; median score: 9
 Initial evaluation for CRT device optimization after implantation
Appropriateness criteria: U; median score: 6

Appropriateness criteria: A; median score: 8


1. Cazeau S., Leclercq C., Lavergne T., et al. Effects of multisite biventricular pacing in patients with heart failure and intraventricular conduction delay. N Engl J Med. 2001;344:873-880.
2. Auricchio A., Stellbrink C., Sack S., et al. Long-term clinical effect of hemodynamically optimized cardiac resynchronization therapy in patients with heart failure and ventricular conduction delay. J Am Coll Cardiol. 2002;39:2026-2033.
3. Abraham W.T., Fisher W.G., Smith A.L., et al. Cardiac resynchronization in chronic heart failure. N Engl J Med. 2002;346:1845-1853.
4. Higgins S.L., Hummel J.D., Niazi I.K., et al. Cardiac resynchronization therapy for the treatment of heart failure in patients with intraventricular conduction delay and malignant ventricular tachyarrhythmias. J Am Coll Cardiol. 2003;42:1454-1459.
5. Bristow M.R., Saxon L.A., Boehmer J., et al. Cardiac-resynchronization therapy with or without an implantable defibrillator in advanced chronic heart failure. N Engl J Med. 2004;350:2140-2150.
6. McAlister F.A., Ezekowitz J., Hooton N., et al. Cardiac resynchronization therapy for patients with left ventricular systolic dysfunction: a systematic review. JAMA. 2007;297:2502-2514.
7. Cleland J.G., Daubert J.C., Erdmann E., et al. The effect of cardiac resynchronization on morbidity and mortality in heart failure. N Engl J Med. 2005;352:1539-1549.
8. Epstein A.E., DiMarco J.P., Ellenbogen K.A., et al. ACC/AHA/HRS 2008 guidelines for device-based therapy of cardiac rhythm abnormalities: a report of the American College of Cardiology/American Heart Association Task Force on Practice Guidelines. J Am Coll Cardiol. 2008;52:1-62.
9. Yu C.M., Bleeker G.B., Fung J.W., et al. Left ventricular reverse remodeling but not clinical improvement predicts long-term survival after cardiac resynchronization therapy. Circulation. 2005;112:1580-1586.
10. Gorcsan J.3rd, Abraham T., Agler D.A., et al. Echocardiography for cardiac resynchronization therapy: recommendations for performance and reporting—a report from the American Society of Echocardiography Dyssynchrony Writing Group endorsed by the Heart Rhythm Society. J Am Soc Echocardiogr. 2008;21:191-213.
11. Bax J.J., Abraham T., Barold S.S., et al. Cardiac resynchronization therapy: Part 1—issues before device implantation. J Am Coll Cardiol. 2005;46:2153-2167.
12. Grines C.L., Bashore T.M., Boudoulas H., et al. Functional abnormalities in isolated left bundle branch block. The effect of interventricular asynchrony. Circulation. 1989;79:845-853.
13. Chung E.S., Leon A.R., Tavazzi L., et al. Results of the Predictors of Response to CRT (PROSPECT) trial. Circulation. 2008;117:2608-2616.
14. Beshai J.F., Grimm R.A., Nagueh S.F., et al. Cardiac-resynchronization therapy in heart failure with narrow QRS complexes. N Engl J Med. 2007;357:2461-2471.
15. Bax J.J., Bleeker G.B., Marwick T.H., et al. Left ventricular dyssynchrony predicts response and prognosis after cardiac resynchronization therapy. J Am Coll Cardiol. 2004;44:1834-1840.
16. Suffoletto M.S., Dohi K., Cannesson M., et al. Novel speckle-tracking radial strain from routine black-and-white echocardiographic images to quantify dyssynchrony and predict response to cardiac resynchronization therapy. Circulation. 2006;113:960-968.
17. Kapetanakis S., Kearney M.T., Siva A., et al. Real-time three-dimensional echocardiography: a novel technique to quantify global left ventricular mechanical dyssynchrony. Circulation. 2005;112:992-1000.
18. Pitzalis M.V., Iacoviello M., Romito R., et al. Ventricular asynchrony predicts a better outcome in patients with chronic heart failure receiving cardiac resynchronization therapy. J Am Coll Cardiol. 2005;45:65-69.
19. Pitzalis M.V., Iacoviello M., Romito R., et al. Cardiac resynchronization therapy tailored by echocardiographic evaluation of ventricular asynchrony. J Am Coll Cardiol. 2002;40:1615-1622.
20. Marcus G.M., Rose E., Viloria E.M., et al. Septal to posterior wall motion delay fails to predict reverse remodeling or clinical improvement in patients undergoing cardiac resynchronization therapy. J Am Coll Cardiol. 2005;46:2208-2214.
21. Yu C.M., Fung J.W., Zhang Q., et al. Tissue Doppler imaging is superior to strain rate imaging and postsystolic shortening on the prediction of reverse remodeling in both ischemic and nonischemic heart failure after cardiac resynchronization therapy. Circulation. 2004;110:66-73.
22. Gorcsan J.3rd, Kanzaki H., Bazaz R., et al. Usefulness of echocardiographic tissue synchronization imaging to predict acute response to cardiac resynchronization therapy. Am J Cardiol. 2004;93:1178-1181.
23. Yu C.M., Zhang Q., Fung J.W., et al. A novel tool to assess systolic asynchrony and identify responders of cardiac resynchronization therapy by tissue synchronization imaging. J Am Coll Cardiol. 2005;45:677-684.
24. Sogaard P., Egeblad H., Kim W.Y., et al. Tissue Doppler imaging predicts improved systolic performance and reversed left ventricular remodeling during long-term cardiac resynchronization therapy. J Am Coll Cardiol. 2002;40:723-730.
25. Dohi K., Suffoletto M.S., Schwartzman D., et al. Utility of echocardiographic radial strain imaging to quantify left ventricular dyssynchrony and predict acute response to cardiac resynchronization therapy. Am J Cardiol. 2005;96:112-116.
26. Breithardt O.A., Stellbrink C., Kramer A.P., et al. Echocardiographic quantification of left ventricular asynchrony predicts an acute hemodynamic benefit of cardiac resynchronization therapy. J Am Coll Cardiol. 2002;40:536-545.
27. Cannesson M., Tanabe M., Suffoletto M.S., et al. Velocity vector imaging to quantify ventricular dyssynchrony and predict response to cardiac resynchronization therapy. Am J Cardiol. 2006;98:949-953.
28. Ansalone G., Giannantoni P., Ricci R., et al. Doppler myocardial imaging to evaluate the effectiveness of pacing sites in patients receiving biventricular pacing. J Am Coll Cardiol. 2002;39:489-499.
29. Murphy R.T., Sigurdsson G., Mulamalla S., et al. Tissue synchronization imaging and optimal left ventricular pacing site in cardiac resynchronization therapy. Am J Cardiol. 2006;97:1615-1621.
30. Stellbrink C., Breithardt O.A., Franke A., et al. Impact of cardiac resynchronization therapy using hemodynamically optimized pacing on left ventricular remodeling in patients with congestive heart failure and ventricular conduction disturbances. J Am Coll Cardiol. 2001;38:1957-1965.
31. Kindermann M., Frohlig G., Doerr T., Schieffer H. Optimizing the AV delay in DDD pacemaker patients with high degree AV block: mitral valve Doppler versus impedance cardiography. Pacing Clin Electrophysiol. 1997;20(10 Pt 1):2453-2462.
32. Sawhney N.S., Waggoner A.D., Garhwal S., et al. Randomized prospective trial of atrioventricular delay programming for cardiac resynchronization therapy. Heart Rhythm. 2004;1:562-567.
33. Kedia N., Ng K., Apperson-Hansen C., et al. Usefulness of atrioventricular delay optimization using Doppler assessment of mitral inflow in patients undergoing cardiac resynchronization therapy. Am J Cardiol. 2006;98:780-785.
34. Sogaard P., Egeblad H., Pedersen A.K., et al. Sequential versus simultaneous biventricular resynchronization for severe heart failure. Circulation. 2002;106:2078-2084.
35. Bordachar P., Garrigue S., Lafitte S., et al. Interventricular and intra-left ventricular electromechanical delays in right ventricular paced patients with heart failure: implications for upgrading to biventricular stimulation. Heart. 2003;89:1401-1405.
36. Bleeker G.B., Holman E.R., Steendijk P., et al. Cardiac resynchronization therapy in patients with a narrow QRS complex. J Am Coll Cardiol. 2006;48:2243-2250.
37. Yu C.M., Chan Y.S., Zhang Q., et al. Benefits of cardiac resynchronization therapy for heart failure patients with narrow QRS complexes and coexisting systolic asynchrony by echocardiography. J Am Coll Cardiol. 2006;48:2251-2257.
38. Douglas P.S., Garcia M.J., Haines D.E., et al. ACCF/ASE/AHA/ASNC/HFSA/HRS/SCAI/SCCM/SCCT/SCMR 2011 appropriate use criteria for echocardiography. J Am Coll Cardiol. 2011;57(9):1126-1166.
39. Taylor A.J., Cerqueira M., Hodgson J.M., et al. ACCF/SCCT/ACR/AHA/ASE/ASNC/NASCI/SCAI/SCMR 2010 appropriate use criteria for cardiac computed tomography. J Am Coll Cardiol. 2010;56(22):1864-1894.