[level-membership-for-cardiovascular-category]
Chapter 2 ECG Basics Waves, Intervals, and Segments
Please go to expertconsult.com for supplemental chapter material.
Depolarization and Repolarization
In Chapter 1, the term electrical activation (stimulation) was applied to the spread of electrical signals through the atria and ventricles. The more technical term for the cardiac activation process is depolarization. The return of heart muscle cells to their resting state following stimulation (depolarization) is called repolarization.
These key terms are derived from the fact that normal “resting” myocardial cells (atrial and ventricular cells recorded between heartbeats) are polarized; that is, they carry electrical charges on their surface. Figure 2-1A shows the resting polarized state of a normal atrial or ventricular heart muscle cell. Notice that the outside of the resting cell is positive and the inside is negative (about –90 mV [millivolt] gradient between them).∗
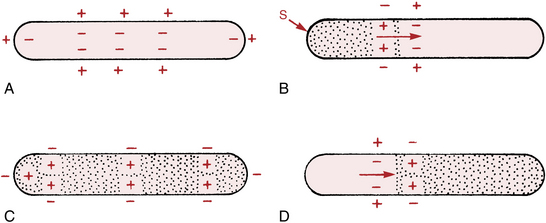
When a heart muscle cell is stimulated, it depolarizes. As a result the outside of the cell, in the area where the stimulation has occurred, becomes negative and the inside of the cell becomes positive. This produces a difference in electrical voltage on the outside surface of the cell between the stimulated depolarized area and the unstimulated polarized area (Fig. 2-1B). Consequently, a small electrical current is formed that spreads along the length of the cell as stimulation and depolarization occur until the entire cell is depolarized (Fig. 2-1C). The path of depolarization can be represented by an arrow, as shown in Figure 2-1B.
After a time the fully stimulated and depolarized cell begins to return to the resting state. This is known as repolarization. A small area on the outside of the cell becomes positive again (Fig. 2-1D), and the repolarization spreads along the length of the cell until the entire cell is once again fully repolarized. Ventricular repolarization is recorded by the ECG as the ST segment, T wave, and U wave. (Atrial repolarization is usually obscured by ventricular potentials.)
Basic ECG Waveforms: P, QRS, ST-T, and U Waves
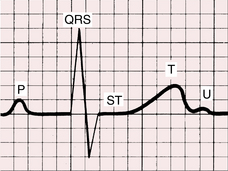
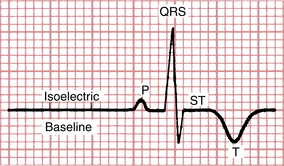
The spread of stimuli through the atria and ventricles followed by the return of stimulated atrial and ventricular muscle to the resting state produces the electrical currents recorded on the ECG. Furthermore, each phase of cardiac electrical activity produces a specific wave or complex (Fig. 2-2). The basic ECG waves are labeled alphabetically and begin with the P wave:
• P wave—atrial depolarization (activation)
• QRS complex—ventricular depolarization (activation)
• ST segment, T wave, and U wave—ventricular repolarization (recovery)
You may have asked why no wave or complex represents the return of stimulated atria to their resting state. The answer is that the atrial ST segment (STa) and atrial T wave (Ta) are generally not observed on the routine ECG because of their low amplitudes. An important exception is described in Chapter 10 in the discussion of acute pericarditis, which often causes PR segment deviation.
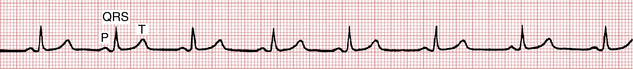
In summary, the P-QRS-T sequence represents the repetitive cycle of the electrical activity in the heart, beginning with the spread of a stimulus through the atria (P wave) and ending with the return of stimulated ventricular muscle to its resting state (ST-T sequence). As shown in Figure 2-3, this cardiac cycle repeats itself again and again.
ECG Graph Paper
The P-QRS-T sequence is usually recorded on special ECG graph paper that is divided into grid-like boxes (Figs. 2-3 and 2-4). Each of the small boxes is 1 millimeter square (1 mm2). The paper usually moves at a speed of 25 mm/sec. Therefore, horizontally, each unit represents 0.04 sec (25 mm/sec × 0.04 sec = 1 mm). Notice that the lines between every five boxes are heavier, so that each 5-mm unit horizontally corresponds to 0.2 sec (5 × 0.04 = 0.2). The ECG can therefore be regarded as a moving graph that horizontally corresponds to time, with 0.04-sec and 0.2-sec divisions.
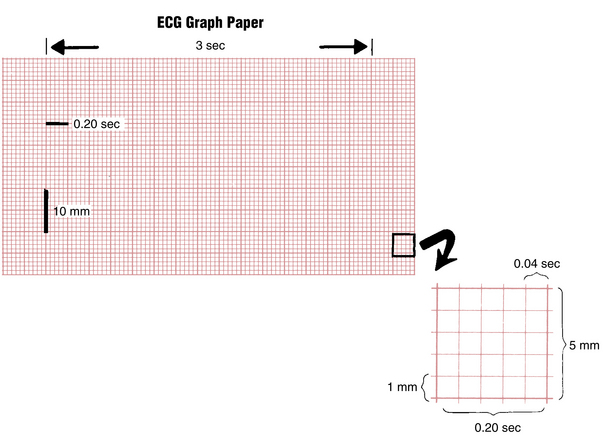
Vertically the ECG graph measures the voltages, or amplitudes, of the ECG waves or deflections. The exact voltages can be measured because the electrocardiograph is standardized (calibrated) so that a 1-mV signal produces a deflection of 10-mm amplitude (1 mV = 10 mm). In most electrocardiographs, the standardization can also be set at one-half or two times this usual calibration.
Basic ECG Measurements and Some Normal Values
Standardization (Calibration) Marker
The electrocardiograph must be properly calibrated so that a 1-mV signal produces a 10-mm deflection. Modern units are electronically calibrated; older ones may have a manual calibration button. As shown in Figure 2-5, the standardization mark produced when the machine is correctly calibrated is a square (or rectangular) wave 10 mm tall. If the machine is not standardized correctly, the 1-mV signal produces a deflection either more or less than 10 mm and the amplitudes of the P, QRS, and T deflections are larger or smaller than they should be.
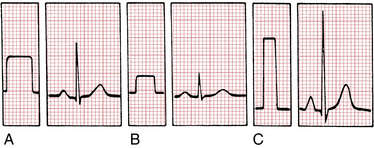
The standardization deflection is also important because standardization can be varied in most electrocardiographs (see Fig. 2-5). When very large deflections are present (as occurs, for example, in some patients who have an electronic pacemaker that produces very large spikes or who have high QRS voltage caused by hypertrophy), it may be advisable to take the ECG at one-half standardization to get the entire tracing on the paper. If the ECG complexes are very small, it may be advisable to double the standardization (e.g., to study a small Q wave more thoroughly). Some electronic electrocardiographs do not display the calibration pulse. Instead, they print the paper speed and standardization at the bottom of the ECG paper (“25 mm/sec, 10 mm/mV”).
Because the ECG is calibrated, any part of the P, QRS, and T deflections can be described in two ways; that is, both the amplitude (voltage) and the width (duration) of deflection can be measured. Thus, it is possible to measure the amplitude and width of the P wave, the amplitude and width of the QRS complex, the amplitude of the ST segment deviation (if present), and the amplitude of the T wave. For clinical purposes, if the standardization is set at 1 mV = 10 mm, the height of a wave is usually recorded in millimeters, not millivolts. In Figure 2-3, for example, the P wave is 1 mm in amplitude, the QRS complex is 8 mm, and the T wave is about 3.5 mm.
A wave or deflection is also described as positive or negative. By convention, an upward deflection or wave is called positive. A downward deflection or wave is called negative. A deflection or wave that rests on the baseline is said to be isoelectric. A deflection that is partly positive and partly negative is called biphasic. For example, in Figure 2-6 the P wave is positive, the QRS complex is biphasic (initially positive, then negative), the ST segment is isoelectric (flat on the baseline), and the T wave is negative.
P Wave
The P wave, which represents atrial depolarization, is a small positive (or negative) deflection before the QRS complex. The normal values for P wave axis, amplitude, and width are described in Chapter 6.
PR Interval
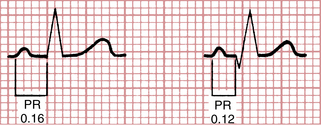
The PR interval is measured from the beginning of the P wave to the beginning of the QRS complex (Fig. 2-7). The PR interval may vary slightly in different leads, and the shortest PR interval should be noted. The PR interval represents the time it takes for the stimulus to spread through the atria and pass through the AV junction. (This physiologic delay allows the ventricles to fill fully with blood before ventricular depolarization occurs.) In adults the normal PR interval is between 0.12 and 0.2 sec (three to five small box sides). When conduction through the AV junction is impaired, the PR interval may become prolonged. Prolongation of the PR interval above 0.2 sec is called first-degree heart block or, preferably, AV delay (see Chapter 15).
QRS Complex
One of the most confusing aspects of electrocardiography for the beginning student is the nomenclature of the QRS complex. As noted previously, the QRS complex represents the spread of a stimulus through the ventricles. However, not every QRS complex contains a Q wave, an R wave, and an S wave—hence the confusion. The bothersome but unavoidable nomenclature becomes understandable if you remember several basic features of the QRS complex (Fig. 2-8): When the initial deflection of the QRS complex is negative (below the baseline), it is called a Q wave. The first positive deflection in the QRS complex is called an R wave. A negative deflection following the R wave is called an S wave. Thus the following QRS complex contains a Q wave, an R wave, and an S wave:
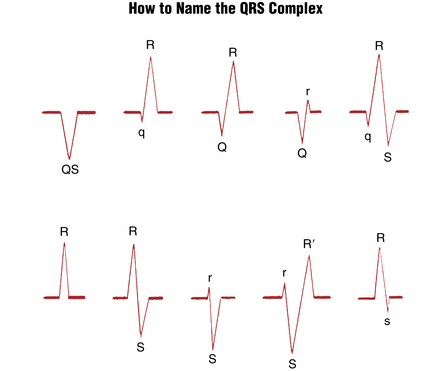

In contrast, the following complex does not contain three waves:

Figure 2-8 shows the various possible QRS complexes and the nomenclature of the respective waves. Notice that capital letters (QRS) are used to designate waves of relatively large amplitude and small letters (qrs) label relatively small waves (see Fig. 2-8).

You might also describe a QS (“capital Q, capital S”) in lead aVF:

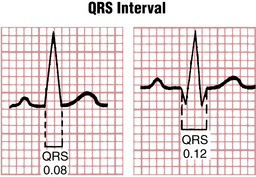
QRS Width (Interval)
The QRS width, or interval, represents the time required for a stimulus to spread through the ventricles (ventricular depolarization) and is normally about 0.10 sec (or 0.11 sec when measured by computer) or less (Fig. 2-9). If the spread of a stimulus through the ventricles is slowed, for example, by a block in one of the bundle branches, the QRS width is prolonged. The full differential diagnosis of a wide QRS complex is discussed in Chapters 10 and 22.
ST Segment
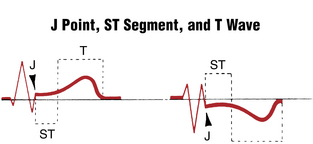
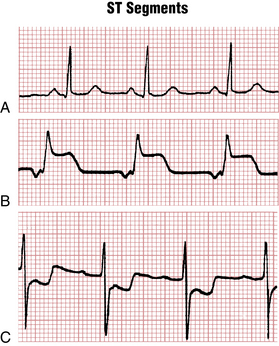
The ST segment is that portion of the ECG cycle from the end of the QRS complex to the beginning of the T wave (Fig. 2-10). It represents the beginning of ventricular repolarization. The normal ST segment is usually isoelectric (i.e., flat on the baseline, neither positive nor negative), but it may be slightly elevated or depressed normally (usually by less than 1 mm). Some pathologic conditions such as myocardial infarction (MI) produce characteristic abnormal deviations of the ST segment. The very beginning of the ST segment (actually the junction between the end of the QRS complex and the beginning of the ST segment) is sometimes called the J point. Figure 2-10 shows the J point and the normal shapes of the ST segment. Figure 2-11 compares a normal isoelectric ST segment with abnormal ST segment elevation and depression.
T Wave
The T wave represents part of ventricular repolarization. A normal T wave has an asymmetrical shape; that is, its peak is closer to the end of the wave than to the beginning (see Fig. 2-10). When the T wave is positive, it normally rises slowly and then abruptly returns to the baseline. When it is negative, it descends slowly and abruptly rises to the baseline. The asymmetry of the normal T wave contrasts with the symmetry of T waves in certain abnormal conditions, such as MI (see Chapters 8 and 9) and a high serum potassium level (see Chapter 10). The exact point at which the ST segment ends and the T wave begins is somewhat arbitrary and usually impossible to pinpoint precisely.
QT Interval
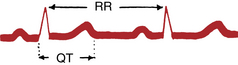
The QT interval is measured from the beginning of the QRS complex to the end of the T wave (Fig. 2-12). It primarily represents the return of stimulated ventricles to their resting state (ventricular repolarization). The normal values for the QT interval depend on the heart rate. As the heart rate increases (RR interval shortens), the QT interval normally shortens; as the heart rate decreases (RR interval lengthens), the QT interval lengthens. The RR interval, as described later, is the interval (time) between consecutive QRS complexes.
The QT should be measured in the ECG lead (see Chapter 3) that shows the longest intervals. A common mistake is to limit this measurement to lead II. You can measure several intervals and use the average value. When the QT interval is long, it is often difficult to measure because the end of the T wave may merge imperceptibly with the U wave. As a result, you may be measuring the QU interval, rather than the QT interval.
Table 2-1 shows the upper normal limits for the QT interval with different heart rates. Unfortunately, there is no simple well-accepted rule for calculating the normal limits of the QT interval.
| Measured RR Interval (sec) | Heart Rate (beats/min) | QT Interval Upper Normal Limit (sec) |
|---|---|---|
| 1.50 | 40 | 0.50 |
| 1.20 | 50 | 0.46 |
| 1.00 | 60 | 0.44 |
| 0.86 | 70 | 0.40 |
| 0.80 | 75 | 0.38 |
| 0.75 | 80 | 0.37 |
| 0.67 | 90 | 0.35 |
| 0.60 | 100 | 0.34 |
| 0.50 | 120 | 0.31 |
| 0.40 | 150 | 0.25 |

Normally the QTc is between about 0.33 sec (330 msec) and about 0.44 sec or (440 msec).
A number of factors can abnormally prolong the QT interval (Fig. 2-13). For example, this interval can be prolonged by certain drugs used to treat cardiac arrhythmias (e.g., amiodarone, dronedarone, ibutilide, quinidine, procainamide, disopyramide, dofetilide, and sotalol), as well as a large number of other types of “noncardiac” agents (fluoroquinolones, phenothiazines, pentamadine, etc.).
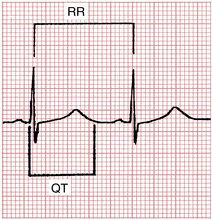
Figure 2-13 Abnormal QT interval prolongation in a patient taking the drug quinidine. The QT interval (0.6 sec) is markedly prolonged for the heart rate (65 beats/min) (see Table 2-1). The rate-corrected QT interval (normally 0.44 sec or less) is also prolonged.∗
∗ Use the methods described in this chapter to calculate the QTc.
Answers:
1. Using the “square root (Bazett) method”: QTc = QT/√RR = 0.60 sec/√0.92 = 0.63 sec.
2. Using Hodges method: QTc = QT + 1.75 (HR in beats/min − 60) = 0.60 + 1.75 (65 − 60) = 0.60 + 8.75 = 0.675 sec.
With both methods, the QTc is markedly prolonged, indicating a high risk of sudden cardiac arrest due to torsades de pointes (see Chapters 16 and 19).
Prolonged repolarization may predispose patients to develop torsades de pointes, a life-threatening ventricular arrhythmia (see Chapter 16).
Specific electrolyte disturbances (low potassium, magnesium, or calcium levels) are important causes of QT interval prolongation. Hypothermia also prolongs the QT interval by slowing the repolarization of myocardial cells. The QT interval may be prolonged with myocardial ischemia and infarction (especially during the evolving phase) and with subarachnoid hemorrhage. QT prolongation may predispose patients to potentially lethal ventricular arrhythmias. (See the discussion of torsades de pointes in Chapter 16.) The differential diagnosis of a long QT interval is summarized in Chapter 24.
The QT interval may also be shortened, for example, by digitalis in therapeutic doses or by hypercalcemia. Because the lower limits of normal for the QT interval have not been well defined, only the upper limits are given in Table 2-1.
U Wave
The U wave is a small, rounded deflection sometimes seen after the T wave (see Fig. 2-2). As noted previously, its exact significance is not known. Functionally, U waves represent the last phase of ventricular repolarization. Prominent U waves are characteristic of hypokalemia (see Chapter 10). Very prominent U waves may also be seen in other settings, for example, in patients taking drugs such as sotalol or one of the phenothiazines or sometimes after patients have had a cerebrovascular accident. The appearance of very prominent U waves in such settings, with or without actual QT prolongation, may also predispose patients to ventricular arrhythmias (see Chapter 16).
Normally the direction of the U wave is the same as that of the T wave. Negative U waves sometimes appear with positive T waves. This abnormal finding has been noted in left ventricular hypertrophy and myocardial ischemia.
Calculation of Heart Rate
Two simple types of methods can be used to measure the heart rate (number of heartbeats per minute) from the ECG (Figs. 2-14 and 2-15):
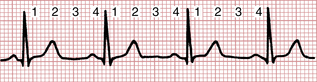
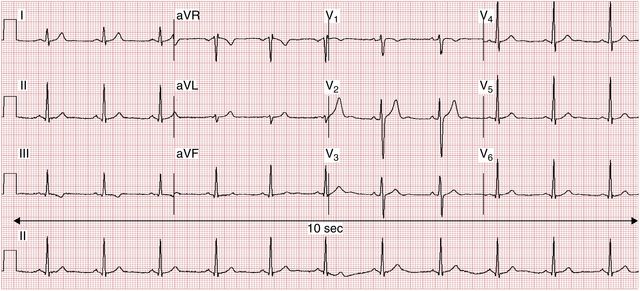
Figure 2-15 Quick methods to measure heart rate. Shown is standard 12-lead ECG with a continuous rhythm strip (lead II, in this case). Method 1A: Large box counting method (see Fig. 2-14) shows between four and five boxes between R waves, yielding rate between 75-60 beats/min, where rate is 300 divided by number of large (0.20 sec) boxes. Method 1B: Small box counting method more accurately shows about 23 boxes between R waves, where rate is 1500 divided by number of small (.04 sec) boxes = 65 beats/min. Method 2: QRS counting method shows 11 QRS complexes in 10 sec = 66 beats/60 sec or 1 min.
Box Counting Methods
For example, in Figure 2-14 the heart rate is 75 beats/min, because four large time boxes are counted between successive R waves (300 ÷ 4 = 75). Similarly, if two large time boxes are counted between successive R waves, the heart rate is 150 beats/min. With five intervening large time boxes, the heart rate is 60 beats/min.
When the heart rate is fast or must be measured very accurately from the ECG, you can modify the approach as follows: Count the number of small (0.04 sec) boxes between successive R waves and divide a constant (1500) by this number. In Figure 2-14, 20 small time boxes are counted between QRS complexes. Therefore, the heart rate is 1500 ÷ 20 = 75 beats/min. (The constant 1500 is used because 1500 × 0.04 = 60 and the heart rate is being calculated in beats per 60 sec [beats/min].)
Some house officers and physicians have adopted a “countdown” mnemonic where they incant: 300, 140, 100, 75, 60 … to compute the distance between QRS complexes. However, there is no need to memorize extra numbers: this countdown method is trivially based on dividing the number of large (0.2-sec) intervals between consecutive R (or S waves) and dividing that number into 300. If the rate is 30, you will be counting down for quite a while! But 300/10 = 30/min will allow you to calculate the rate and move on with the key decisions regarding patient care.
QRS Counting Methods
You can easily determine an average rate, whether the rate is regular or not, simply by counting the number of QRS complexes in some convenient time interval (e.g., every 10 sec, the recording length of most 12-lead clinical ECG records) and multiplying this number by the appropriate factor, for example, 6 to obtain the rate in beats per 60 sec (see Fig. 2-15).


ECG Terms are Confusing
Students are often confused by the standard ECG terms, which are arbitrary and do not make logical sense. But they are engrained in clinical usage so we have to get used to them. Therefore it is worth pausing and acknowledging these semantic confusions (Box 2-1).
The ECG as a Combination of Atrial and Ventricular Waveforms
However, in some abnormal conditions, the atria and the ventricles can be stimulated by separate pacemakers. For example, suppose that the AV junction is diseased and stimuli cannot pass from the atria to the ventricles. In this situation a new (subsidiary) pacemaker located below the level of the block in the AV junction may take over the task of pacing the ventricles at a relatively slow escape rate, while the sinus node continues to pace the atria. In such cases, stimulation of the atria is independent of stimulation of the ventricles, and the P waves and QRS complexes have no relation to each other. This type of arrhythmia is called complete AV heart block and is described in detail in Chapter 15.
The ECG in Perspective
1. The ECG is a recording of cardiac electrical activity. It does not directly measure the mechanical function of the heart (i.e., how well the heart is contracting and performing as a pump). Thus, a patient with acute pulmonary edema may have a normal ECG. Conversely, a patient with a grossly abnormal ECG may have normal cardiac function.
2. The ECG does not directly depict abnormalities in cardiac structure such as ventricular septal defects and abnormalities of the heart valves. It only records the electrical changes produced by structural defects. However, in some patients a specific structural diagnosis such as mitral stenosis, pulmonary embolism, or myocardial infarction/ischemia can be inferred from the ECG because typical electrical abnormalities may develop in such conditions.
3. The ECG does not record all the heart’s electrical activity. The electrodes placed on the surface of the body record only the currents that are transmitted to the area of electrode placement. In addition, the ECG records the summation of electrical potentials produced by innumerable cardiac muscle cells. Therefore, there are actually “silent” electrical areas of the heart. For example, parts of the muscle may become ischemic, and the 12-lead ECG may be entirely normal or show only nonspecific changes even while the patient is experiencing angina pectoris (chest discomfort due to an episode of myocardial ischemia).
4. The electrical activity of the AV junction can be recorded using a special apparatus and a special electrode placed in the heart (His bundle electrogram; see online material).
For these reasons the ECG must be regarded as any other laboratory test, with proper consideration for both its uses and its limitations (see Chapter 19).
The 12 ECG leads are described in Chapter 3. Normal and abnormal ECG patterns are discussed subsequently.
∗ Membrane polarization is due to differences in the concentration of ions inside and outside the cell. See the Appendix for a brief review of this important topic and the Bibliography for references that present the basic electrophysiology of the resting membrane potential and cellular depolarization and repolarization (the action potential) that underlie the ECG waves recorded on the body surface.
[/level-membership-for-cardiovascular-category][not-level-membership-for-cardiovascular-category]
Chapter 2 ECG Basics Waves, Intervals, and Segments
Please go to expertconsult.com for supplemental chapter material.
Depolarization and Repolarization
In Chapter 1, the term electrical activation (stimulation) was applied to the spread of electrical signals through the atria and ventricles. The more technical term for the cardiac activation process is depolarization. The return of heart muscle cells to their resting state following stimulation (depolarization) is called repolarization.
These key terms are derived from the fact that normal “resting” myocardial cells (atrial and ventricular cells recorded between heartbeats) are polarized; that is, they carry electrical charges on their surface. Figure 2-1A shows the resting polarized state of a normal atrial or ventricular heart muscle cell. Notice that the outside of the resting cell is positive and the inside is negative (about –90 mV [millivolt] gradient between them).∗
When a heart muscle cell is stimulated, it depolarizes. As a result the outside of the cell, in the area where the stimulation has occurred, becomes negative and the inside of the cell becomes positive. This produces a difference in electrical voltage on the outside surface of the cell between the stimulated depolarized area and the unstimulated polarized area (Fig. 2-1B). Consequently, a small electrical current is formed that spreads along the length of the cell as stimulation and depolarization occur until the entire cell is depolarized (Fig. 2-1C). The path of depolarization can be represented by an arrow, as shown in Figure 2-1B.
After a time the fully stimulated and depolarized cell begins to return to the resting state. This is known as repolarization. A small area on the outside of the cell becomes positive again (Fig. 2-1D), and the repolarization spreads along the length of the cell until the entire cell is once again fully repolarized. Ventricular repolarization is recorded by the ECG as the ST segment, T wave, and U wave. (Atrial repolarization is usually obscured by ventricular potentials.)
Basic ECG Waveforms: P, QRS, ST-T, and U Waves
The spread of stimuli through the atria and ventricles followed by the return of stimulated atrial and ventricular muscle to the resting state produces the electrical currents recorded on the ECG. Furthermore, each phase of cardiac electrical activity produces a specific wave or complex (Fig. 2-2). The basic ECG waves are labeled alphabetically and begin with the P wave:
• P wave—atrial depolarization (activation)
• QRS complex—ventricular depolarization (activation)
• ST segment, T wave, and U wave—ventricular repolarization (recovery)
You may have asked why no wave or complex represents the return of stimulated atria to their resting state. The answer is that the atrial ST segment (STa) and atrial T wave (Ta) are generally not observed on the routine ECG because of their low amplitudes. An important exception is described in Chapter 10 in the discussion of acute pericarditis, which often causes PR segment deviation.
In summary, the P-QRS-T sequence represents the repetitive cycle of the electrical activity in the heart, beginning with the spread of a stimulus through the atria (P wave) and ending with the return of stimulated ventricular muscle to its resting state (ST-T sequence). As shown in Figure 2-3, this cardiac cycle repeats itself again and again.
ECG Graph Paper
The P-QRS-T sequence is usually recorded on special ECG graph paper that is divided into grid-like boxes (Figs. 2-3 and 2-4). Each of the small boxes is 1 millimeter square (1 mm2). The paper usually moves at a speed of 25 mm/sec. Therefore, horizontally, each unit represents 0.04 sec (25 mm/sec × 0.04 sec = 1 mm). Notice that the lines between every five boxes are heavier, so that each 5-mm unit horizontally corresponds to 0.2 sec (5 × 0.04 = 0.2). The ECG can therefore be regarded as a moving graph that horizontally corresponds to time, with 0.04-sec and 0.2-sec divisions.
Vertically the ECG graph measures the voltages, or amplitudes, of the ECG waves or deflections. The exact voltages can be measured because the electrocardiograph is standardized (calibrated) so that a 1-mV signal produces a deflection of 10-mm amplitude (1 mV = 10 mm). In most electrocardiographs, the standardization can also be set at one-half or two times this usual calibration.
Basic ECG Measurements and Some Normal Values
Standardization (Calibration) Marker
The electrocardiograph must be properly calibrated so that a 1-mV signal produces a 10-mm deflection. Modern units are electronically calibrated; older ones may have a manual calibration button. As shown in Figure 2-5, the standardization mark produced when the machine is correctly calibrated is a square (or rectangular) wave 10 mm tall. If the machine is not standardized correctly, the 1-mV signal produces a deflection either more or less than 10 mm and the amplitudes of the P, QRS, and T deflections are larger or smaller than they should be.
The standardization deflection is also important because standardization can be varied in most electrocardiographs (see Fig. 2-5). When very large deflections are present (as occurs, for example, in some patients who have an electronic pacemaker that produces very large spikes or who have high QRS voltage caused by hypertrophy), it may be advisable to take the ECG at one-half standardization to get the entire tracing on the paper. If the ECG complexes are very small, it may be advisable to double the standardization (e.g., to study a small Q wave more thoroughly). Some electronic electrocardiographs do not display the calibration pulse. Instead, they print the paper speed and standardization at the bottom of the ECG paper (“25 mm/sec, 10 mm/mV”).
Because the ECG is calibrated, any part of the P, QRS, and T deflections can be described in two ways; that is, both the amplitude (voltage) and the width (duration) of deflection can be measured. Thus, it is possible to measure the amplitude and width of the P wave, the amplitude and width of the QRS complex, the amplitude of the ST segment deviation (if present), and the amplitude of the T wave. For clinical purposes, if the standardization is set at 1 mV = 10 mm, the height of a wave is usually recorded in millimeters, not millivolts. In Figure 2-3, for example, the P wave is 1 mm in amplitude, the QRS complex is 8 mm, and the T wave is about 3.5 mm.
A wave or deflection is also described as positive or negative. By convention, an upward deflection or wave is called positive. A downward deflection or wave is called negative. A deflection or wave that rests on the baseline is said to be isoelectric. A deflection that is partly positive and partly negative is called biphasic. For example, in Figure 2-6 the P wave is positive, the QRS complex is biphasic (initially positive, then negative), the ST segment is isoelectric (flat on the baseline), and the T wave is negative.
[/not-level-membership-for-cardiovascular-category]
