[level-membership-for-internal-medicine-category]
Chapter 17 Drug therapy and poisoning
Drug therapy


The patient


 Immunization against serious microbial infections (e.g. influenza vaccination)

 Oral contraceptives in sexually active women wishing to avoid pregnancy.
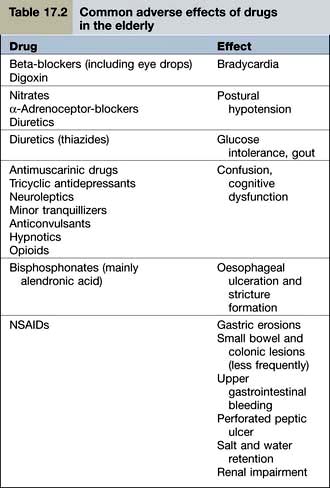
Co-morbidity may also significantly alter the way in which conditions are treated particularly in the elderly. Some examples are shown in Table 17.1.
Table 17.1 Examples of drugs to be avoided in people with co-morbidity
| Co-morbidity | Avoid | Effect |
|---|---|---|
|
Parkinson’s disease |
Neuroleptics |
Exacerbates Parkinsonian symptoms (including tremor) |
|
Hypertension |
Non-steroidal anti-inflammatory drugs |
Sodium retention |
|
Asthma |
Beta-blockers, adenosine |
Bronchospasm |
|
Respiratory failure |
Morphine, diamorphine |
Respiratory depression |
|
Renovascular disease |
ACE inhibitors/antagonists |
Reduction in glomerular filtration |
|
Chronic heart failure |
Trastuzumab |
Worsening of heart failure |
|
Chronic infections (e.g. tuberculosis, hepatitis C, histoplasmosis |
Cytokine modulators (e.g. etanercept) |
Increased risk of exacerbation |
Prescribing in neonates, infants, children and adolescents


There are other difficulties in prescribing for children:
 Many treatments have never been subject to formal trials in either children or adolescents and their benefits and risks have not, therefore, been appropriately assessed in these age groups. Efforts are being made, internationally, to redress this.

 Precise oral dosing is often impossible in babies who spit out unpleasant-tasting products!

Prescribing for the elderly
The use of drugs in the elderly is often a problem:
 Rates of hepatic drug metabolism and renal excretion decline with age. Extrapolation of drug dosages, from those appropriate in younger adults, may therefore lead to toxic plasma levels.


Examples of common problems encountered in the use of drugs amongst older people are shown in Table 17.2.
 |
Drug use in pregnancy
Clinicians should be extremely cautious about prescribing drugs to pregnant women, and only essential treatments should be given. When a known teratogen is needed during pregnancy (e.g. an anticonvulsant drug or lithium), the potential adverse effects should be discussed with the parents, preferably before conception. If parents wish to go ahead with the pregnancy, they should be offered an appropriate ultrasound scan to assess whether there is any fetal damage. Some known human teratogens are shown in Table 17.3.
| Drug | Effect |
|---|---|
|
ACE inhibitors/antagonists |
Oligohydramnios |
|
Retinoids, e.g. acitretin |
Multiple abnormalities |
|
Carbimazole |
Neonatal hypothyroidism |
|
|
Abnormalities of bone growth |
|
Antiepileptics |
|
|
Carbamazepine |
Cleft palate |
|
Lamotrigine |
|
|
Phenytoin |
|
|
Valproate |
Neural tube defects |
|
NSAIDs |
Delayed closure of the ductus arteriosus |
|
Cytotoxic drugs |
Most are presumed teratogens |
|
Lithium |
Ebstein’s anomaly |
|
Misoprostol |
Moebius’s syndrome |
|
Thalidomide (and possibly lenalidomide) |
Phocomelia |
Note: All drugs should be avoided in pregnancy unless benefit clearly outweighs the risk.
The drug
Selecting the right drug involves three elements:
 The drug’s clinical efficacy for the proposed use


The most common approach to assessing a drug’s efficacy is the randomized controlled trial (RCT), although other approaches (see p. 907) can be informative. The demonstration of absolute efficacy (against placebo) may, itself, be insufficient. Where there is more than one treatment for the same indication these should be compared with one another, taking account of the magnitude of their benefits, their individual adverse reaction profiles, and their costs.
The dose
Fixed dosage regimens
Drugs suitable (in adults) for prescribing at the same ‘fixed’ dose, for all patients, share common features. Efficacy is optimal in virtually all patients; and the risks of dose-related (type A) adverse reactions (see p. 904) are normally low. These drugs have a high ‘therapeutic ratio’ (i.e. the ratio between toxic and therapeutic doses). Examples of drugs prescribed at a fixed dose are shown in Table 17.4.
| Drug | Indication |
|---|---|
|
Aspirin |
Secondary prevention of myocardial infarction |
|
Clopidogrel |
|
|
Bendroflumethiazide |
Hypertension |
|
Broad spectrum penicillins |
Lower urinary tract infection |
|
Cephalosporins |
|
|
Macrolides |
Upper and lower respiratory tract infection |
|
Levonorgestrel |
Emergency contraception |
|
Ulipristal |
|
|
Oestrogen antagonists |
Secondary prevention of breast cancer |
|
Aromatase inhibitors |
|
|
Vaccines |
e.g. Diphtheria, pertussis, mumps, measles, rubella, influenza, etc. |
Pharmacokinetics


Liver drug metabolism occurs in two stages:
 Phase I is the modification of a drug, by oxidation, reduction or hydrolysis. Of these, oxidation is the most frequent route and is largely undertaken by a family of isoenzymes known as the cytochrome P450 system (see p. 902). Inhibition or induction of cytochrome P450 isoenzymes are major causes of drug interactions (Table 17.5).

|
Inducers |
Carbamazepine |
|
Hyperforina |
|
|
Nifedipine |
|
|
Non-nucleoside reverse transcriptase inhibitors (NNRTIs) |
|
|
Omeprazole |
|
|
Phenobarbital |
|
|
Phenytoin |
|
|
Rifampicin |
|
|
Ritonavir (see p. 180) |
|
|
Inhibitors |
Allopurinol |
|
Amiodarone |
|
|
Cimetidine |
|
|
Erythromycin, clarithromycin |
|
|
Fluoxetine, paroxetine |
|
|
Grapefruit juice (contains flavonoids) |
|
|
Imidazoles |
|
|
Quinolones |
|
|
Saquinavir |
|
|
Sulphonamides |
a Hyperforin is one of the ingredients of the herbal product known as St John’s wort used by herbalists to treat depression. Although it is marketed as a licensed medicine, it is a reminder that drug interactions can occur with alternative, as well as conventional, medicines.
Genetic causes of altered pharmacokinetics
Variability in the genes that encode drug-metabolizing enzymes (Table 17.6) is a major determinant of the inter-individual differences in the therapeutic and adverse responses to drug treatment. The most common involve polymorphisms of the cytochrome P450 family of enzymes, CYP. The first to be discovered was the polymorphism in the hydroxylation of the antihypertensive agent debrisoquin (CYP2D6). Defective catabolism was shown to be a monogenetically inherited trait, involving 5–10% of Caucasian populations, and leading to an exaggerated hypotensive response.
Table 17.6 Some genetic polymorphisms involving drug metabolism
| Enzyme | Drug |
|---|---|
|
P450 |
|
|
Cytochrome CYP1A2 |
Amitriptyline |
|
Clozapine |
|
|
Cytochrome CYP3A4 |
Amlodipine |
|
Ciclosporin |
|
|
Nifedipine |
|
|
Sildenafil |
|
|
Simvastatin |
|
|
Protease inhibitors |
|
|
Tacrolimus |
|
|
Cytochrome CYP2C9 |
Warfarin |
|
Glipizide |
|
|
Losartan |
|
|
Phenytoin |
|
|
Cytochrome CYP2D6 |
Beta-blockers |
|
Codeine |
|
|
Risperidone |
|
|
SSRIs |
|
|
Tramadol |
|
|
Venlafaxine |
|
|
Cytochrome CYP2C19 |
Clopidogrela |
|
Cyclophosphamide |
|
|
Diazepam |
|
|
Lansoprazole |
|
|
Omeprazole |
|
|
Plasma pseudocholinesterase |
Succinylcholine |
|
Mivacurium |
|
|
Thiopurine methyltransferase |
Azathioprine |
|
Mercaptopurine |
|
|
UDP-glucuronosyl transferase |
Irinotecan |
|
N-acetyl transferase |
Isoniazid |
CYP, cytochrome; SSRIs, Selective serotonin reuptake inhibitors.
a Clopidogrel is a prodrug and impaired metabolizers have a reduced response.
Individual differences in the activity of thiopurine methyltransferase (TPMT) determine the doses of mercaptopurine and azathioprine that are used. TMPT activity is therefore undertaken routinely in children undergoing treatment for acute lymphatic leukaemia and people with Crohn’s disease (see p. 233).
This may, however, become possible in the future, and would contribute – in part – to the prospect of ‘personalized prescribing’ (see p. 899).
Other causes of altered pharmacokinetics
Rates of hepatic drug clearance can also be influenced by environmental factors including diet, alcohol consumption and concomitant therapy with drugs capable of inducing or inhibiting (Table 17.5) drug metabolism. Hepatic drug clearance also decreases with age. By contrast, renal drug clearance does not show substantial variation between healthy individuals although it declines with age and in people with intrinsic renal disease.
Pharmacodynamics
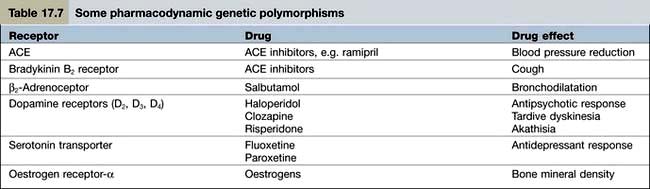
Pharmacodynamics is the study of what the drug does to the body. Pharmacodynamic sources of variability in the intensity of drug action are at least partly due to drug receptor polymorphisms (Table 17.7). At present, the pharmacodynamic tests used in clinical practice to target therapy are largely confined to the expression of:


 |
Monitoring the effects of treatment
Measuring plasma drug concentrations
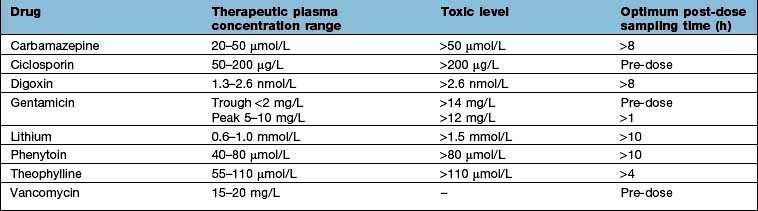
For a few drugs, dosages can be effectively monitored by reference to their plasma concentrations (Table 17.8). This technique is only useful, however, if both the following criteria are fulfilled:


Affordability
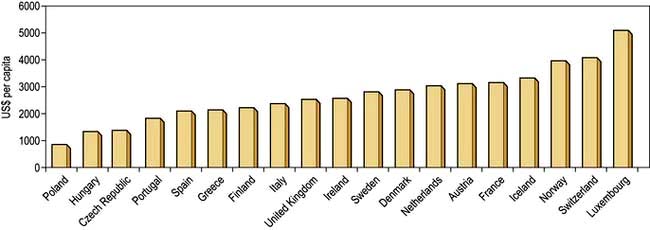
The money available for healthcare varies widely across the world and there are marked differences (Fig. 17.1). All healthcare systems try to provide their populations with the highest standards of care within the resources they have at their disposal. The expenditure of large sums on a few people may deprive many of cost-effective remedies – a phenomenon known as the ‘opportunity cost’. The differences in healthcare expenditure shown in Figure 17.1 can be very largely accounted for by their differences in national wealth as reflected by their gross domestic products.
Adverse drug reactions
Classification
Two types of ADR are recognized.


| Type of reaction and drug | Adverse reaction |
|---|---|
|
Type A (augmented) |
|
|
ACE inhibitors |
Hypotension |
|
ACE antagonists |
Hypotension |
|
Anticoagulants |
Gastrointestinal bleeding |
|
Antipsychotics |
Acute dystonia/dyskinesia |
|
Cytotoxic agents |
Bone marrow dyscrasias |
|
Erythromycin |
Nausea, vomiting |
|
Glucocorticosteroids |
Hypoadrenalism |
|
Insulin |
Hypoglycaemia |
|
Tricyclic antidepressants |
Dry mouth |
|
Type B (bizarre) |
|
|
Benzylpenicillin |
Anaphylaxis |
|
Broad-spectrum penicillins |
Maculopapular rash |
|
Carbamazepine |
Toxic epidermal necrolysis |
|
Carbamazepine |
Hepatotoxicity |
|
Isotretinoin |
Depression |
ACE, angiotensin-converting enzyme; SSRIs, selective serotonin reuptake inhibitors.
a In children and adolescents.
Type B (idiosyncratic) reactions (Table 17.9) have no resemblance to the recognized pharmacological or toxicological effects of the drug. They are:


Diagnosis
 Appropriate time interval. The time interval between the administration of a drug and the suspected adverse reaction should be appropriate. Acute anaphylaxis usually occurs within a few minutes of administration, whilst aplastic anaemia will only become apparent after a few weeks (because of the life-span of erythrocytes). Drug-induced malignancy, however, will take years to develop.


 Results of laboratory tests. In a few instances, the diagnosis of an adverse reaction can be inferred from the plasma concentration (Table 17.8). Occasionally, an ADR produces diagnostic histopathological features. Examples include putative reactions involving the skin and liver.

Management
Specific therapy is sometimes required for ADRs such as bleeding with warfarin (vitamin K), acute dystonias (benztropine) or acute anaphylaxis (see Emergency Box 3.1, p. 69).
FURTHER READING
Pirmohamed M. The applications of pharmacogenetics to prescribing: what is currently known? Clin Med 2009; 9:493–495.
Relling M, Giacomini KM. Pharmacogenetics. In: Brunton LL, Lazo JS, Parker KL, eds. Gilman & Goodman’s The Pharmacological Basis of Therapeutics, 11th edn. New York: McGraw-Hill; 2006:93–115.
Wilkinson GR. Drug metabolism and variability among patients in drug response. N Engl J Med 2005; 352:2211–2221.
Woodcock J, Lesko LJ. Pharmacogenetics – tailoring treatment for outliers. N Engl J Med 2009; 360:811–813.
Evidence-based medicine
Randomized controlled trials
 In a superiority trial the study treatment is usually compared to placebo or to current standard practice.

Assessing randomized controlled trials
Were the treated and control groups comparable?
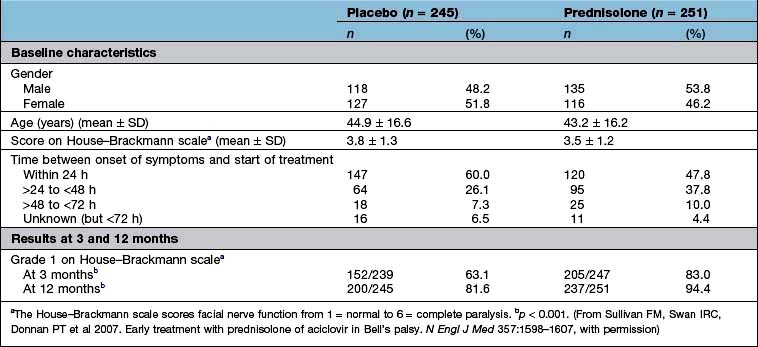
Were they similar in their ‘baseline’ characteristics? Were they, for example, of similar age, severity and duration of illness? If not, are the differences likely to influence the results? Has the statistical analysis (using analysis of covariance, or Cox’s proportional hazards model) (see below) tried to adjust for them? Table 17.10 shows some of the baseline characteristics of a trial comparing prednisolone with placebo in the treatment of Bell’s palsy (idiopathic facial paralysis).
Outcomes
There are two ways to look at the outcomes of an RCT.
 Per protocol analysis: this includes only those who completed the study.
 Intention-to-treat analysis: this includes all patients from the time of randomization.
Ideally, there should be no difference but in reality the results of a per protocol analysis are usually more advantageous to a treatment than an intention-to-treat analysis. The reason is that the intention-to-treat analysis will take account of patients who have withdrawn from the trial because of intolerance of the treatment or adverse drug reactions. It is therefore a much more robust approach. The results of the intention-to-treat analysis, in the trial of prednisolone in Bell’s palsy, are shown in Table 17.10. The trial results indicate, with a high probability, that treatment of Bell’s palsy with prednisolone will increase the chances of a full recovery of facial nerve function.
Analysis of a superiority trial
 Any difference may still be due to chance; and it is often better to await the results of at least two independent studies before adopting a new treatment.

 A statistically significant difference may not, necessarily, be clinically relevant.
 Effect size. The results of the well-designed trial in Table 17.10 show, very convincingly, that the treatment of Bell’s palsy with prednisolone increases the chances of complete recovery of facial nerve function, at 12 months, from 81.6% to 94.4%. This is a far more convincing description of the benefits of treatment than the p value.
 Another expression of the benefit of a treatment such as prednisolone can be derived from the number needed to treat (NNT). This is an estimate of the numbers of patients needed to be treated with a drug to achieve one positive result. In the study shown in Table 17.10, the NNT to enable one patient with Bell’s palsy to regain normal facial nerve function, after prednisolone treatment, is eight.
Controlled observational trials


Historical controlled trials


Case–control studies
A case–control design allows an estimation of the odds ratio (OR), which is the ratio of the probability of an event occurring to the probability of the event not occurring (Box 17.1).
Box 17.1
Estimation of odds ratio
| Cases | Controls | |
|---|---|---|
|
Risk factor present |
a |
c |
|
Risk factor absent |
b |
d |
|
The odds ratio (OR) = (a ÷ b) / (c ÷ d) |
||
Evaluation of new drugs
New drugs are subjected to a vigorous programme of preclinical and clinical testing before they are licensed for general use (Table 17.11) and are also monitored for safety following licensing. Doctors are recommended to fill in yellow cards when they suspect an adverse reaction has taken place.
|
Phase I: Healthy human subjects (usually men) |
Phase II: First assessment in patients
Phase III: Use in wider patient population
Phase IV: Post-marketing surveillance
Statistical analyses
The average
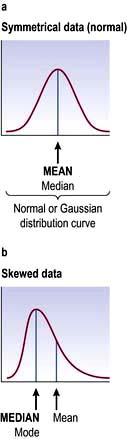
 The mean is the average of a distribution of values that are grouped symmetrically around the central tendency.


In a symmetrically distributed population, the mean, median and mode are the same.
Correlation
 If r = 1, there is complete and direct concordance between the two variables


Expressions of benefit and harm
There are three ways in which the outcomes, in clinical studies, are expressed:
Continuous outcomes. Studies such as that in Table 17.10 may report outcomes using one or more continuous scales. In this study of the effects of prednisolone in the treatment of Bell’s palsy, the House–Brackmann measure of facial nerve function was used as the outcome measure. Conventional tests of statistical significance using Student’s t-test, for example, can be calculated to assess whether the null hypothesis should be rejected.
Current information sources
 The Summary of Product Characteristics (SmPCs) produced by manufacturers but vetted by drug regulatory authorities (for the UK, these are the Medicines and Healthcare Products Regulatory Agency and the European Medicines Agency).


Poisoning
Self-poisoning can kill
A third of patients admitted with an overdose in the UK state that they are unaware of the toxic effects of the substance involved; the majority take whatever drug is easily available at home (Box 17.2). Studies reveal that:
 Acute overdoses often involve more than one agent; alcohol is the most commonly implicated second agent.

Box 17.2
Prevention of self-poisoning
Patients usually take what is readily available at home.
 Only small amounts of drugs should be bought
 Foil-wrapped drugs are less likely to be taken in overdose

 Keep drugs and liquids in their original containers
 Child-resistant drug containers should be used
 Doctors should be careful in prescribing all drugs
 Prescriptions for any susceptible patient (e.g. the depressed) must be monitored carefully
 Household products should be labelled and kept safely away from children
The approach to the patient
History
More than 80% of adults are conscious on arrival at hospital and the diagnosis of self-poisoning can usually be made from the history (Table 17.12). In the unconscious patient a history from friends or relatives is helpful, and the diagnosis can often be inferred from the medicine containers or a ‘suicide note’ brought by the paramedics. In any patient with an altered level of consciousness, acute poisoning must always be considered in the differential diagnosis.
Examination
 Level of consciousness: the Glasgow Coma Scale should be used (see p. 1092)


 Pupil size and reaction to light


If the patient is unconscious, the following should also be checked:


Some of the physical signs that may aid identification of the agents responsible for poisoning are shown in Table 17.13. The cluster of features on presentation may be distinctive and diagnostic. For example, sinus tachycardia, fixed dilated pupils, exaggerated tendon reflexes, extensor plantar responses and coma suggest tricyclic antidepressant poisoning (Table 17.13 and Table 17.14).
| Features | Likely poisons |
|---|---|
|
Constricted pupils (miosis) |
Opioids, organophosphorus insecticides, nerve agents |
|
Dilated pupils (mydriasis) |
Tricyclic antidepressants, amfetamines, cocaine, antimuscarinic drugs |
|
Divergent strabismus |
Tricyclic antidepressants |
|
Nystagmus |
Carbamazepine, phenytoin |
|
Loss of vision |
Methanol, quinine |
|
Papilloedema |
Carbon monoxide, methanol |
|
Convulsions |
Tricyclic antidepressants, theophylline, opioids, mefenamic acid, isoniazid, amfetamines |
|
Dystonic reactions |
Metoclopramide, phenothiazines |
|
Delirium and hallucinations |
Amfetamines, antimuscarinic drugs, cannabis, recovery from tricyclic antidepressant poisoning |
|
Hypertonia and hyperreflexia |
Tricyclic antidepressants, antimuscarinic drugs |
|
Tinnitus and deafness |
Salicylates, quinine |
|
Hyperventilation |
Salicylates, phenoxyacetate herbicides, theophylline |
|
Hyperthermia |
Ecstasy (MDMA), salicylates |
|
Blisters |
Usually occur in comatose patients |
MDMA, 3,4-methylenedioxymetamfetamine.
Table 17.14 Common feature clusters in acute poisoning
| Feature clusters | Poisons |
|---|---|
|
Coma, hypertonia, hyperreflexia, extensor plantar responses, myoclonus, strabismus, mydriasis, sinus tachycardia |
Tricyclic antidepressants; less commonly antihistamines, orphenadrine, thioridazine |
|
Coma, hypotonia, hyporeflexia, plantar responses (flexor or non-elicitable), hypotension |
Barbiturates, benzodiazepine and alcohol combinations, tricyclic antidepressants |
|
Coma, miosis, reduced respiratory rate |
Opioid analgesics |
|
Nausea, vomiting, tinnitus, deafness, sweating, hyperventilation, vasodilatation, tachycardia |
Salicylates |
|
Hyperthermia, tachycardia, delirium, agitation, mydriasis |
Ecstasy (MDMA) or other amfetamine |
|
Miosis, hypersalivation, rhinorrhoea, bronchorrhoea |
Organophosphorus and carbamate insecticides, nerve agents |
Principles of management of poisoning (table 17.15)
Care of the unconscious patient (see also p. 1135)
Ventilatory support
If respiratory depression is present, as determined by pulse oximetry or preferably by arterial blood gas analysis, an oropharyngeal airway should be inserted, and supplementaloxygen should be administered. Pulse oximetry alone will not detect hypercapnia. Loss of the cough or gag reflex is the prime indication for intubation. The gag reflex can be assessed by positioning the patient on one side and making him or her gag using a suction tube. In many severely poisoned patients, the reflexes are depressed sufficiently to allow intubation without the use of sedatives or relaxants. The complications of endotracheal tubes are discussed on page 885 in Chapter 16. If ventilation remains inadequate after intubation, as shown by hypoxaemia and hypercapnia, intermittent positive-pressure ventilation (IPPV) should be instituted.
Cardiovascular support
Hypotension and shock may be caused by:
 A direct cardio-depressant action of the poison (e.g. beta-blockers, calcium channel blockers, tricyclic antidepressants)
 Vasodilation and venous pooling in the lower limbs (e.g. ACE inhibitors, phenothiazines)

Hypotension may be exacerbated by co-existing hypoxia, acidosis and dysrhythmias. In people with marked hypotension, volume expansion with crystalloids should be used, guided by monitoring of central venous pressure (CVP). Urine output (aiming for 35–50 mL/h) is also a useful guide to the adequacy of the circulation. If a patient fails to respond to the above measures, more intensive therapy is required. In such patients, it is helpful to undertake invasive haemodynamic monitoring to confirm that adequate volume replacement has been administered. Volume replacement and the use of inotropes are discussed on page 874. All patients with cardiogenic shock should have ECG monitoring.
Other problems
Rhabdomyolysis can occur from pressure necrosis in drug-induced coma, or it may complicate, e.g. ecstasy (MDMA) abuse in the absence of coma. People with rhabdomyolysis are at risk of developing, firstly, acute kidney injury from myoglobinaemia, particularly if they are hypovolaemic and have an acidosis and, secondly, wrist or ankle drop from the development of a compartment syndrome (see p. 509).
Body ‘packers’ and body ‘stuffers’
Packages can be removed most expeditiously in body stuffers by employing whole bowel irrigation (see p. 913). In the past early surgery was advocated in body packers. However, with the development of improved packaging, a more conservative approach (the use of lactulose or whole bowel irrigation) can now be adopted with which there is a complication rate of <5%. Immediate surgery is indicated if acute intestinal obstruction develops, or when packets can be seen radiologically and there is clinical or analytical evidence to suggest leakage, particularly if the drug involved is cocaine.
Specific management
Antidotes
Specific antidotes are available for only a small number of poisons (Table 17.16).
| Poison | Antidotes |
|---|---|
|
Aluminium (aluminum) |
Desferrioxamine (deferoxamine) |
|
Arsenic |
DMSA, dimercaprol |
|
Benzodiazepines |
Flumazenil |
|
β-adrenoceptor blocking drugs |
Atropine, glucagon |
|
Calcium channel blockers |
Atropine |
|
Carbamate insecticides |
Atropine |
|
Carbon monoxide |
Oxygen |
|
Copper |
D-penicillamine, DMPS |
|
Cyanide |
Oxygen, dicobalt edetate, hydroxocobalamin, sodium nitrite, sodium thiosulphate |
|
Diethylene glycol |
Fomepizole, ethanol, |
|
Digoxin and digitoxin |
Digoxin-specific antibody fragments |
|
Ethylene glycol |
Fomepizole, ethanol |
|
Hydrogen sulphide |
Oxygen |
|
Iron salts |
Desferrioxamine |
|
Lead (inorganic) |
DMSA (succimer), sodium calcium edentate |
|
Methaemoglobinaemia |
Methylthioninium chloride (methylene blue) |
|
Methanol |
Fomepizole, ethanol |
|
Mercury (inorganic) |
Unithiol (DMPS) |
|
Nerve agents |
Atropine, HI-6, obidoxime, pralidoxime |
|
Oleander |
Digoxin-specific antibody fragments |
|
Opioids |
Naloxone |
|
Organophosphorus insecticides |
Atropine, HI-6, obidoxime, pralidoxime |
|
Paracetamol |
Acetylcysteine |
|
Thallium |
Berlin (Prussian) blue |
|
Warfarin and similar anticoagulants |
Phytomenadione (vitamin K) |
DMSA, dimercaptosuccinic acid; DMPS, dimercaptopropanesulphonate.
Antidotes may exert a beneficial effect by:
 Forming an inert complex with the poison (e.g. desferrioxamine (deferoxamine), D-penicillamine, dicobalt edetate, digoxin-specific antibody fragments, dimercaprol, HI-6, hydroxocobalamin, obidoxime, pralidoxime, protamine, Prussian (Berlin) blue, sodium calcium edetate, succimer (DMSA), unithiol (DMPS))
 Accelerating detoxification of the poison (e.g. acetylcysteine, sodium thiosulphate)
 Reducing the rate of conversion of the poison to a more toxic compound (e.g. ethanol, fomepizole)
 Competing with the poison for essential receptor sites (e.g. oxygen, naloxone, phytomenadione)
 Blocking essential receptors through which the toxic effects are mediated (e.g. atropine)
 By-passing the effect of the poison (e.g. oxygen, glucagon).
Reducing poison absorption
Cathartics have no role in the management of the poisoned patient.
FURTHER READING
Barceloux D, McGuigan M, Hartigan-Go K et al. Position paper: cathartics. Clin Toxicol 2004; 42:243–253.
Chyka PA, Seger D, Krenzelok EP et al. Position paper: single-dose activated charcoal. Clin Toxicol 2005; 43:61–87.
Krenzelok EP, McGuigan M, Lheureux P et al. Position paper: ipecac syrup. Clin Toxicol 2004; 42:133–143.
Kulig K, Vale JA. Position paper: gastric lavage. Clin Toxicol 2004; 42:933–943.
Tenenbein M, Lheureux P. Position paper: whole bowel irrigation. Clin Toxicol 2004; 42:843–854.
Increasing poison elimination
Non-toxicological investigations (Table 17.17)
Some routine investigations are of value in the differential diagnosis of coma or the detection of poison-induced hypokalaemia, hyperkalaemia, hypoglycaemia, hyperglycaemia, hepatic or renal failure or acid–base disturbances (Table 17.18). Measurement of carboxyhaemoglobin, methaemoglobin and cholinesterase activities are of assistance in the diagnosis and management of cases of poisoning due to carbon monoxide, methaemoglobin-inducing agents such as nitrites and organophosphorus insecticides, respectively.
Table 17.18 Some poisons inducing metabolic acidosis
|
Calcium channel blockers |
Iron |
|
Carbon monoxide |
Metformin |
|
Cocaine |
Methanol |
|
Cyanide |
Paracetamol |
|
Diethylene glycol |
Topiramate |
|
Ethanol |
Tricyclic antidepressants |
|
Ethylene glycol |
|
Routine radiology is of little diagnostic value. It can confirm ingestion of metallic objects (e.g. coins, button batteries) or injection of globules of metallic mercury. Rarely, hydrocarbon solvents (e.g. carbon tetrachloride) may be seen as a slightly opaque layer floating on the top of the gastric contents with the patient upright, or outlining the small bowel. Some enteric-coated or sustained-release drug formulations may be seen on plain abdominal radiographs, but, with the exception of iron salts, ordinary formulations are seldom seen. Ingested packets of illicit substances can sometimes been seen on CT (see p. 912). Radiology can confirm complications of poisoning, e.g. aspiration pneumonia, non-cardiogenic pulmonary oedema (salicylates), acute respiratory distress syndrome (ARDS).
Specific poisons: drugs
Anticonvulsants
Clinical features
The clinical features of poisoning with anticonvulsant drugs are summarized in Table 17.19.
Table 17.19 Clinical features of poisoning with anticonvulsant drugs
| Anticonvulsant drug | Clinical features of poisoning |
|---|---|
|
Carbamazepine |
Dry mouth, coma, convulsions, ataxia, incoordination, hallucinations (particularly in the recovery phase) |
|
Ocular: nystagmus dilated pupils (common), divergent strabismus, complete external ophthalmoplegia (rare) |
|
|
Phenytoin |
Nausea, vomiting, headache, tremor, cerebellar ataxia, nystagmus, loss of consciousness (rare) |
|
Sodium valproate |
Most frequent: drowsiness, impairment of consciousness, respiratory depression |
|
Uncommon complications: liver damage, hyperammonaemia, metabolic acidosis |
|
|
Very severe poisoning: myoclonic jerks and seizures; cerebral oedema has been reported |
|
|
Gabapentin and pregabalin |
Lethargy, ataxia, slurred speech and gastrointestinal symptoms |
|
Lamotrigine |
Lethargy, coma, ataxia, nystagmus, seizures, cardiac conduction abnormalities |
|
Levetiracetam |
Lethargy, coma, respiratory depression |
|
Tiagabine |
Lethargy, facial grimacing, nystagmus, posturing, agitation, coma, hallucinations, seizures |
|
Topiramate |
Lethargy, ataxia, nystagmus, myoclonus, coma, seizures, non-anion gap metabolic acidosis |
|
Metabolic acidosis can appear within hours of ingestion and persist for days |
Antidepressants: tricyclics and SSRIs
Treatment
FURTHER READING
Bradberry SM, Thanacoody HK, Watt BE et al. Management of the cardiovascular complications of tricyclic antidepressant poisoning: role of sodium bicarbonate. Toxicol Rev 2005; 24:195–204.
Isbister GK, Bowe SJ, Dawson A et al. Relative toxicity of selective serotonin reuptake inhibitors (SSRIs) in overdose. Clin Toxicol 2004; 42:277–285.
Thanacoody HK, Thomas SH. Tricyclic antidepressant poisoning: cardiovascular toxicity. Toxicol Rev 2005; 24:205–214.
Antidiabetic drugs
Antimalarials
Treatment
Multiple-dose oral activated charcoal increases quinine and probably chloroquine clearance. Hypokalaemia should be corrected. Sodium bicarbonate 50–100 mmol i.v. is given if the ECG shows intraventricular block but will exacerbate hypokalaemia, which should be corrected first. Mechanical ventilation, the administration of an inotrope and high doses of diazepam (1 mg/kg as a loading dose and 0.25–0.4 mg/kg per hour maintenance) may reduce the mortality in severe chloroquine poisoning. Overdrive pacing may be required if torsades de pointes (p. 710) occurs in quinine poisoning and does not respond to magnesium sulphate infusion. If clinically significant methaemoglobinaemia (generally above 30%) develops in primaquine poisoning, methylthioninium (methylene blue) 1–2 mg/kg body weight should be administered.
Calcium channel blockers
Treatment
Cardiac pacing has a role if there is evidence of AV conduction delay but failure to capture occurs.
Treat hypotension initially with intravenous crystalloid. If significant hypotension persists despite volume replacement, administer glucagon (see p. 409) as it activates myosin kinase independent of calcium. Give i.v. glucagon 10 mg (150 µg/kg) as a slow bolus and repeat. If there is a favourable response in blood pressure, an infusion of 5–10 mg/h can be commenced; if there is no response after the initial boluses, discontinue.
Acidosis impairs L-type channel function (see p. 708) and is corrected by the administration of sodium bicarbonate, which has been shown experimentally to improve myocardial contractility and cardiac output.
Cannabis (marijuana)
Clinical features
Heavy users suffer impairment of memory and attention and poor academic performance. There is an increased risk of anxiety and depression. Regular users are at risk of dependence. Cannabis use results in an overall increase in the relative risk for later schizophrenia and psychotic episodes (see p. 1185). Cannabis smoke is probably carcinogenic.
Digoxin
Toxicity occurring during chronic administration is common, though acute poisoning is infrequent.
Paracetamol (acetaminophen)
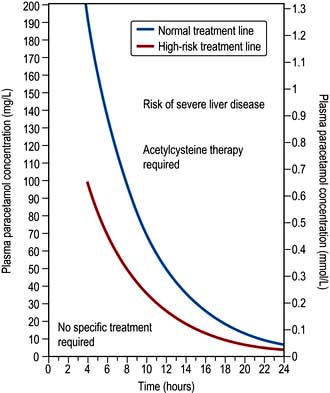
The severity of paracetamol poisoning is dose related. There is, however, some variation in individual susceptibility to paracetamol-induced hepatotoxicity. People with pre-existing liver disease, those suffering from acute or chronic starvation (patients not eating for a few days for example due to a recent febrile illness or dental pain), those suffering from anorexia nervosa and other eating disorders, those receiving enzyme-inducing drugs, and those with HIV infection should be considered to be at greater risk and given treatment at plasma paracetamol concentrations lower than those normally used for interpretation (Fig. 17.2).
Treatment
The treatment protocol is dependent on the time of presentation and this is summarized in Table 17.20. Acetylcysteine has emerged as an effective protective agent provided that it is administered within 8–10 hours of ingestion of the overdose. It acts by replenishing cellular glutathione stores, though it may also repair oxidation damage caused by NAPQI. The treatment regimen is shown in Table 17.21. If a staggered overdose has been taken (multiple ingestions over several hours), acetylcysteine should be given when the paracetamol dose exceeds 150 mg/kg body weight in any one 24-hour period or 75 mg/kg body weight in those at high risk (see above).


8–15 h after ingestion
 Urgent action is required because the efficacy of treatment declines progressively from 8 h after overdose. If >150 mg/kg paracetamol has been ingested, start treatment with acetylcysteine immediately

 Assess whether the patient is at risk of liver damage
 The need for treatment is determined by using Fig. 17.2
 In patients already receiving acetylcysteine, only discontinue if the plasma paracetamol concentration is below the relevant treatment line (Fig. 17.2) and there is no abnormality of the INR, plasma creatinine or ALT activity and the patient is asymptomatic. Do not discontinue the infusion if there is any doubt as to the timing of the overdose


15–24 h after ingestion
 Urgent action is required because the efficacy of treatment is limited more than 15 h after overdose. Start treatment with acetylcysteine immediately if >150 mg/kg paracetamol has been ingested

 Assess whether the patient is at risk of liver damage
 Give treatment if needed (Fig. 17.2). The prognostic accuracy of the ‘200 mg/L line’ after 15 h is uncertain but a plasma paracetamol concentration above the extended treatment line should be regarded as carrying serious risk of severe liver damage

Table 17.21 Regimen for acetylcysteine
If liver or renal failure ensues, this should be treated conventionally though there is evidence that a continuing infusion of acetylcysteine (continue 16-h infusion until recovery) will improve the morbidity and mortality. Liver transplantation has been performed successfully in patients who have paracetamol-induced fulminant hepatic failure (see p. 316).
Salicylates
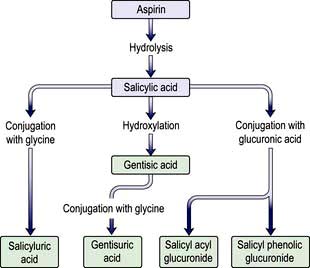
Aspirin is metabolized to salicylic acid (salicylate) by esterases present in many tissues, especially the liver, and subsequently to salicyluric acid and salicyl phenolic glucuronide (Fig. 17.3); these two pathways become saturated with the consequence that the renal excretion of salicylic acid increases after overdose; this excretion pathway is extremely sensitive to changes in urinary pH.
Treatment
Fluid and electrolyte replacement is required and special attention should be paid to potassium supplementation. Severe metabolic acidosis requires at least partial correction with the administration of sodium bicarbonate intravenously. Mild cases of salicylate poisoning are managed with parenteral fluid and electrolyte replacement only. Patients whose plasma salicylate concentrations are in excess of 500 mg/L (3.62 mmol/L) should receive urine alkalinization (see p. 913). Haemodialysis is the treatment of choice for severely poisoned patients (plasma salicylate concentration >700 mg/L; >5.07 mmol/L), particularly those with coma and metabolic acidosis.
Specific poisons: chemicals
Carbamate insecticides
Carbamate insecticides inhibit acetylcholinesterase, as do organophosphorus insecticides, but the duration of this inhibition is comparatively short-lived in comparison since the carbamate–enzyme complex tends to dissociate spontaneously. The clinical features and treatment are similar except that an oxime such as pralidoxime is not usually required because the enzyme complex dissociates spontaneously; recovery invariably occurs within 24 hours (see p. 923).
Ethanol
Ethanol is commonly ingested in beverages and deliberately with other substances in overdose. It is also present in many cosmetic and antiseptic preparations. Following absorption, ethanol is oxidized to acetaldehyde and then to acetate. Ethanol is a CNS depressant and the features of ethanol intoxication are generally related to blood concentrations (Table 17.22).
| Blood (ethanol) | Clinical features | |
|---|---|---|
| mg/L | mmol/L | |
|
500–1500 |
11.0–32.5 |
|
1500–3000
32.5–65.0
3000–5000
65.0–108.5
>5000
>108.5
Ethylene and diethylene glycol
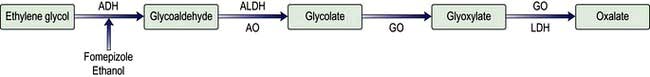
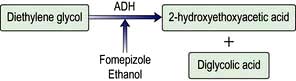
Ethylene and diethylene glycol are found in a variety of common household products including antifreeze, windshield washer fluid, brake fluid and lubricants. The features observed are due to metabolites predominantly, not the parent chemical. Ethylene glycol (Fig. 17.4) is metabolized to glycolate, the cause of the acidosis. A small proportion of glyoxylate is metabolized to oxalate. Calcium ions chelate oxalate to form insoluble calcium oxalate, which is responsible for renal toxicity. Diethylene glycol is metabolized to 2-hydroxyethoxyacetate (Fig. 17.5), which is the cause of metabolic acidosis, and diglycolic acid (the cause of renal failure).
Lead


Methanol
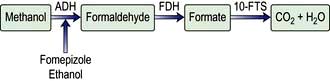
Methanol is used widely as a solvent and is found in antifreeze solutions. Methanol is metabolized to formaldehyde and formate (Fig. 17.6). The concentration of formate increases greatly and is accompanied by accumulation of hydrogen ions causing metabolic acidosis.
Specific poisons: marine animals
Specific poisons: venomous animals
Insect stings and bites
Insect stings from wasps and bees, and bites from ants, produce pain and swelling at the puncture site. Following the sting or bite, patients should be observed for 2 hours for any signs of evolving urticaria, pruritus, bronchospasm or oropharyngeal oedema. The onset of anaphylaxis requires urgent treatment (see p. 69).
Venomous snakes
Approximately 15% of the 3000 species of snake found worldwide are considered to be dangerous to humans. Snake bite is common in some tropical countries (Table 17.23).
|
Sri Lanka |
6 bites per 100 000 population and 900 deaths per year |
|
Nigeria |
500 bites per 100 000 population with a 12% mortality |
|
Myanmar |
15 deaths per 100 000 population |
|
USA |
45 000 bites per year (in a population of 301 million), 8000 by venomous species, with 6 deaths annually |
|
UK |
Approximately 100 people admitted to hospital annually (population 60 million) but only one death since 1970 |
|
Australia |
2 or 3 deaths annually (population 20 million) |
 Viperidae (with two subgroups: Viperinae: European adders and Russell’s vipers; and Crotalinae: American rattlesnakes, moccasins, lance-headed vipers and Asian pit vipers)
 Elapidae (cobras, kraits, mambas, coral snakes, Australian venomous snakes)

In addition, some members of the family Colubridae are mildly venomous (mongoose snake).
Clinical features
Viperidae (Viperinae and Crotalinae)
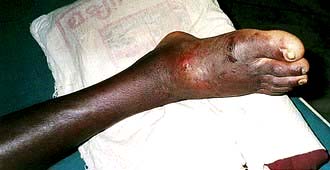
Russell’s viper causes most of the snake-bite mortality in India, Pakistan and Myanmar. There is local swelling at the site of the bite (Fig. 17.7) which may become massive. Local tissue necrosis may occur. Evidence of systemic involvement (envenomation) occurs within 30 minutes, including vomiting, evidence of shock and hypotension. Haemorrhage due to incoagulable blood can be fatal.
Specific poisons: plants
Digitalis purpurea, Nerium oleander, Thevetia peruviana
Ingestion of Digitalis purpurea, or the common (Nerium oleander) or yellow (Thevetia peruviana) oleander can produce a syndrome similar to digoxin poisoning (see p. 917). A randomized controlled trial has shown that digoxin-specific antibody fragments rapidly and safely reverse yellow oleander-induced arrhythmias, restore sinus rhythm, and rapidly reverse bradycardia and hyperkalaemia. The administration of multiple doses of activated charcoal is used, but the effect on survival is debated.
Specific poisons: mushrooms
[/level-membership-for-internal-medicine-category][not-level-membership-for-internal-medicine-category]
Chapter 17 Drug therapy and poisoning
Drug therapy
The patient
Immunization against serious microbial infections (e.g. influenza vaccination)
Oral contraceptives in sexually active women wishing to avoid pregnancy.
Co-morbidity may also significantly alter the way in which conditions are treated particularly in the elderly. Some examples are shown in Table 17.1.
Table 17.1 Examples of drugs to be avoided in people with co-morbidity
| Co-morbidity | Avoid | Effect |
|---|---|---|
|
Parkinson’s disease |
Neuroleptics |
Exacerbates Parkinsonian symptoms (including tremor) |
|
Hypertension |
Non-steroidal anti-inflammatory drugs |
Sodium retention |
|
Asthma |
Beta-blockers, adenosine |
Bronchospasm |
|
Respiratory failure |
Morphine, diamorphine |
Respiratory depression |
|
Renovascular disease |
ACE inhibitors/antagonists |
Reduction in glomerular filtration |
|
Chronic heart failure |
Trastuzumab |
Worsening of heart failure |
|
Chronic infections (e.g. tuberculosis, hepatitis C, histoplasmosis |
Cytokine modulators (e.g. etanercept) |
Increased risk of exacerbation |
Prescribing in neonates, infants, children and adolescents
There are other difficulties in prescribing for children:
Many treatments have never been subject to formal trials in either children or adolescents and their benefits and risks have not, therefore, been appropriately assessed in these age groups. Efforts are being made, internationally, to redress this.
Precise oral dosing is often impossible in babies who spit out unpleasant-tasting products!
Prescribing for the elderly
The use of drugs in the elderly is often a problem:
Rates of hepatic drug metabolism and renal excretion decline with age. Extrapolation of drug dosages, from those appropriate in younger adults, may therefore lead to toxic plasma levels.
Examples of common problems encountered in the use of drugs amongst older people are shown in Table 17.2.
|
|
Drug use in pregnancy
Clinicians should be extremely cautious about prescribing drugs to pregnant women, and only essential treatments should be given. When a known teratogen is needed during pregnancy (e.g. an anticonvulsant drug or lithium), the potential adverse effects should be discussed with the parents, preferably before conception. If parents wish to go ahead with the pregnancy, they should be offered an appropriate ultrasound scan to assess whether there is any fetal damage. Some known human teratogens are shown in Table 17.3.
| Drug | Effect |
|---|---|
|
ACE inhibitors/antagonists |
Oligohydramnios |
|
Retinoids, e.g. acitretin |
Multiple abnormalities |
|
Carbimazole |
Neonatal hypothyroidism |
|
|
Abnormalities of bone growth |
|
Antiepileptics |
|
|
Carbamazepine |
Cleft palate |
|
Lamotrigine |
|
|
Phenytoin |
|
|
Valproate |
Neural tube defects |
|
NSAIDs |
Delayed closure of the ductus arteriosus |
|
Cytotoxic drugs |
Most are presumed teratogens |
|
Lithium |
Ebstein’s anomaly |
|
Misoprostol |
Moebius’s syndrome |
|
Thalidomide (and possibly lenalidomide) |
Phocomelia |
Note: All drugs should be avoided in pregnancy unless benefit clearly outweighs the risk.
The drug
Selecting the right drug involves three elements:
The drug’s clinical efficacy for the proposed use
The most common approach to assessing a drug’s efficacy is the randomized controlled trial (RCT), although other approaches (see p. 907) can be informative. The demonstration of absolute efficacy (against placebo) may, itself, be insufficient. Where there is more than one treatment for the same indication these should be compared with one another, taking account of the magnitude of their benefits, their individual adverse reaction profiles, and their costs.
The dose
Fixed dosage regimens
Drugs suitable (in adults) for prescribing at the same ‘fixed’ dose, for all patients, share common features. Efficacy is optimal in virtually all patients; and the risks of dose-related (type A) adverse reactions (see p. 904) are normally low. These drugs have a high ‘therapeutic ratio’ (i.e. the ratio between toxic and therapeutic doses). Examples of drugs prescribed at a fixed dose are shown in Table 17.4.
| Drug | Indication |
|---|---|
|
Aspirin |
Secondary prevention of myocardial infarction |
|
Clopidogrel |
|
|
Bendroflumethiazide |
Hypertension |
|
Broad spectrum penicillins |
Lower urinary tract infection |
|
Cephalosporins |
|
|
Macrolides |
Upper and lower respiratory tract infection |
|
Levonorgestrel |
Emergency contraception |
|
Ulipristal |
|
|
Oestrogen antagonists |
Secondary prevention of breast cancer |
|
Aromatase inhibitors |
|
|
Vaccines |
e.g. Diphtheria, pertussis, mumps, measles, rubella, influenza, etc. |
Pharmacokinetics
Liver drug metabolism occurs in two stages:
Phase I is the modification of a drug, by oxidation, reduction or hydrolysis. Of these, oxidation is the most frequent route and is largely undertaken by a family of isoenzymes known as the cytochrome P450 system (see p. 902). Inhibition or induction of cytochrome P450 isoenzymes are major causes of drug interactions (Table 17.5).
|
Inducers |
Carbamazepine |
|
Hyperforina |
|
|
Nifedipine |
|
|
Non-nucleoside reverse transcriptase inhibitors (NNRTIs) |
|
|
Omeprazole |
|
|
Phenobarbital |
|
|
Phenytoin |
|
|
Rifampicin |
|
|
Ritonavir (see p. 180) |
|
|
Inhibitors |
Allopurinol |
|
Amiodarone |
|
|
Cimetidine |
|
|
Erythromycin, clarithromycin |
|
|
Fluoxetine, paroxetine |
|
|
Grapefruit juice (contains flavonoids) |
|
|
Imidazoles |
|
|
Quinolones |
|
|
Saquinavir |
|
|
Sulphonamides |
a Hyperforin is one of the ingredients of the herbal product known as St John’s wort used by herbalists to treat depression. Although it is marketed as a licensed medicine, it is a reminder that drug interactions can occur with alternative, as well as conventional, medicines.
Genetic causes of altered pharmacokinetics
Variability in the genes that encode drug-metabolizing enzymes (Table 17.6) is a major determinant of the inter-individual differences in the therapeutic and adverse responses to drug treatment. The most common involve polymorphisms of the cytochrome P450 family of enzymes, CYP. The first to be discovered was the polymorphism in the hydroxylation of the antihypertensive agent debrisoquin (CYP2D6). Defective catabolism was shown to be a monogenetically inherited trait, involving 5–10% of Caucasian populations, and leading to an exaggerated hypotensive response.
Table 17.6 Some genetic polymorphisms involving drug metabolism
| Enzyme | Drug |
|---|---|
|
P450 |
|
|
Cytochrome CYP1A2 |
Amitriptyline |
|
Clozapine |
|
|
Cytochrome CYP3A4 |
Amlodipine |
|
Ciclosporin |
|
|
Nifedipine |
|
|
Sildenafil |
|
|
Simvastatin |
|
|
Protease inhibitors |
|
|
Tacrolimus |
|
|
Cytochrome CYP2C9 |
Warfarin |
|
Glipizide |
|
|
Losartan |
|
|
Phenytoin |
|
|
Cytochrome CYP2D6 |
Beta-blockers |
|
Codeine |
|
|
Risperidone |
|
|
SSRIs |
|
|
Tramadol |
|
|
Venlafaxine |
|
|
Cytochrome CYP2C19 |
Clopidogrela |
|
Cyclophosphamide |
|
|
Diazepam |
|
|
Lansoprazole |
|
|
Omeprazole |
|
|
Plasma pseudocholinesterase |
Succinylcholine |
|
Mivacurium |
|
|
Thiopurine methyltransferase |
Azathioprine |
|
Mercaptopurine |
|
|
UDP-glucuronosyl transferase |
Irinotecan |
|
N-acetyl transferase |
Isoniazid |
CYP, cytochrome; SSRIs, Selective serotonin reuptake inhibitors.
a Clopidogrel is a prodrug and impaired metabolizers have a reduced response.
Individual differences in the activity of thiopurine methyltransferase (TPMT) determine the doses of mercaptopurine and azathioprine that are used. TMPT activity is therefore undertaken routinely in children undergoing treatment for acute lymphatic leukaemia and people with Crohn’s disease (see p. 233).
This may, however, become possible in the future, and would contribute – in part – to the prospect of ‘personalized prescribing’ (see p. 899).
Other causes of altered pharmacokinetics
Rates of hepatic drug clearance can also be influenced by environmental factors including diet, alcohol consumption and concomitant therapy with drugs capable of inducing or inhibiting (Table 17.5) drug metabolism. Hepatic drug clearance also decreases with age. By contrast, renal drug clearance does not show substantial variation between healthy individuals although it declines with age and in people with intrinsic renal disease.
Pharmacodynamics
Pharmacodynamics is the study of what the drug does to the body. Pharmacodynamic sources of variability in the intensity of drug action are at least partly due to drug receptor polymorphisms (Table 17.7). At present, the pharmacodynamic tests used in clinical practice to target therapy are largely confined to the expression of:
|
|
Monitoring the effects of treatment
Measuring plasma drug concentrations
For a few drugs, dosages can be effectively monitored by reference to their plasma concentrations (Table 17.8). This technique is only useful, however, if both the following criteria are fulfilled:
Affordability
The money available for healthcare varies widely across the world and there are marked differences (Fig. 17.1). All healthcare systems try to provide their populations with the highest standards of care within the resources they have at their disposal. The expenditure of large sums on a few people may deprive many of cost-effective remedies – a phenomenon known as the ‘opportunity cost’. The differences in healthcare expenditure shown in Figure 17.1 can be very largely accounted for by their differences in national wealth as reflected by their gross domestic products.
Adverse drug reactions
Classification
Two types of ADR are recognized.
| Type of reaction and drug | Adverse reaction |
|---|---|
|
Type A (augmented) |
|
|
ACE inhibitors |
Hypotension |
|
ACE antagonists |
Hypotension |
|
Anticoagulants |
Gastrointestinal bleeding |
|
Antipsychotics |
Acute dystonia/dyskinesia |
|
Cytotoxic agents |
Bone marrow dyscrasias |
|
Erythromycin |
Nausea, vomiting |
|
Glucocorticosteroids |
Hypoadrenalism |
|
Insulin |
Hypoglycaemia |
|
Tricyclic antidepressants |
Dry mouth |
|
Type B (bizarre) |
|
|
Benzylpenicillin |
Anaphylaxis |
|
Broad-spectrum penicillins |
Maculopapular rash |
|
Carbamazepine |
Toxic epidermal necrolysis |
|
Carbamazepine |
Hepatotoxicity |
|
Isotretinoin |
Depression |
ACE, angiotensin-converting enzyme; SSRIs, selective serotonin reuptake inhibitors.
a In children and adolescents.
Type B (idiosyncratic) reactions (Table 17.9) have no resemblance to the recognized pharmacological or toxicological effects of the drug. They are:
Diagnosis
Appropriate time interval. The time interval between the administration of a drug and the suspected adverse reaction should be appropriate. Acute anaphylaxis usually occurs within a few minutes of administration, whilst aplastic anaemia will only become apparent after a few weeks (because of the life-span of erythrocytes). Drug-induced malignancy, however, will take years to develop.
Results of laboratory tests. In a few instances, the diagnosis of an adverse reaction can be inferred from the plasma concentration (Table 17.8). Occasionally, an ADR produces diagnostic histopathological features. Examples include putative reactions involving the skin and liver.
Management
Specific therapy is sometimes required for ADRs such as bleeding with warfarin (vitamin K), acute dystonias (benztropine) or acute anaphylaxis (see Emergency Box 3.1, p. 69).
FURTHER READING
Pirmohamed M. The applications of pharmacogenetics to prescribing: what is currently known? Clin Med 2009; 9:493–495.
Relling M, Giacomini KM. Pharmacogenetics. In: Brunton LL, Lazo JS, Parker KL, eds. Gilman & Goodman’s The Pharmacological Basis of Therapeutics, 11th edn. New York: McGraw-Hill; 2006:93–115.
Wilkinson GR. Drug metabolism and variability among patients in drug response. N Engl J Med 2005; 352:2211–2221.
Woodcock J, Lesko LJ. Pharmacogenetics – tailoring treatment for outliers. N Engl J Med 2009; 360:811–813.
Evidence-based medicine
Randomized controlled trials
In a superiority trial the study treatment is usually compared to placebo or to current standard practice.
Assessing randomized controlled trials
Were the treated and control groups comparable?
Were they similar in their ‘baseline’ characteristics? Were they, for example, of similar age, severity and duration of illness? If not, are the differences likely to influence the results? Has the statistical analysis (using analysis of covariance, or Cox’s proportional hazards model) (see below) tried to adjust for them? Table 17.10 shows some of the baseline characteristics of a trial comparing prednisolone with placebo in the treatment of Bell’s palsy (idiopathic facial paralysis).
Outcomes
There are two ways to look at the outcomes of an RCT.
Per protocol analysis: this includes only those who completed the study.
Intention-to-treat analysis: this includes all patients from the time of randomization.
Ideally, there should be no difference but in reality the results of a per protocol analysis are usually more advantageous to a treatment than an intention-to-treat analysis. The reason is that the intention-to-treat analysis will take account of patients who have withdrawn from the trial because of intolerance of the treatment or adverse drug reactions. It is therefore a much more robust approach. The results of the intention-to-treat analysis, in the trial of prednisolone in Bell’s palsy, are shown in Table 17.10. The trial results indicate, with a high probability, that treatment of Bell’s palsy with prednisolone will increase the chances of a full recovery of facial nerve function.
Analysis of a superiority trial
Any difference may still be due to chance; and it is often better to await the results of at least two independent studies before adopting a new treatment.
A statistically significant difference may not, necessarily, be clinically relevant.
Effect size. The results of the well-designed trial in Table 17.10 show, very convincingly, that the treatment of Bell’s palsy with prednisolone increases the chances of complete recovery of facial nerve function, at 12 months, from 81.6% to 94.4%. This is a far more convincing description of the benefits of treatment than the p value.
Another expression of the benefit of a treatment such as prednisolone can be derived from the number needed to treat (NNT). This is an estimate of the numbers of patients needed to be treated with a drug to achieve one positive result. In the study shown in Table 17.10, the NNT to enable one patient with Bell’s palsy to regain normal facial nerve function, after prednisolone treatment, is eight.
Controlled observational trials
Historical controlled trials
Case–control studies
A case–control design allows an estimation of the odds ratio (OR), which is the ratio of the probability of an event occurring to the probability of the event not occurring (Box 17.1).
Box 17.1
Estimation of odds ratio
| Cases | Controls | |
|---|---|---|
|
Risk factor present |
a |
c |
|
Risk factor absent |
b |
d |
|
The odds ratio (OR) = (a ÷ b) / (c ÷ d) |
||
Evaluation of new drugs
New drugs are subjected to a vigorous programme of preclinical and clinical testing before they are licensed for general use (Table 17.11) and are also monitored for safety following licensing. Doctors are recommended to fill in yellow cards when they suspect an adverse reaction has taken place.
|
Phase I: Healthy human subjects (usually men) |
Phase II: First assessment in patients
Phase III: Use in wider patient population
Phase IV: Post-marketing surveillance
Statistical analyses
The average
The mean is the average of a distribution of values that are grouped symmetrically around the central tendency.
In a symmetrically distributed population, the mean, median and mode are the same.
Correlation
If r = 1, there is complete and direct concordance between the two variables
Expressions of benefit and harm
There are three ways in which the outcomes, in clinical studies, are expressed:
Continuous outcomes. Studies such as that in Table 17.10 may report outcomes using one or more continuous scales. In this study of the effects of prednisolone in the treatment of Bell’s palsy, the House–Brackmann measure of facial nerve function was used as the outcome measure. Conventional tests of statistical significance using Student’s t-test, for example, can be calculated to assess whether the null hypothesis should be rejected.
[/not-level-membership-for-internal-medicine-category]
