[level-membership-for-anesthesiology-category]
Doppler Profiles and Assessment of Diastolic Function
Christopher J. Gallagher and John C. Sciarra
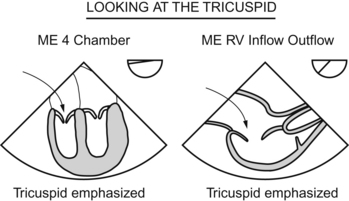
Tricuspid Valve and Right Ventricular Inflow
 The jet area is greater than 10 cm squared
 The jet area-to-right atrial area is greater than 67%
 The vena contracta width (narrowest width of the regurgitant jet) is >6.5 cm squared


Also, if the hepatic vein flow profile shows systolic flow reversal, that also indicates severe tricuspid regurgitation. If you think about it, that makes sense. When the heart contracts, if the tricuspid valve doesn’t work, the blood flows back into the right atrium and just keeps on flowing backward, backward, backward, all the way back into the inferior vena cava and back further into the hepatic vein (which feeds into the inferior vena cava).
Pulmonary Valve and Right Ventricular Outflow
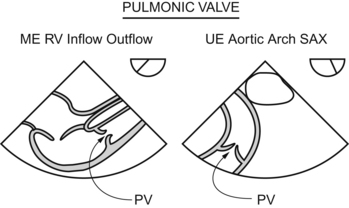
Since the pulmonic valve lies far afield from the echo probe, getting more quantitative than that just ain’t in the works.
Mitral Valve and Left Ventricular Inflow
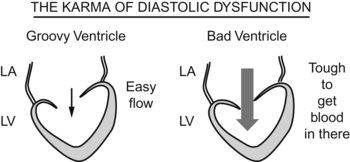
The pump doesn’t work, but the concept of diastolic dysfunction is tough.
The loading of the pump doesn’t work.
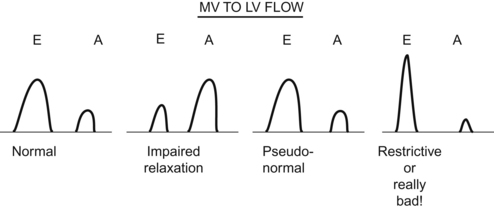
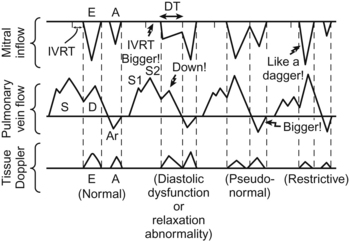
The world would be a nice place if the mitral inflow patterns were a simple
First, I’ll blast through the patterns, then I’ll go back and try to drag you through the reasoning. PLOW THROUGH THIS STUFF SLOWLY, AND LOOK FOR THE EXPLANATION IN A FEW DIFFERENT BOOKS, FOR DIASTOLIC DYSFUNCTION IS A TOUGHIE.
Now, the reasoning behind the patterns. (The first part is easy—the second is a bit sticky.)
The Heart with Impaired Filling
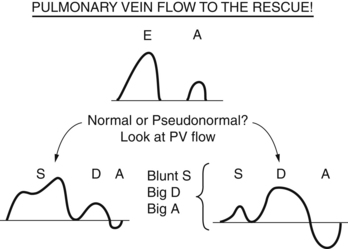
The E-to-A ratio has reversed, as seen in the second pattern in the figure at the top of this page.
The Yet-More-Noncompliant Heart
Right you are! That pattern is called a “pseudonormalization of the E-to-A ratio.”
Every test-taker in the galaxy just asked himself or herself the same question:
Valsalva Maneuver
If you perform a Valsalva maneuver and cut off venous return to the heart, a pseudonormal pattern will go “back one step” to a noncompliant pattern (the easy-to-understand blunted E wave). Why? By cutting off venous return with your Valsalva maneuver, you don’t let the atrium “supercharge” with volume and “overwhelm” the noncompliant ventricle.


Others
There are a bunch more indicators that you can use to know the difference between normal and pseudonormal, but they’re a killer to memorize (your humble author having tried and failed to do just that). If you go over the reasons given above and really understand what’s going on, then you’ll “get” diastolic dysfunction.
The Stiff-as-Hell Heart: No Kidding End-Stage Diastolic Wipeout
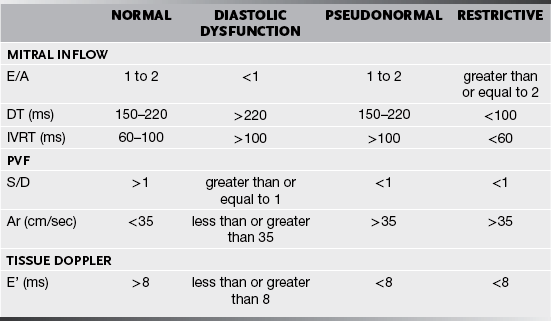
This table is graphic and quite precise, but each drawing has a number associated with it. On a test, you may see the image on a screen, or you may just be given the numbers. So here is a table of the numbers. Note, these are not iron clad. Textbooks argue over absolutes, so you may see different numbers in different texts.
Aortic Valve and Left Ventricular Outflow
AND GETTING THE DEEP TRANSGASTRIC LONG-AXIS VIEW IS HARD AS HELL!
If you ever DO get the damned view, then you can lay your Doppler right across the valve and get a reading. One problem? You would love to get a specific flow at a specific point (which means you want pulsed Doppler) but the flow through the aortic valve is very fast (pulsed Doppler would alias) so you have to go with continuous wave when analyzing the aortic valve. There is range ambiguity then, and if the flow is faster in another spot (say the patient has subaortic stenosis), then you will get the “fastest” signal from the subaortic spot rather than the valve itself.
Note that the alignment isn’t as perfect as the true blue deep transgastric long-axis view.
Nonvalvular Flow Profiles
Any other nonvalvular profiles that might come in handy?
Yes! Anytime you are wondering about a structure, you can always lay a Doppler across it and see what gives. Especially when you wander up into views of the aorta or other great vessels, you might see a circle or tube and wonder, “Well, what the Sam Hill is that?” If a patient has distorted anatomy (lymphomatous nodes squishing this and that), you can get mixed up with “is that the aorta coming around, or an innominate vein, or what?”. Doppler will at least tell you if you have an arterial or a venous wave pattern.
Whip that damned Doppler all over the place, it will tell you all kinds of stuff.
Questions
A Pronounced “eevert”, not “eye-vert”
B The time of relaxation of the LV
C The time between the closing click of the AV and the opening click of the MV
D The time just before the opening of the AV and the closing of the MV
E The time just after the IV is placed and before the RT hooks up the ventilator
2. E/A = 1, PVF S/D = 1.1_______________________________
3. E/A = 1, PVF S/D = 0.9 _______________________________
4. E/A = 2.4, PVF S/D = 0.9_______________________________
5. E/A = 1, IVRT = 99 ms, _______________________________
6. E/A = 1.5, DT = 190 ms, IVRT = 110 ms_________________________
7. PVF S/D = 1.1, PV – Ar = 33 cm/s_______________________________
8. E/A = 2, PVF S/D = 0.9, PV – Ar = 36 cm/s_________________________
Answers
2. This guy is normal. Look at the diagram or the table. If you got this one wrong, go back and draw the wave forms.
3. Here our E/A looks normal, but the PVF is abnormal, so it is pseudo-normal relaxation.
4. The E/A ratio is huge so you hardly need any more information than that—restrictive filling.
5. E/A is normal so this could be a normal patient or pseudonormal. Check the IVRT and see it is in the normal range, so he is normal.
6. The E wave is in the normal range, but the DT and IVRT fall in the pseudonormal range—so pseudonormal it is.
[/level-membership-for-anesthesiology-category][not-level-membership-for-anesthesiology-category]
Doppler Profiles and Assessment of Diastolic Function
Christopher J. Gallagher and John C. Sciarra
Tricuspid Valve and Right Ventricular Inflow
The jet area is greater than 10 cm squared
The jet area-to-right atrial area is greater than 67%
The vena contracta width (narrowest width of the regurgitant jet) is >6.5 cm squared
Also, if the hepatic vein flow profile shows systolic flow reversal, that also indicates severe tricuspid regurgitation. If you think about it, that makes sense. When the heart contracts, if the tricuspid valve doesn’t work, the blood flows back into the right atrium and just keeps on flowing backward, backward, backward, all the way back into the inferior vena cava and back further into the hepatic vein (which feeds into the inferior vena cava).
Pulmonary Valve and Right Ventricular Outflow
Since the pulmonic valve lies far afield from the echo probe, getting more quantitative than that just ain’t in the works.
Mitral Valve and Left Ventricular Inflow
The pump doesn’t work, but the concept of diastolic dysfunction is tough.
The loading of the pump doesn’t work.
The world would be a nice place if the mitral inflow patterns were a simple
First, I’ll blast through the patterns, then I’ll go back and try to drag you through the reasoning. PLOW THROUGH THIS STUFF SLOWLY, AND LOOK FOR THE EXPLANATION IN A FEW DIFFERENT BOOKS, FOR DIASTOLIC DYSFUNCTION IS A TOUGHIE.
Now, the reasoning behind the patterns. (The first part is easy—the second is a bit sticky.)
[/not-level-membership-for-anesthesiology-category]
