1 Distinguishing Systolic versus Diastolic Heart FailureA Practical Approach by Echocardiography
Left Ventricular Dimensions and Thickness
See Appendix for reference values.
Key Points
Limitations
Left Ventricular Systolic Function
Fractional Area Change
Key Points
Left Ventricular Volumes and Ejection Fraction (Table 1-1)
TABLE 1-1 ECHOCARDIOGRAPHIC ASSESSMENT OF LEFT VENTRICULAR SYSTOLIC FUNCTION
| Method | View | Pitfalls |
|---|---|---|
| Two-Dimensional Imaging | ||
| Fractional shortening | PLAX or PSAX | Geometric Assumptions Based on a single cross section Ignores wall motion in nonmeasured segments |
| Ejection fraction | (LVEDV − LVESV) × 100/LVEDV | Dependent on load and heart rate (HR) |
| Modified Simpson’s rule | 4-chamber and 2-chamber | Foreshortening of apical views Poor visualization of anterior wall |
| Area-length method | 4-chamber (LV area)2 × 0.85/LV end-diastolic length | Not appropriate for non-symmetrical LV Assumes cylindrical LV shape |
| Bullet method | Mid-SAX and apical 4- chamber | LV shape assumption |
| Wall motion score index | PLAX, PSAX, apical 4-, 2-, and 3-chamber Average endocardial thickening score of 16 or 17 segments |
Reader and center variability Requires visualization of all segments |
| Exercise ejection fraction | As above | To detect incipient LV systolic dysfunction Usually eyeballed |
| Three-dimensional volumes | Full-volume apical view | Resolution is dependent on 2D image quality |
| Doppler Methods | ||
| LV stroke volume | PLAX 2D and apical 5- or 3-chamber | Circular shape assumption of LV outflow tract (LVOT) Error in LVOT measurement Errors are squared |
| LV dP/dt (mm Hg/s) | MR CW Doppler Σ Δt 1 m/s to 3 m/s, 32/Δt | Load independent Not always feasible |
| MPI | Apical 5-chamber | Somewhat load dependent No geometric assumption |
| Tissue Doppler | Apical views Objective data Less dependent on image quality Less dependent on reader expertise |
Somewhat load dependent Requires parallel angle of insonation Affected by translation, tethering, and respiration |
| 2D speckle tracking | Longitudinal Strain Not affected by Doppler angle |
Requires high frame rate Requires good 2D image resolution Decreased feasibility versus TDI |
| Radial Strain Not affected by Doppler angle |
||
Key Points
Segmental Wall Motion
Key Points
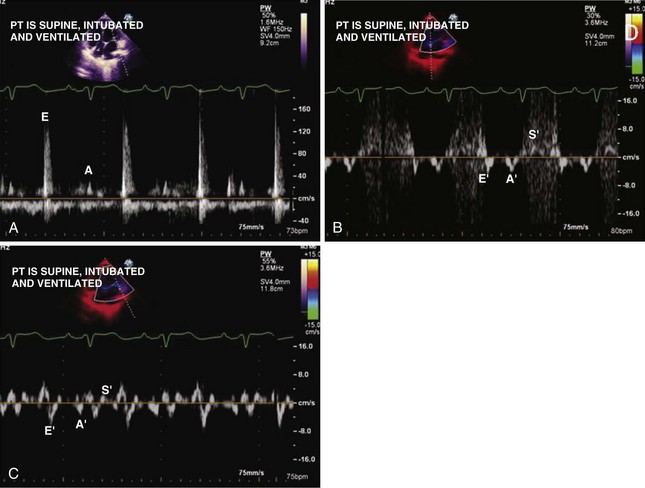
LV Function Assessment by Tissue Doppler Imaging (Figure 1-9)
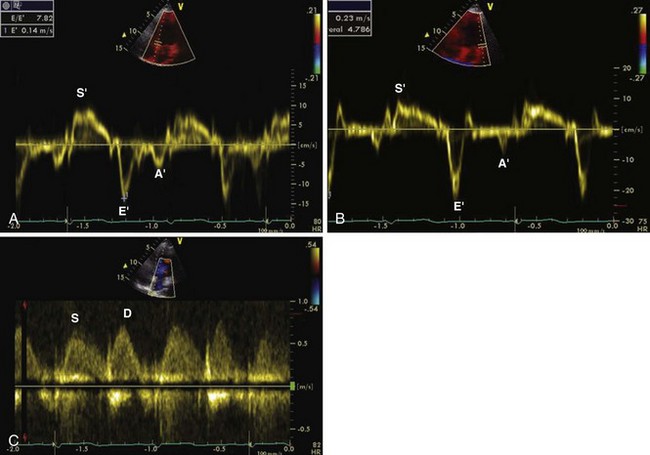
Key Points
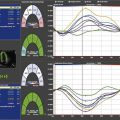
LV Function Assessment by 2D Speckle Tracking (Figure 1-10)
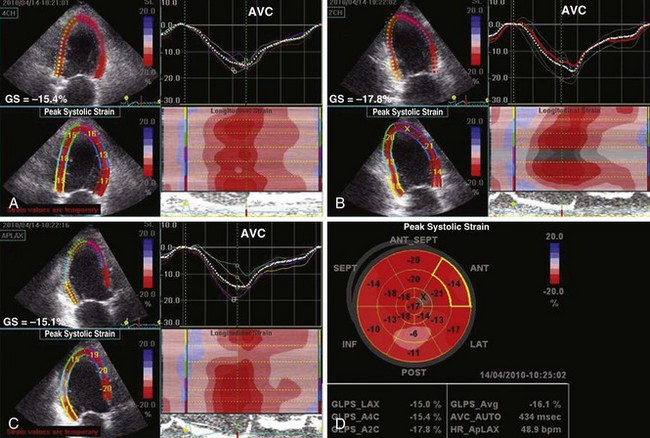
Figure 1-10 Apical 4-chamber (A), 2-chamber (B), and 3-chamber (C) 2D strain maps and segmental strain scores along with bull’s-eye map (D) showing global strain (GS) and segmental strain values in the same patient as in Figure 1-8. Note reduced segmental strain values of −6 to −13% in the basal to midinferior and inferolateral segments consistent with transmural infarction. GS is mildly reduced at −16%. AVC, aortic valve closure.
Key Points
Methods Evaluating Combined Systolic and Diastolic Function
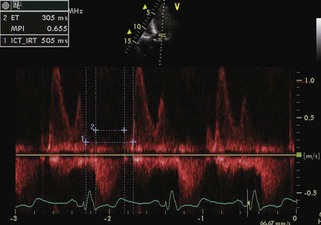
Myocardial Performance Index
Key Points
Left Ventricular Diastolic Function
Mitral Inflow PW Doppler
Key Points
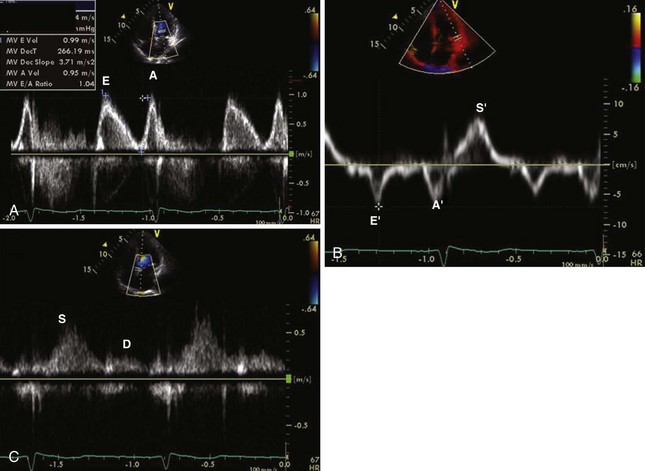
Pulmonary Vein PW Doppler
Key Points
TDI of Mitral Annulus
Key Points
Color M-Mode Velocity Propagation
Assessment of Left Atrium
Assessment of Linear Dimensions
Linear Diameters
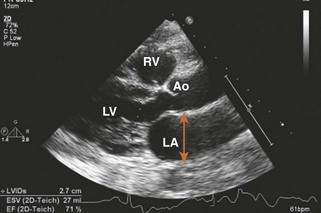
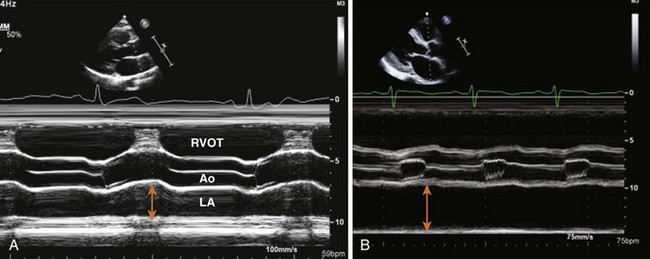
Anteroposterior Diameter
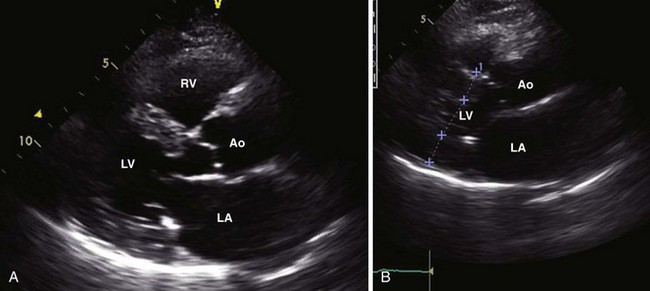
Measured by 2D-guided M-mode echocardiography or 2D obtained in the PLAX view: trailing edge of posterior aortic wall and inner edge of posterior LA wall (Figures 1-22 and 1-23).
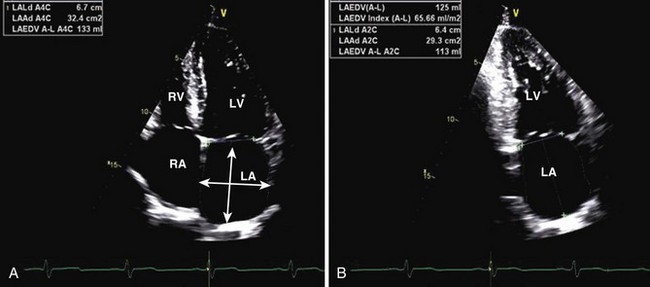
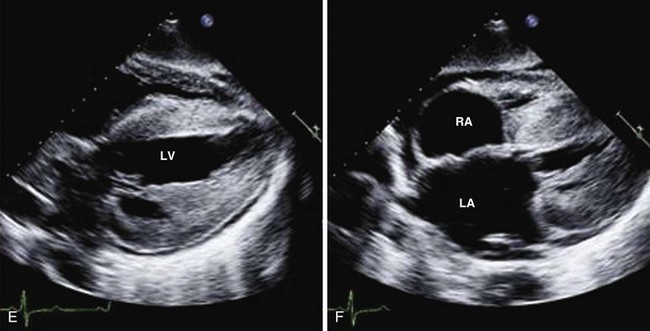
Left Atrial Volume
Ellipsoid Method
Biplane area-length method is calculated using the formula:
where A1 is the LA area on 4-chamber view, A2 is the LA area on apical 2-chamber view, and L is the shorter of the major axes. Length (L) is measured from the back wall to a line across the hinge points of the mitral valve (see Figure 1-24).
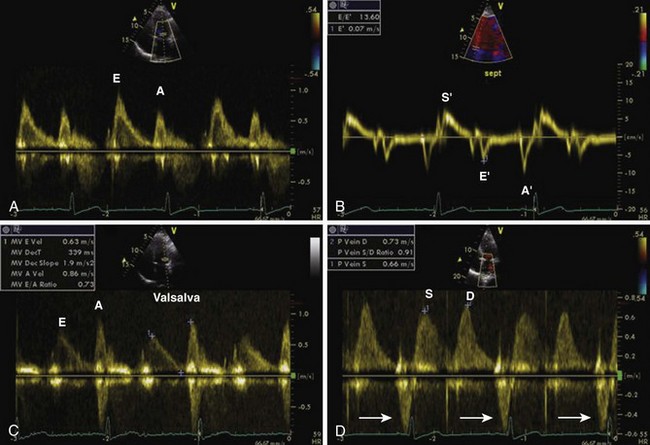
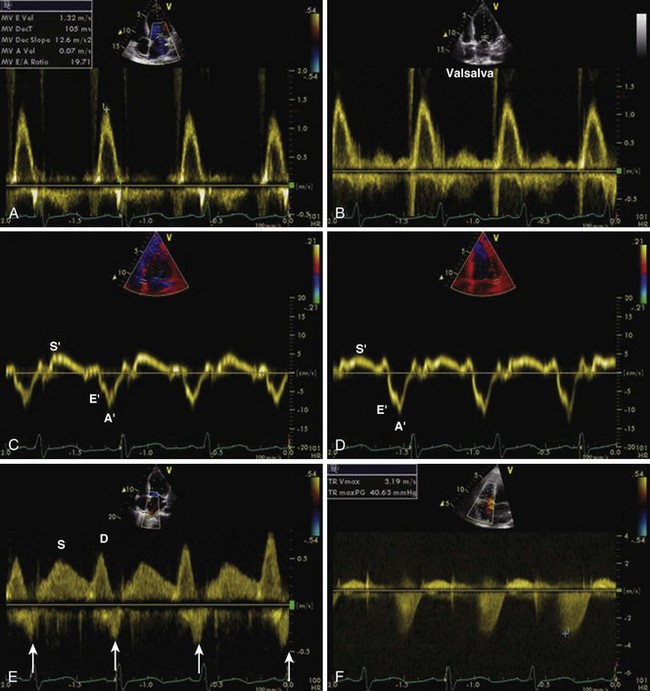
Noninvasive Assessment of Left Atrial and Left Ventricular Filling Pressures
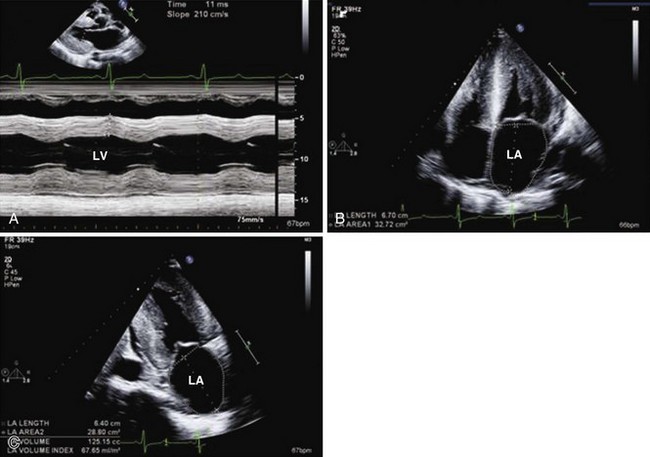
Diagnostic evidence of diastolic LV dysfunction can be obtained invasively (LV end-diastolic pressure [LVEDP] > 16 mm Hg or mean pulmonary capillary wedge pressure > 12 mm Hg) or noninvasively by TDI (E/E′ > 15). Multiple other parameters, including the mitral inflow E/A ratio, its reduction with the Valsalva maneuver, E-wave deceleration time, the pulmonary vein S/D ratio, the pulmonary vein D-wave DT, mitral inflow and pulmonary vein inflow duration, and E/velocity of propagation, can be used for assessing left atrial pressure (Table 1-2).
| Mitral regurgitation | To evaluate LA filling pressure [SBP − 4(MR velocity)2] |
| Tricuspid regurgitation | To evaluate pulmonary artery systolic pressure [4 × (tricuspid insufficiency jet velocity)2 (m/s)] |
| Pulmonary regurgitation | Pulmonary artery diastolic pressure [4 × (pulmonary insufficiency jet velocity)2 (m/s)] plus right atrial pressure |
| Left atrial pressure | Mitral inflow E-wave DT < 160 ms |
| Mitral inflow E/A > 2.0 | |
| Pulmonary vein S < pulmonary vein D | |
| Pulmonary vein adur 30 ms > mitral inflow adur | |
| Mitral inflow E/A > 0.5 with Valsalva maneuver | |
| E/E′ > 15 | |
| E/Vp > 2.0 | |
| Pulmonary vein D wave DT < 160 ms |
adur, atrial wave velocity duration; D, diastolic wave; E, mitral inflow early-filling wave; E/A, mitral inflow early-to-late diastolic velocity ratio; E/E′, ratio of mitral inflow early filling wave to myocardial early diastolic velocity; E/Vp, ratio of mitral inflow early-filling wave to early propagation velocity by color M-mode; S, systolic wave; SBP, systolic blood pressure.
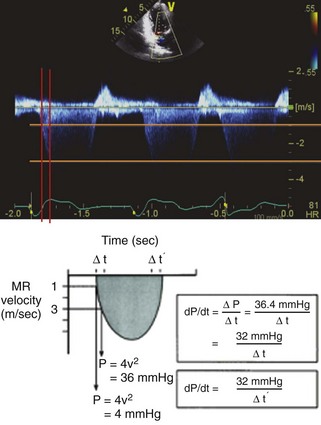
To evaluate dP/dt: Σ Δt from 1 m/s to 3 m/s, 32/Δt
Assessment of Right Ventricle
Right Ventricular Size
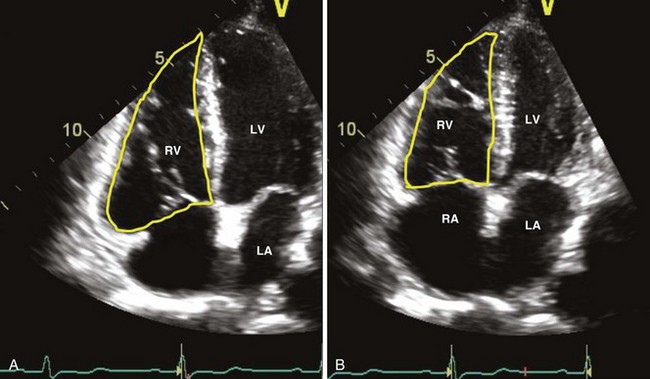
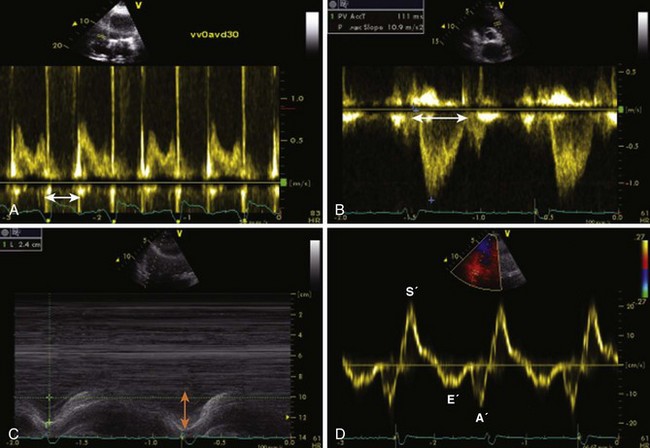
Right Ventricular Systolic Function
Given the complex geometry of the RV and the lack of standard methods for assessing RV volumes, RV systolic function is generally estimated qualitatively in clinical practice. Nevertheless, a number of echocardiographic techniques may be used to assess RV function. These are listed in Table 1-3.
| Measurement | Location | Normal Values |
|---|---|---|
| TAPSE M-mode apical 4-chamber view |
Tricuspid annulus | ≥16 mm |
| Peak tricuspid valve (TV) annular velocity in systole (Sa) TDI apical 4-chamber view |
Systole at lateral and medial TV annulus | ≥10 cm/s |
| Fractional area change (FAC) 2D—apical 4-chamber view |
FAC = (EDA − ESA)/EDA | >35% |
| Isovolumic acceleration (IVA) Tissue Doppler—lateral tricuspid annulus |
IVA = TV peak isovolumic annular velocity/time to peak velocity | 2.2 m/s2 |
| RV dP/dt | Tricuspid regurgitant jet by CW Doppler—time for the TR velocity to increase from 0.5 m/s to 2 m/s ΔP = (4V22 − 4V12) = 15/Δt |
>400 mm Hg/s |
| Myocardial performance index (MPI) PW Doppler RV inflow and outflow |
MPI = (time interval of TV closure − ET)/ET | ≤0.4 |
EDA, end-diastolic area; ESA, end-systolic area.
Assessment of Filling Pressure by Continuous Wave (CW) Doppler Signals (Table 1-4)
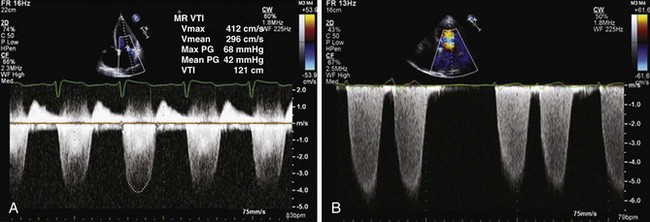
Assessment of Left Atrial Pressure
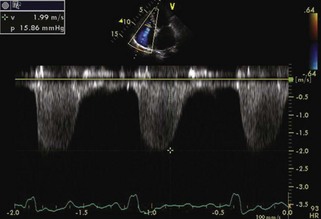
LA systolic pressure can be obtained by subtracting the peak systolic LV-LA gradient, calculated from the peak MR velocity (4V2), from the systolic blood pressure, assuming there is no aortic stenosis or subclavian stenosis (Figure 1-30).
| LA pressure | LV systolic pressure − LV-LA systolic gradient |
| SBP − 4(peak mitral regurgitation jet velocity)2 (m/s) | |
| Peak PA pressure | RV systolic pressure + right atrial pressure |
| [4 × (tricuspid insufficiency jet velocity)2 (m/s)] + RA pressure | |
| End-diastolic PA pressure | PA-RV late diastolic pressure gradient + RV diastolic pressure |
| [4 × (late pulmonary insufficiency jet velocity)2 (m/s)] + RA pressure | |
| Mean PA pressure | PA-RV early diastolic pressure gradient + RV diastolic pressure |
| [4 × (early pulmonary insufficiency jet velocity)2 (m/s)] + RA pressure | |
| LV end-diastolic pressure | Aortic diastolic pressure − end-diastolic aortic-LV pressure gradient |
| Diastolic blood pressure − [4 × (late aortic insufficiency jet velocity)2 (m/s)] |
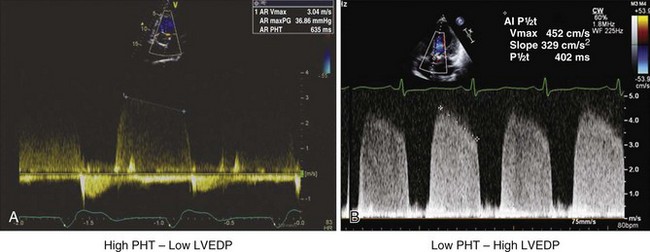
Assessment of Left Ventricular End-Diastolic Pressure
The LV-aortic end-diastolic pressure gradient can be calculated from the end-aortic regurgitation velocity as 4V2. This gradient is then subtracted from the diastolic blood pressure to get the LVEDP (Figure 1-31).
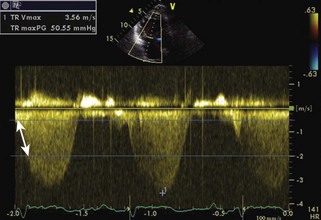
Assessment of Right Ventricular and Right Atrial Pressures
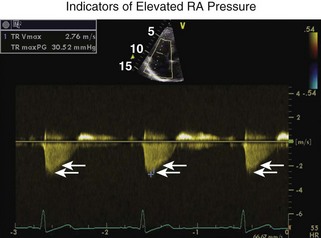
The RV-RA gradient can be obtained from the peak tricuspid regurgitation (TR) velocity (4V2) from the TR signal (Figure 1-32; see also Figures 1-19 and 1-29). Peak RV systolic pressure (peak pulmonary artery pressure [PAP] in the absence of pulmonic valve stenosis) can be estimated by adding right atrial pressure to the RV-RA gradient. RA systolic pressure is estimated from the size and respiratory variability of the inferior vena cava (IVC) (Table 1-5).
| IVC Diameter | Collapsibility Index | Estimated RA Pressure |
|---|---|---|
| ≤2.1 cm (normal) | >50% (normal) | 3 mm Hg (normal) |
| >2.1 cm (dilated) | >50% (normal) | 8 mm Hg (mildly elevated) |
| >2.1 cm | <50% | 15 mm Hg |
| >2.1 cm | None | >15 mm Hg |
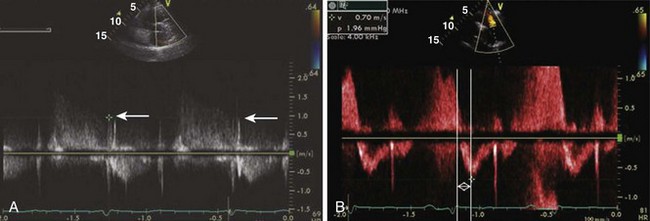
Assessment of Right Ventricular End-Diastolic Pressure
The RV–pulmonary artery (PA) end-diastolic pressure gradient can be calculated from the end pulmonary insufficiency (PI) velocity as 4V2 (Figure 1-33). RA pressure is then added to this gradient to obtain RV end-diastolic pressure.
RA pressure is estimated from the IVC (see Table 1-5; see also Figure 1-19) and TR jet shape (Figure 1-34).
Summary of Echocardiographic Findings
Echocardiographic findings in systolic and diastolic heart failure are summarized in Tables 1-6 and 1-7.
TABLE 1-6 TWO-DIMENSIONAL ECHOCARDIOGRAPHIC FINDINGS IN SYSTOLIC AND DIASTOLIC HEART FAILURE
| Echo Parameter | Systolic Heart Failure | Diastolic Heart Failure |
|---|---|---|
| LV size | Dilated | Normal |
| Wall thickness | Normal or increased | Usually increased |
| LV mass | Significantly increased | Normal to severely increased |
| LVEF | Moderate to severly reduced | Preserved |
| LV trabeculation | Often increased | Normal |
| LV thrombus | May be present | Absent |
| Atrial size | Usually enlarged | Enlarged disproportionate to LV size |
| Right ventricular size | Often enlarged | Normal to mildly enlarged |
| Right ventricular systolic function | Often reduced | Usually normal |
| Inferior vena cava | Normal to dilated | Dilated with reduced respiratory variation |
| Hepatic veins | Variable | Often dilated |
| Pleural effusion | Often present | Often absent |
| Pericardial effusion | Usually absent | Usually absent |
| Atrial fibrillation | May be present | Often present |
TABLE 1-7 DOPPLER ECHOCARDIOGRAPHIC FINDINGS IN SYSTOLIC AND DIASTOLIC HEART FAILURE
| Echo Parameter | Systolic Heart Failure | Diastolic Heart Failure |
|---|---|---|
| Mitral regurgitation | None to severe | None to moderate |
| Diastolic MR | May be present | May be present |
| Often due to first-degree atrioventricular block (AVB) | Often due to elevated LVEDP | |
| MR peak velocity | Often reduced | Normal to elevated |
| MR dP/dt | Reduced | Often normal |
| Tricuspid regurgitation | None to severe | None to moderate |
| Often due to first-degree AVB | Often due to elevated LVEDP | |
| Diastolic TR | May be present | May be present |
| Pulmonary artery pressure | Elevated proportionate to LV systolic dysfunction and/or MR | Elevated disproportionate to LV systolic dysfunction and/or MR |
| Mitral inflow | Grade I–IV diastolic dysfunction | Often grade II–IV diastolic dysfunction |
| Grade often concordant to LV systolic function | Grade often disconcordant to LV systolic function | |
| Color M-mode | Propagation velocity (Vp) variable | Vp usually <45 cm/s and E/Vp > 1.5 |
| Tricuspid inflow | Variable | Often restrictive filling |
| Pulmonary vein (PV) pattern | Grade I–IV | Often grade III–IV |
| May show systolic reversal with severe MR | Diastolic dominant pattern prominent atrial reversal with PV adur > mitral inflow adur | |
| TDI E′ | Often reduced | Often reduced |
| Septal annulus TDI S′ | Markedly reduced | Mildly reduced |
| Mitral annulus | Dilated | Normal to moderately dilated |
| Tricuspid annulus | Dilated | Normal to moderately dilated |
| Tricuspid annulus TDI | S′ reduced | S′ often normal |
| Hepatic veins | Variable | S/D ratio <0.5, prominent atrial and ventricular reversal with inspiration and expiration |
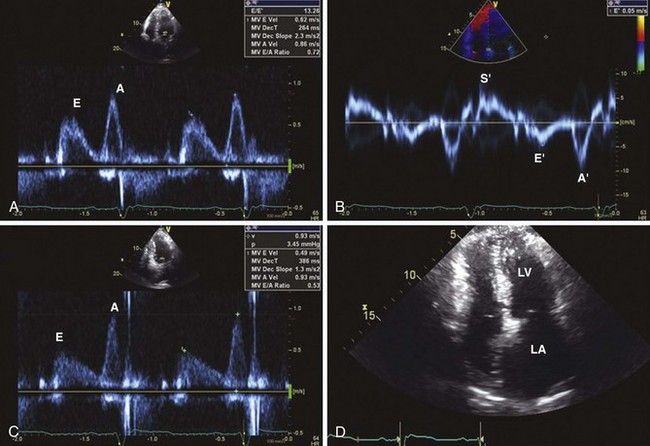
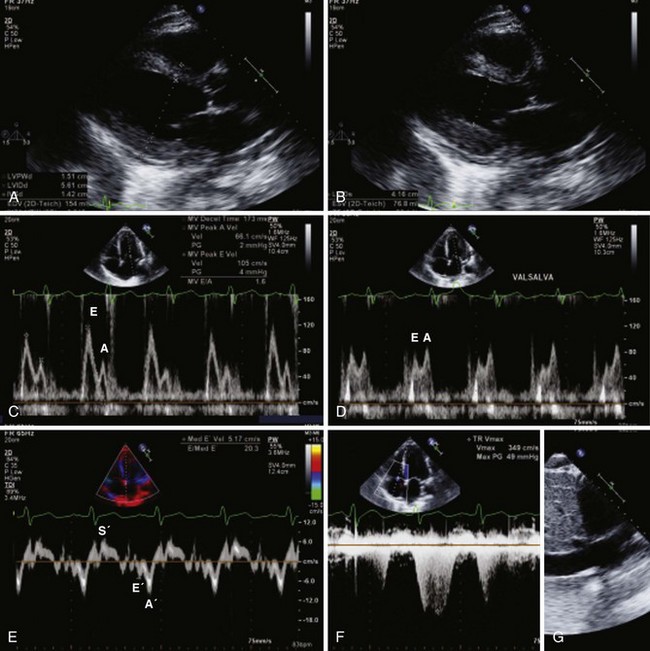
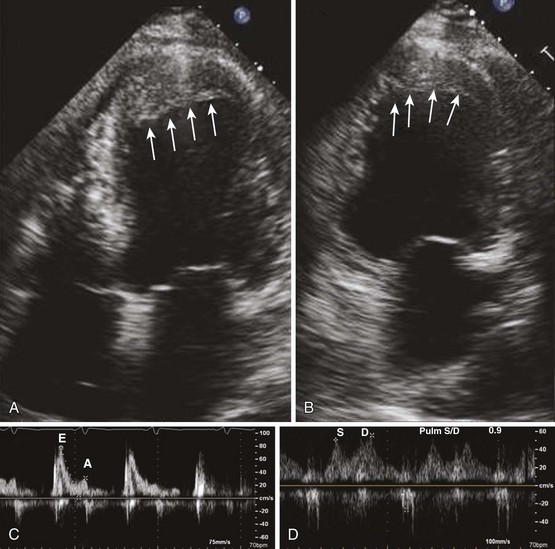
Infiltrative Cardiomyopathy
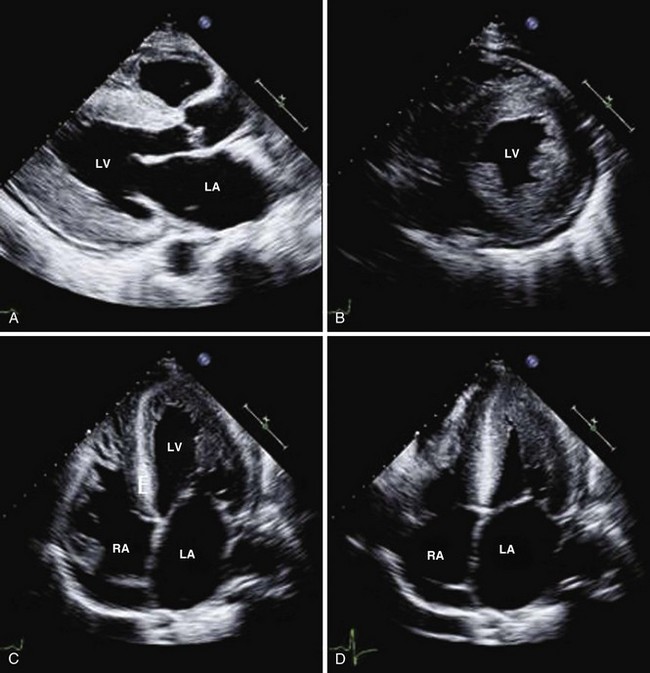
While abnormalities in systolic function can be detected by TDI and speckle tracking, infiltrative cardiomyopathy manifests as a pure form of diastolic dysfunction on a conventional echocardiogram and initially presents as isolated diastolic heart failure (Figures 1-35 through 1-37).
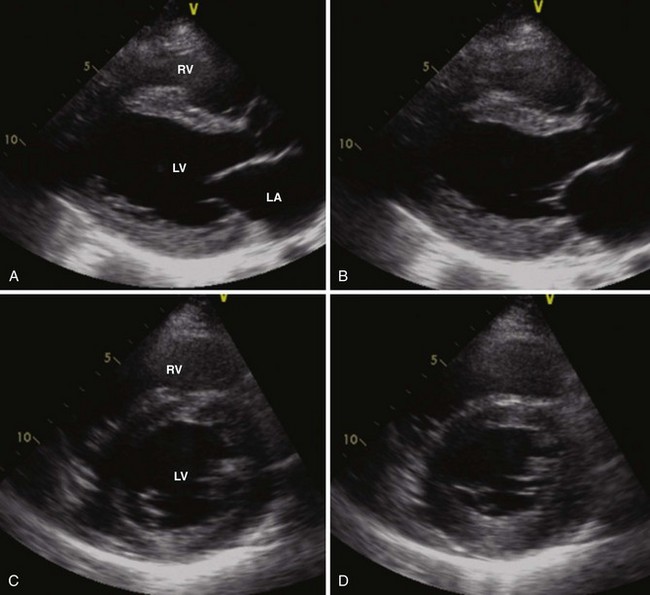
Concomitant Systolic and Diastolic Dysfunction
In systolic heart failure, diastolic dysfunction is present parallel to the grade of systolic dysfunction. Figure 1-38 illustrates a patient with a large anterior acute MI complicated by LV aneurysm formation along with LV thrombus. Following bypass surgery, LV systolic function improved after a year. This was associated with an improvement in diastolic function grade.

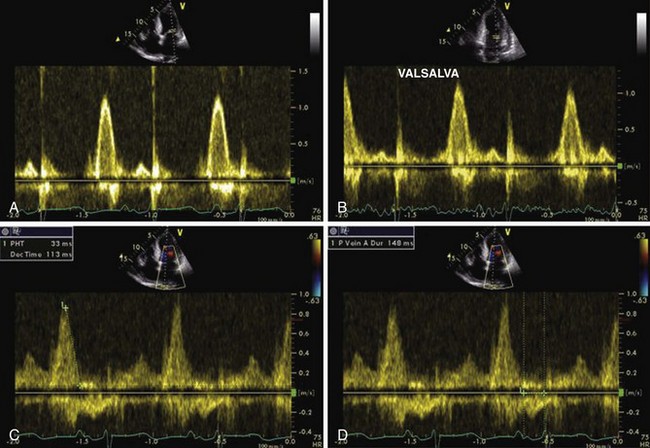
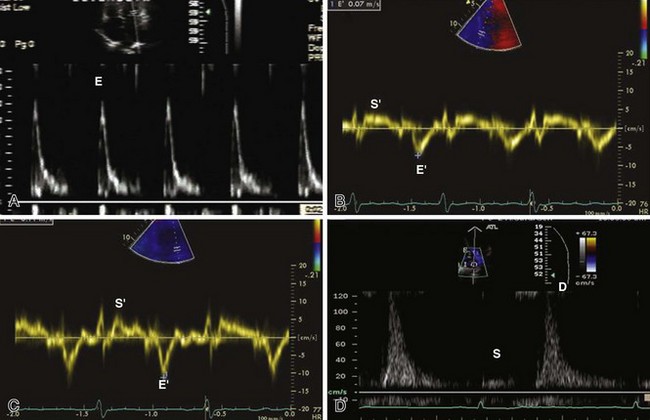
Challenges in Assessment of Diastolic Function
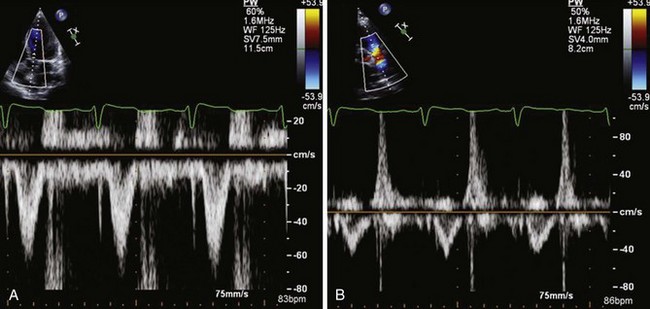
Tachycardia makes evaluation of diastolic function difficult. Pulmonary vein flow may be most helpful in this setting (Figures 1-39 and 1-40). In the presence of a prosthetic mitral valve, mitral stenosis, or significant mitral annular calcification, pulmonary vein flow is most reliable in assessing diastolic function.
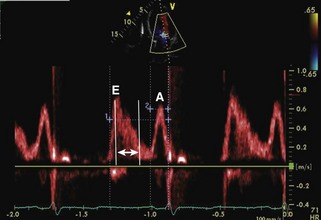
Atrial fibrillation is another common condition that makes assessment of diastolic function difficult due to a loss of mechanical atrial function and highly variable cycle length. In chronic atrial fibrillation, it is difficult to separate the effects of the progression of diastolic dysfunction from further atrial remodeling related to atrial fibrillation itself. Pulmonary vein flow shows S-wave blunting and hence the S/D ratio is not very helpful. Mitral inflow E-wave DT, E/E′, and pulmonary wave DT assist with evaluation of diastolic function and left atrial pressure (Figure 1-41).
1 Lang RM, Bierig M, Devereux RB, et al. Recommendations for chamber quantification: A report from the American Society of Echocardiography’s Guidelines and Standards Committee and the Chamber Quantification Writing Group, developed in conjunction with the European Association of Echocardiography. J Am Soc Echocardiogr. 2005;18:1440-1463.
2 Rudski LG, Lai WW, Afilalo J, et al. Guidelines for the echocardiographic assessment of the right heart in adults: A report from the American Society of Echocardiography. J Am Soc Echocardiogr. 2010;23:685-713.
3 Quinones MA, Otto CM, Stoddard M, Waggoner A, Zoghbi WA. Recommendations for quantification of Doppler echocardiography: A report from the Doppler Quantification Task Force of the Nomenclature and Standards Committee of the American Society of Echocardiography. J Am Soc Echocardiogr. 2002;15:167-184.
4 Nagueh SF, Appleton CP, Gillebert TG, et al. Recommendations for the evaluation of left ventricular diastolic function by echocardiography. J Am Soc Echocardiogr. 2009;22:107-133.