[level-membership-for-radiology-category]
Digital Radiographic Image Processing and Manipulation
Objectives
On completion of this chapter, you should be able to:
• Describe the formation of an image histogram.
• Discuss automatic rescaling.
• Compare image latitude in digital imaging with film/screen radiography.
• List the functions of contrast enhancement parameters.
• Describe the effects of improper algorithm application.
• Discuss the purpose and function of image manipulation factors.
Key Terms
Aliasing
Archive query
Automatic rescaling
Contrast manipulation
Critical frequency
Edge enhancement
High-pass filtering
Histogram
Image annotation
Image orientation
Image sampling
Image stitching
Look-up table (LUT)
Low-pass filtering
Manual send
Nyquist theorem
Patient demographics
Shuttering
Smoothing
Spatial frequency resolution
Window level
Window width
Once x-ray photons have been converted into electrical signals, these signals are available for processing and manipulation. This is true for both photostimulable phosphor (PSP) systems and flat-panel detector (FPD) systems, although a reader is used only for PSP systems. Processing parameters and image manipulation controls are also similar for both systems.
Preprocessing takes place in the computer where the algorithms determine the image histogram. Postprocessing is done by the technologist through various user functions. Digital preprocessing methods are vendor specific, so only general information on this topic can be covered here.
PSP Reader Functions
The PSP imaging plate records a wide range of x-ray exposures. If the entire range of exposure were digitized, values at the extremely high and low ends of the exposure range would also be digitized, resulting in low-density resolution. To avoid this, exposure data recognition processes only the optimal density exposure range. The data recognition program searches for anatomy recorded on the imaging plate by finding the collimation edges and then eliminates scatter outside the collimation. Failure of the system to find the collimation edges can result in incorrect data collection, and images may be too bright or too dark. It is equally important to center the anatomy to the center of the imaging plate. This also ensures that the appropriate recorded densities will be located. Failure to center the imaging plate may also result in an image that is too bright or too dark. The data within the collimated area produce a graphic representation of the optimal densities called a histogram (Figure 3-1). The value of each tone is represented (horizontal axis), as is the number of pixels in each tone (vertical axis). Values at the left represent black areas. As tones vary toward the right, they get brighter, with the middle area representing medium tones. The extreme right area represents white. A dark image will show the majority of its data points on the left, and a light image will show the majority of its data points on the right.
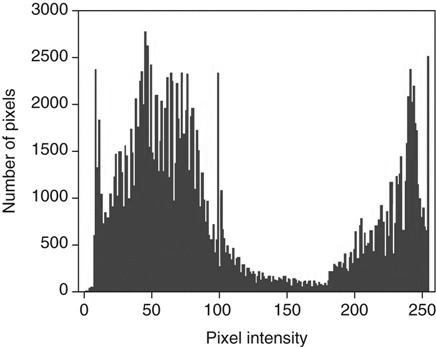
A graphical representation of the number of pixels with a particular intensity.
Because the information within the collimated area is the signal that will be used for image data, this information is the source of the vendor-specific exposure data indicator.
Image Sampling
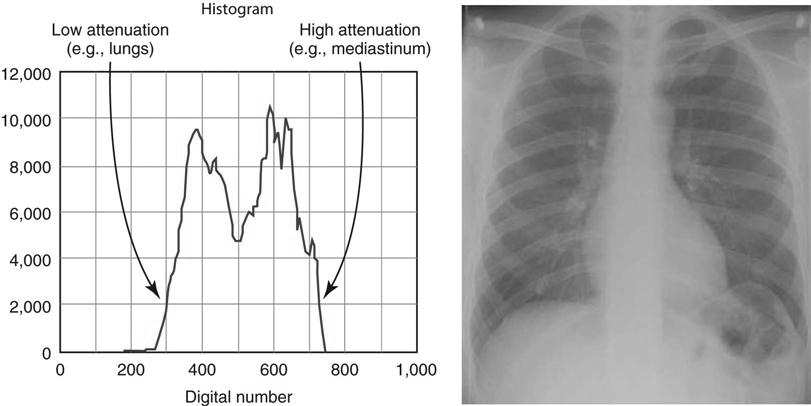
With image sampling, the plate is scanned and the image’s location is determined. The size of the signal is then determined, and a value is placed on each pixel. A histogram is generated from the image data, which allows the system to find the useful signal by locating the minimum (S1) and maximum (S2) signal within the anatomic regions of interest on the image and then plots the intensities of the signal on a histogram. The histogram identifies all intensities on the imaging plate in the form of a graph on which the x-axis is the amount of exposure read, and the y-axis is the number of pixels for each exposure. This graphic representation appears as a pattern of peaks and valleys that varies for each body part. Low energy (low kilovoltage peak [kVp]) gives a wider histogram; high energy (high kVp) gives a narrower histogram. The histogram shows the distribution of pixel values for any given exposure. For example, if pixels have a value of 1, 2, 3, and 4 for a specific exposure, then the histogram shows the frequency (how often they occurred) of each of those values, as well as the actual number of values (how many were recorded).
Analysis of the histogram is very complex. However, it is important to know that the shape of the histogram is anatomy specific, which is to say that it stays fairly constant for each part exposed. For example, the shape of a histogram generated from a chest x-ray on an adult patient will look very different than a knee histogram generated from a pediatric knee examination. This is why it is important to choose the correct anatomic region on the menu before processing the image plate. The raw data used to form the histogram are compared with a “normal” histogram of the same body part by the computer, and the image correction takes place at this time (Figure 3-2).
Digital Radiography Image Sampling
The Nyquist Theorem
In 1928 Harry Nyquist, who was a researcher for AT&T, published the paper “Certain Topics in Telegraph Transmission Theory.” He described a way to convert analog signals into digital signals that would more accurately transmit over telephone lines. He found that since an analog signal was limited to specific high frequencies, it could be captured and transmitted digitally and recreated in analog form on the receiver. He said that the sampling rate would need to be at least twice the highest frequency to be reproduced. In 1948 Claude Shannon presented a mathematical proof of Nyquist’s theory, allowing it to be called the Nyquist theorem. Since that time, a number of scientists have added to and revised the theory. In fact, it could be called the Nyquist–Shannon–Kotelnikov, Whittaker–Shannon–Kotelnikov, Whittaker–Nyquist–Kotelnikov–Shannon (WNKS), etc., sampling theorem, as well as the Cardinal Theorem of Interpolation Theory. It is often referred to simply as the sampling theorem.
The Nyquist theorem states that when sampling a signal (such as the conversion from an analog image to a digital image), the sampling frequency must be greater than twice the frequency of the input signal so that the reconstruction of the original image will be as close to the original signal as possible. In digital imaging, at least twice the number of pixels needed to form the image must be sampled. If too few pixels are sampled, the result will be a lack of resolution. At the same time, there is a point at which oversampling does not result in additional useful information. Once the human eye can no longer perceive an improvement in resolution, there is no need for additional sampling.
The number of conversions that occur in PSP imaging—electrons to light, light to digital information, digital to analog signal—results in loss of detail. Light photons do not travel in one direction, so some light will be lost during the light-to-digital conversion because light photons spread out. Because there is a small distance between the phosphor plate surface and the photosensitive diode of the photomultiplier, some light will spread out there as well, resulting in loss of information. In addition, even though the imaging plate is able to store electrons for an extended period of time, the longer the electrons are stored, the more energy they lose. When the laser stimulates these electrons, some of the lower energy electrons will escape the active layer, but if enough energy was lost, some lower energy electrons will not be stimulated enough to escape and information will be lost. All manufacturers suggest that imaging plates be read as soon as possible to avoid this loss.
Although FPD systems lose fewer signals to light spread than PSP systems, the Nyquist theorem is still applied to ensure that sufficient signal is sampled. Because the sample is preprocessed by the computer immediately, signal loss is minimized but still occurs.
Aliasing
When the spatial frequency is greater than the Nyquist frequency and the sampling occurs less than twice per cycle, information is lost and a fluctuating signal is produced. When the signal is reproduced, frequencies above the Nyquist frequency cause aliasing. This is also known as foldover or biasing, and causes mirroring of the signal at  the frequency. A wraparound image is produced, which appears as two superimposed images that are slightly out of alignment, resulting in a moiré effect. This can be problematic because the same effect can occur with grid errors. It is important for technologists to look at both.
Additionally, when a sampled frequency is exactly at the Nyquist frequency, often a zero amplitude signal will result. This is called the critical frequency and results from frequency phase shifts, causing aliasing of the signal.
Automatic Rescaling
When exposure is greater or less than what is needed to produce an image, automatic rescaling occurs in an effort to display the pixels for the area of interest. Automatic rescaling means that images are produced with uniform density and contrast, regardless of the amount of exposure. Problems occur with rescaling when too little exposure is used, resulting in quantum mottle, or when too much exposure is used, resulting in loss of contrast and loss of distinct edges because of increased scatter production. Rescaling is no substitute for appropriate technical factors. There is a danger in relying on the system to “fix” an image through rescaling and in the process using higher milliamperage seconds (mAs) values than necessary to avoid quantum mottle. The term dose creep is widely used to explain this phenomenon. It refers to the use of automatic rescaling without regard to appropriate exposure amount. What may be appropriate for one patient may be too much exposure for another; however, the same factors are used. Therefore the dose “creeps” up over time.
Look-Up Table
A look-up table (LUT) is a histogram of the luminance values derived during image acquisition. The LUT is used as a reference to evaluate the raw information and correct the luminance values. This is a mapping function in which all pixels (each with its own specific gray value) are changed to a new gray value. The resultant image will have the appropriate appearance in brightness (density) and contrast. There is an LUT for every anatomic part. The LUT can be graphed by plotting the original values ranging from 0 to 255 on the horizontal axis and the new values (also ranging from 0 to 255) on the vertical axis. Contrast can be increased or decreased by changing the slope of this graph. The brightness (density) can be increased or decreased by moving the line up or down the y-axis (Figure 3-3).
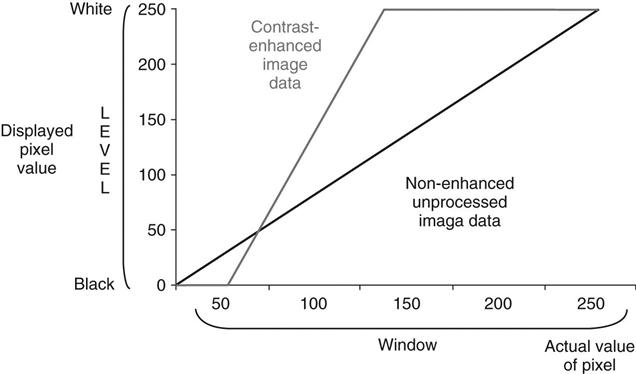
Gray-level transformation required for contrast enhancement of images with 256 shades of gray for an 8-bit matrix. The nonenhanced image data are transformed so that data with pixel values less than 50 are displayed as black, and all data with pixel values greater than 150 are displayed as white. All data with pixel values between 50 and 150 are displayed using an intermediate shade of gray.
Quality Control Workstation Functions
Image Processing Parameters
As previously discussed, digital systems have a greater dynamic range than film/screen imaging. The initial digital image appears linear when graphed because all shades of gray are visible, giving the image a very wide latitude. If all of the shades were left in the image, the contrast would be so low as to make adjacent densities difficult to differentiate. To avoid this, digital systems use various contrast enhancement parameters. Although the parameter names differ by vendor (Agfa [Mortsel, Belgium] uses MUSICA; Fuji [Tokyo, Japan] uses Gradation; and Kodak uses Tonescaling), the purpose and effects are basically the same.
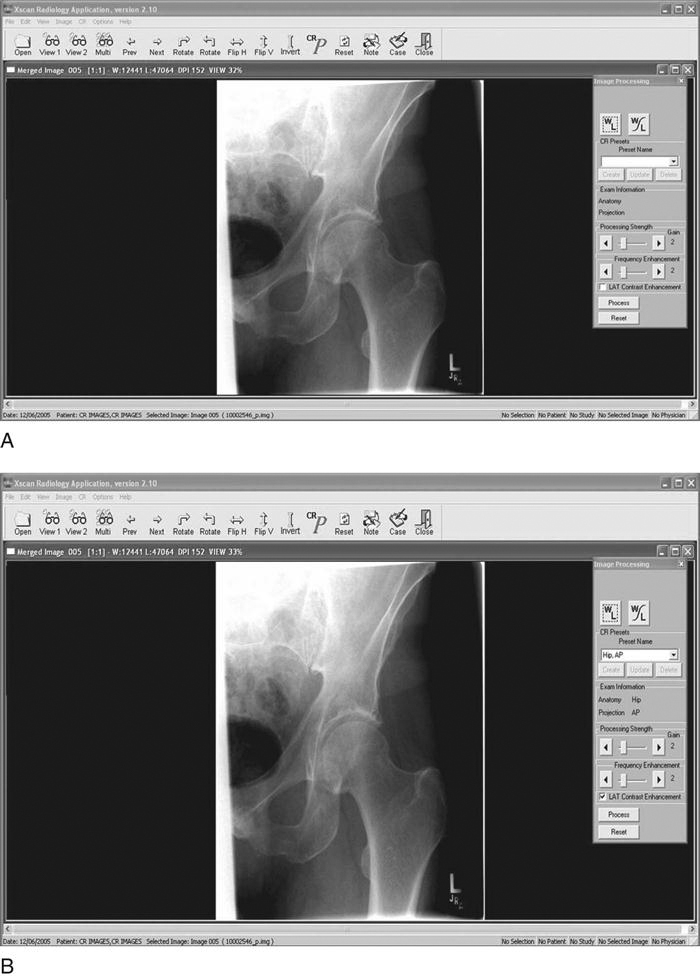
Contrast Manipulation
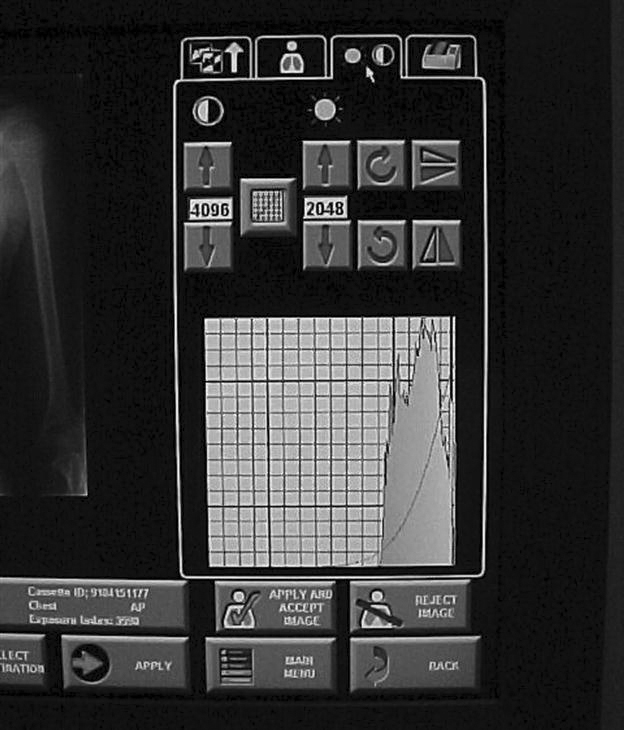
Contrast manipulation involves converting the digital input data to an image with appropriate brightness and contrast using contrast enhancement parameters. Image contrast is controlled by using a parameter that changes the steepness of the exposure gradient. By using a different parameter, the brightness can be varied at the toe and shoulder of the curve to remove the extremely low values and the extremely high values. Another parameter allows brightness to remain unchanged, whereas contrast is varied. These parameters should be used only to enhance the image. No amount of adjustment can take the place of proper technical factor selection (Figure 3-4).
Spatial Frequency Resolution
Detail or sharpness is referred to as spatial frequency resolution. In film/screen radiography, sharpness is controlled by various factors such as focal spot size, screen and/or film speed, and object-image distance (OID). Focal spot and the OID affect image sharpness in both film/screen and digital imaging. The digitized image, however, can be further controlled for sharpness by adjusting processing parameters. The technologist can choose the structure to be enhanced, control the degree of enhancement for each density to reduce image graininess, and adjust how much edge enhancement is applied. Great care must be taken when making adjustments to processing parameters because if the improper algorithms are applied, image formation can be degraded.
Many health care facilities do not want the technologist to manipulate the image much before it goes to the picture archiving and communication system (PACS) because their changes reduce the amount of manipulation that the radiologist can do. Once the image is stored in the PACS, all postprocessing activities result in a loss of information from the original image.
Spatial Frequency Filtering
Edge Enhancement.
After the signal is obtained for each pixel, the signals are averaged to shorten processing time and storage. The more pixels involved in the averaging, the smoother the image appears. The signal strength of one pixel is averaged with the strength of adjacent pixels, or neighborhood pixels. Edge enhancement occurs when fewer pixels in the neighborhood are included in the signal average. The smaller the neighborhood, the greater the enhancement is. When the frequencies of areas of interest are known, those frequencies can be amplified and other frequencies suppressed. This is also known as high-pass filtering and increases contrast and edge enhancement. Suppressing frequencies, also known as masking, can result in the loss of small details. High-pass filtering is useful for enhancing large structures such as organs and soft tissues, but it can be noisy (Figure 3-5).
Smoothing.
Another type of spatial frequency filtering is smoothing. Also known as low-pass filtering, smoothing occurs by averaging each pixel’s frequency with surrounding pixel values to remove high-frequency noise. The result is a reduction of noise and contrast. Low-pass filtering is useful for viewing small structures such as fine bone tissues.
Basic Functions of the Processing System
Image Manipulation
Window and Level.
The most common image processing parameters are those for brightness and contrast. Window level controls how bright or dark the screen image is, and window width controls the ratio of black and white, or contrast. The higher the level is, the darker the image will be, and the wider the window width, the lower the contrast. The user can quickly manipulate both by using the mouse. One direction (vertical or horizontal) controls brightness, and the other direction controls contrast. Remember, windowing and leveling are manipulations of the screen image and are not adding or subtracting radiation exposure to the patient. Minimal manipulation will be required on an image with appropriate exposure factors. To further control brightness and contrast, contrast enhancement parameters are used.
Background Removal or Shuttering.
Anytime a radiographic image is viewed, whether it is film/screen or digital, unexposed borders around the collimation edges allow excess light to enter the eye. Known as veil glare, this excess light causes oversensitization of a chemical within the eye called rhodopsin and results in temporary white light blindness. Although the eye recovers quickly enough so that the viewer recognizes only that the light is very bright, it is a great distraction that interferes with image reception by the eye. In film/screen radiography, black cardboard glare masks or special automatic collimation view boxes were sometimes used to lessen the effects of veil glare, but no technique has ever been entirely successful or convenient. In digital imaging, automatic shuttering is used to blacken out the white collimation borders, effectively eliminating veil glare. Shuttering is a viewing technique only and should never be used to mask poor collimation practices.
Background removal is also beneficial. Removing the white unexposed borders results in an overall smaller number of pixels and reduces the amount of information to be stored (Figure 3-6).
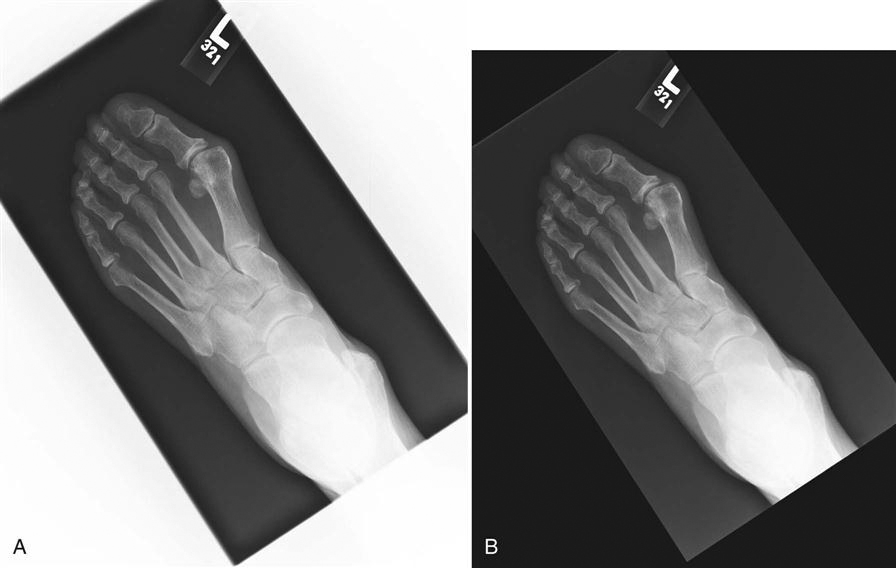
Image Orientation.
Image orientation refers to the way anatomy is oriented on the imaging plate. The image reader has to be informed of the location of the patient’s head versus the location of the feet and right side versus left side. The image reader scans and reads the image from the leading edge of the imaging plate to the opposite end. The image is displayed exactly as it was read unless the reader is informed differently. Vendors mark the cassettes in different ways to help technologists orient the cassette in such a way that the image will be processed to display as expected. Fuji uses a tape-type orientation marker on the top and right side of the cassette. Kodak uses a sticker reminiscent of the film/screen cassette identification blocker. Some examinations, however, require unusual orientation of the cassette. In these cases, the reader must be informed of the orientation of the anatomy with respect to the reader. With FPD systems, for which no cassette is used, the position of the part should correspond with the marked top and sides of the detector. Refer to the specific manufacturer requirements for part orientation if applicable.
Image Stitching.
When anatomy or the area of interest is too large to fit on one cassette, multiple images can be “stitched” together using specialized software programs. This process is called image stitching. In some cases special cassette holders are used and positioned vertically, corresponding to foot-to-hip or entire spine studies. Images are processed in computer programs that nearly seamlessly join the anatomy for display as one single image. This technique eliminates the need for large (36-inch) cassettes previously used in film/screen radiography (Figure 3-7).
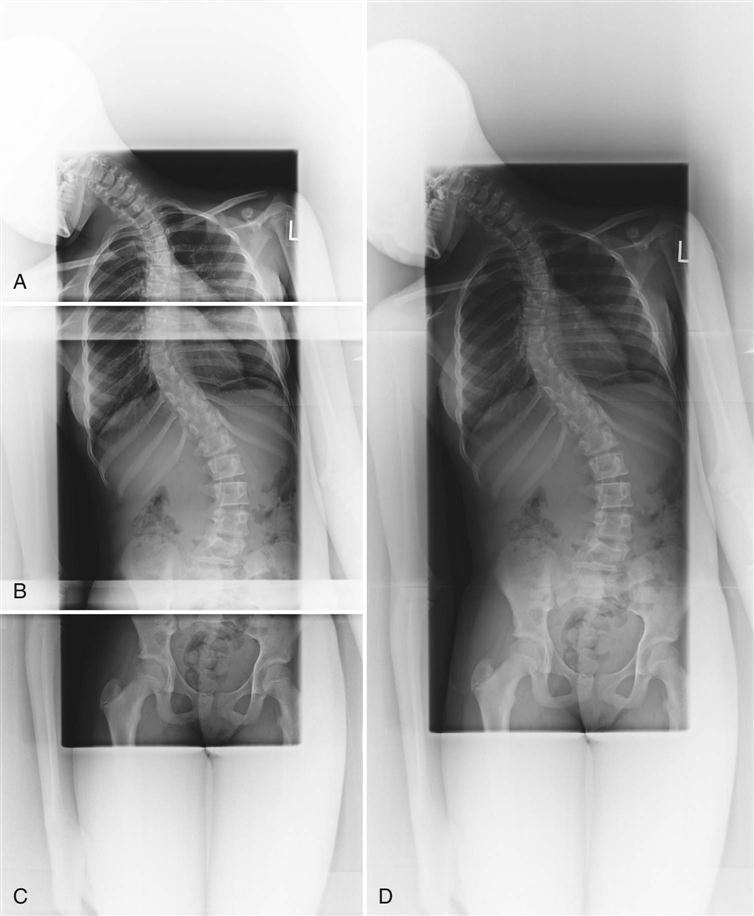
A, AP projection of upper thoracic spine. B, AP projection of lower thoracic and upper lumbar spine. C, AP projection of lower lumbar spine. D, All three images joined by digital stitching, resulting in AP projection of entire spine for scoliosis. (Images courtesy Carestream Health, Inc.)
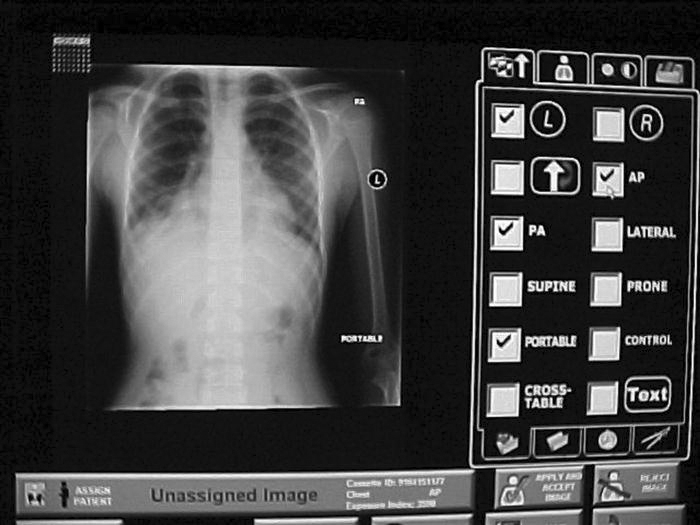
Image Annotation.
Many times, information other than standard identification must be added to the image. In screen/film radiography, time and date stickers, grease pencils, or permanent markers were used to indicate technical factors, time sequences, technologist identification, or position. The image annotation function allows selection of preset terms and/or manual text input and can be particularly useful when such additional information is necessary. (Function availability depends on the manufacturer.) The annotations overlay the image as bitmap images. Depending on how each system is set up, annotations may not transfer to the PACS. Again, input of annotation for identification of the patient’s left or right side should never be used as a substitute for technologist’s anatomy markers (Figure 3-8).
Magnification.
Two basic types of magnification techniques come standard with digital systems. One technique functions as a magnifying glass in the sense that a box placed over a small segment of anatomy on the main image shows a magnified version of the underlying anatomy. Both the size of the magnified area and the amount of magnification can be made larger or smaller. The other technique is a zoom technique that allows magnification of the entire image. The image can be enlarged enough so that only parts of it are visible on the screen, but the parts not visible can be reached through mouse navigation (Figure 3-9).
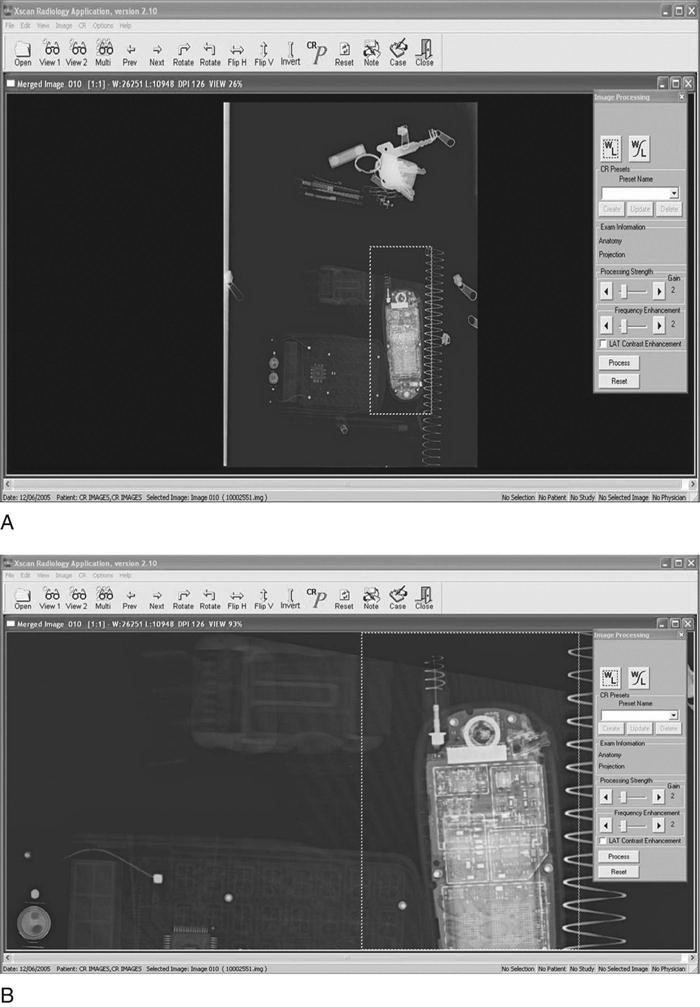
Image Management
Patient Demographic Input
Proper identification of the patient is even more critical with digital images than with conventional hard copy film/screen images. Retrieval of digital images can be nearly impossible if the images have not been properly and accurately identified. Patient demographics include things such as patient name, health care facility, patient identification number, date of birth, and examination date. This information should be input or linked via barcode label scans before the start of the examination and before the processing phase. Occasionally errors are made, and demographic information must be altered. If the technologist performing the examination is absolutely positive that the image is of the correct patient, then demographic information can be altered at the processing stage. This function should be tracked and changes linked to the technologist altering the information to ensure accuracy and accountability.
Problems arise if the patient name is entered differently from visit to visit or examination to examination. For example, if the patient’s name is Jane A. Doe and is entered that way, that name must be entered that way for every other examination. If entered as Jane Doe, the system will save it as a different patient. Merging these files can be difficult, especially if there are several versions of the name. If a patient gives a middle name on one visit but has had multiple examinations under his or her first name, retrieval of previous files will be very difficult and in some cases impossible. The right images must be placed in the correct data files just as hard copy films had to be placed in the correct patient folder.
Manual Send
Because the quality control (QC) workstation is networked to the PACS, it also has the capability to send images to local network workstations. The manual send function allows the QC technologist to select one or more local computers to receive images.
Archive Query
In the event that the technologist wishes to see historical images, the PACS archive can be queried. Archive query is a function that allows retrieval of images from the PACS based on date of examination, patient name or number, examination number, pathologic condition, or anatomic area. For example, the technologist could query or ask the PACS to retrieve all chest x-rays for a particular date or range of dates, or query retrieval of all of a certain patient’s images. There are multiple combinations of query fields that can generate reports that include many categories of information or a few very specific categories to be retrieved from storage.
Summary
• Spatial frequency resolution is controlled by focal spot, OID, and computer algorithms.
• Suppressing frequencies of lesser importance, known as masking, can cause small detail loss.
• Window and level parameters control pixel brightness and contrast.
• The manual send function allows images to be sent to one or more networked computers.
[/level-membership-for-radiology-category][not-level-membership-for-radiology-category]
Digital Radiographic Image Processing and Manipulation
Objectives
On completion of this chapter, you should be able to:
• Describe the formation of an image histogram.
• Discuss automatic rescaling.
• Compare image latitude in digital imaging with film/screen radiography.
• List the functions of contrast enhancement parameters.
• Describe the effects of improper algorithm application.
• Discuss the purpose and function of image manipulation factors.
Key Terms
Aliasing
Archive query
Automatic rescaling
Contrast manipulation
Critical frequency
Edge enhancement
High-pass filtering
Histogram
Image annotation
Image orientation
Image sampling
Image stitching
Look-up table (LUT)
Low-pass filtering
Manual send
Nyquist theorem
Patient demographics
Shuttering
Smoothing
Spatial frequency resolution
Window level
Window width
Once x-ray photons have been converted into electrical signals, these signals are available for processing and manipulation. This is true for both photostimulable phosphor (PSP) systems and flat-panel detector (FPD) systems, although a reader is used only for PSP systems. Processing parameters and image manipulation controls are also similar for both systems.
Preprocessing takes place in the computer where the algorithms determine the image histogram. Postprocessing is done by the technologist through various user functions. Digital preprocessing methods are vendor specific, so only general information on this topic can be covered here.
PSP Reader Functions
The PSP imaging plate records a wide range of x-ray exposures. If the entire range of exposure were digitized, values at the extremely high and low ends of the exposure range would also be digitized, resulting in low-density resolution. To avoid this, exposure data recognition processes only the optimal density exposure range. The data recognition program searches for anatomy recorded on the imaging plate by finding the collimation edges and then eliminates scatter outside the collimation. Failure of the system to find the collimation edges can result in incorrect data collection, and images may be too bright or too dark. It is equally important to center the anatomy to the center of the imaging plate. This also ensures that the appropriate recorded densities will be located. Failure to center the imaging plate may also result in an image that is too bright or too dark. The data within the collimated area produce a graphic representation of the optimal densities called a histogram (Figure 3-1). The value of each tone is represented (horizontal axis), as is the number of pixels in each tone (vertical axis). Values at the left represent black areas. As tones vary toward the right, they get brighter, with the middle area representing medium tones. The extreme right area represents white. A dark image will show the majority of its data points on the left, and a light image will show the majority of its data points on the right.
A graphical representation of the number of pixels with a particular intensity.
Because the information within the collimated area is the signal that will be used for image data, this information is the source of the vendor-specific exposure data indicator.
Image Sampling
With image sampling, the plate is scanned and the image’s location is determined. The size of the signal is then determined, and a value is placed on each pixel. A histogram is generated from the image data, which allows the system to find the useful signal by locating the minimum (S1) and maximum (S2) signal within the anatomic regions of interest on the image and then plots the intensities of the signal on a histogram. The histogram identifies all intensities on the imaging plate in the form of a graph on which the x-axis is the amount of exposure read, and the y-axis is the number of pixels for each exposure. This graphic representation appears as a pattern of peaks and valleys that varies for each body part. Low energy (low kilovoltage peak [kVp]) gives a wider histogram; high energy (high kVp) gives a narrower histogram. The histogram shows the distribution of pixel values for any given exposure. For example, if pixels have a value of 1, 2, 3, and 4 for a specific exposure, then the histogram shows the frequency (how often they occurred) of each of those values, as well as the actual number of values (how many were recorded).
Analysis of the histogram is very complex. However, it is important to know that the shape of the histogram is anatomy specific, which is to say that it stays fairly constant for each part exposed. For example, the shape of a histogram generated from a chest x-ray on an adult patient will look very different than a knee histogram generated from a pediatric knee examination. This is why it is important to choose the correct anatomic region on the menu before processing the image plate. The raw data used to form the histogram are compared with a “normal” histogram of the same body part by the computer, and the image correction takes place at this time (Figure 3-2).
Digital Radiography Image Sampling
The Nyquist Theorem
In 1928 Harry Nyquist, who was a researcher for AT&T, published the paper “Certain Topics in Telegraph Transmission Theory.” He described a way to convert analog signals into digital signals that would more accurately transmit over telephone lines. He found that since an analog signal was limited to specific high frequencies, it could be captured and transmitted digitally and recreated in analog form on the receiver. He said that the sampling rate would need to be at least twice the highest frequency to be reproduced. In 1948 Claude Shannon presented a mathematical proof of Nyquist’s theory, allowing it to be called the Nyquist theorem. Since that time, a number of scientists have added to and revised the theory. In fact, it could be called the Nyquist–Shannon–Kotelnikov, Whittaker–Shannon–Kotelnikov, Whittaker–Nyquist–Kotelnikov–Shannon (WNKS), etc., sampling theorem, as well as the Cardinal Theorem of Interpolation Theory. It is often referred to simply as the sampling theorem.
The Nyquist theorem states that when sampling a signal (such as the conversion from an analog image to a digital image), the sampling frequency must be greater than twice the frequency of the input signal so that the reconstruction of the original image will be as close to the original signal as possible. In digital imaging, at least twice the number of pixels needed to form the image must be sampled. If too few pixels are sampled, the result will be a lack of resolution. At the same time, there is a point at which oversampling does not result in additional useful information. Once the human eye can no longer perceive an improvement in resolution, there is no need for additional sampling.
The number of conversions that occur in PSP imaging—electrons to light, light to digital information, digital to analog signal—results in loss of detail. Light photons do not travel in one direction, so some light will be lost during the light-to-digital conversion because light photons spread out. Because there is a small distance between the phosphor plate surface and the photosensitive diode of the photomultiplier, some light will spread out there as well, resulting in loss of information. In addition, even though the imaging plate is able to store electrons for an extended period of time, the longer the electrons are stored, the more energy they lose. When the laser stimulates these electrons, some of the lower energy electrons will escape the active layer, but if enough energy was lost, some lower energy electrons will not be stimulated enough to escape and information will be lost. All manufacturers suggest that imaging plates be read as soon as possible to avoid this loss.
Although FPD systems lose fewer signals to light spread than PSP systems, the Nyquist theorem is still applied to ensure that sufficient signal is sampled. Because the sample is preprocessed by the computer immediately, signal loss is minimized but still occurs.
Aliasing
[/not-level-membership-for-radiology-category]
