[level-membership-for-hematology-oncology-and-palliative-medicine-category]
Chapter 17 Diagnostic radioisotopes in haematology
Other investigations that may have haematological interest are more likely to be referred to a department of medical physics or nuclear medicine. Even when the tests are not carried out directly in the haematology department, it is essential for the haematologist to understand their principles and limitations and to be able to interpret the results in clinical terms. Various textbooks1,2 provide more complete accounts of the theory and practice of nuclear medicine techniques, as does a monograph on radioisotopes in haematology by Lewis and Bayly.3
The main properties of the radioisotopes useful in diagnostic haematology are shown in Table 17.1. The units used to express radioactivity and the effects of radiation on the body are given in the previous edition. Anyone handling radioisotopes must be aware of the potential radiation hazard. It is also important to be aware of the potential biohazard of handling blood products and administering them to patients (see Chapter 24).
Radiation protection
The quantity of radioactivity used in diagnostic work is usually small and good laboratory practice is all that is necessary for safe working. However, before using radioisotopes, workers should be familiar with the regulations concerning radiation protection for themselves, their fellow workers and patients.4
The effect of radiation on the body depends on the amount of energy deposited and is expressed in grays (Gy). The unit that describes the overall effect of radiation on the body, or the ‘effective dose,’ is measured in sieverts (Sv) or millisieverts (mSv). The annual whole-body dose limit for somebody working with radioisotopes is in the order of 20 mSv, whereas 1 mSv is the annual limit for the general public. To put this into perspective, 1 mSv is produced by normal background radiation in about 6 months and the radiation dose from a single chest X-ray is 0.02 mSv.5 No statutory limit of total annual radiation dose has been set for patients, but it is an important requirement that radioisotopes should be handled only in approved laboratories under the direction of a trained person who holds a certificate from the appropriate authority specifying the radioisotopes that the individual is authorized to use and the dose limits that must not be exceeded. In the UK, this authority is the Administration of Radioactive Substances Advisory Committee (ARSAC).5 Radioisotopes should not be given to pregnant women unless the investigation is considered imperative; if an investigation is necessary during lactation, breast-feeding should be discontinued until radioactivity is no longer detectable in the milk. When radioisotope investigations are necessary in children, the dose relative to that for an adult should be based on body weight (Table 17.2).
Table 17.2 Radioisotope doses for children as a decimal fraction of the adult dose
| Weight (kg) | Fraction of adult dose |
|---|---|
| 10 | 0.3 |
| 15 | 0.4 |
| 20 | 0.5 |
| 30 | 0.6 |
| 40 | 0.75 |
| 50 | 0.9 |
| 60 | 0.95 |
| 70 | 1.0 |
The laboratory (premises) using radioisotopes should be registered to store, handle and dispose of radioactive materials, and appropriate permits are obtained under the Environmental Permitting Regulations 2010.5a
Protective gloves must always be worn when handling radioisotopes; any activity that does get on the hands can usually be removed by washing with soap and water or, if that fails, with a detergent solution. For each laboratory in which isotopes are used, a radiation protection supervisor (RPS) should be nominated to supervise protection procedures and to ensure that a careful record is kept of all administered radioisotopes. This RPS should work in association with the departmental safety officer (see p. 579) and must ensure that all personnel working with radioactive materials wear dosimetry badges (available from an approved dosimetry service provider, e.g. Landauer, Oxford; ISO Pharma, Norway), which must be checked at regular intervals.
Apparatus for Measuring Radioactivity in Vivo
Imaging
The most widely used method for imaging is by the scintillation camera (gamma camera). It consists of a lead shielding, a large thin sodium iodide detector, an array of photomultiplier tubes, a collimator with multiple parallel holes and a system for pulse height analysis and for storage and display of the data. By scanning down the body, an image of the distribution of the label is built up and recorded. It can also be used to measure the quantity of the isotope in various organs. By rotating the scintillation camera around the body, single-photon emission computed tomography (SPECT) can be performed to produce sectional images. Positron emission tomography (PET) has augmented scintillation scanning and uses radioisotopes that are positron emitters.6,7
Measurement of Radioactivity with a Scintillation Counter
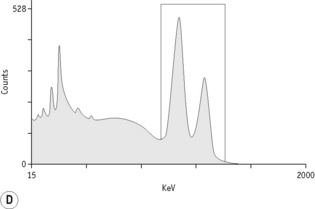
Standardization of Working Conditions
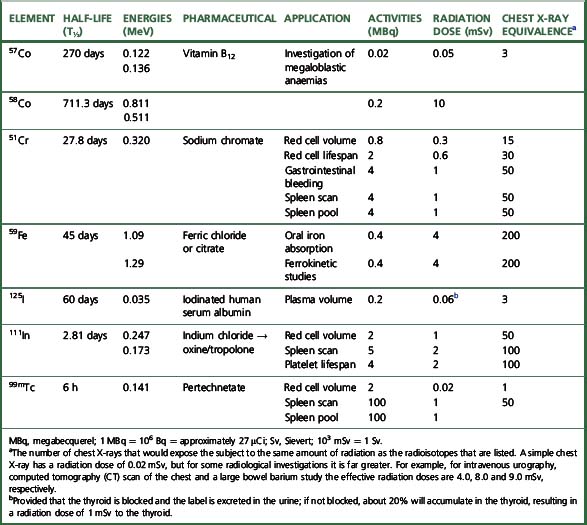
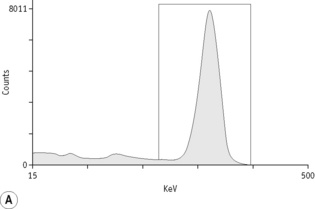
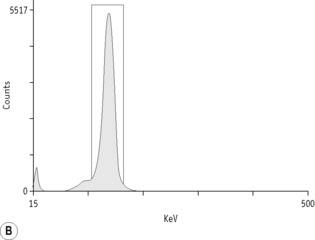
For each radioisotope, it is necessary to plot a spectrum of pulse height distribution and to identify a window corresponding to the energy at which the maximum number of pulses is emitted. Examples of spectra and selected settings are illustrated in Figure 17.1. The setting of the apparatus, once determined, should remain constant for many months.
Counting Technique
Measurement of radioactivity
Measurements are usually carried out for a fixed time period and the results are recorded as counts per second (cps) or counts per minute (cpm). Radioactivity is subject to random but statistically predictable variation similar to that in blood cell counts (see p. 612). The accuracy of the count depends on the total number of the counts recorded as the variance (σ) of a radioactive count = √ total count.
Correction for Physical Decay
Because physical decay is a continuous process that proceeds at an exponential rate, it is possible to correct mathematically for the loss of radioactivity and to convert any measurement back to the initial reference time. This is necessary when comparing successive observations made at different times after the administration of a radionuclide to a patient.8
Blood volume
The haemoglobin concentration (Hb), red cell count and packed cell volume or haematocrit (PCV/Hct) do not invariably reflect the total red cell volume (RCV). Whereas in most cases for practical purposes, there is adequate correlation between peripheral blood values and (total) RCV,8 there will be a discrepancy if the plasma volume is reduced or increased disproportionately. Fluctuation in plasma volume may result in haemodilution, giving rise to pseudoanaemia, or conversely, haemoconcentration, giving rise to pseudopolycythaemia.
Measurement of Blood Volume
Principle
In contrast to measurement of RCV, plasma volume measurements are only approximations because the labelled albumin undergoes continuous slow interchange between the plasma and extravascular fluids, even during the mixing period. For this reason, it is undesirable to attempt to calculate RCV from plasma volume on the basis of the observed PCV. However, because the RCV is generally more stable, calculation of TBV from RCV is usually more reliable, provided that the difference between whole-body and venous PCV is appreciated and allowed for (see p. 379). Measurement of red cell and plasma volumes separately by direct methods is to be preferred.
Red Cell Volume
Radioactive Chromium Method
For the radioactive chromium method,9 add approximately 10 ml of blood to 1.5 ml of sterile National Institutes of Health (NIH)-A acid–citrate–dextrose (ACD) solution (see p. 619) in a sterile bottle with a screw cap. Centrifuge at 1200–1500 g for 5 min. Discard the supernatant plasma and buffy coat and slowly, with continuous mixing, add to the cells 8 × 10³ Bq of Na251CrO4 per kg of body weight. The sodium chromate should be in a volume of at least 0.2 ml, being diluted in 9 g/l NaCl (saline). Allow the blood to stand for 15 min at 37°C for labelling to take place. Wash the red cells twice in 4–5 volumes of sterile saline: for all procedures requiring sterile saline, this should be 9 g/l (0.9%) sodium chloride BP (non-pyrogenic); 12 g/l NaCl should be used when red cell osmotic fragility is greatly increased (e.g. in cases of hereditary spherocytosis).

Measure the PCV of each sample. PCV should be obtained by microhaematocrit centrifugation for 5 min or for 10 min if the PCV is more than 0.50 and correcting for trapped plasma by deducting 2% from the measurement. A more accurate measurement of the PCV can be obtained by the International Council for Standardization in Haematology (ICSH) surrogate reference method (see p. 30).
Technetium Method
Indium is available as 111In chloride. The labelling procedure is simpler than with 99mTc and, because there is less elution than with technetium during the first hour,10 it is particularly suitable for delayed sampling. For labelling blood cells, the indium is complexed with oxine11 or tropolone.12
Plasma Volume
Calculating Total Blood Volume
Whole-body and venous packed cell volume ratio
PCV measured on venous blood is not identical to the average PCV of all the blood in the body. This is mainly because the red cell:plasma ratio is less in small blood vessels (capillaries, arterioles and venules) than in large vessels. The ratio between the whole-body PCV and venous blood PCV is normally about 0.9,9 and it is thus necessary in the calculation of TBV from measurements of RCV to multiply the observed PCV by 0.9. Thus, TBV is given by the following:
Simultaneous Measurement of Red Cell Volume and Plasma Volume
Collect blood and label the red cells by one of the methods described earlier. If 99mTc is used, it is necessary first to inject stannous reagent (see p. 378). Then add 125I HSA (see above) and mix it with the labelled red cell suspension. Inject an accurately measured amount and dilute the remainder 1 in 500 in water for use as a standard. Collect three blood samples at 10, 20 and 30 min, respectively, after the administration of the labelled blood and estimate the radioactivity of a measured volume of each sample and a similar volume of the standard.
Calculate the radioactivity owing to the red cell label in the blood from the mean of the 10-, 20- and 30-min samples and obtain that owing to 125I from the value extrapolated to zero time. Calculate RCV as described on p. 378.
Plasma volume is calculated from the formula:
Expression of Results of Blood Volume Estimations
RCV, plasma volume and TBV are usually expressed in ml/kg of body weight. Because fat is relatively avascular, low values are obtained in obese subjects and the relation between TBV and body weight varies according to body composition. Blood volume is more closely correlated with lean body mass (LBM).13 Earlier methods for determination of LBM were not practical as a routine procedure and discounting excess fat by using an estimate of so-called ‘ideal weight’ is arbitrary and tends to overcorrect for the avascularity of fat. The International Council for Standardization in Haematology (ICSH) developed two formulae, based on body surface area, which provide normal reference values in men and women, respectively.14 They are as follows.
Mean Normal Red Cell Mass (ml)
Men: [1486 × S] − 825; ±25% includes 98% limits
Women: [1.06 × age (years)] + [822 × S]; ± 25% includes 99% limits
Mean Normal Plasma Volume (ml)
Men: 1578 × S; ±25% includes 99% limits
Women: 1395 × S; ±25% includes 99% limits

where S = surface area (m2), W = weight (kg), H = height (cm).
However, the problem of establishing the LBM has been overcome to some extent because there are now instruments that are simple to use for estimating body composition by the different response of fat and other tissues to electrical impedance (body composition analyser, Holtain Ltd, Crosswell, Dyfed, Wales; body fat monitor, Tanita Corporation, IL, USA).13,15
Thus, RCV can now be obtained by a direct measurement that discounts the effect of fat. The graph in Figure 17.2 shows the normalization of the RCV in ml/kg LBM.13 It is obtained as follows: on arithmetic graph paper with % fat on the horizontal (x) axis and RCV in ml/kg total body weight on the vertical (y) axis, plot the intercepts of the following:
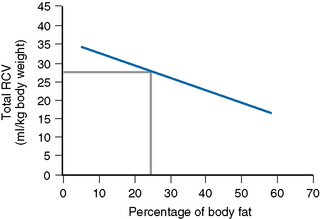
Fat 20% with RCV 29 ml; Fat 50% with RCV 19 ml
Join these two points and extend the line to the right and left.
Range in Health
As a rule, the TBV remains remarkably constant in an individual and rapid adjustments take place within a few hours after blood transfusion or intravenous infusion. In pregnancy, both the plasma volume and TBV increase. The plasma volume increases especially in the 1st trimester and the total volume increases later; by full term the plasma volume will have increased by about 40% and TBV will have increased by 32% or even more. The blood volume returns to normal within a week postpartum.16
Splenic Red Cell Volume
The red cell content of the normal spleen (the red cell ‘pool’) is <5% of the total RCV (i.e. <100–120 ml in an adult). In splenomegaly, the pool is increased (e.g. by perhaps as much as 5–10 times in myelofibrosis, polycythaemia vera and hairy cell leukaemia and other lymphoproliferative disorders).17 An increase in the volume of the splenic red cell pool may itself be a cause of anaemia; measurement of the pool may be useful in investigating the anaemia in these conditions. It is also useful in determining the cause of erythrocytosis because the expanded pool in polycythaemia vera contrasts with that in secondary polycythaemia, which is normal.18
An approximate estimate of the splenic RCV can be obtained from the difference between the RCV calculated from the measurement of the blood sample that has been collected 2–3 min after the injection of labelled cells and that measured after mixing has been completed (i.e. after a delay of 20 min). The splenic RCV can be estimated more accurately by quantitative scanning, after injecting viable red cells labelled with 99mTc.19 The blood volume is measured in the usual way using 100 MBq of 99mTc. The splenic area is scanned 20 min after the injection or after 60 min when there is splenomegaly. To delineate the spleen more precisely, it may be necessary to carry out a second scan after an injection of heat-damaged labelled red cells (see p. 388). From the radioactivity in the spleen, relative to that in a standard, and knowledge of the total RCV, the proportion of the total RCV contained in the spleen can be calculated. This technique has also been used for demonstrating localized accumulation of blood in haemangiomas in the liver,20 telangiectasia and other vascular abnormalities.21
Ferrokinetics
Radioactive iron (59Fe) has a moderately short half-life, 45 days, and labels haemoglobin after injection. It also labels the plasma iron pool and this allows the measurement of iron clearance and calculation of plasma iron turnover. Its subsequent appearance in haemoglobin permits the assessment of the rate of haemoglobin synthesis and the completeness of the utilization of iron. Because it is a γ-ray emitter, radioactivity can be measured in vivo and the sites of distribution of the administered iron and the probable sites of erythropoiesis can thus be determined. (59Fe is not available at present from the former supplier, Amersham plc, but it may be available from POLATOM, www.polatom.pl.)
Iron Distribution
Principle
The ferrokinetic studies with 59Fe that provide information on erythropoiesis include the rate of clearance of the radioiron from the plasma and iron incorporation into circulating red cells (iron utilization). These are relatively simple procedures but they do not take account of the recirculation of iron that returns to the plasma from tissues, nor of iron turnover resulting from dyserythropoiesis or haemolysis. To take account of these factors requires much more complex and time-consuming procedures with multiple sampling over an extended period,22 but the simpler tests provide sufficiently reliable and useful measurements for clinical purposes.
Plasma Iron Clearance
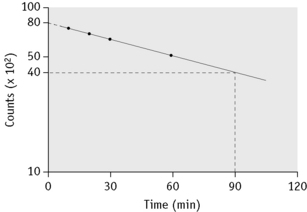
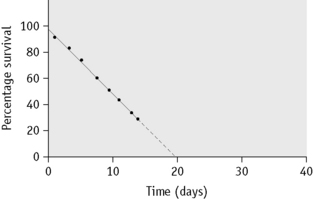
Take a sample at 3 min and four or five further samples over a period of 1–2 h, collecting them into heparin or EDTA. Retain a portion of one sample for measurement of plasma iron. Measure the radioactivity in unit volumes of plasma from the samples and plot the values obtained on log linear graph paper. A straight line will usually be obtained for the initial slope. The radioactivity at the moment of injection is inferred by extrapolation back to zero time and the time taken for the plasma radioactivity to decrease to half its initial value (T½-plasma clearance) is read off the graph (Fig. 17.3).
Iron Utilization
where f is a PCV/Hct correction factor
When there is reason to suspect that the body:venous PCV ratio is not 0.9, measure the RCV by a direct method (see p. 378). Note, however, that because calculation of plasma volume from extrapolation of the 59Fe disappearance curve is often unreliable, it should not be used as the basis for calculation of RCV.
Calculate the percentage utilization on each day from the formula:
Note: The radioactivity is adjusted for physical decay up to the day of measurement.
Plot the daily measured percentages against time on arithmetic graph paper. Record the maximum utilization (Fig. 17.4).
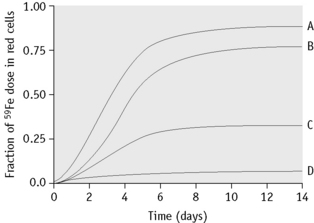
The ferrokinetic patterns in various diseases are shown in Table 17.3 and Figure 17.4.
| Plasma clearance T½ | Red cell utilizationa | |
|---|---|---|
| Normal | 60–140 min | 80% |
| Iron deficiency | Shortened | Increased (90%) |
| Aplastic anaemia | Prolonged | Decreased (10%) |
| Chronic infection | Slightly shortened | Normal |
| Dyserythropoiesis | Slightly shortened | Decreased (30%) |
| Myelofibrosis | Shortened | Decreased (50%) |
| Haemolytic anaemia | Shortened | Increased (85%) |
a Average figures are shown, but there is a wide range, depending on the stage and severity of the disease.
Body Iron Distribution
Where there are facilities for using cyclotron-produced 52Fe and positron emission tomography (PET), high-resolution images of the intramedullary and extramedullary distribution of erythropoietic tissue can be obtained. This is especially helpful in the myeloproliferative neoplasms for diagnosing transition of polycythaemia vera to myelofibrosis and for differentiating essential thrombocythaemia from reactive thrombocytosis.23 It is also useful in identifying residual skeletal erythropoiesis in aplastic anaemia.
Estimation of the lifespan of red cells in vivo
There is extensive literature on the survival of red cells in haemolytic anaemias using radioisotope labelling of red cells (see review by Bentley and Miller24). Although now undertaken less frequently than in the past, measurement of red cell survival can still provide important data in cases of anaemia in which increased haemolysis is suspected but not clearly demonstrated by other tests. In the usual procedure, a population of circulating red cells of all ages is labelled (‘random labelling’). By contrast, in ‘cohort labelling’ a radionuclide (e.g. 59Fe) is incorporated into haemoglobin during its synthesis by erythroblasts and radioactivity is measured in red cells that appear in the circulation as a cohort of closely similar age. Red cell lifespan can be calculated from measurements of red cell iron turnover,25 but the results have to be interpreted with caution because of the reutilization for haem synthesis of iron derived from red cells at the end of their lifespan. Random labelling is a much more practical method than cohort labelling.
Radioactive Chromium (51Cr) Method
Radioactive chromium (51Cr) is a γ-ray emitter with a half-life of 27.8 days. As a red cell label, it is used in the form of hexavalent sodium chromate. After passing through the surface membrane of the red cells, it is reduced to the trivalent form that binds to protein, preferentially to the β-globin chains of haemoglobin.26 In this form, it is not reutilized or transferred to other cells in the circulation.
The main disadvantage of 51Cr is that it gradually elutes from red cells as they circulate; there may be, too, an increased loss over the first 1–3 days and uncertainty as to how much has been lost makes it impossible to measure red cell lifespan accurately. Chromium, whether radioactive or non-radioactive, is toxic to red cells, probably by its oxidizing actions; it inhibits glycolysis in red cells when present at a concentration of 10 μg/ml or more27 and blocks glutathione reductase activity at a concentration exceeding 5 μg/ml.28 Blood should thus not be exposed to >2 μg of chromium per ml of packed red cells.
Method
The technique of labelling red cells is the same as for TBV measurement (see p. 378).29 To ensure as little damage to red cells as possible, with subsequent minimal early loss and later elution, it is important to maintain the blood at an optimal pH. This can be achieved by adding 10 volumes of blood to 1.5 volumes of NIH-A ACD solution (see p. 619).
Elution
The rate of elution differs to a small extent from one individual to another. It is thought to vary to a greater extent between different diseases, especially when the red cell lifespan is considerably reduced. However, in such cases, elution and variation in the rate of elution become unimportant. The rate of elution is also influenced by technique, especially by the anticoagulant solution into which the blood is collected prior to labelling. With the NIH-A ACD solution, the rate of elution is about 1% per day.29
Early Loss
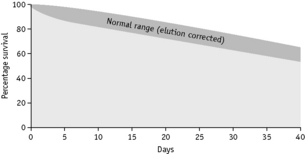
Sometimes, in addition to the elution that occurs continuously and at a relatively low and constant rate, up to 10% of the 51Cr may be lost within the first 24 h. The cause of this major early loss is obscure and several components may be involved. If this major loss does not continue beyond the first 2 days, it is often looked on as an artefact, in the sense that it does not denote an increased rate of lysis in vivo, and it can be, and typically is, ignored by replotting the figures as described on p. 387. This procedure is acceptable, at least for clinical studies, but it does not take into account the possibility that a small proportion of red cells are present that lyse rapidly. It is common practice to calculate the T50Cr (i.e. the time taken for the concentration of 51Cr in the blood to fall to 50% of its initial value) after correcting the data for physical decay but not for elution. T50 is used rather than T½ because the elimination of the label is not a constant exponential fraction of the original amount. The chief objection to the use of T50Cr is that it may be misleading without additional information on the pattern of the survival curve. Moreover, the mean red cell lifespan cannot be directly derived from it. With the technique described earlier, the mean value of T50 in normal subjects is 30 days, with a range of 25–33 days (Table 17.4).
Table 17.4 Normal range for 51Cr survival curves with correction for elution
| Day | % 51Cr (corrected for decay; not corrected for elution) | Elution correction factorsa |
|---|---|---|
| 1 | 93–98 | 1.03 |
| 2 | 89–97 | 1.05 |
| 3 | 86–95 | 1.06 |
| 4 | 83–93 | 1.07 |
| 5 | 80–92 | 1.08 |
| 6 | 78–90 | 1.10 |
| 7 | 77–88 | 1.11 |
| 8 | 76–86 | 1.12 |
| 9 | 74–84 | 1.13 |
| 10 | 72–83 | 1.14 |
| 11 | 70–81 | 1.16 |
| 12 | 68–79 | 1.17 |
| 13 | 67–78 | 1.18 |
| 14 | 65–77 | 1.19 |
| 15 | 64–75 | 1.20 |
| 16 | 62–74 | 1.22 |
| 17 | 59–73 | 1.23 |
| 18 | 58–71 | 1.25 |
| 19 | 57–69 | 1.26 |
| 20 | 56–67 | 1.27 |
| 21 | 55–66 | 1.29 |
| 22 | 53–65 | 1.31 |
| 23 | 52–63 | 1.32 |
| 24 | 51–60 | 1.34 |
| 25 | 50–59 | 1.36 |
| 30 | 44–52 | 1.47 |
| 35 | 39–47 | 1.53 |
| 40 | 34–42 | 1.60 |
a To correct for elution, multiply the % 51Cr by the elution factor for the particular day.
Correction for Elution
When haemolysis is marked, elution is of minor importance and can be ignored. When haemolysis is not greatly increased, it is essential to correct for elution. This can be done by multiplying the measured survival by the factors given in Table 17.4.
Survival Curves
Normal red cell survival (corrected for elution) will be in the range shown in Figure 17.5. When survival is reduced, a survival curve should be drawn and from this the mean red cell lifespan can be derived.
Interpretation of Survival Curves
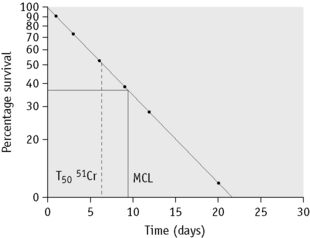
In some cases of haemolytic anaemia (possibly only when there are intracorpuscular defects), the survival curve appears to consist of two components, an initial steep slope followed by a much less steeply falling slope. This suggests the presence of cells of widely varying lifespan. This type of ‘double population’ curve is seen in paroxysmal nocturnal haemoglobinuria, in sickle cell anaemia, in some cases of hereditary enzyme-deficiency haemolytic anaemia and when the labelled cells consist of a mixture of transfused normal cells and short-lived patient’s cells. The mean cell lifespan of the entire cell population can be deduced by plotting the points on semilogarithmic graph paper, as described earlier. The proportion of cells belonging to the longer-lived population can be estimated by plotting the data on arithmetic graph paper and extrapolating the less steep slope back to the ordinate; the lifespan of this population can be estimated by extending the same slope to the abscissa (Fig. 17.8). The lifespan of the short-lived cells can be deduced from the formula:
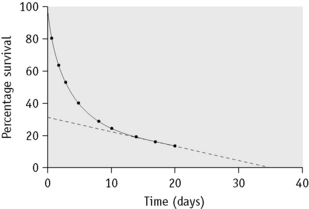
Figure 17.8 51Cr red cell survival curve showing a ‘double population’. By plotting the data on semilogarithmic graph paper as described in Figure 17.7, the mean cell lifespan (MCL) of the entire cell population was deduced as 5 days. When plotted on arithmetic graph paper, by extrapolation of the less steep slope to the ordinate it was deduced that approximately 30% of the red cells belonged to one population, and by extrapolation of the same slope to the abscissa the MCL of this population was deduced as 35 days. The lifespan of the remaining 70% of cells was calculated to be 3.6 days (see formula). The T50Cr was 3–4 days.
where S = short-lived population, L = longer-lived population, T = entire cell population and MCL = mean cell lifespan.
Correction of Survival Data for Blood Loss
where Ta = apparent time of MCL (days), RCV = red cell volume (ml) and L = mean rate of loss of red cells (ml/day).
Determination of Sites of Red Cell Destruction Using 51Cr
Because 51Cr is a γ-ray emitter, the sites of destruction of red cells, with special reference to the spleen and liver, can be determined by in vivo surface counting using a shielded scintillation counter placed, respectively, over the heart, spleen and liver. This procedure is laborious, but occasionally it may provide clinically useful information on the role of the spleen in various types of haemolytic anaemia, especially by predicting response to splenectomy.30
Compatibility test
Method
Remove 1–2 ml of blood from the tubing attached to donor bag using a sterile technique. Label 0.5 ml of the red cells with 0.8 MBq of 51Cr, 2 MBq of 111In or 2 MBq of 99mTc in the standard way (see p. 378) and administer to the recipient. Collect 5–10 ml of blood into EDTA or heparin at 3, 10 and 60 min after the injection from a vein other than that used for the injection. Prepare 1 ml samples in counting vials. Centrifuge the remainder of the specimens and pipette 1 ml of the plasma into counting vials. Measure the radioactivity in the usual way. Calculate the activity in the blood and plasma samples as a percentage of the 3 min blood sample.29
Interpretation
With compatible blood, the radioactivity in the 60 min sample is, on average, 99% of that of the 3 min sample, but it may vary between 94% and 104%. If the blood radioactivity at 60 min is not less than 70% and the plasma activity is not more than 3%, the donor cells may be transfused with minimal hazard.29
Visualization of the spleen by scintillation scanning
Method
With 99mTc as the label, carry out pre-tinning in vivo by an injection of a stannous compound as described on p. 378. Then collect 5–10 ml of blood into a sterile bottle containing 100 iu of heparin. Wash twice in sterile 9 g/l NaCl (saline), centrifuging at 1200–1500 g for 5–10 min. Transfer 2 ml of the packed red cells to a 30 ml glass bottle with a screw cap; heat the bottle in a waterbath at a constant temperature of 49.5–50°C for exactly 20 min with occasional gentle mixing. Wash the cells in saline until the supernatant is free from haemoglobin and discard the final supernatant. Label with 40 MBq of 99mTc by the method described on p. 378. After it has stood for 5 min, wash twice in saline. Resuspend in about 10 ml of saline and inject as soon as possible. After about 1 h carry out a gamma camera scan.31
Spleen Function
The disappearance curve is, as a rule, exponential (Fig. 17.9). The initial slope reflects the splenic blood flow; the rate of blood flow is calculated as the reciprocal of the time taken for the radioactivity to fall to half the 3-min value (i.e.  ), where 0.693 is the natural log of 2.
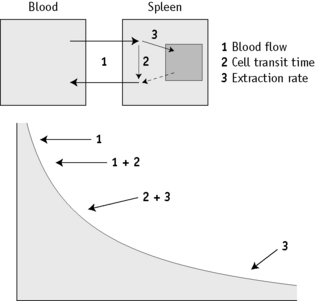
When the spleen is functioning normally, the T½ is 5–15 min and fractional splenic blood flow is 0.05–0.14 ml/min (i.e. 5–14% of the circulating blood per min). The clearance rate is considerably prolonged in some patients with thrombocythaemia and in other conditions associated with splenic atrophy such as sickle cell anaemia, coeliac disease and dermatitis herpetiformis.17 It thus provides some indication of spleen function. However, the disappearance curve is a complex of at least two components. The first (mentioned earlier) reflects the splenic blood flow and the second component mainly measures cell trapping, the consequence of both transient sequestration and phagocytosis with irreversible extraction of the cells from circulation.32,33 Measurement of phagocytosis alone is obtained more reliably with immunoglobulin G (IgG) (anti-D)-coated red cells.34
Leucocyte Imaging
The main diagnostic value of 111In-labelled granulocyte scintigraphy is to localize specific sites of infection and abscesses and, in investigation of patients with fever of unknown origin, to rule out an infectious cause for the fever.35 For this it is necessary to prepare a granulocyte concentrate separated from other leucocytes (see p. 65). This is then labelled with 111In in a procedure similar to that for labelling platelets (see p. 389)36 and administered. The sites of granulocyte accumulation are shown by gamma camera scan.
Miscellaneous Imaging
In addition to the radioisotopes discussed earlier, there are other radioisotopes that can be used to provide information in haematological disorders. For example, 18F-FDG (fluorine-18 fluorodeoxyglucose), a tracer of glucose metabolism, with position emission tomography (PET) can be useful in the assessment of tumour metabolism.37,38 The information generated can assist in clinical staging of patients with malignancies, including lymphoma. Malignant tissue shows enhanced uptake of this tracer and this information can be used to monitor progress of patients receiving chemotherapy.
Similarly, other more mainstream radiological investigations can be useful in the management of haematological diseases. For example, MRI can assist in monitoring the progress of patients with lymphoma and myeloma. In the management of patients with iron overload, MRI scans (by specified imaging method T2) can provide important information on liver and cardiac iron that can be used to optimize iron chelation regimens.39
Measurement of blood loss from the gastrointestinal tract
Method
Label the patient’s own blood with approximately 4 MBq of 51Cr, as described on see p. 378. On each day of the test, collect the faeces in plastic or waxed cardboard cartons. Prepare a standard by adding a measured volume (3–5 ml) of the patient’s blood, collected on each day, to approximately 100 ml of water in a similar carton. Compare the radioactivity of the faecal samples and the corresponding daily standard in a large-volume counting system (see p. 375). Then:
An imaging procedure has also been described in which blood is labelled with 99mTc and a large-field scintillation scan is performed after 60–90 min and, if necessary, again at intervals for 24 h.40
Measurement of platelet lifespan
Principle
The procedure for measuring platelet lifespan is broadly similar to that for red cell survival (see p. 383). A method using 111In-labelled platelets was recommended by ICSH.41 A modification of this method especially for use with low platelet counts42 is described in the following.
Method
Collect 51 ml of blood into 9 ml of NIH-A ACD (see p. 619); a proportionately lower amount is required if the platelet count is normal or high. Distribute the blood equally into three 30 ml polystyrene tubes, each containing 2 ml of 60 g/l hydroxyethyl starch (Hespan, Bristol Myers Squibb). Mix and immediately centrifuge at 150 g for 10 min. Transfer the supernatant platelet-rich plasma into clean centrifuge tubes and add ACD, 1 volume to 10 volumes of the platelet-rich plasma. If necessary, centrifuge again at 150 g for 5 min to remove residual red cells.42
Prepare a solution of tropolone, 4.4 mmol/l (0.54 mg/ml) in HEPES-saline buffer, pH 7.6 (see p. 622). Mix 0.1 ml with 8 MBq (250 μCi) of 111InCl in <50 μl of 40 mmol/l HCl. Add the platelet suspension with gentle mixing and leave at room temperature for 5 min. Then add 5 ml of platelet-poor plasma. Centrifuge at 640 g for 10 min. Remove the supernatant and resuspend the platelet pellet in 5 ml of platelet-poor plasma. Take up the platelet suspension into a 10 ml plastic syringe.

where 1.015 is the specific gravity of plasma.
Calculation of Platelet Recovery at Each Sampling Time
Note: If total blood volume is not measured, an approximate estimate can be obtained from the subject’s height and weight.43
Analysis of Data
Plot the percentage survival against time on arithmetic graph paper and estimate the survival time as for red cell survival (see p. 385).
Platelet Survival in Disease
In autoimmune (idiopathic) thrombocytopenia purpura, platelet lifespan is considerably reduced. It is also shortened in consumption coagulopathies and in thrombotic thrombocytopenic purpura. In thrombocytopenia, because of defective production of platelets, the lifespan should be normal, provided that platelets are not being lost by bleeding during the course of the study. In thrombocytopenia associated with splenomegaly, the recovery of injected labelled platelets is low, but their survival is usually almost normal. By quantitative scanning with 111In, it is possible to measure the splenic platelet pool and to distinguish the relative importance of pooling and destruction of platelets in the spleen.44–46 The splenic platelet pool is normally about 30% of the total platelet population and it is thought that each platelet spends one-third of its lifespan in the spleen. The size of the pool is increased in splenomegaly, resulting in thrombocytopenia but not necessarily in a reduced mean platelet lifespan.
1 Wagner H.N., Szabo Z., Buchanan J.W. Principles of Nuclear Medicine. Philadelphia: Saunders; 1995.
2 Maisey M.N., Britton K.E., Collier B.D. Clinical Nuclear Medicine, 3rd ed., London: Chapman and Hall, 1998.
3 Lewis S.M., Bayly R.J., editors. Methods in Hematology 14: Radionuclides in Haematology. Edinburgh: Churchill Livingstone, 1986.
4 Allisy-Roberts P., editor. Medical and Dental Guidance Notes. Good Practice Guide on All Aspects of Ionizing Radiation Protection in the Clinical Environment. York, UK: Institute of Physics and Engineering in Medicine, 2002.
5 ARSAC. Notes for guidance on the administration of radiopharmaceuticals and use of sealed radioactive sources. Health Protection Agency, Radiation Protection Division, Chilton, Didcot Oxon, 2006. www.arsac.org.uk. Available at:
5a The Environmental Permitting (England and Wales) Regulations 2010 (SI 2010 No.675). London: HMSO, 2010.
6 Alavi A., editor. Impact of FDG-PET imaging on the practice of medicine. Semin Nucl Med, 32. 2002, 1-76.
7 Jamar F., Lonneux M. Positron emission tomography in haematology. In: Peters A.M., editor. Nuclear Medicine in Radiological Diagnosis. London: Martin Dinitz; 2003:519-529.
8 Bentley S.A., Lewis S.M. The relationship between total red cell volume, plasma volume and venous haematocrit. Br J Haematol. 1976;33:301-307.
9 International Committee for Standardization in Haematology. Recommended methods for measurements of red-cell and plasma volume. J Nucl Med. 1980;21:793-800.
10 Ferrant A., Lewis S.M., Szur L. The elution of 99mTc from red cells and its effect on red cell volume measurement. J Clin Pathol. 1974;27:983-985.
11 Goodwin D.A. Cell labelling with oxine chelates of radioactive metal ions: techniques and clinical implications. J Nucl Med. 1978;19:557-559.
12 Osman S., Danpure H.J. A simple in vitro method of radiolabelling human erythrocytes in whole blood with 113mln-tropolonate. Eur J Haematol. 1987;39:125-127.
13 Berlin N.I., Lewis S.M. Measurement of total red-cell volume relative to lean body mass for diagnosis of polycythaemia. Am J Clin Pathol. 2000;114:922-926.
14 International Council for Standardization in Haematology (Expert Panel on Radionuclides). Interpretation of measured red cell mass and plasma volume in adults. Br J Haematol. 1995;89:747-756.
15 Lukaski H.C., Johnson P.E., Bolunchuk W.W., et al. Assessment of fat-free mass using bioelectrical impedance measurements of the human body. Am J Clin Nutr. 1985;41:810-817.
16 Lund C.J., Sisson T.R. Blood volume and anemia of mother and baby. Am J Obstet Gynecol. 1958;76:1013-1023.
17 Pettit J.E. Spleen function. Clin Haematol. 1977;6:639-656.
18 Bateman S., Lewis S.M., Nicholas A., et al. Splenic red cell pooling: a diagnostic feature in polycythaemia. Br J Haematol. 1978;40:389-396.
19 Hegde U.M., Williams E.D., Lewis S.M., et al. Measurement of splenic red cell volume and visualization of the spleen with 99mTc. J Nucl Med. 1973;14:769-771.
20 Miller J.H. Technetium-99m-labelled red blood cells in the evaluation of the liver in infants and children. J Nucl Med. 1987;28:1412-1418.
21 Front D., Israel O. Tc-99m-labelled red blood cells in the evaluation of vascular abnormalities. J Nucl Med. 1981;22:149-151.
22 Cavill I. Plasma clearance studies. Methods in Hematology. 1986;14:214-244.
23 Peters A.M., Swirsky D.M. Blood disorders. In Maisey M.N., Britton K.E., Collier B.D., editors: Clinical Nuclear Medicine, 3rd ed., London: Chapman and Hall, 1998.
24 Bentley S.A., Miller D.T. Radionuclide blood cell survival studies. Methods in Hematology. 1986;14:245-262.
25 Ricketts C., Cavill I., Napier J.A.F. The measurement of red cell lifespan using 59Fe. Br J Haematol. 1977;37:403-408.
26 Pearson H.A. The binding of 51Cr to hemoglobin. I. In vitro studies. Blood. 1963;22:218-230.
27 Jandl J.H., Greenberg M.S., Yonemoto R.H., et al. Clinical determination of the sites of red cell sequestration in hemolytic anemias. J Clin Invest. 1956;35:842-867.
28 Koutras G.A., Schneider A.S., Hattori M., et al. Studies of chromated erythrocytes: mechanisms of chromate inhibition of glutathione reductase. Br J Haematol. 1965;11:360-369.
29 International Committee for Standardization in Haematology. Recommended methods for radioisotope red-cell survival studies. Br J Haematol. 1980;45:659-666.
30 International Committee for Standardization in Haematology. Recommended methods for surface counting to determine sites of red-cell destruction. Br J Haematol. 1975;30:249-254.
31 Royal H.D., Brown M.L., Drum D.E., et al. Procedure guideline for hepatic and splenic imaging. J Nucl Med. 1998;39:1114-1116.
32 Peters A.M., Ryan P.F., Klonizakis I., et al. Analysis of heat-damaged erythrocyte clearance curves. Br J Haematol. 1981;49:581-586.
33 Peters A.M., Ryan P.F.J., Klonizakis I., et al. Kinetics of heat damaged autologous red blood cells. Scand J Haematol. 1982;28:5-14.
34 Peters A.M., Walport M.J., Elkon K.B., et al. The comparative blood clearance kinetics of modified radiolabelled erythrocytes. Clin Sci. 1984;66:55-62.
35 Kjaer A., Lebech A.-M. Diagnostic value of 111In-granulocyte scintigraphy in patients with fever of unknown origin. J Nucl Med. 2002;43:140-144.
36 Buscombe J. Infection. In Maisey M.N., Britton K.E., Collier B.D., editors: Clinical Nuclear Medicine, 3rd ed., London: Chapman and Hall, 1998.
37 Weber W.A., Schwaiger M., Avril N. Quantitative assessment of tumour metabolism using FDG-PET imaging. Nucl Med Biol. 2000;27:683-687.
38 Schöder H., Larson S.M., Yeung H.W. PET/CT in oncology: Integration into clinical management of lymphoma, melanoma and gastrointestinal malignancies. J Nucl Med. 2004;45:72S-81S.
39 Anderson L.J., Wonke B., Prescott E., et al. Comparison of effects of oral deferiprone and subcutaneous desferrioxamine on myocardial iron concentrations and ventricular function in beta-thalassaemia. Lancet. 2002;360:516-520.
40 Ford P.V., Bartold S.P., Fink-Bennett D.M., et al. Procedure guideline for gastrointestinal bleeding and Meckel’s diverticulum scintigraphy. J Nucl Med. 1999;40:1226-1232.
41 International Committee for Standardization in Haematology. Recommended methods for 111In platelet survival studies. J Nucl Med. 1988;29:564-566.
42 Danpure H.J., Osman S., Peters A.M. Labelling autologous platelets with 111In tropolonate for platelet kinetic studies: limitations imposed by thrombocytopenia. Eur J Haematol. 1990;45:223-230.
43 Hurley P.J. Red cell and plasma volumes in normal adults. J Nucl Med. 1975;16:46-52.
44 Peters A.M., Swirsky D.M. Blood disorders. In: Maisey M.N., Britton K.E., Collier B.D., editors. Clinical Nuclear Medicine. 3rd ed. London: Chapman and Hall; 1998:525-539.
45 Peters A.M., Saverymuttu S.H., Bell R.N., et al. The kinetics of short-lived indium-111 radiolabelled platelets. Scand J Haematol. 1985;34:137-145.
46 Peters A.M., Saverymuttu S.H., Wonke B., et al. The interpretation of platelet kinetic studies for the identification of site of abnormal platelet destruction. Br J Haematol. 1984;57:637-649.
[/level-membership-for-hematology-oncology-and-palliative-medicine-category][not-level-membership-for-hematology-oncology-and-palliative-medicine-category]
Chapter 17 Diagnostic radioisotopes in haematology
Other investigations that may have haematological interest are more likely to be referred to a department of medical physics or nuclear medicine. Even when the tests are not carried out directly in the haematology department, it is essential for the haematologist to understand their principles and limitations and to be able to interpret the results in clinical terms. Various textbooks1,2 provide more complete accounts of the theory and practice of nuclear medicine techniques, as does a monograph on radioisotopes in haematology by Lewis and Bayly.3
The main properties of the radioisotopes useful in diagnostic haematology are shown in Table 17.1. The units used to express radioactivity and the effects of radiation on the body are given in the previous edition. Anyone handling radioisotopes must be aware of the potential radiation hazard. It is also important to be aware of the potential biohazard of handling blood products and administering them to patients (see Chapter 24).
Radiation protection
The quantity of radioactivity used in diagnostic work is usually small and good laboratory practice is all that is necessary for safe working. However, before using radioisotopes, workers should be familiar with the regulations concerning radiation protection for themselves, their fellow workers and patients.4
The effect of radiation on the body depends on the amount of energy deposited and is expressed in grays (Gy). The unit that describes the overall effect of radiation on the body, or the ‘effective dose,’ is measured in sieverts (Sv) or millisieverts (mSv). The annual whole-body dose limit for somebody working with radioisotopes is in the order of 20 mSv, whereas 1 mSv is the annual limit for the general public. To put this into perspective, 1 mSv is produced by normal background radiation in about 6 months and the radiation dose from a single chest X-ray is 0.02 mSv.5 No statutory limit of total annual radiation dose has been set for patients, but it is an important requirement that radioisotopes should be handled only in approved laboratories under the direction of a trained person who holds a certificate from the appropriate authority specifying the radioisotopes that the individual is authorized to use and the dose limits that must not be exceeded. In the UK, this authority is the Administration of Radioactive Substances Advisory Committee (ARSAC).5 Radioisotopes should not be given to pregnant women unless the investigation is considered imperative; if an investigation is necessary during lactation, breast-feeding should be discontinued until radioactivity is no longer detectable in the milk. When radioisotope investigations are necessary in children, the dose relative to that for an adult should be based on body weight (Table 17.2).
Table 17.2 Radioisotope doses for children as a decimal fraction of the adult dose
| Weight (kg) | Fraction of adult dose |
|---|---|
| 10 | 0.3 |
| 15 | 0.4 |
| 20 | 0.5 |
| 30 | 0.6 |
| 40 | 0.75 |
| 50 | 0.9 |
| 60 | 0.95 |
| 70 | 1.0 |
The laboratory (premises) using radioisotopes should be registered to store, handle and dispose of radioactive materials, and appropriate permits are obtained under the Environmental Permitting Regulations 2010.5a
Protective gloves must always be worn when handling radioisotopes; any activity that does get on the hands can usually be removed by washing with soap and water or, if that fails, with a detergent solution. For each laboratory in which isotopes are used, a radiation protection supervisor (RPS) should be nominated to supervise protection procedures and to ensure that a careful record is kept of all administered radioisotopes. This RPS should work in association with the departmental safety officer (see p. 579) and must ensure that all personnel working with radioactive materials wear dosimetry badges (available from an approved dosimetry service provider, e.g. Landauer, Oxford; ISO Pharma, Norway), which must be checked at regular intervals.
Apparatus for Measuring Radioactivity in Vivo
Imaging
The most widely used method for imaging is by the scintillation camera (gamma camera). It consists of a lead shielding, a large thin sodium iodide detector, an array of photomultiplier tubes, a collimator with multiple parallel holes and a system for pulse height analysis and for storage and display of the data. By scanning down the body, an image of the distribution of the label is built up and recorded. It can also be used to measure the quantity of the isotope in various organs. By rotating the scintillation camera around the body, single-photon emission computed tomography (SPECT) can be performed to produce sectional images. Positron emission tomography (PET) has augmented scintillation scanning and uses radioisotopes that are positron emitters.6,7
Measurement of Radioactivity with a Scintillation Counter
Standardization of Working Conditions
For each radioisotope, it is necessary to plot a spectrum of pulse height distribution and to identify a window corresponding to the energy at which the maximum number of pulses is emitted. Examples of spectra and selected settings are illustrated in Figure 17.1. The setting of the apparatus, once determined, should remain constant for many months.
Counting Technique
Measurement of radioactivity
Measurements are usually carried out for a fixed time period and the results are recorded as counts per second (cps) or counts per minute (cpm). Radioactivity is subject to random but statistically predictable variation similar to that in blood cell counts (see p. 612). The accuracy of the count depends on the total number of the counts recorded as the variance (σ) of a radioactive count = √ total count.
Correction for Physical Decay
Because physical decay is a continuous process that proceeds at an exponential rate, it is possible to correct mathematically for the loss of radioactivity and to convert any measurement back to the initial reference time. This is necessary when comparing successive observations made at different times after the administration of a radionuclide to a patient.8
Blood volume
The haemoglobin concentration (Hb), red cell count and packed cell volume or haematocrit (PCV/Hct) do not invariably reflect the total red cell volume (RCV). Whereas in most cases for practical purposes, there is adequate correlation between peripheral blood values and (total) RCV,8 there will be a discrepancy if the plasma volume is reduced or increased disproportionately. Fluctuation in plasma volume may result in haemodilution, giving rise to pseudoanaemia, or conversely, haemoconcentration, giving rise to pseudopolycythaemia.
Measurement of Blood Volume
Principle
In contrast to measurement of RCV, plasma volume measurements are only approximations because the labelled albumin undergoes continuous slow interchange between the plasma and extravascular fluids, even during the mixing period. For this reason, it is undesirable to attempt to calculate RCV from plasma volume on the basis of the observed PCV. However, because the RCV is generally more stable, calculation of TBV from RCV is usually more reliable, provided that the difference between whole-body and venous PCV is appreciated and allowed for (see p. 379). Measurement of red cell and plasma volumes separately by direct methods is to be preferred.
Red Cell Volume
Radioactive Chromium Method
For the radioactive chromium method,9 add approximately 10 ml of blood to 1.5 ml of sterile National Institutes of Health (NIH)-A acid–citrate–dextrose (ACD) solution (see p. 619) in a sterile bottle with a screw cap. Centrifuge at 1200–1500 g for 5 min. Discard the supernatant plasma and buffy coat and slowly, with continuous mixing, add to the cells 8 × 10³ Bq of Na251CrO4 per kg of body weight. The sodium chromate should be in a volume of at least 0.2 ml, being diluted in 9 g/l NaCl (saline). Allow the blood to stand for 15 min at 37°C for labelling to take place. Wash the red cells twice in 4–5 volumes of sterile saline: for all procedures requiring sterile saline, this should be 9 g/l (0.9%) sodium chloride BP (non-pyrogenic); 12 g/l NaCl should be used when red cell osmotic fragility is greatly increased (e.g. in cases of hereditary spherocytosis).
Measure the PCV of each sample. PCV should be obtained by microhaematocrit centrifugation for 5 min or for 10 min if the PCV is more than 0.50 and correcting for trapped plasma by deducting 2% from the measurement. A more accurate measurement of the PCV can be obtained by the International Council for Standardization in Haematology (ICSH) surrogate reference method (see p. 30).
Technetium Method
Indium is available as 111In chloride. The labelling procedure is simpler than with 99mTc and, because there is less elution than with technetium during the first hour,10 it is particularly suitable for delayed sampling. For labelling blood cells, the indium is complexed with oxine11 or tropolone.12
Plasma Volume
Calculating Total Blood Volume
Whole-body and venous packed cell volume ratio
PCV measured on venous blood is not identical to the average PCV of all the blood in the body. This is mainly because the red cell:plasma ratio is less in small blood vessels (capillaries, arterioles and venules) than in large vessels. The ratio between the whole-body PCV and venous blood PCV is normally about 0.9,9 and it is thus necessary in the calculation of TBV from measurements of RCV to multiply the observed PCV by 0.9. Thus, TBV is given by the following:
Simultaneous Measurement of Red Cell Volume and Plasma Volume
Collect blood and label the red cells by one of the methods described earlier. If 99m
[/not-level-membership-for-hematology-oncology-and-palliative-medicine-category]
