269e |
Atlas of Electrocardiography |
The electrocardiograms (ECGs) in this atlas supplement those illustrated in Chap. 268. The interpretations emphasize findings of specific teaching value.
All of the figures are from ECG Wave-Maven, Copyright 2003, Beth Israel Deaconess Medical Center, http://ecg.bidmc.harvard.edu.
The abbreviations used in this chapter are as follows:
AF—atrial fibrillation
HCM—hypertrophic cardiomyopathy
LBBB—left bundle branch block
LVH—left ventricular hypertrophy
MI—myocardial infarction
RBBB—right bundle branch block
RV—right ventricular
RVH—right ventricular hypertrophy
SR—sinus rhythm
MYOCARDIAL ISCHEMIA AND INFARCTION
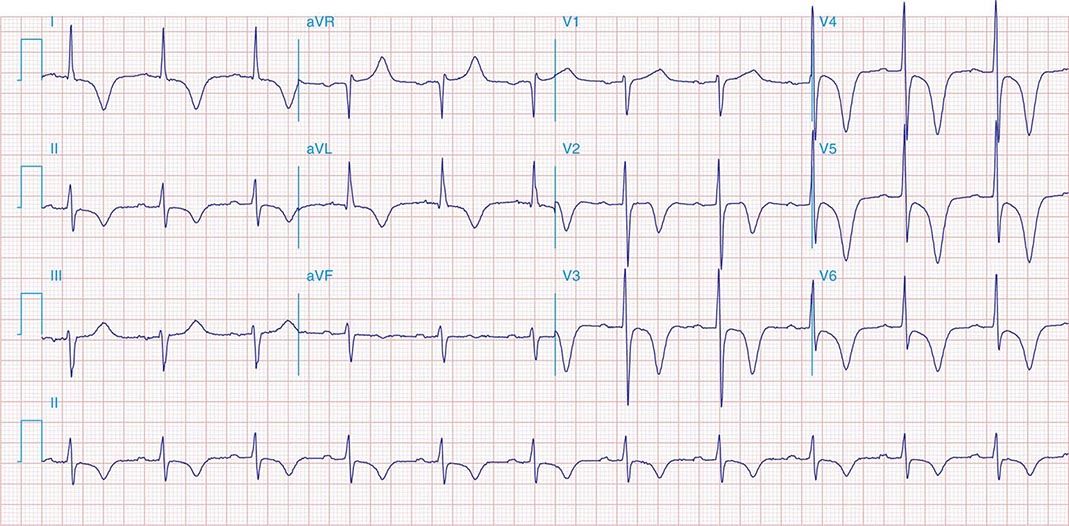
FIGURE 269e-1 Anterior wall ischemia (deep T-wave inversions and ST-segment depressions in I, aVL, V3–V6) in a patient with LVH (increased voltage in V2–V5).
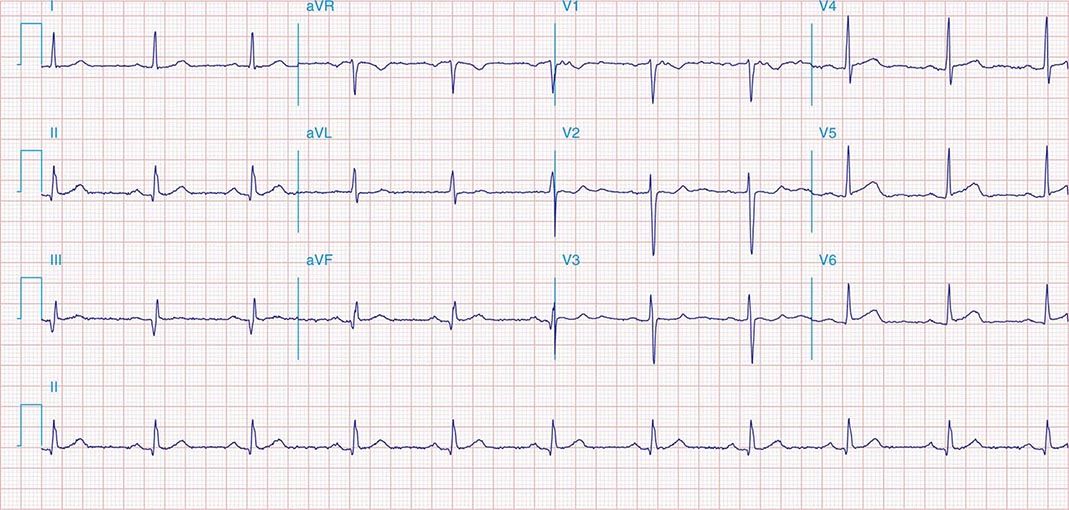
FIGURE 269e-2 Acute anterolateral wall ischemia with ST elevations in V4–V6. Probable prior inferior MI with Q waves in leads II, III, and aVF.

FIGURE 269e-3 Acute lateral ischemia with ST elevations in I and aVL with probable reciprocal ST depressions inferiorly (II, III, and aVF). Ischemic ST depressions also in V3 and V4. Left atrial abnormality.
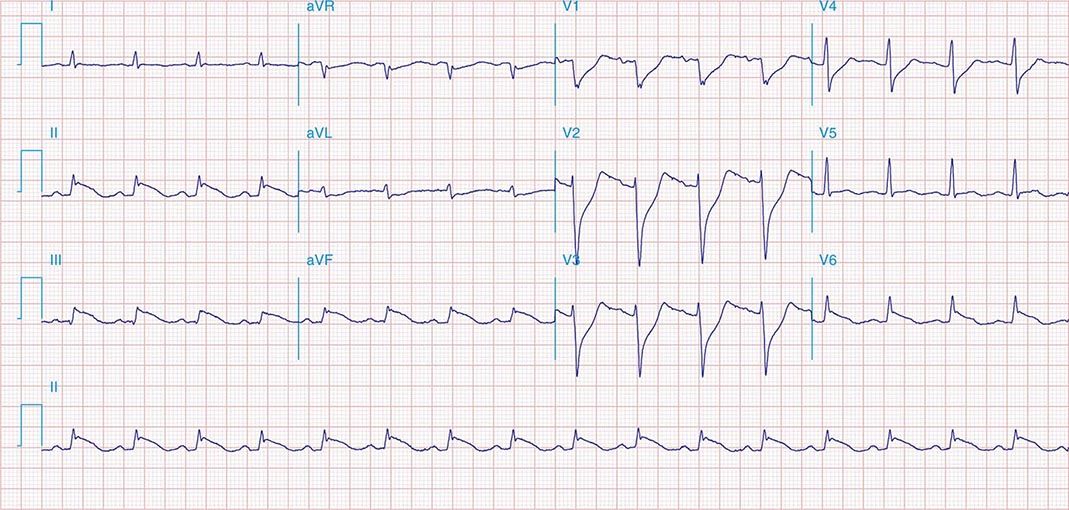
FIGURE 269e-4 Sinus tachycardia. Marked ischemic ST-segment elevations in inferior limb leads (II, III, aVF) and laterally (V6) suggestive of acute inferolateral MI, and prominent ST-segment depressions with upright T waves in V1–V4 are consistent with associated acute posterior MI.
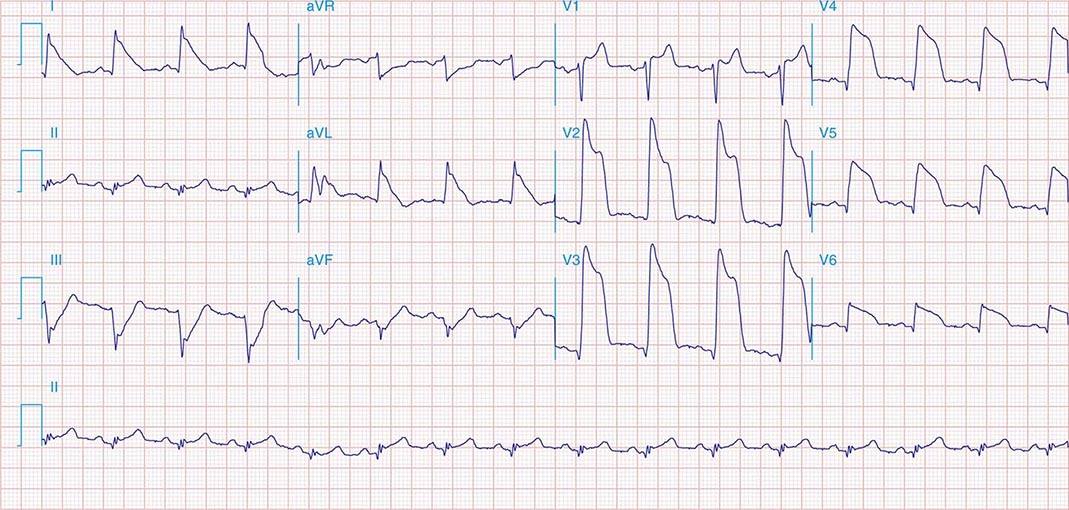
FIGURE 269e-5 Acute, extensive anterior MI with marked ST elevations in I, aVL, V1–V6 and low amplitude pathologic Q waves in V3–V6. Marked reciprocal ST-segment depressions in III and aVF.

FIGURE 269e-6 Acute anterior wall MI with ST elevations and Q waves in V1–V4 and aVL and reciprocal inferior ST depressions.
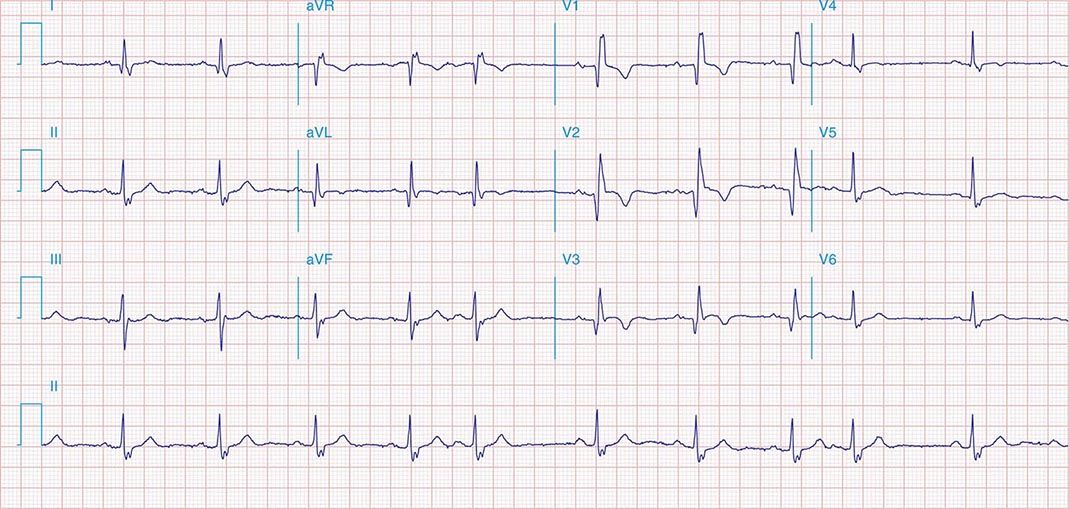
FIGURE 269e-7 SR with premature atrial complexes. RBBB; pathologic Q waves and ST elevation due to acute anterior/septal MI in V1–V3.
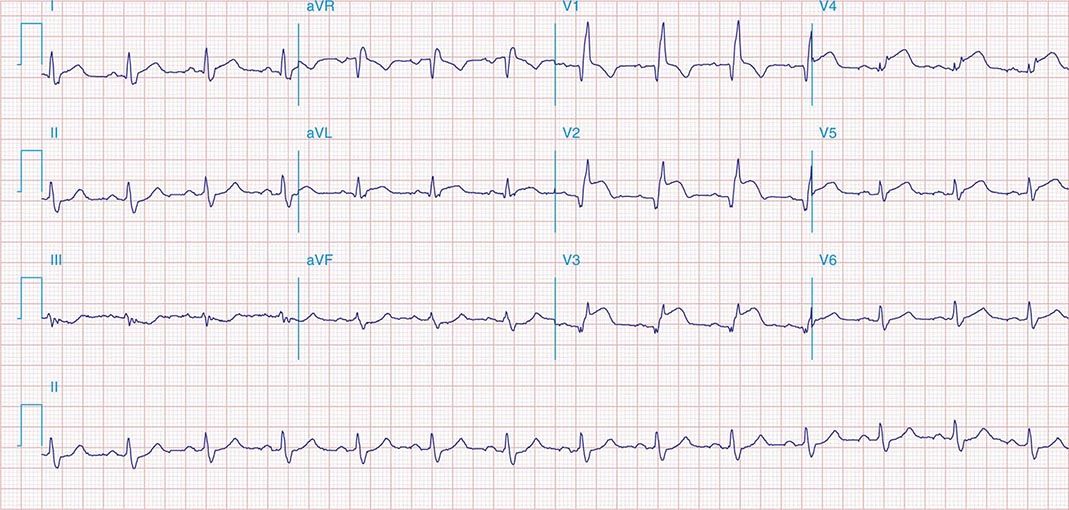
FIGURE 269e-8 Acute anteroseptal MI (Q waves and ST elevations in V1–V4) with RBBB (note terminal R waves in V1).
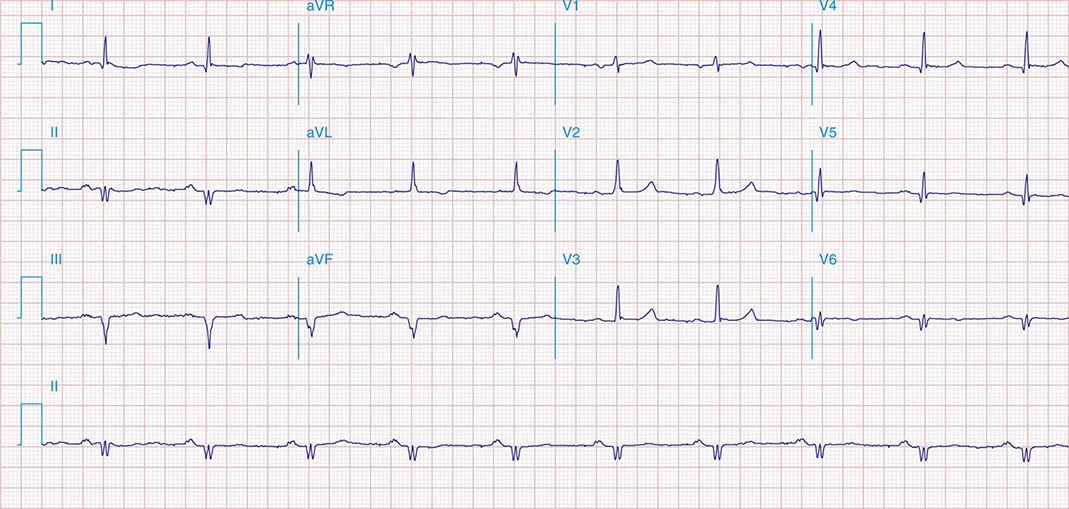
FIGURE 269e-9 Extensive prior MI involving inferior-posterior-lateral wall (Q waves in leads II, III, aVF, tall R waves in V1, V2, and Q waves in V5, V6). T-wave abnormalities in leads I and aVL, V5, and V6.
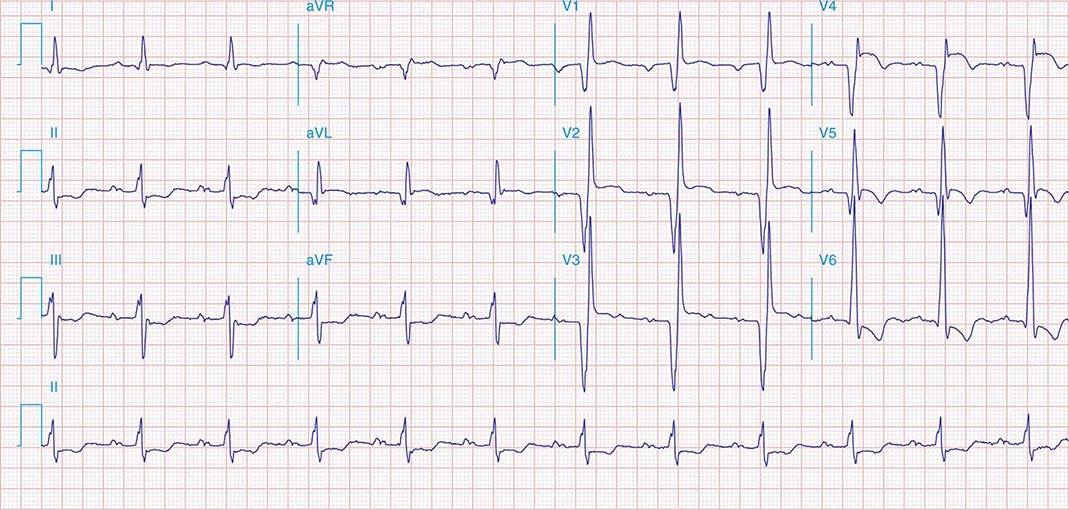
FIGURE 269e-10 SR with PR prolongation (“first-degree AV block”), left atrial abnormality, LVH, and RBBB. Pathologic Q waves in V1–V5 and aVL with ST elevations (a chronic finding in this patient). Findings compatible with prior anterolateral MI and left ventricular aneurysm.
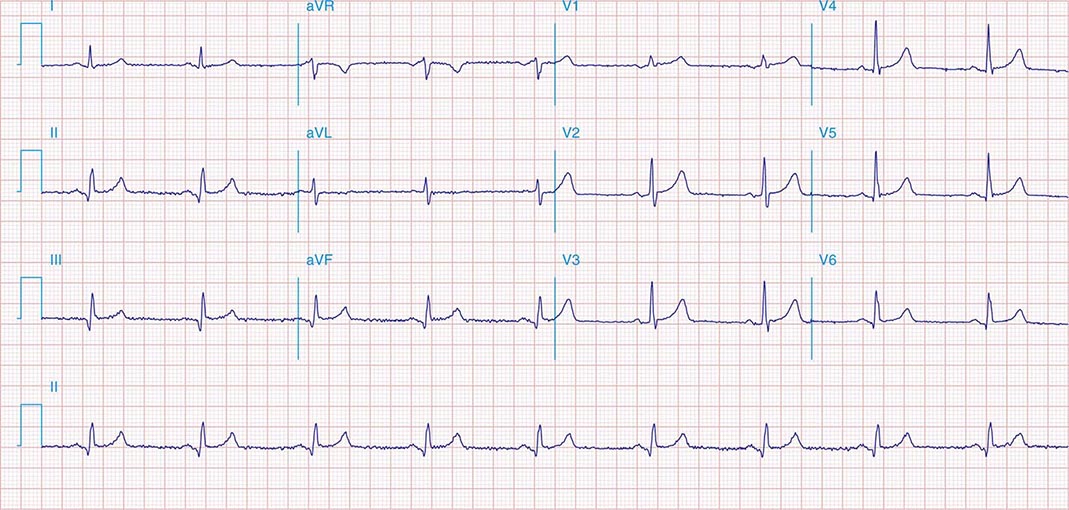
FIGURE 269e-11 Prior inferior-posterior MI. Wide (0.04 s) Q waves in the inferior leads (II, III, aVF); broad R wave in V1 (a Q wave “equivalent” here). Absence of right-axis deviation and the presence of upright T waves in V1–V2 are also against RVH.
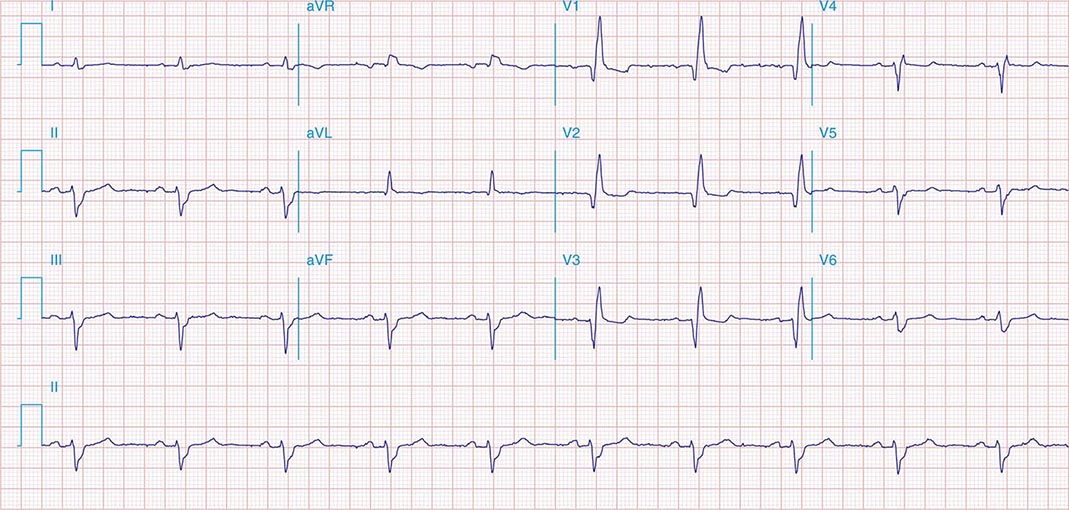
FIGURE 269e-12 SR with RBBB (broad terminal R wave in V1) and left anterior fascicular block (hemiblock) and pathologic anterior Q waves in V1–V3. Patient had severe multivessel coronary artery disease, with echocardiogram showing septal dyskinesis and apical akinesis.
PERICARDITIS
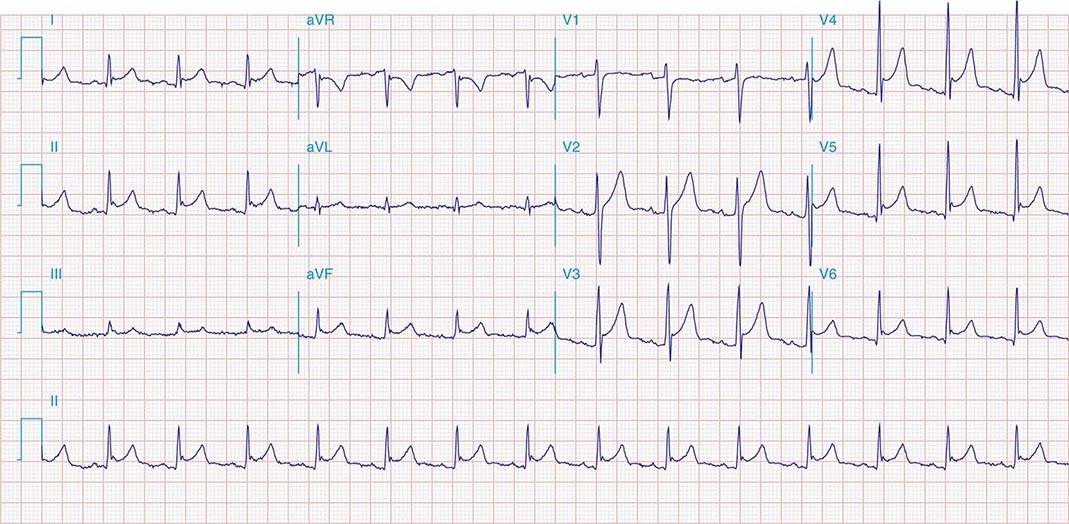
FIGURE 269e-13 Acute pericarditis with diffuse ST elevations in I, II, III, aVF, V3–V6, without T-wave inversions. Also note concomitant PR-segment elevation in aVR and PR depression in the inferolateral leads.
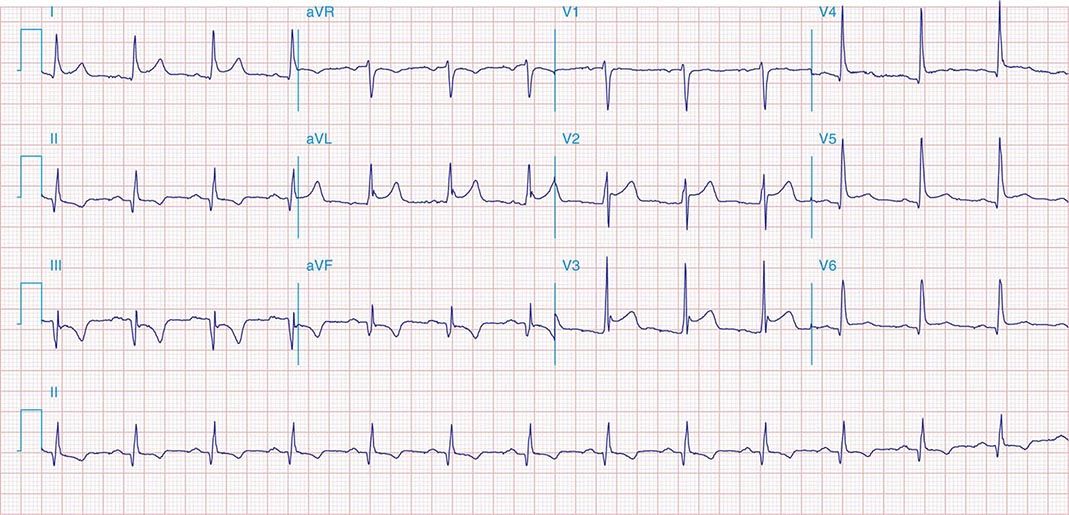
FIGURE 269e-14 SR; diffuse ST elevations (I, II, aVL, aVF, V2–V6) with associated PR deviations (elevated PR in aVR; depressed in V4–V6); borderline low voltage. Q-wave and T-wave inversions in II, III, and aVF. Diagnosis: acute pericarditis with inferior Q-wave MI.
VALVULAR HEART DISEASE AND HYPERTROPHIC CARDIOMYOPATHY
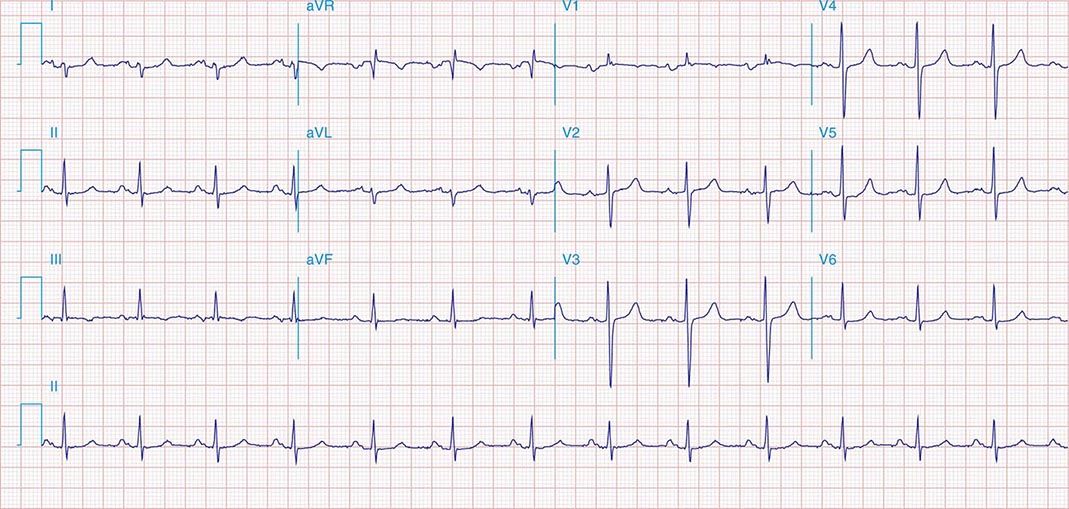
FIGURE 269e-15 SR, prominent left atrial abnormality (see I, II, V1), right-axis deviation, and RVH (tall, relatively narrow R wave in V1) in a patient with mitral stenosis.
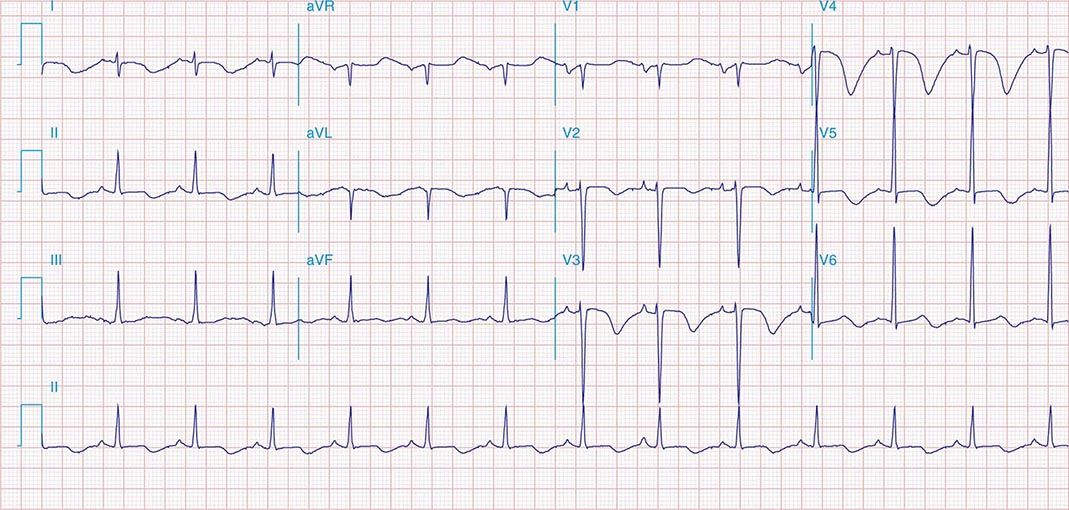
FIGURE 269e-16 SR, left atrial abnormality, and LVH by voltage criteria with borderline right-axis deviation in a patient with mixed mitral stenosis (left atrial abnormality and right-axis deviation) and mitral regurgitation (LVH). Prominent precordial T-wave inversions and QT prolongation also present.
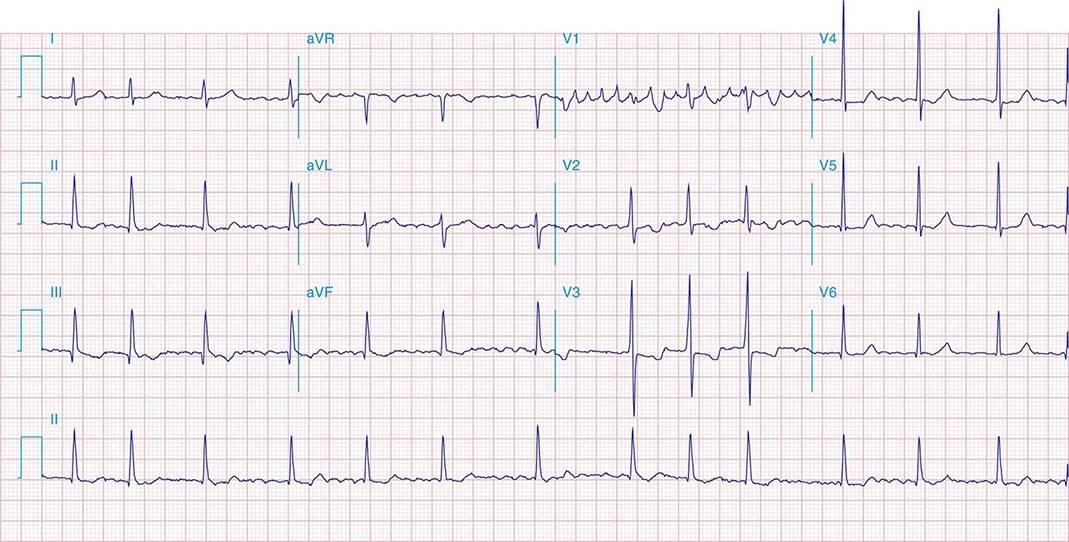
FIGURE 269e-17 Coarse AF, tall R in V2 with vertical QRS axis (positive R in aVF) indicating RVH. Tall R in V4 may be due to concomitant LVH. Patient had severe mitral stenosis with moderate mitral regurgitation.
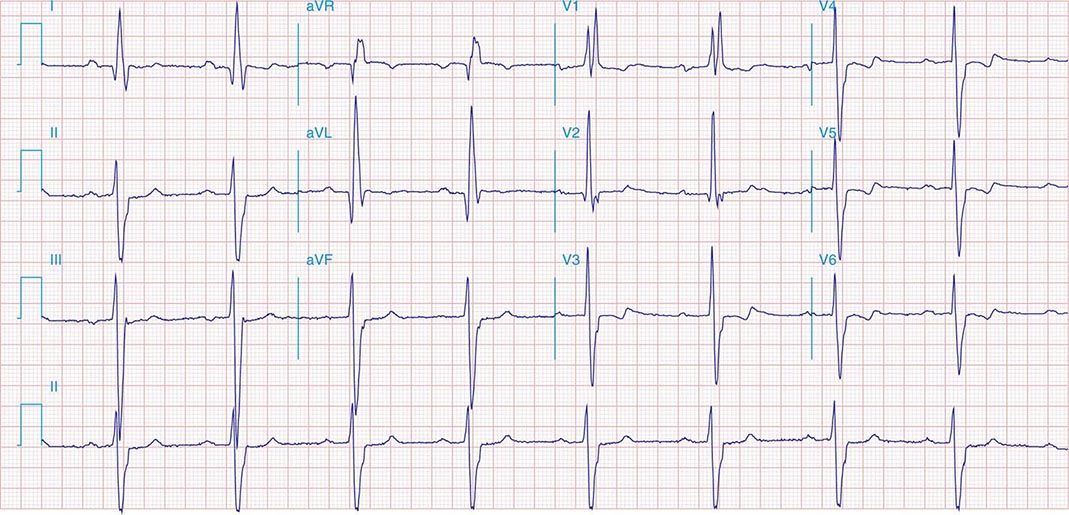
FIGURE 269e-18 SR; first-degree AV “block” (PR prolongation); LVH (tall R in aVL); RBBB (wide multiphasic R wave in V1) and left anterior fascicular block in a patient with HCM. Deep Q waves in I and aVL are consistent with septal hypertrophy.
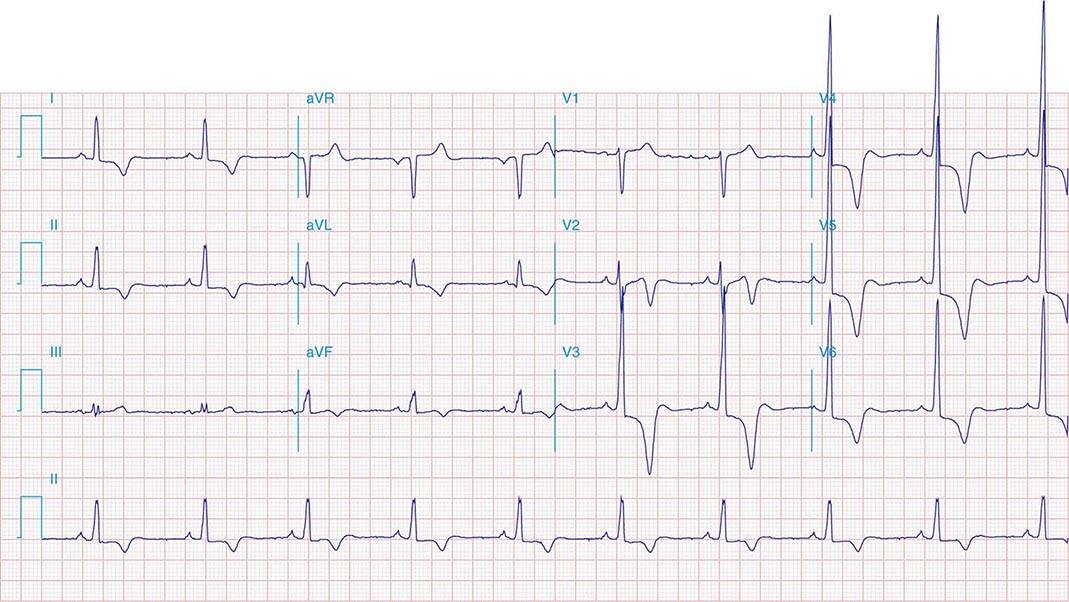
FIGURE 269e-19 LVH with deep T-wave inversions in limb leads and precordial leads. Striking T-wave inversions in mid-precordial leads suggest apical HCM (Yamaguchi’s syndrome).
PULMONARY EMBOLISM AND CHRONIC PULMONARY HYPERTENSION
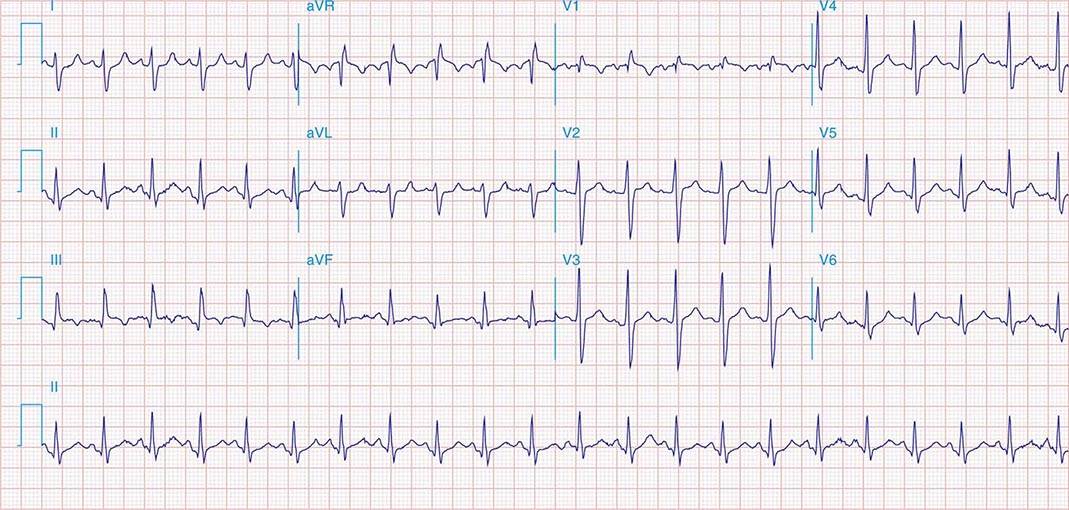
FIGURE 269e-20 Sinus tachycardia with S1Q3T3 pattern (T-wave inversion in III), incomplete RBBB, and right precordial T-wave inversions consistent with acute RV overload in a patient with pulmonary emboli.
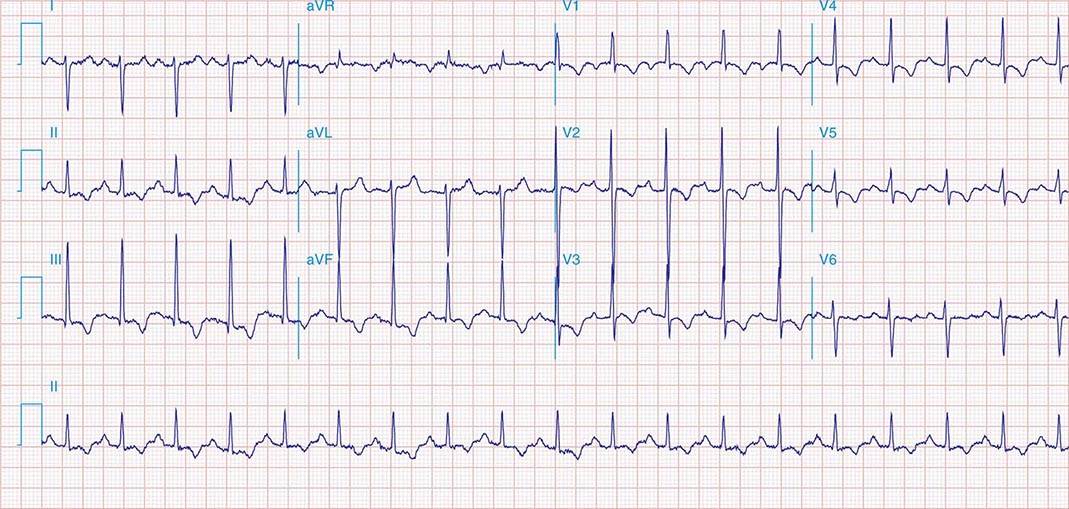
FIGURE 269e-21 Sinus tachycardia, right-axis deviation, RVH with tall R in V1 and deep S in V6, and inverted T waves in II, III, aVF, and V1–V5 in a patient with atrial septal defect and severe pulmonary hypertension.
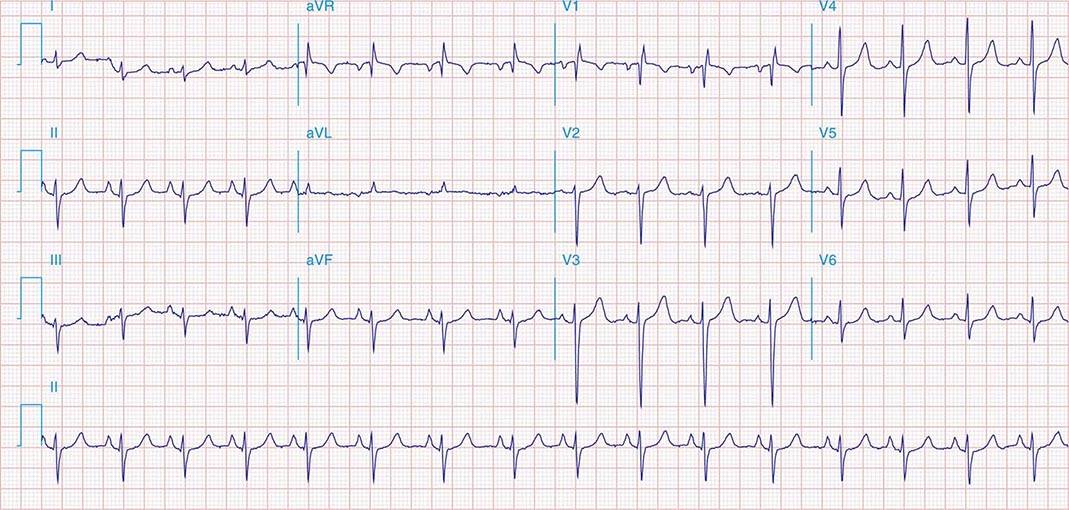
FIGURE 269e-22 Signs of right atrial/RV overload in a patient with chronic obstructive lung disease: (1) peaked P waves in II; (2) QR in V1 with narrow QRS; (3) delayed precordial transition, with terminal S waves in V5/V6; (4) superior axis deviation with an S1-S2-S3 pattern.
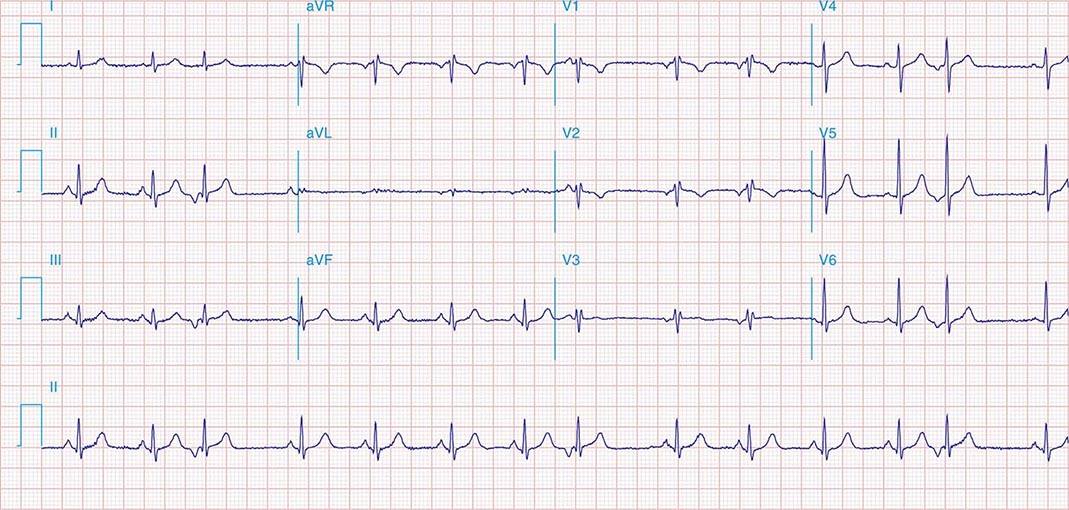
FIGURE 269e-23 (1) Low voltage; (2) incomplete RBBB (rsr′ in V1–V3); (3) borderline peaked P waves in lead II with vertical P-wave axis (probable right atrial overload); (4) slow R-wave progression in V1–V3; (5) prominent S waves in V6; and (6) atrial premature beats. This combination is seen typically in severe chronic obstructive lung disease.
ELECTROLYTE DISORDERS
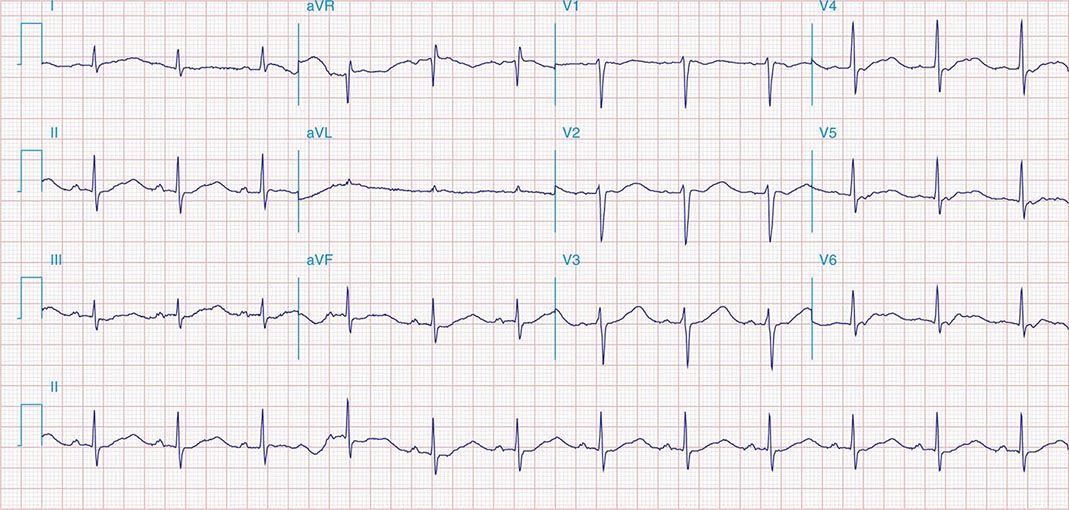
FIGURE 269e-24 Prominent U waves (II, III, and V4–V6) with ventricular repolarization prolongation in a patient with severe hypokalemia.
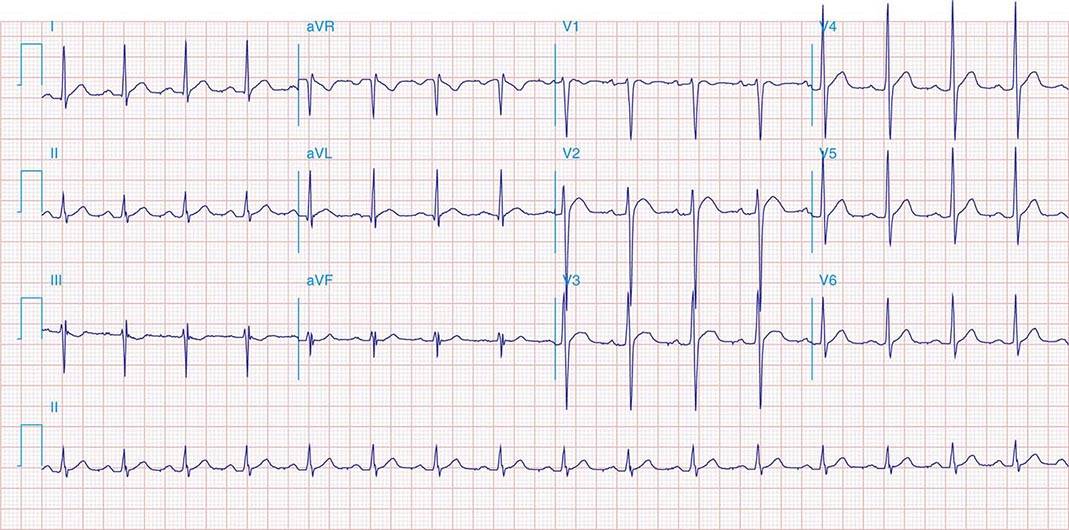
FIGURE 269e-25 Abbreviated ST segment such that the T wave looks like it takes off directly from QRS in some leads (I, V4, aVL, and V5) in a patient with severe hypercalcemia. Note also high takeoff of ST segment in V2/V3 simulating acute ischemia.
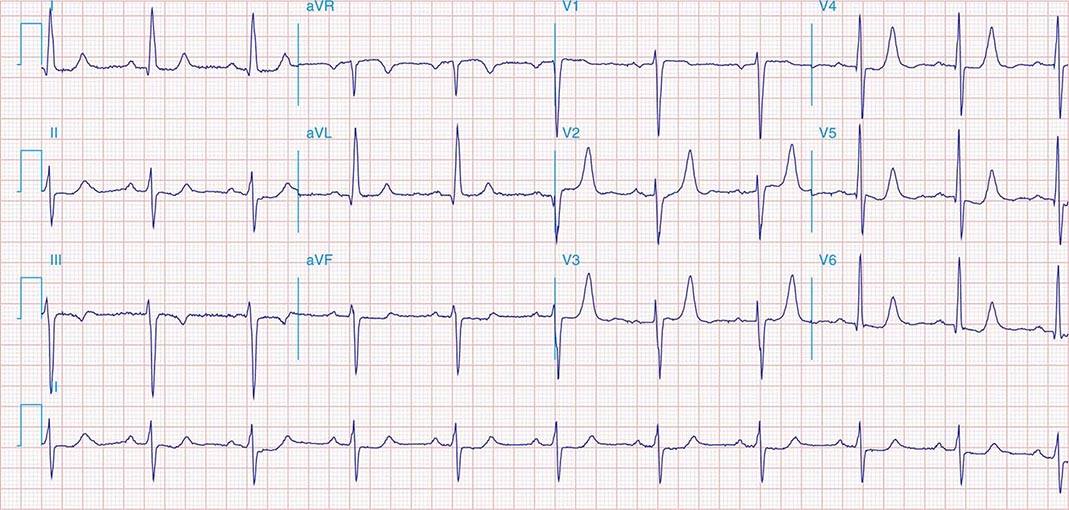
FIGURE 269e-26 SR with LVH, left atrial abnormality, and tall peaked T waves in the precordial leads with inferolateral ST depressions (II, III, aVF, and V6); left anterior fascicular block and borderline prolonged QT interval in a patient with renal failure, hypertension, and hyperkalemia; prolonged QT is secondary to associated hypocalcemia.
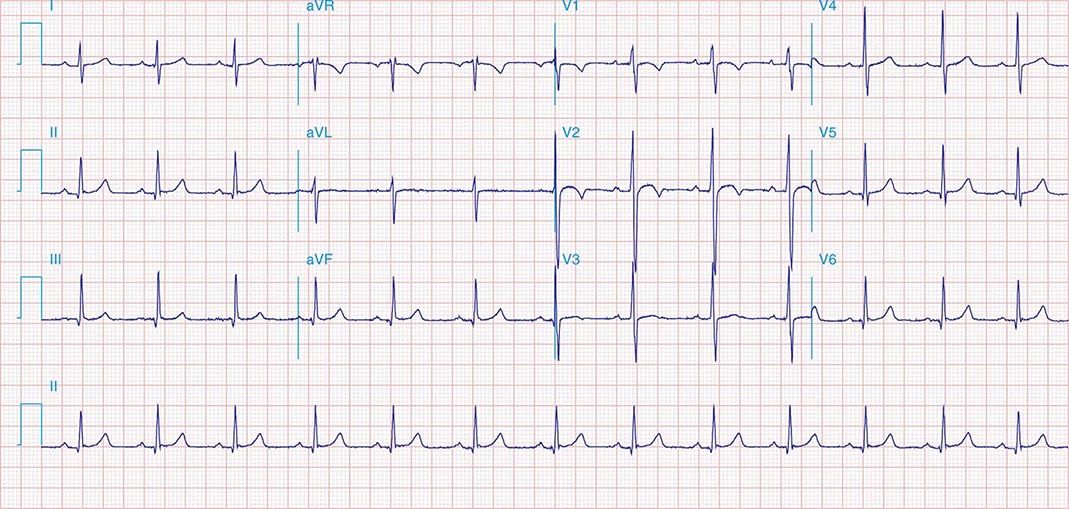
FIGURE 269e-27 Normal ECG in an 11-year-old male. T-wave inversions in V1–V2. Vertical QRS axis (+90°) and early precordial transition between V2 and V3 are normal findings in children.
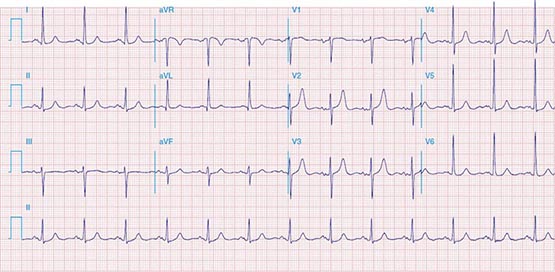
FIGURE 269e-28 Left atrial abnormality and LVH in a patient with long-standing hypertension.
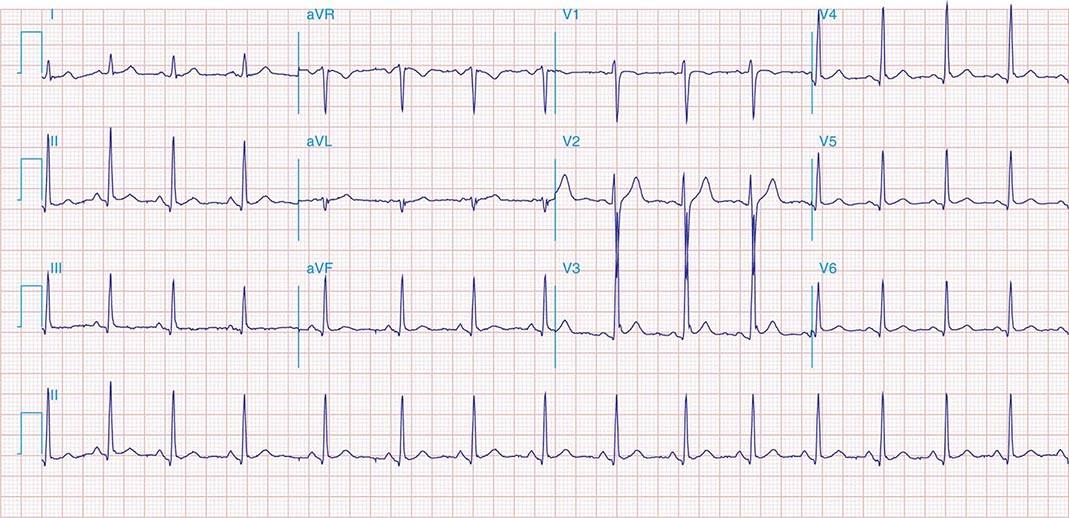
FIGURE 269e-29 Normal variant ST-segment elevations in a healthy 21-year-old male (commonly referred to as benign early repolarization pattern). ST elevations exhibit upward concavity and are most apparent in V3 and V4, and less than 1 mm in the limb leads. Precordial QRS voltages are prominent, but within normal limits for a young adult. No evidence of left atrial abnormality or ST depression/T-wave inversions to go along with LVH.
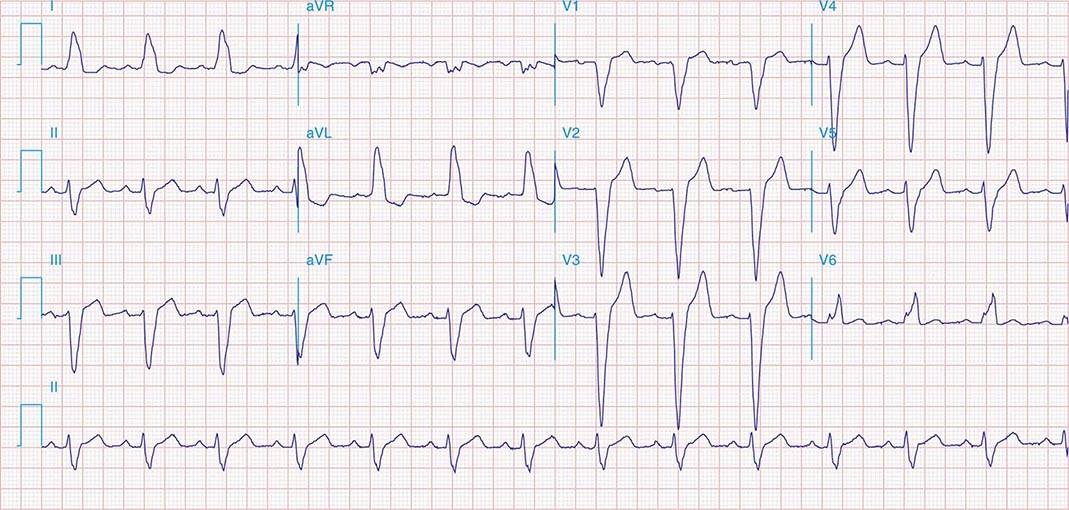
FIGURE 269e-30 SR with first-degree AV “block” (PR interval = 0.24 s) and complete LBBB.
MISCELLANEOUS
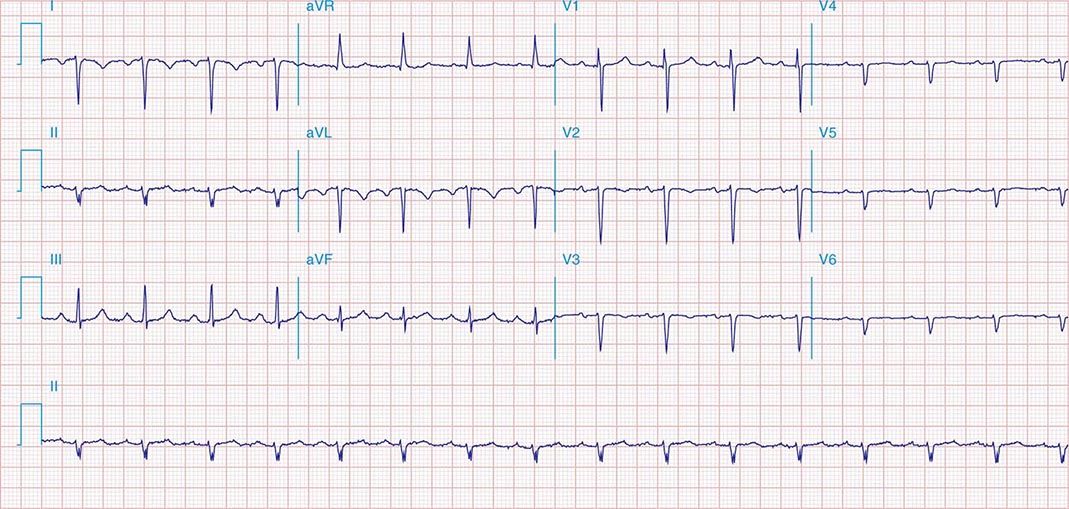
FIGURE 269e-31 Dextrocardia with: (1) inverted P waves in I and aVL; (2) negative QRS complex and T wave in I; and (3) progressively decreasing voltage across the precordium.
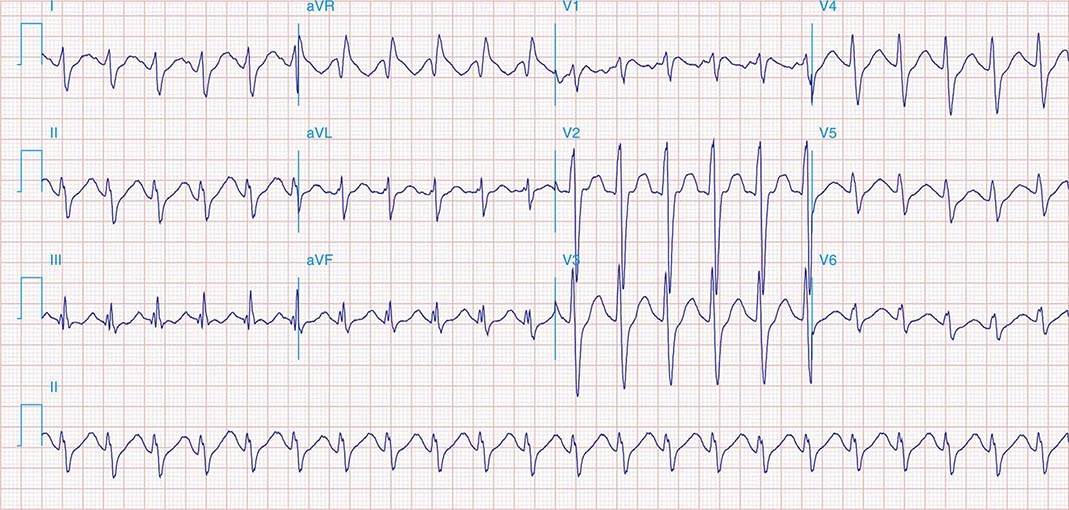
FIGURE 269e-32 Sinus tachycardia; intraventricular conduction delay (IVCD) with a rightward QRS axis. QT interval is prolonged for the rate. The triad of sinus tachycardia, a wide QRS complex, and a long QT in appropriate clinical context suggests tricyclic antidepressant overdose. Terminal S wave (rS) in I and terminal R wave (qR) in aVR are also noted as part of this IVCD variant.
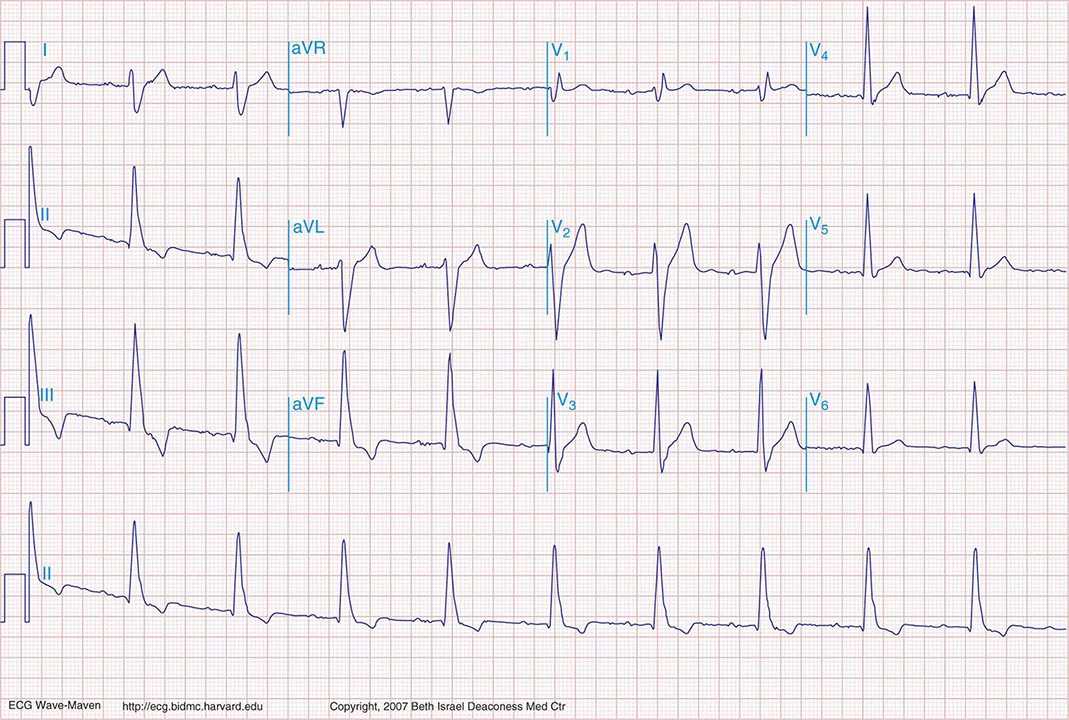
FIGURE 269e-33 Borderline sinus bradycardia (59 beats/min), prolonged PR interval (250 ms), and RBBB are present with marked right-axis deviation (RAD), the latter consistent with left posterior fascicular block (LPFB). LPFB is a diagnosis of exclusion, which requires ruling out lead reversal, normal variant, RV overload syndromes, or lateral MI, in particular, as causes of the RAD. This ECG also shows nondiagnostic Q waves in the inferior leads. In concert with RBBB, the LPFB indicates bifascicular block. (From LA Nathanson et al: ECG Wave-Maven. http://ecg.bidmc.harvard.edu.)
270e |
Noninvasive Cardiac Imaging: Echocardiography, Nuclear Cardiology, and Magnetic Resonance/Computed Tomography Imaging |
The ability to image the heart and blood vessels noninvasively has been one of the greatest advances in cardiovascular medicine since the development of the electrocardiogram. Cardiac imaging complements history taking and physical examination, blood and laboratory testing, and exercise testing in the diagnosis and management of most diseases of the cardiovascular system. Modern cardiovascular imaging consists of echocardiography (cardiac ultrasound), nuclear scintigraphy including positron emission tomography (PET) imaging, magnetic resonance imaging (MRI), and computed tomography (CT). These studies, often used in conjunction with exercise testing, can be used independently or in concert depending on the specific diagnostic needs. In this chapter, we review the principles of each of these modalities and the utility and relative benefits of each for the most common cardiovascular diseases.
PRINCIPLES OF MULTIMODALITY CARDIAC IMAGING
ECHOCARDIOGRAPHY
Echocardiography uses high-frequency sound waves (ultrasound) to penetrate the body, reflect from relevant structures, and generate an image. The basic physical principles of echocardiography are identical to other types of ultrasound imaging, although the hardware and software are optimized for evaluation of cardiac structure and function. Early echocardiography machines displayed “M-mode” echocardiograms in which a single ultrasound beam was displayed over time on a moving sheet of paper (Fig. 270e-1, left panel). Modern echocardiographic machinery uses phased array transducers that contain up to 512 elements and emit ultrasound in sequence. The reflected ultrasound is then sensed by the receiving elements. A “scan converter” uses information about the timing and magnitude of the reflected ultrasound to generate an image (Fig. 270e-1, right panel). This sequence happens repeatedly in “real time” to generate moving images with frame rates that are typically greater than 30 frames per second, but can exceed 100 frames per second. The gray scale of the image features indicates the intensity of the reflected ultrasound; fluid or blood appears black, and highly reflective structures, such as calcifications on cardiac valves or the pericardium, appear white. Tissues such as myocardium appear more gray, and tissues such as muscle display a unique speckle pattern. Although M-mode echocardiography has largely been supplanted by two-dimensional echocardiography, it is still used because of its high temporal resolution and accuracy for making linear measurements.
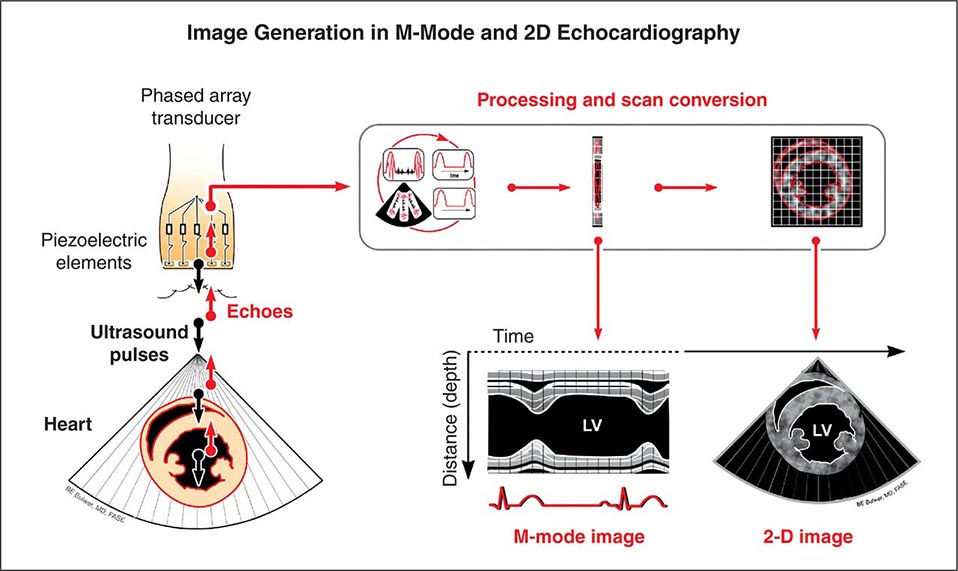
FIGURE 270e-1 Principle of image generation in two-dimensional (2D) echocardiography. An electronically steerable phased-array transducer emits ultrasound from piezoelectric elements, and returning echoes are used to generate a 2D image (right) using a scan converter. Early echocardiography machines used a single ultrasound beam to generate an “M-mode” echocardiogram (see text), although modern equipment generates M-mode echocardiograms digitally from the 2D data. LV, left ventricle.
The spatial resolution of ultrasound is dependent on the wavelength: the smaller the wavelength and the higher the frequency of the ultrasound beam, the greater are the spatial resolution and ability to discern small structures. Increasing the frequency of ultrasound will increase resolution but at the expense of reduced penetration. Higher frequencies can be used in pediatric imaging or transesophageal echocardiography where the transducer can be much closer to the structures being interrogated, and this is a rationale for using transesophageal echocardiography to obtain higher quality images.
Three-dimensional ultrasound transducers use a waffle-like matrix array transducer and receive a pyramidal data sector. Three-dimensional echocardiography is being increasingly used for assessment of congenital heart disease and valves, although current image quality lags behind two-dimensional ultrasound (Fig. 270e-2).
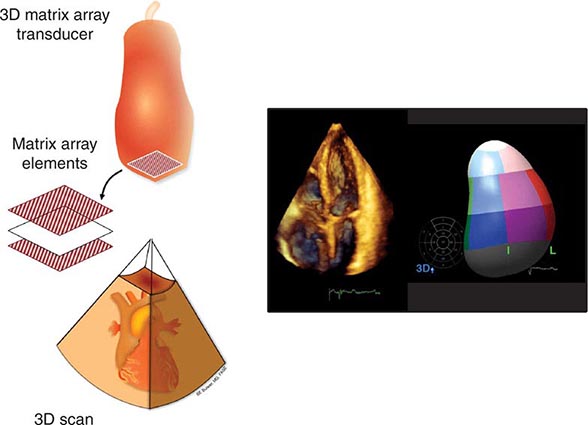
FIGURE 270e-2 Three-dimensional (3D) probe and 3D image.
In addition to the generation of two-dimensional images that provide information about cardiac structure and function, echocardiography can be used to interrogate blood flow within the heart and blood vessels by using the Doppler principle to ascertain the velocity of blood flow. When ultrasound emitted from a transducer reflects off red blood cells that are moving toward the transducer, the reflected ultrasound will return at a slightly higher frequency than emitted; the opposite is true when flow is away from the transducer. That frequency difference, termed the Doppler shift, is directly related to the velocity of the flow of the red blood cells. The velocity of blood flow between two chambers will be directly related to the pressure gradient between those chambers. A modified form of the Bernoulli equation,
p = 4v2
where p = the pressure gradient and v = the velocity of blood flow in meters per second, can be used to calculate this pressure gradient in the majority of clinical circumstances. This principle can be used to determine the pressure gradient between chambers and across valves and has become central to the quantitative assessment of valvular heart disease.
There are three types of Doppler ultrasound that are typically used in standard echocardiographic examinations: spectral Doppler, which consists of both pulsed wave Doppler and continuous wave Doppler, and color flow Doppler. Both types of spectral Doppler will display a waveform representing the velocity of blood flow, with time on the horizontal axis and velocity on the vertical axis. Pulsed wave Doppler is used to interrogate relatively low velocity flow and has the ability to determine blood flow velocity at a particular location within the heart. Continuous wave Doppler is used to assess high-velocity flow but can only identify the highest velocity in a particular direction and cannot interrogate the velocity at a specific depth location. Both of these techniques can only accurately assess velocities that are in the direction of the ultrasound scan lines, and velocities that are at an angle to the direction of the ultrasound beam will be underestimated. Color flow Doppler is a form of pulsed wave Doppler in which the velocity of blood flow is color encoded according to a scale and superimposed on a two-dimensional grayscale image in real time, giving the appearance of real-time flow within the heart. The Doppler principle can also be used to assess the velocity of myocardial motion, which is a sensitive way to assess myocardial function (Fig. 270e-3). A standard full transthoracic echocardiographic examination consists of a series of two-dimensional views made up of different imaging planes from various scanning locations and spectral and color flow Doppler assessment.
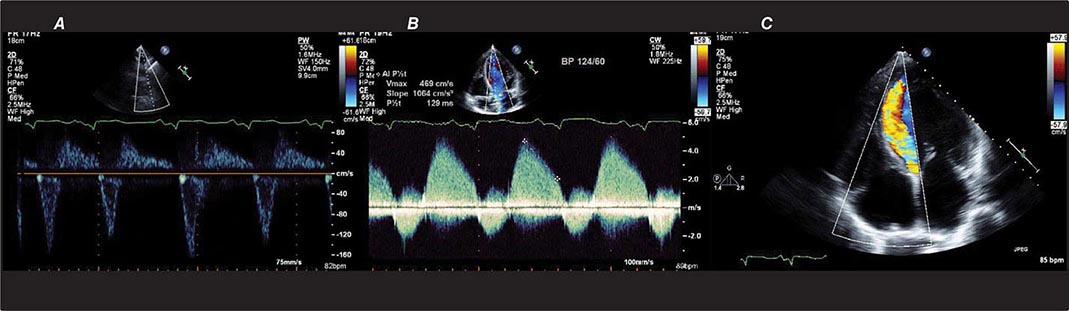
FIGURE 270e-3 Three types of Doppler ultrasound. A and B. Pulsed and continuous wave Doppler waveforms with time on horizontal axis and velocity of blood flow on vertical axis. C. Color flow Doppler, where velocities are encoded by colors according to scale on right side of screen and superimposed on a two-dimensional grayscale image.
Transesophageal echocardiography is a form of echocardiography in which the transducer is located on the tip of an endoscope that can be inserted into the esophagus. This procedure allows closer, less obstructed views of cardiac structures, without having to penetrate through chest wall, muscle, and ribs. Because less penetration is needed, a higher frequency probe can be used, and image quality and spatial resolution are generally higher than with standard transthoracic imaging, particularly for structures that are more posterior. Transesophageal echocardiography has become the test of choice for assessment of small lesions in the heart such as valvular vegetations, especially in the setting of a prosthetic valve disease, and intracardiac thrombi, including assessment of the left atrial appendage, which is difficult to visualize with standard transthoracic imaging, and for assessment of congenital abnormalities. Transesophageal echocardiography requires both topical and systemic anesthesia, generally conscious sedation, and carries additional risks such as potential damage to the esophagus, including the rare possibility of perforation, aspiration, and anesthesia-related complications. Patients generally need to give consent for transesophageal echocardiography and be monitored during and subsequent to the procedure. Transesophageal echocardiography can be carried out in intubated patients and is routinely used for intraoperative monitoring during cardiac surgery.
Stress echocardiography is routinely used to assess cardiac function during exercise and can be used to identify myocardial ischemia or to assess valvular function under exercise conditions. Stress echocardiography is typically performed in conjunction with treadmill or bicycle exercise testing, but can also be performed using pharmacologic stress most typically with an intravenous infusion of dobutamine (see section on stress imaging below).
Whereas typical echocardiographic equipment is large, bulky, and expensive, small hand-held ultrasound equipment developed over the last decade now offers diagnostic quality imaging in a package small enough to be carried on rounds (Fig. 270e-4). These relatively inexpensive point-of-care devices currently lack full diagnostic capabilities but represent an excellent screening tool if used by an experienced operator. As these units become even smaller and less expensive, they are being increasingly used not just by cardiologists, but also by emergency medicine physicians, intensivists, anesthesiologists, and internists.
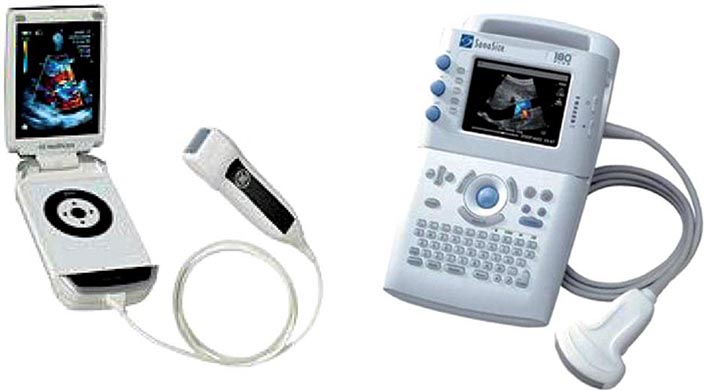
FIGURE 270e-4 Two examples of hand-held ultrasound equipment: V-Scan (General Electric, left) and Sonosite (right).
RADIONUCLIDE IMAGING
Radionuclide imaging techniques are commonly used for the evaluation of patients with known or suspected coronary artery disease (CAD), including for initial diagnosis and risk stratification as well as the assessment of myocardial viability. These techniques use small amounts of radiopharmaceuticals (Table 270e-1), which are injected intravenously and trapped in the heart and/or vascular cells. Radioactivity within the heart and vasculature decays by emitting gamma rays. The interaction between these gamma rays and the detectors in specialized scanners (single-photon emission computed tomography [SPECT] and PET) creates a scintillation event or light output, which can be captured by digital recording equipment to form an image of the heart and vasculature. Like CT and MRI, radionuclide images also generate tomographic (three-dimensional) views of the heart and vasculature.
|
RADIOPHARMACEUTICALS FOR CLINICAL NUCLEAR CARDIOLOGY |
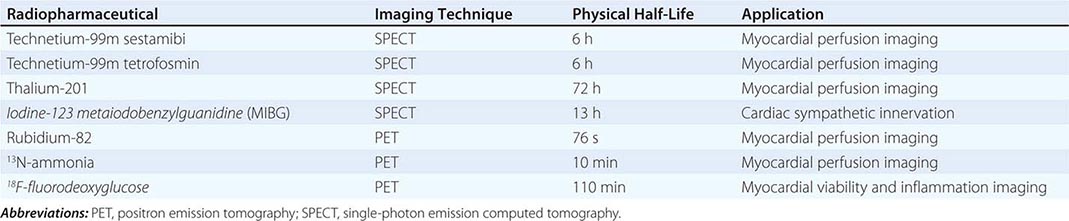
Radiopharmaceuticals Used in Clinical Imaging Table 270e-1 summarizes the most commonly used radiopharmaceuticals in clinical SPECT and PET imaging.
Protocols for Stress Myocardial Perfusion Imaging Both exercise and pharmacologic stress can be used for myocardial perfusion imaging. Exercise stress is generally preferred because it is physiologic and provides additional clinically important information (i.e., clinical and hemodynamic responses, ST-segment changes, exercise duration, and functional status). However, submaximal effort will lower the sensitivity of the test and should be avoided, especially if the test is requested for initial diagnosis of CAD. In patients who are unable to exercise or who exercise submaximally, pharmacologic stress offers an adequate alternative to exercise stress testing. Pharmacologic stress can be accomplished either with coronary vasodilators, such as adenosine, dipyridamole, or regadenoson, or β1-receptor agonists, such as dobutamine. For patients unable to exercise, vasodilators are the most commonly used stressors in combination with myocardial perfusion imaging. Dobutamine is a potent β1-receptor agonist that increases myocardial oxygen demand by augmenting contractility, heart rate, and blood pressure similar to exercise. It is generally used as an alternative to vasodilator stress in patients with chronic pulmonary disease, in whom vasodilators may be contraindicated. Dobutamine is also commonly used as a pharmacologic alternative to stress testing in stress echocardiography.
Myocardial Perfusion and Viability Imaging Protocols Imaging protocols are tailored to the individual patient based on the clinical question, patient’s risk, ability to exercise, body mass index, and other factors.
For SPECT imaging, technetium-99m (99mTc)-labeled tracers are the most commonly used imaging agents because they are associated with the best image quality and the lowest radiation dose to the patient (Fig. 270e-5). Selection of the protocol (stress-only, single-day, or 2-day) depends on the patient and clinical question. After intravenous injection, myocardial uptake of 99mTc-labeled tracers is rapid (1–2 min). After uptake, these tracers become trapped intracellularly in mitochondria and show minimal change over time. This is why 99mTc tracers can be helpful in patients with chest pain of unclear etiology occurring at rest, because patients can be injected while having chest pain and imaged some time later after symptoms subside. Because the radiotracer is trapped at the time of injection, the images provide a snapshot of myocardial perfusion at the time of injection, even if the acquisition is delayed. Indeed, a normal myocardial perfusion study following a rest injection in a patient with active chest pain effectively excludes myocardial ischemia as the cause of chest pain (high negative predictive value). While used commonly in the past for perfusion imaging, thallium-201 protocols are now rarely used because they are typically associated with a higher radiation dose to the patient.
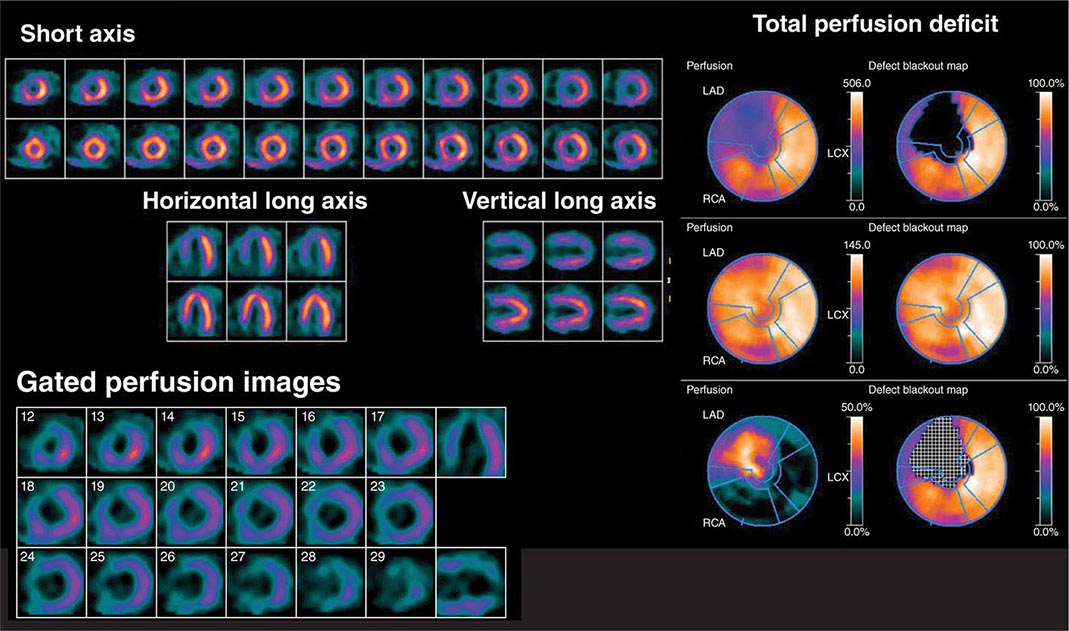
FIGURE 270e-5 Tomographic stress (top of each pair) and rest myocardial perfusion images with technetium-99m sestamibi single-photon emission computed tomography imaging demonstrating a large perfusion defect throughout the anterior and anteroseptal walls. The right panel demonstrates the quantitative extent of the perfusion abnormality at stress (top bull’s-eye), at rest (middle bull’s-eye), and the extent of defect reversibility (lower bull’s-eye). The lower left panel demonstrates electrocardiogram-gated myocardial perfusion images from which one can determine the presence of regional wall motion abnormalities and calculate left ventricular volumes and ejection fraction.
PET myocardial perfusion imaging is an alternative to SPECT and is associated with improved diagnostic accuracy and lower radiation dose to patients due to the fact that radiotracers are typically short lived (Table 270e-1). The ultra-short half-life of some PET radiopharmaceuticals in clinical use (e.g., rubidium-82) is the primary reason why imaging is generally combined with pharmacologic stress, as opposed to exercise, because this allows for faster imaging of these rapidly decaying radiopharmaceuticals. However, exercise is possible for relatively longer lived radiotracers (e.g., 13N-ammonia). PET imaging protocols are typically faster than SPECT, but more expensive. For myocardial perfusion imaging, rubidium-82 does not require an on-site medical cyclotron (it is available from a strontium-82/rubidium-82 generator) and, thus, is the most commonly used radiopharmaceutical. 13N-ammonia has better flow characteristics (higher myocardial extraction) and imaging properties than rubidium-82, but it does require an on-site medical cyclotron. In comparison to SPECT, PET has improved spatial and contrast resolution and provides absolute measures of myocardial perfusion (in mL/min per gram of tissue), thereby providing the patients’ regional and global coronary flow reserve. The latter helps improve diagnostic accuracy and risk stratification, especially in obese patients, women, and higher risk individuals (e.g., diabetes mellitus) (Fig. 270e-6). Contemporary PET and SPECT scanners are combined with a CT scanner (so-called hybrid PET/CT and SPECT/CT). CT is used primarily to guide patient positioning in the field of view and for correcting inhomogeneities in radiotracer distribution due to attenuation by soft tissues (so-called attenuation correction). However, it can also be used to obtain diagnostic data including coronary artery calcium score and/or CT coronary angiography (discussed below).
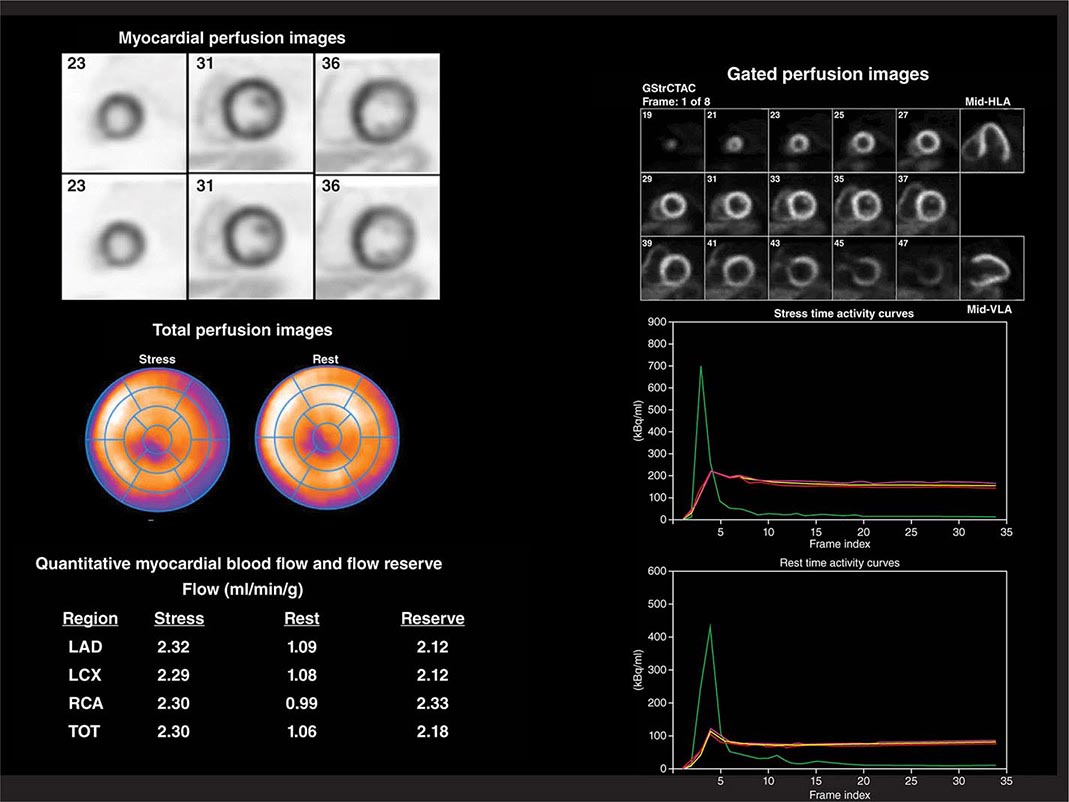
FIGURE 270e-6 Multidimensional cardiac imaging protocol with positron emission tomography. The left upper panel demonstrates stress and rest short-axis images of the left and right ventricles demonstrating normal regional myocardial perfusion. The middle panel demonstrates the quantitative bull’s-eye display to evaluate the extent and severity of perfusion defects. The lower right panel illustrates the time-activity curves for quantification of myocardial blood flow. The right upper panel demonstrates electrocardiogram-gated myocardial perfusion images from which one can determine the presence of regional wall motion abnormalities and calculate left ventricular volumes and ejection fraction. LAD, left anterior descending artery; LCX, left circumflex artery; RCA, right coronary artery; TOT, total left ventricle.
For the evaluation of myocardial viability in patients with ischemic cardiomyopathy, myocardial perfusion imaging (with SPECT or PET) is usually combined with metabolic imaging (i.e., fluorodeoxyglucose [FDG] PET). In hospital settings lacking access to PET scanning, thallium-201 SPECT imaging is an excellent alternative.
CARDIAC COMPUTED TOMOGRAPHY
CT acquires images by passing a thin x-ray beam through the body at many angles to generate cross-sectional images. The x-ray transmission measurements are collected by a detector array and digitized into pixels that form an image. The grayscale information in individual pixels is determined by the attenuation of the x-ray beam along its path by tissues of different densities, referenced to the value for water in units known as Hounsfield units. In the resulting CT images, bone appears bright white, air is black, and blood and muscle show varying shades of gray. However, due to the limited contrast between cardiac chambers and vascular structures, iodinated contrast agents are necessary for most cardiovascular indications. Cardiac CT produces tomographic images of the heart and surrounding structures. With modern CT scanners, a three-dimensional dataset of the heart can be acquired in 5–15 s with submillimeter spatial resolution.
CT Calcium Scoring CT calcium scoring is the simplest application of cardiac CT and does not require administration of iodinated contrast. The presence of coronary artery calcification has been associated with increased burden of atherosclerosis and cardiovascular mortality. Coronary calcium is then quantified (e.g., Agatston score) and categorized as minimal (0–10), mild (10–100), moderate (100–400), or severe (>400) (Fig. 270e-7). Coronary artery calcium (CAC) scores are then normalized by age and gender and reported as percentile scores. Population-based studies in asymptomatic cohorts have reported high cardiac prognostic value of CT calcium score. With appropriate techniques, the radiation dose associated with CAC scanning is very low (~1–2 mSv).
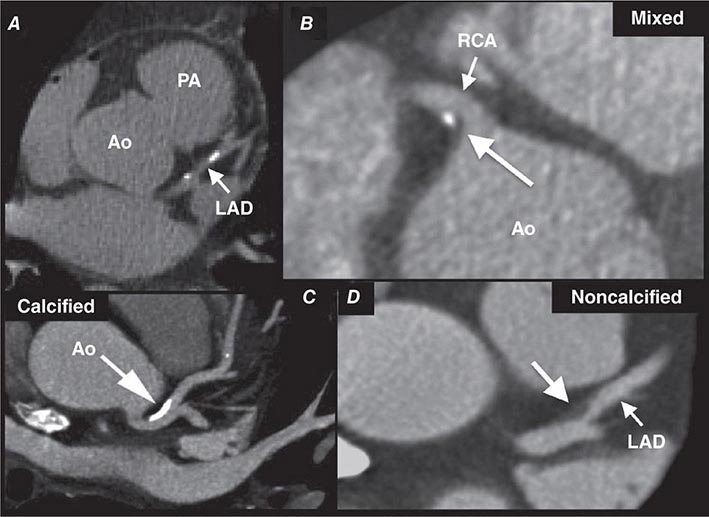
FIGURE 270e-7 Examples of non-contrast- and contrast-enhanced coronary imaging with computed tomography (CT). A. Calcified coronary plaques in the distal left main and proximal left anterior descending coronary artery (LAD) in a noncontrast cardiac CT scan. Calcium deposits are dense and present as bright white structures on CT, even without contrast enhancement. B, C, and D. Different types of atherosclerotic plaques on contrast-enhanced CT scans. Importantly, noncalcified plaques are evident only on contrast-enhanced CT scans. AO, aorta; PA, pulmonary artery; RCA, right coronary artery.
CT Coronary Angiography Coronary CT angiography (CTA) is emerging as a viable alternative to coronary angiography in selected patients. Imaging of the coronary arteries by CT is challenging because of their small luminal size and because of cardiac and respiratory motion. Respiratory motion can be reduced by breath-holding, and cardiac motion is best reduced by slowing the patient’s heart rate, ideally to under 60 beats/min, using intravenous or oral beta blockade or other rate-lowering drugs. When performing a coronary CTA, image quality is further enhanced using sublingual nitroglycerin to enlarge the coronary lumen just prior to contrast injection. Imaging the whole-heart volume is synchronized to the administration of weight-based and appropriately timed intravenous iodinated contrast. Image acquisition is linked to the timing of the cardiac cycle through electrocardiogram (ECG) triggering. Prospective ECG triggering, whereby the x-ray beam is turned on during a specific part of the cardiac cycle (e.g., end systole, combined end-systolic and end-diastolic timing, or mid-diastole), is generally used to limit the radiation exposure to the patient by acquiring data only through that portion of the cardiac cycle with least motion. Dose modulation is another method that should be routinely used to reduce radiation when performing CTA. It delivers a maximal amount of x-ray during the portion of the cardiac cycle of interest, but reduces x-ray delivery throughout the remaining portion of the cardiac cycle. The resulting images are then postprocessed using a three-dimensional workstation, which facilitates interpretation of the coronary anatomy and estimation of the severity of atherosclerosis (Fig. 270e-7).
CARDIAC MAGNETIC RESONANCE
Cardiac magnetic resonance (CMR) imaging is based on imaging of protons in hydrogen. Hydrogen is abundant because 80% of the human body consists of water. When put inside the MRI scanner, the magnetic field causes the protons (spins) to spin around their axis (a process known as precession) at specific frequencies. Spins within water have a different frequency than spins within more complex macromolecules such as fat or protein. Inside the MRI, a set of gradient coils slightly modifies the magnetic field in each of the three orthogonal directions. As a result, this additional process alters the frequencies of spins, and now the spins can be spatially located inside the MRI bore. This system allows the MRI to selectively deposit radiofrequency energy (in the form or radiofrequency pulse) into specific locations of the body for the purpose of imaging those locations. Once the radiofrequency pulses stop, the energy absorbed by the body will quickly be released back. Using the proper arrangement of surface phased-array coils, this released energy can be read, and important information such as spin locations and frequencies can be digitally recorded in a data matrix known as the K-space, before reconstructed into a magnetic resonance image. Radiofrequency energy deposition into the patient’s body can be arranged in many complex ways, known as pulse sequences, that allow extraction of different types of information from the body regions of interests. In CMR, these types of information in general are categorized under T1, T2, or T2∗ weighting, each of them containing a different combination of diagnostic information regarding cardiac structure, tissue characteristics, blood flow, or other physiologic properties of the heart.
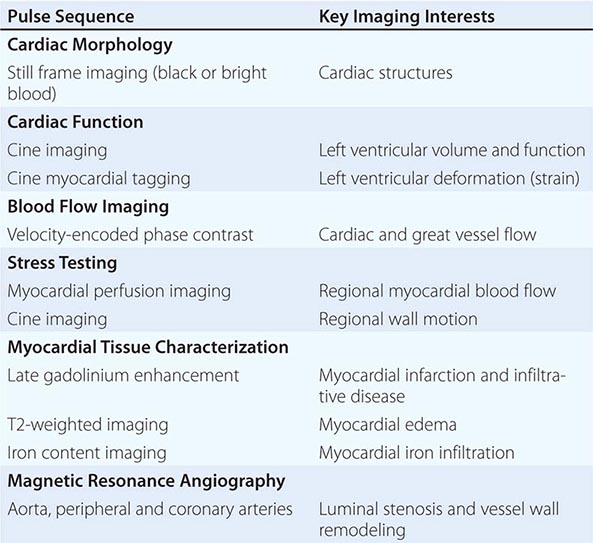
In clinical CMR, most pulse sequences are T1-weighted sequences, which characterize cardiac structure and function, blood flow, and myocardial perfusion, whereas T2-weighted and T2∗-weighted pulse sequences characterize myocardial edema and myocardial iron infiltration, respectively. A combination of more than one weighting is possible in some pulse sequences. ECG-triggered cine CMR is the modality that serves as a reference standard for quantifying ventricular volumes and function. Respiratory motion during CMR imaging is suppressed most commonly using repetitive patient breath-holding, but more advanced algorithms such as motion averaging or gating diaphragmatic motion (known as navigator guidance) are also used in clinical CMR. A list of common pulse sequence used in CMR is shown in Table 270e-2.
|
CLINICAL CARDIAC MAGNETIC RESONANCE PULSE SEQUENCES AND THEIR APPLICATION |
ASSESSMENT OF CARDIAC STRUCTURE AND FUNCTION
Echocardiography, CMR, and cardiac CT are all capable of assessing cardiac structure and function, although echocardiography is generally considered the primary imaging method for these assessments. Radionuclide imaging can also be used to assess left ventricular regional and global systolic function. Echocardiography is most often used to assess the size of all four chambers and thickness of ventricular walls, which are affected by both cardiac and systemic diseases.
The structure of the left ventricle is generally assessed by determining its volume and mass. Left ventricular volumes can be easily estimated from two-dimensional echocardiography by using one of several validated methods. The accuracy of these methods by echocardiography is limited by the fact that, as a nontomographic technique, foreshortening of the imaging plane can lead to underestimation of volumes. Moreover, virtually all of these methods require accurate identification of the endocardial border, which is dependent on image quality. In this regard, high-resolution tomographic techniques such as CMR or cardiac CT are considered generally more accurate for volumetric assessment. Three-dimensional echocardiography has several advantages over two-dimensional echocardiography by not requiring any geometric assumptions about the left ventricle for quantification of volumes and ejection fraction. However, acquisition of three-dimensional echocardiographic images requires substantial expertise, and these techniques are not widely used in practice.
Left ventricular dilatation is common to a number of cardiac diseases. For example, regional dysfunction secondary to myocardial infarction can ultimately lead to progressive ventricular dilatation or remodeling. Although dilatation often begins in the region affected by the infarction, subsequent compensatory dilatation can occur in remote myocardial regions as well. The presence of regional wall motion abnormalities associated with ventricular thinning (reflecting scar) in a coronary distribution is strongly suggestive of an ischemic etiology. Direct assessment of infarcted myocardium is possible with both CMR (evident as areas of late gadolinium enhancement [LGE]) and radionuclide imaging (as assessed by regional perfusion or metabolic defects at rest). CMR can be particularly useful in determining etiology of ventricular dilatation and dysfunction, with LGE in coronary distributions being nearly pathognomonic for infarction (Video 270e-1).
More global ventricular dilatation is seen in cardiomyopathy and dilatation due to valvular heart disease. Idiopathic, nonischemic cardiomyopathies will typically result in global ventricular dilatation and dysfunction, with thinning of the walls. Patients with substantial ventricular dyssynchrony due to conduction abnormalities will have a typical pattern of contraction (e.g., delay of contraction of the lateral wall with left bundle branch block). Although various methods for determining ventricular dyssynchrony have been proposed as ways to identify patients who would benefit from cardiac resynchronization therapy, it is not yet clear that they are superior to ECG assessment of QRS duration and morphology. As discussed later in this chapter, regurgitant lesions of either the mitral or aortic valves can lead to substantial ventricular dilatation, and assessment of ventricular size is integral in the evaluation and timing of surgical correction. Because changes in ventricular size are used clinically to determine which patients should undergo valve surgery, accurate assessment of changes in ventricular size is essential. Although serial echocardiography can provide these data, serial assessment by CMR may be more accurate when appreciation of subtle changes over time is important.
Left ventricular wall thickness and mass are also important measures of cardiac and systemic disease. The left ventricle will hypertrophy under any condition in which its afterload is increased, including conditions that obstruct outflow, such as aortic stenosis, hypertrophic cardiomyopathy, and subaortic membranes; in postcardiac aortic obstruction seen in coarctation; or in systemic conditions characterized by increased afterload, such as hypertension. The pattern of ventricular hypertrophy can change depending on the etiology. Aortic stenosis and hypertension are typically characterized by concentric hypertrophy, in which the ventricular walls thicken “concentrically” and cavity size is usually small. In volume overload conditions such as mitral or aortic regurgitation, there may be minimal increase in ventricular wall thickness, but substantial ventricular dilatation leads to marked increases in left ventricular mass.
Ventricular wall thickness can be measured and ventricular mass can be calculated by either echocardiography or CMR. Although radionuclide imaging and cardiac CT can also provide measures of left ventricular mass, they are not generally used for this purpose. Although measurement of wall thickness with echocardiography is relatively straightforward and accurate, determining left ventricular mass by echocardiography requires using one of several formulas that takes into account both wall thickness and ventricular cavity dimensions. Assessment of left ventricular mass by CMR has the advantage of not requiring geometric assumptions and is thus more accurate than echocardiography.
ASSESSMENT OF LEFT VENTRICULAR SYSTOLIC FUNCTION
Assessment of ejection fraction, or the percentage of blood ejected with each beat, has been the primary method to assess systolic function and is generally calculated by subtracting end-systolic volume from end-diastolic volume and dividing by end-diastolic volume. All cardiac imaging modalities can provide direct measurements of left ventricular ejection fraction (LVEF). As discussed above, tomographic techniques (e.g., CMR, CT, and radionuclide imaging [SPECT and PET]) are generally more accurate and reproducible than echocardiography because there are no geometric assumptions. A LVEF of 55% or greater is generally considered normal, and an LVEF of 50–55% is considered in the low-normal range.
Newer methods to assess systolic function, such as myocardial strain or deformation imaging using speckle-tracking methods on echocardiography or myocardial tagging on CMR, can provide a more sensitive approach to detection of systolic dysfunction. Additional assessments based on these novel methods include assessment of myocardial twist and torsion. Although these techniques are not used routinely, they may be especially useful in certain conditions such as valvular heart disease and early detection of cardiotoxicity following chemotherapy and/or radiation therapy. In addition to estimation or calculation of ejection fraction, stroke volume can be assessed by virtually all cardiac imaging methods, generally by subtracting the end-systolic volume from the end-diastolic volume, or by Doppler methods (only on echocardiography), and offers another measure of systolic function that provides independent information from ejection fraction.
ASSESSMENT OF LEFT VENTRICULAR DIASTOLIC FUNCTION
Echocardiography remains the primary method for clinical assessment of diastolic function. Recent advances in Doppler tissue imaging allow for accurate assessment of the velocity of myocardial wall motion by assessing the excursion of the mitral annulus in diastole. Mitral annular relaxation velocity, or E′, is inversely related to the time constant of relaxation, tau, and has been shown to have prognostic significance. Dividing the standard mitral inflow maximal velocity, E, by the mitral annular relaxation velocity yields E/E′, which has been shown to correlate with left ventricular filling pressures. The utility of standard E and A wave ratios for assessment of diastolic function has been questioned. Mitral deceleration time can be a useful measure if very short (<150 ms), suggesting restrictive physiology and severe diastolic dysfunction. Several grading methods for diastolic function have been proposed that take into account a number of diastolic parameters, including Doppler tissue-based relaxation velocities, pulmonary venous Doppler, and left atrial size (Fig. 270e-8). Diastolic function worsens with aging, and most diastolic parameters need to be adjusted for age.
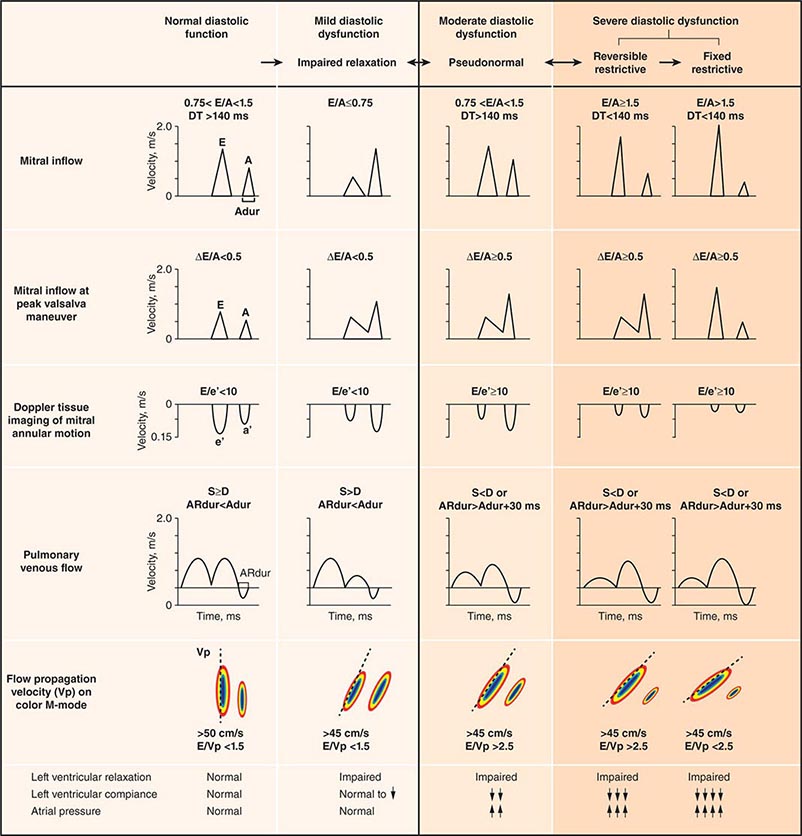
FIGURE 270e-8 Stages of diastolic function based on various parameters, including mitral inflow (with and without Valsalva maneuver), Doppler tissue imaging, pulmonary venous flow, and flow propagation. (Adapted with permission from MM Redfield et al: JAMA 289:194, 2003.)
ASSESSMENT OF RIGHT VENTRICULAR FUNCTION
Right ventricular size and function have been shown to be prognostically important in a variety of conditions. Right ventricular size and function can be assessed by echocardiography, CMR, CT, or radionuclide imaging methods. CMR is considered the most accurate noninvasive technique to evaluate the structure and right ventricular ejection fraction of the right ventricle (Video 270e-2). Although first-pass imaging by radionuclide angiography can provide accurate and reproducible measurements of right ventricular volumes and ejection fraction, it is not commonly used. Assessment of the right ventricle by echocardiography has generally been qualitative, owing in part to the unusual geometry of the right ventricle. However, several quantitative methods are available for assessment of right ventricular function, including fractional area change (FAC = [diastolic area – systolic area]/diastolic area), which has been shown to correlate with outcomes in heart failure and after myocardial infarction. Excursion of the tricuspid annulus (tricuspid annular plane systolic excursion) is another widely used method to assess right ventricular function, although it is mostly used in research settings.
Abnormalities of right ventricular size and function are generally secondary to either diseases that affect the right ventricle intrinsically or disease in which the right ventricle responds to abnormalities elsewhere in the heart or pulmonary vasculature. Intrinsic diseases that affect the RV include congenital abnormalities, including hypoplastic right ventricle and arrhythmogenic right ventricular dysplasia, and acquired diseases, such as right ventricular infarction and infiltrative diseases that affect the right ventricle. Long-standing pulmonary hypertension or pulmonary outflow tract obstruction leads to right ventricular hypertrophy and ultimately dilatation. Although right ventricular dilatation can occur due to both chronic and acute processes, chronic right ventricular dilatation is usually secondary to long-standing increases in pulmonary pressures and can thus be distinguished from the acute processes that cause right ventricular dilatation. One such acute process that can cause profound right ventricular dilatation and dysfunction is acute pulmonary embolism. In the setting of acute occlusion of a pulmonary artery or branch, an acute rise in pulmonary vascular resistance causes a previously normal right ventricle to dilate and fail due to the increased afterload. In acute pulmonary embolism, right ventricular dilatation and dysfunction are signs of substantial hemodynamic compromise and are associated with a marked increase risk in likelihood of death. In addition to right ventricular dilatation, acute pulmonary embolism is often associated with a specific pattern of regional right ventricular dysfunction, commonly referred to as the McConnell sign, characterized by preservation of right ventricular wall motion in the basal and apical regions and dyskinesis in the region of the mid right ventricular free wall. This abnormality is highly specific for acute pulmonary embolism and is likely secondary to acute increases in right ventricular load.
Any disease that causes increased pulmonary vascular resistance can lead to right ventricular dilatation and dysfunction. Long-standing chronic obstructive pulmonary disease results in cor pulmonale in which right ventricular pressures become elevated as the right ventricle hypertrophies in response to the increased pulmonary vascular resistance. Acute pneumonia can cause findings that are similar to acute pulmonary embolism. In patients with right ventricular dilatation without obvious pulmonary disease, intracardiac shunts should be considered. The increased flow through the pulmonary vasculature as a result of an atrial septal or ventricular septal defect can, over time, result in elevation in pulmonary resistance with subsequent dilatation and hypertrophy of the right ventricle. Right ventricular dilatation and dysfunction also have prognostic significance in left-sided heart disease and have been shown to be important predictors of outcome in patients with heart failure or acute myocardial infarction.
In addition to assessment of left ventricular structure, assessment of the other cardiac chambers also provides important clues to intracardiac and systemic diseases. Enlargement of the left atrium is common in patients with hypertension and is also suggestive of increased left ventricular filling pressures; indeed, left atrial size is often termed the “hemoglobin A1c” of diastolic function, because left atrial enlargement reflects long-standing increase in left-sided filling pressures. Right atrial dilatation and dilatation of the inferior vena cava are common in conditions in which central venous pressure is elevated.
PATIENT SAFETY CONSIDERATIONS
RADIATION EXPOSURE
Both cardiac CT and radionuclide imaging expose patients to ionizing radiation. Several recent publications have raised concern regarding the potential harmful effects of ionizing radiation associated with cardiac imaging. The effective dose is a measure used to estimate the biologic effects of radiation and is expressed in millisieverts (mSv). However, measuring the radiation effective dose associated with diagnostic imaging is complex and imprecise and often results in varying estimates, even among experts. The effective dose from a typical myocardial perfusion SPECT scan ranges between ~4 and 11 mSv, depending on the protocol and type of scanner used. The effective dose from a typical myocardial perfusion PET scan is lower, ~2.5–4 mSv. Radiation exposure associated with cardiac CT is variable and, as with radionuclide imaging, also depends on the imaging protocol and scanner used. Although historic radiation doses with cardiac CT have been quite high, the introduction of newer technologies described above (e.g., x-ray tube modulation, prospective ECG gating) has resulted in a significant dose reduction. The current average radiation dose for a coronary CTA ranges from 5–15 mSv and, in selected cases, can be as low as 1 mSv. Imaging laboratories follow the ALARA (as low as reasonably achievable) principle when balancing the clinical need and imaging approach. By comparison, the average dose for invasive coronary angiography is ~7 mSv, whereas exposure to radiation from natural sources in the United States amounts to ~3 mSv annually.
The risk of a fatal malignancy from medical imaging–related radiation is difficult to estimate precisely but is likely small and difficult to discern from the background risk of natural malignancies. The small but potential radiation risks from imaging mandate an assessment of the risk-versus-benefit ratio in the individual patient. In this context, one must not fail to take into account the risks of missing important diagnostic information by not performing a test (which could potentially influence near-term management and outcomes) for a theoretical concern of a small long-term risk of malignancy. Before ordering any test, especially one associated with ionizing radiation, we must ensure the appropriateness of the study and that the potential benefits outweigh the risks. The likelihood that the study being considered will affect clinical management of the patient should be addressed before testing is performed. It is also important that “routine” follow-up scans in asymptomatic individuals be avoided.
CONTRAST AGENTS
Contrast agents are commonly used in cardiac CT, CMR, and echocardiography. Although their use significantly enhances the diagnostic information of each of these tests, there are also potential risks from the administration of contrast agents that should be considered.
The risk of adverse reactions from iodinated contrast agents used in cardiac CT is well established. The precise pathogenesis of contrast reactions following intravascular administration of iodinated contrast media is not known. The overall incidence of contrast reactions is 0.4–3% with nonionic formulations and higher for ionic formulations. Most contrast adverse reactions are mild and self-limiting. The risk of contrast-induced nephropathy (CIN) in patients with relatively normal renal function (glomerular filtration rate [GFR] >60 mL/min) is low. In most patients, CIN is self-limited, and renal function usually returns to baseline within 7–10 days, without progressing to chronic renal failure. However, this risk increases in patients with GFR <60 mL/min, especially older diabetic subjects. In such patients, appropriate screening and pre- and postscan hydration are necessary.
The use of gadolinium-based contrast agents (GBCAs) in CMR imaging enhances the versatility of this technique. Although there are several commercially available GBCAs in the United States, their use in cardiac imaging is considered off-label. Mild reactions from GBCAs occur in ~1% of patients, but severe or anaphylactic reactions are very rare. All GBCAs are chelated to make the compounds nontoxic and to allow renal excretion. Exposure to the nonchelated component of GBCA (Gd3+) has been associated with a rare condition known as nephrogenic systemic fibrosis (NSF), which is an interstitial inflammatory reaction that leads to severe skin induration, contracture of the extremities, fibrosis of internal organs, and even death. Risk factors to developing NSF include high-dose (>0.1 mmol/kg) GBCA use in presence of severe renal dysfunction (estimated GFR [eGFR] <30 mL/min per 1.73 m2), need for hemodialysis, an eGFR <15 mL/min per 1.73 m2, use of gadodiamine contrast agent, acute renal failure, acute systemic illness, and presence of concurrent proinflammatory events. With the use of weight-based dosing and pretest screening, recent data suggest that NSF is extremely rare. Previously, an incidence of 0.02% in 83,121 patients exposed to GBCA over 10 years was noted; however, with current eGFR screening guidelines that have been widely practiced since 2006, a near-zero incidence of NSF has been reported.
Contrast agents can also be used in echocardiography. Injected agitated saline is used routinely to assess cardiac shunts, because these “bubbles” are too large to traverse the pulmonary circulation. After saline injection, the presence of bubbles in the left side of the heart is indicative of shunt, although the location can sometimes be difficult to determine. Dedicated echocardiographic contrast agents have been developed for opacification of left-sided structures and perfusion, although these are only currently U.S. Food and Drug Administration (FDA) approved for perfusion. These agents are either albumin- or lipid-based microspheres filled with inert gases, typically perfluorocarbons. They are considered extremely safe, although they have, in extremely rare instances, been associated with allergic reactions and neurologic events.
SAFETY CONSIDERATIONS OF CMR IN PATIENTS WITH PACEMAKERS AND DEFIBRILLATORS
The risks of performing CMR in the presence of a pacemaker include generation of electrical current from the metallic hardware (especially if wire loops exist), device movement induced by the magnetic field, inappropriate pacing and sensing, and heating as a result of the “antenna’s effect.” While the presence of a permanent pacemaker remains a contraindication to CMR, highly experienced centers had reported success in performing MRI in these patients in a carefully monitored clinical setting. In general, patients need to be not pacemaker-dependent, the setting of the pacemaker needs to be modified to aysnchronous mode, and the pulse sequence needs to be modified to reduce the amount of radiofrequency energy deposition. Pacemakers implantated for less than 6 weeks and the presence of epicardial, abandoned, or nonfixation leads are considered unsafe. Collectively, evidence from combined reports of >250 patients with pacemaker models manufactured after year 2000 suggests that CMR at 1.5 T or less can be performed without significant risk for the patient and with minor nonpermanent alteration of pacemaker settings and function. Similar safety data exists for automatic implantable cardioverter-defibrillators (AICDs), but they are based only on small numbers of patients. In 2011, the first CMR-compatible FDA-approved permanent pacemaker became available commercially. Currently, no AICD has achieved FDA clearance for MRI compatibility.
PATIENT-CENTERED APPLICATIONS OF CARDIAC IMAGING
CORONARY ARTERY DISEASE
The basis for the diagnostic application of imaging tests in patients with known or suspected CAD should be viewed in light of the pretest probability of disease as well as the specific characteristics of imaging tests (i.e., sensitivity and specificity). In symptomatic patients, the prevalence or pretest probability of CAD differs based on the type of symptom (typical angina, atypical angina, noncardiac chest pain), as well as on age, gender, and coronary risk factors. In an individual patient, the results of the initial test informs the posttest likelihood of CAD. In patients undergoing sequential testing (e.g., ECG treadmill testing followed by stress imaging), the posttest probability of disease after the first test becomes the pretest likelihood of disease for the second test. Regardless of the sequence, the expectation is that a test will provide sufficient information to confirm or exclude the diagnosis of CAD and that such information will allow accurate risk stratification to be able to guide management decisions.
Table 270e-3 summarizes the relative diagnostic accuracies of cardiac imaging modalities for the diagnosis of CAD.
|
COMPARATIVE DIAGNOSTIC ACCURACY OF CARDIAC IMAGING APPROACHES TO CORONARY ARTERY DISEASE |
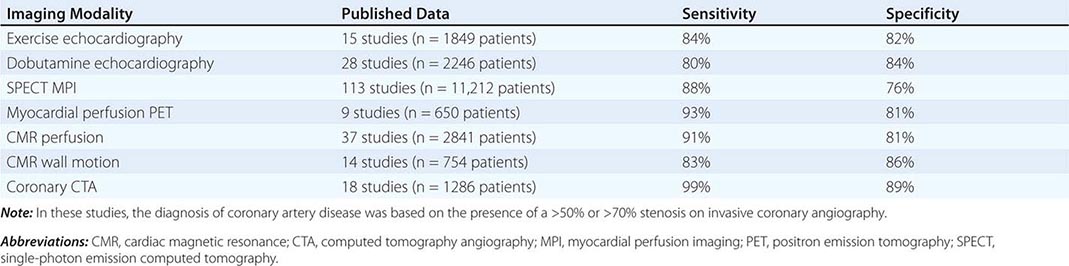
It is important to highlight that the vast majority of studies included in meta-analyses of the diagnostic accuracy of cardiac imaging modalities for the diagnosis of CAD were retrospective, small, single-center studies, comprising predominantly male patients with a high prevalence of CAD (>50–60%). Multicenter studies assessing the performance of individual modalities or comparing different modalities have consistently resulted in more modest diagnostic accuracies, tracking more closely with how these tests perform in practice.
Stress Echocardiography The hallmark of myocardial ischemia during stress echocardiography is the development of new regional wall motion abnormalities and reduced systolic wall thickening (Video 270e-3). Stress echocardiography can be performed in conjunction with exercise or dobutamine stress. Stress echocardiography is best at identifying inducible wall motion abnormalities in previously normally contracting segments. In a patient with wall motion abnormalities at rest, the specificity of stress echocardiography is reduced, and worsening regional function of a previously abnormal segment might reflect worsening contractile function in the setting of increased wall stress rather than new evidence of inducible ischemia.
The advantages of stress echocardiography over other stress imaging techniques include its relatively good diagnostic accuracy, widespread availability, no use of ionizing radiation, and relatively low cost. Limitations of stress echocardiography include (1) the technical challenges associated with image acquisition at peak exercise because of exertional hyperpnoea and cardiac excursion, (2) the fact that rapid recovery of wall motion abnormalities can be seen with mild ischemia (especially with one-vessel disease, which limits sensitivity), (3) difficulty detecting residual ischemia within an infarcted territory because of resting wall motion abnormality, (4) high operator dependence for acquisition of echocardiographic data and analysis of images, and (5) the fact that good-quality complete images viewing all myocardial segments occurs in only 85% of patients. Newer techniques including second harmonic imaging and the use of intravenous contrast agents improve image quality, but their effect on diagnostic accuracy has not been well documented. The use of IV contrast agents may also allow assessment of myocardial perfusion, although this is not approved or generally reimbursed, and data concerning the utility of contrast perfusion echocardiography are limited.
As with nuclear perfusion imaging, stress echocardiography is often used for risk stratification in patients with suspected or known CAD. A negative stress echocardiogram is associated with an excellent prognosis, allowing identification of patients at low risk. Conversely, the risk of adverse events increases with the extent and severity of wall motion abnormalities on stress echocardiography.
Stress Radionuclide Imaging SPECT myocardial perfusion imaging is the most common form of stress imaging tests for CAD evaluation. The presence of a reversible myocardial perfusion defect is indicative of ischemia (Fig. 270e-9, left panel), whereas a fixed perfusion defect generally reflects prior myocardial infarction (Fig. 270e-9, right panel). As discussed above, PET has advantages compared to SPECT, but it is not widely available and is more expensive and, thus, considered an emerging technology in clinical practice.
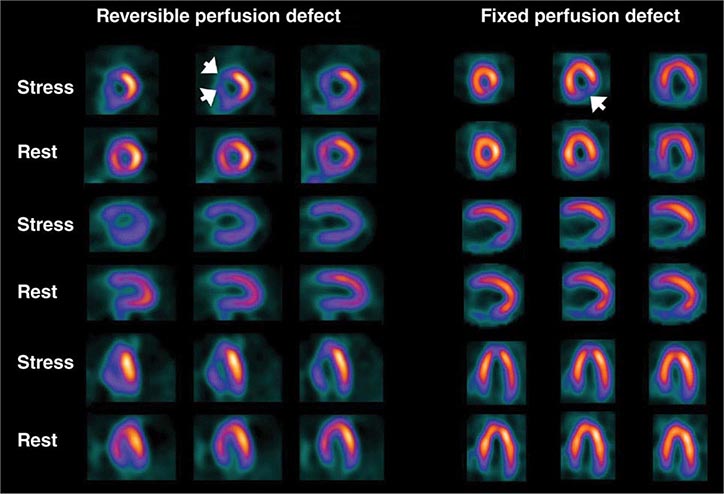
FIGURE 270e-9 Selected technetium-99m sestamibi myocardial perfusion single-photon emission computed tomography images of two different patients demonstrating a reversible perfusion defect involving the anterior and septal left ventricular wall, reflecting ischemia in the left anterior descending coronary territory (arrows in left panel), and a fixed perfusion defect involving the inferior and inferolateral walls consistent with myocardial scar in the right coronary territory (arrow in right panel).
Nuclear perfusion imaging is another robust approach to diagnose obstructive CAD, quantify the magnitude of inducible myocardial ischemia, assess the extent of tissue viability, and guide therapeutic management (i.e., selection of patients for revascularization). One of the most valuable clinical applications of radionuclide perfusion imaging is for risk stratification. It is well established that patients with a normal SPECT or PET study exhibit a median rate of major adverse cardiac events of <1% annually. Importantly, the risks of death and myocardial infarction increase linearly with increasing magnitude of perfusion abnormalities, reflecting the extent and severity of CAD.
Despite the widespread use and clinical acceptance of radionuclide imaging in CAD evaluation, a recognized limitation of this approach is that it often uncovers only coronary territories supplied by the most severe stenoses. Consequently, it is relatively insensitive to accurately delineate the extent of obstructive angiographic CAD, especially in the setting of multivessel disease. The use of quantitative myocardial blood flow and coronary flow reserve with PET can help mitigate this limitation. In patients with so-called “balanced” ischemia or diffuse CAD, measurements of coronary flow reserve uncover areas of myocardium at risk that would generally be missed by performing only relative assessments of myocardial perfusion (Fig. 270e-10). Conversely, a normal coronary flow reserve is associated with a very high negative predictive value for excluding high-risk angiographic CAD. These measurements of coronary flow reserve also contribute to risk stratification across the spectrum of ischemic changes, including patients with visually normal myocardial perfusion.
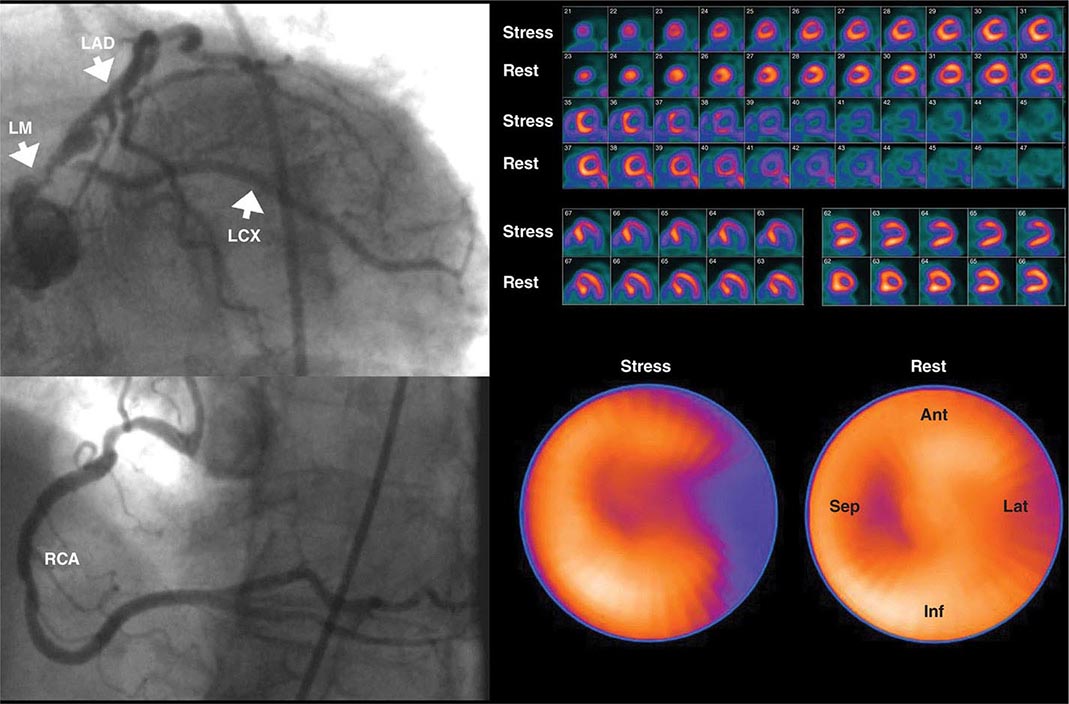
FIGURE 270e-10 Coronary angiographic (left panel) and rubidium-82 myocardial perfusion positron emission tomograph images (right panel) in an 85-year-old female with diabetes presenting with chest pain. The coronary angiogram demonstrates significant stenoses of the left main and circumflex coronary arteries. However, the perfusion images demonstrate only a reversible lateral wall defect. Quantification of stress and rest myocardial blood flow demonstrated a significant, global reduction on coronary flow reserve (estimated at 1.2, normal value >2.0), reflecting extensive myocardium risk that was underestimated by the semiquantitative estimates of myocardial perfusion. LAD, left anterior descending artery; LCX, left circumflex artery; LM, left main artery; RCA, right coronary artery.
HYBRID CT AND NUCLEAR PERFUSION IMAGING Because many of the newer generation nuclear medicine scanners integrate CT and a gamma camera in the same acquisition gantry, it is now possible to acquire and quantify myocardial scar and ischemia and CAC scoring from a single dual-modality study (SPECT/CT or PET/CT) (Fig. 270e-11). The rationale for this integrated approach is predicated on the fact that the perfusion imaging approach is designed to uncover only obstructive atherosclerosis. Conversely, CAC scoring (or CT coronary angiography) provides a quantitative measure of the anatomic extent of atherosclerosis. This provides an opportunity to improve the conventional models for risk assessment using nuclear imaging alone, especially in patients without known CAD.
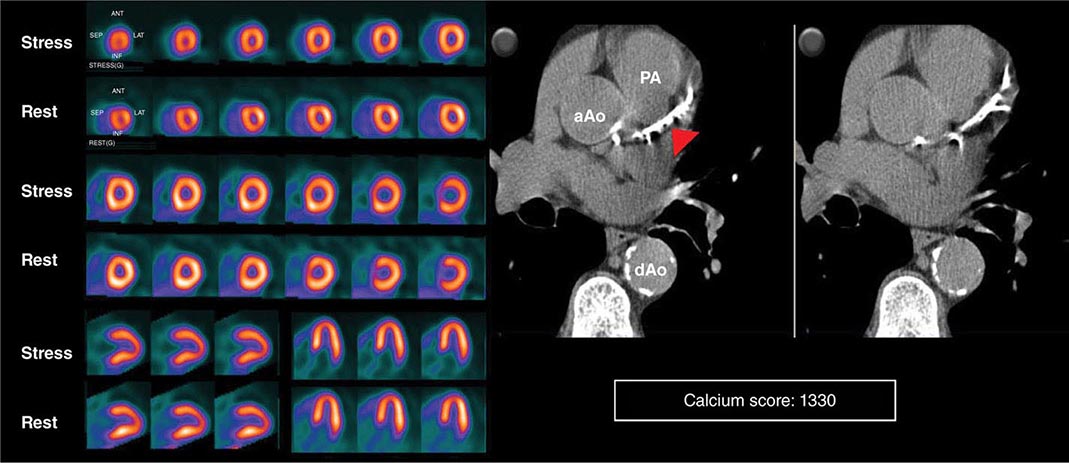
FIGURE 270e-11 Stress and rest rubidium-82 myocardial perfusion positron emission tomography (PET) images (left) and noncontrast gated computed tomography (CT) images (right) delineating the extent and severity of coronary artery calcifications obtained with integrated PET/CT imaging. The images demonstrate extensive atherosclerosis (Agatston coronary calcium score = 1330) without flow-limiting disease based on the normal perfusion study. aAo, ascending aorta; dAo, descending aorta; PA, pulmonary artery.
Cardiac CT Voluminous plaques are more prone to calcification, and stenotic lesions frequently contain large amounts of calcium. Indeed, there is evidence that high CAC scores are generally predictive of a higher likelihood of obstructive CAD, and the available data support the concept of a threshold phenomenon governing this relationship (i.e., Agatston score >400). However, given the fact that CAC scores are not specific markers of obstructive CAD, one should be cautious in using this information as the basis for referral of patients to coronary angiography, especially in symptomatic patients with low-risk stress tests. Conversely, CAC scores <400, especially in symptomatic patients with intermediate-high likelihood of CAD, as in those with typical angina, may be less effective in excluding CAD, especially in young symptomatic men and women who may have primarily noncalcified atherosclerosis (Fig. 270e-12).
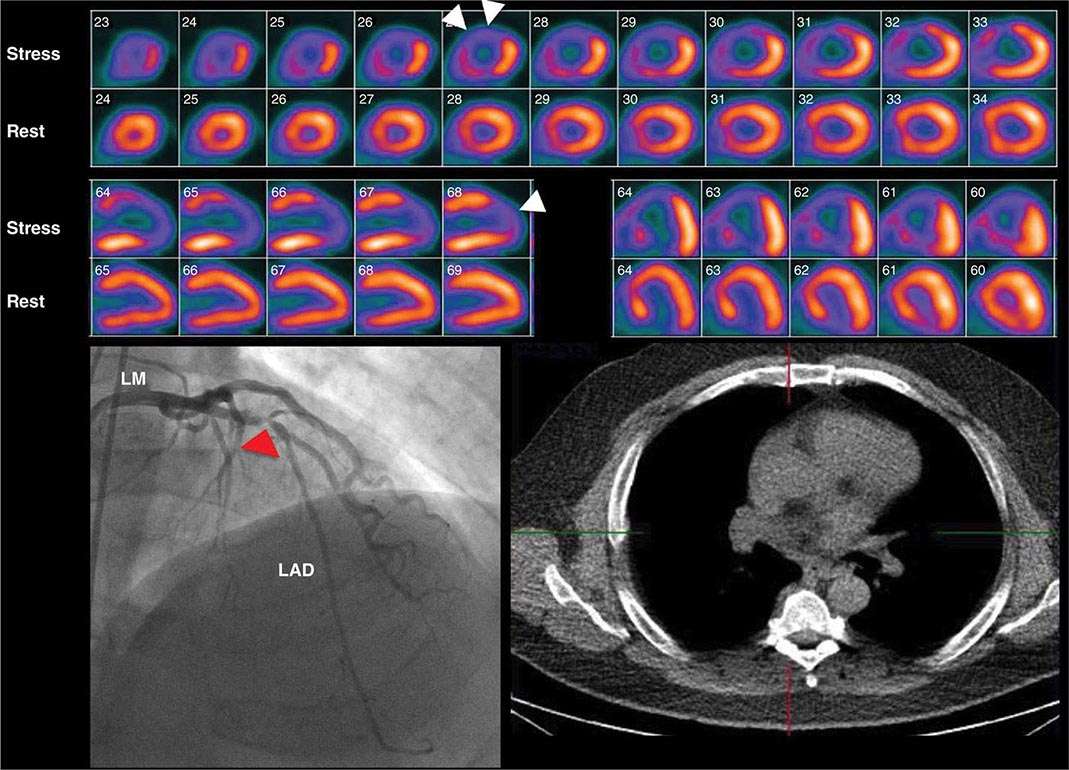
FIGURE 270e-12 Stress and rest rubidium-82 myocardial perfusion positron emission tomography images (top), noncontrast gated computed tomography images (lower right), and selected coronary angiographic images obtained on a 59-year-old male patient with atypical angina. Despite the absence of significant coronary calcifications (Agatston calcium score = 0), the perfusion images demonstrated a dense and reversible perfusion defect involving the anterior and anteroseptal walls (arrows), reflecting significant obstructive disease in the left anterior descending coronary artery (LAD), confirmed on angiography. LM, left main artery.
As discussed above, the improved temporal and spatial resolution of modern multidetector CT scanners offer a unique noninvasive approach to delineate the extent and severity of coronary atherosclerosis. The extremely high sensitivity of this approach offers a very effective means for excluding the presence of CAD (high negative predictive value) (Table 270e-3). In the setting of high coronary calcium scores (e.g., >400), however, specificity is reduced because the blooming artifact of calcium does not allow one to evaluate the vessel lumen accurately. Given the high negative predictive value of CTA, a normal scan result effectively excludes obstructive CAD and abolishes the need for further investigation. As discussed below, this may be quite useful in patients with low-intermediate clinical risk presenting to the emergency room for chest pain. However, the limited capability of this technique to determine the severity of stenosis and to predict which obstructions are flow limiting can make abnormal scan results more difficult to interpret, especially in terms of the possible need of coronary revascularization. There are emerging data suggesting that by adding a stress myocardial perfusion CT evaluation (similar to stress perfusion CMR) (Fig. 270e-13, top panel) or an estimated fractional flow reserve (so-called FFRCT) (Fig. 270e-13, lower panel), one can define the hemodynamic significance of anatomic stenosis. However, these are not in routine clinical use and remain emerging technologies.
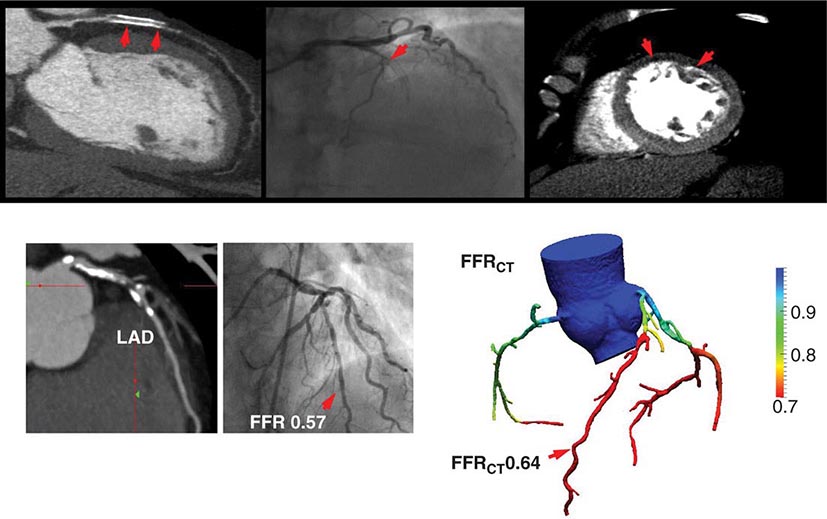
FIGURE 270e-13 Examples of novel approaches to the assessment of flow-limiting coronary artery disease (CAD) with cardiac computed tomography (CT). In the top panel, representative views of a coronary CT angiogram (CTA; left), coronary angiogram (middle), and stress myocardial perfusion CT (right) images in a patient with CAD and prior stenting of the left anterior descending coronary artery (LAD) are presented. On the CTA, the stent (arrows) is totally occluded as evidenced by the loss of contrast enhancement distal to the stent. The coronary angiogram demonstrates a concordant total occlusion of the LAD. On the perfusion CT images, there is a black rim (arrows) involving the anterior and anterolateral walls, indicating the lack of contrast opacification during stress consistent with myocardial ischemia. (Images courtesy of CORE 320 investigators.) The lower panel illustrates an example of fractional flow reserve (FFR) estimates with coronary CTA (left) compared to the reference standard of invasive FFR. The FFR reflects the pressure differential between a coronary segment distal to a stenosis and the aorta. In normal coronary arteries, there is no gradient, and FFR is 1. An FFR <0.80 is consistent with a hemodynamically significant stenosis. (Images courtesy of Dr. James Min, Cornell University, New York.)
As with invasive coronary angiography, assessments of the extent of CAD by CTA can also provide useful prognostic information. A low 1-year cardiac event rate has been reported for patients without obstructive CAD on CTA. For patients with obstructive CAD, the risk of adverse cardiac events increases proportionally with the extent of angiographically obstructive CAD.
Although CTA can be helpful in assessing patency of bypass grafts, the assessment of stents is somewhat more challenging because the limited spatial resolution of CT and stent diameter (<3 mm being associated with the highest number of partial lumen visualization and nondiagnostic scans) both contribute to limited clinical results.
CMR Imaging The two approaches used with CMR to evaluate known or suspected CAD include the assessment of regional myocardial perfusion or wall motion at rest and during stress, the latter being analogous to dobutamine echocardiography. Although treadmill or bicycle exercise stress CMR is practiced in a small number of specialized centers, the logistics for stress MRI studies currently require the use of pharmacologic stress agents including vasodilators or dobutamine. Myocardial perfusion is evaluated by injecting a bolus of a GBCA followed by continuous data acquisition as the contrast passes through the cardiac chambers and into the myocardium. Relative perfusion deficits are recognized as regions of low signal intensity (black) within the myocardium (Video 270e-4). In addition, LGE imaging allows detection of bright areas of myocardial scar (white), which further enhances the utility of this approach for diagnosis of CAD (Fig. 270e-14).
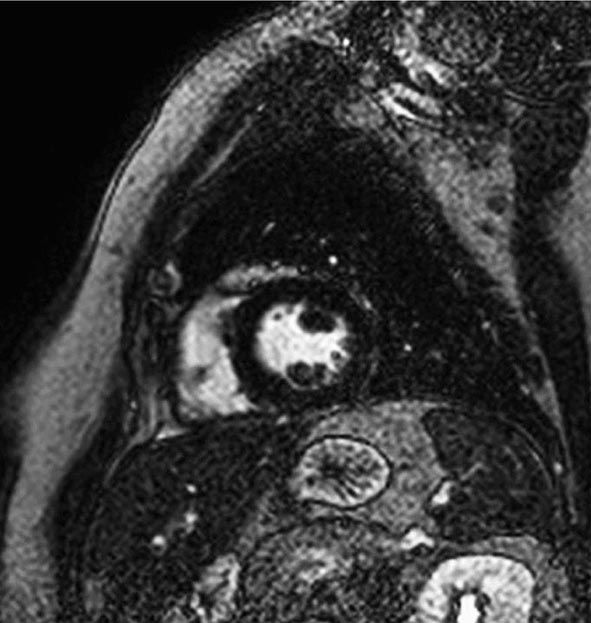
FIGURE 270e-14 The image shows the late gadolinium enhancement image of a mid short-axis view. There is no evidence of infarction in the anterior wall, which would be seen as bright white areas, indicating that the stress perfusion defect primarily represents myocardial ischemia. This patient had a significant stenosis of the left anterior descending coronary artery.
The major advantage of dobutamine CMR over dobutamine echocardiography is better image quality and sharper definition of endocardial borders from the blood pool. Consequently, dobutamine CMR appears to have better diagnostic accuracy than dobutamine echocardiography for detection of CAD, especially in patients with poor acoustic window (Table 270e-3). A limitation of high-dose dobutamine stress CMR is that it bears the potential risk of severe side effects, such as hypotension and severe ventricular arrhythmias in the inhospitable environment of the magnetic resonance scanner. It occurs rarely (~5%), and most cases can be prevented with proper monitoring of vital signs and regional cine function. The advantage of stress perfusion CMR over SPECT is its clearly higher spatial resolution, allowing detection of subendocardial defects that may be missed by SPECT. The addition of the information from LGE imaging allows differentiation of hypoperfused (potentially ischemic) from infarcted myocardium and characterizes the extent of myocardial ischemia.
As with other imaging modalities, there is evidence that ischemia measurements derived from stress CMR studies also have prognostic value. In line with the nuclear and echocardiography literature, a normal CMR study is associated with a good prognosis. Conversely, the presence of new wall motion abnormalities, regional perfusion defects, the combination of wall motion abnormalities and perfusion defects, and the presence of LGE are all predictors of adverse events.
Selecting a Testing Strategy in Patients without Known CAD As discussed above, there are many options for the evaluation of a patient with suspected CAD presenting with chest pain symptoms. The critical questions to be answered by a testing strategy include the following: (1) Does the chest pain reflect obstructive CAD? (2) What are the short- and long-term risks? (3) Does the patient need to be considered for revascularization?
For symptomatic patients without a prior history of CAD and a normal or nearly normal resting ECG who are able to exercise, the American Colloge of Cardiology/American Heart Association guidelines recommend standard exercise treadmill testing (ETT) as the initial testing strategy. The guidelines further suggest that patients who are categorized as low risk by ETT (e.g., those achieving >10 metabolic equivalents [METS] without chest pain or ECG changes) be treated initially with medical therapy, and those with high-risk ETT findings (i.e., typical angina with >2 mm ST-segment depression in multiple leads, ST elevation during exercise, drop in blood pressure, or sustained ventricular arrhtyhmias) be referred for coronary angiography.
The use of exercise testing in women presents difficulties that are not seen in men, reflecting the differences in the lower prevalence of obstructive CAD in women and the different accuracy of exercise testing in men and women. Compared with men, the lower pretest probability of disease in women means that more test results are false positive. In some of these patients, a positive ETT may reflect true myocardial ischemia caused my microvascular coronary artery dysfunction (so-called microvascular disease). In addition, the inability of many women to exercise to maximum aerobic capacity, the greater prevalence of mitral valve prolapse and microvascular disease in women, and possibly other reasons may contribute to the differences with men as well. The difficulties of using exercise testing for diagnosing obstructive CAD in women have led to speculation that stress imaging may be preferred over standard stress testing. However, recent data from the WOMEN study suggests that in symptomatic, low-risk women who are able to exercise, standard ETT is a very effective initial diagnostic strategy as compared to stress radionuclide imaging. Women included in the study were randomized to standard ETT or exercise radionuclide perfusion imaging. The primary endpoint was the 2-year incidence of major adverse cardiac events, defined as CAD death or hospitalization for an acute coronary syndrome or heart failure. At 2 years, there was no difference in major adverse cardiac events. As expected, ETT resulted in 48% lower costs compared to exercise radionuclide imaging.
Patients with intermediate-high risk after ETT (e.g., low exercise duration, chest pain, and/or ST-segment depression without high-risk features) will often require additional testing, either stress imaging or noninvasive CT coronary angiography, to more accurately characterize clinical risk. Most common stress imaging strategies in intermediate-risk patients include stress echocardiography and radionuclide imaging. In such patients, stress imaging with either SPECT or echocardiography has been shown to accurately reclassify patients who are initially classified as intermediate risk by ETT as low or high risk (Fig. 270e-15). Following this staged strategy of applying the low-cost ETT first and reserving more expensive imaging to refine risk stratification to patients initially classified as intermediate risk by ETT is more cost effective than applying stress or anatomic imaging as the initial test routinely.
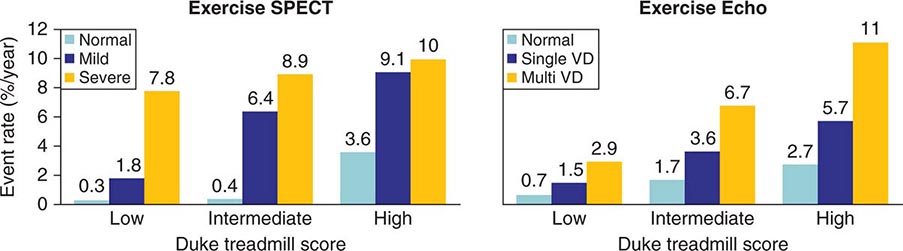
FIGURE 270e-15 Incremental risk stratification of stress imaging over Duke treadmill score in patients with suspected coronary artery disease. Stress imaging is most valuable in the intermediate-risk group. SPECT, single-photon emission computed tomography; VD, vessel disease. (Reproduced with permission from R Hachamovitch et al: Circulation 93:905, 1996; and TH Marwick et al: Circulation 103:2566, 2001.)
A stress imaging strategy is the recommended first step for patients who are unable to exercise to an adequate workload and/or those with abnormal resting ECGs (e.g., left ventricular hypertrophy with strain, left bundle branch block). Importantly, the most recent documents regarding appropriate use of radionuclide and echocardiography imaging also considered that an imaging strategy may be an appropriate first step in patients with intermediate-high likelihood of CAD (e.g., diabetics, renal impairment) due to increased overall sensitivity for diagnosis of CAD and improved risk stratification.
In considering the potential clinical application of imaging modalities, the evidence supporting the role of assessment of ischemia versus anatomy must be considered. From the discussion above, a normal CTA is helpful because it effectively excludes the presence of obstructive CAD and the need for further testing, defines a low clinical risk, and makes management decisions regarding referral to coronary angiography straightforward. Because of its limited accuracy to define stenosis severity and predict ischemia, however, abnormal CTA results are more problematic to interpret and to use as the basis for defining the potential need of invasive coronary angiography and revascularization. In such patients, a follow-up stress test is usually required to determine the possible need of revascularization (Fig. 270e-16).
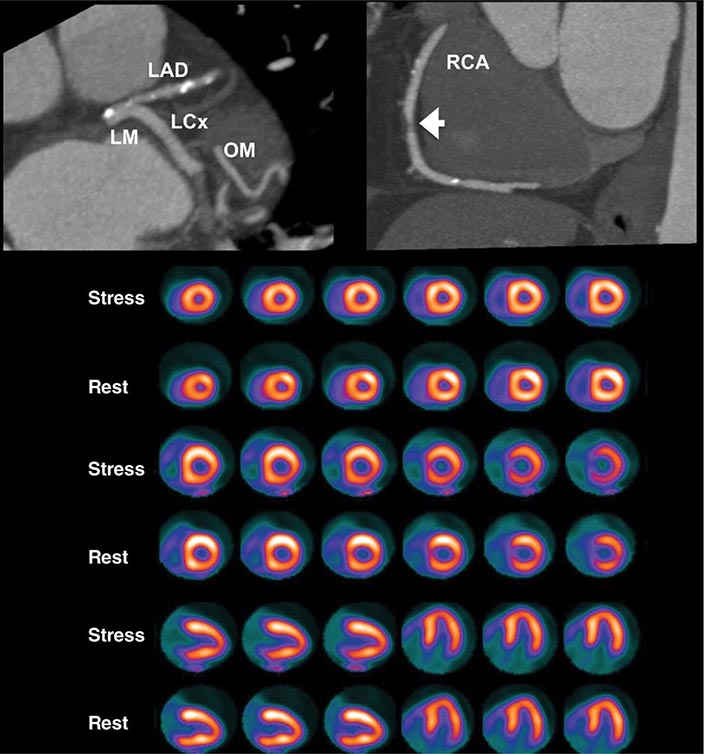
FIGURE 270e-16 Selected views from coronary computed tomography angiographic (CTA) images (top panel) and stress and rest rubidium-82 myocardial perfusion positron emission tomography images (lower panel) obtained on a 64-year-old male patient with atypical angina. The CTA images demonstrate dense focal calcifications in the left main (LM) and left anterior descending (LAD) coronary arteries and a significant noncalcified plaque in the mid right coronary artery (RCA; arrow). The myocardial perfusion images demonstrated no evidence of flow-limiting stenosis. LCx, left circumflex artery; OM, obtuse marginal branch.
The justification of stress imaging in testing strategies has hinged on the identification of which patients may benefit from a revascularization strategy by means of noninvasive estimates of jeopardized myocardium rather than angiography-derived anatomic stenoses. Indeed, there is evidence that only the presence of moderate-severe ischemia identifies patients with apparent improved survival with revascularization. Patients with mild or no ischemia are better candidates for optimal medical therapy. The advantages of this approach include avoidance of excess catheterizations with their associated cost and risk and the potential for intervening unnecessarily. The acceptable diagnostic accuracy of stress imaging approaches, along with their robust risk stratification, and the ability of ischemia information to identify patients who would benefit from revascularization suggest a potential role as a first imaging strategy in patients with intermediate-high likelihood of CAD. Although the available data suggest similar diagnostic accuracy for SPECT, PET, echocardiography, and CMR, the choice of strategy depends on availability and local expertise.
Selecting a Testing Strategy in Patients with Known CAD Use and selection of testing strategies in symptomatic patients with established CAD (i.e., prior angiography, prior myocardial infarction, prior revascularization) differ from those in patients without prior CAD. Although standard ETT may help distinguish cardiac from noncardiac chest pain, exercise ECG has a number of limitations following myocardial infarction and revascularization (especially coronary artery bypass grafting). These patients frequently have rest ECG abnormalities. In addition, there is a clinical need to document both the magnitude and localization of ischemia to be able to direct therapy, especially the potential need for targeted revascularization. Consequently, imaging tests are preferred for evaluating patients with known CAD.
There are also important differences in the effectiveness of imaging tests in these patients. As discussed above, coronary CTA is limited in patients with prior revascularization. Patients with prior coronary artery bypass grafting are a particularly heterogeneous group with respect to the anatomic basis of ischemia and its implications for subsequent morbidity and mortality. In addition to graft attrition, progression of disease in the native coronary arteries is not uncommon in symptomatic patients. While CTA provides excellent visualization of the bypass grafts, the native circulation tends to get heavily calcified and is generally not a good target for imaging with CTA. Likewise, blooming artifacts from metallic stents also limit the application of coronary CTA in patients with prior percutaneous coronary intervention. Although newer stent material may change the potential role of CTA in the future, it is probably not the first line of testing in these patients. If an anatomic strategy is indicated, direct referral to invasive angiography is preferred.
Stress imaging approaches are especially useful and preferred in symptomatic patients with established CAD. As in patients without prior CAD, normal imaging studies in symptomatic patients with established CAD also identify a low-risk cohort. In those with abnormal stress imaging studies, the degree of abnormality relates to posttest risk. In addition, stress imaging approaches can localize and quantify the magnitude of ischemia (especially with perfusion imaging), thereby assisting in planning targeted revascularization procedures. As in patients without prior CAD, the choice of stress imaging strategy depends on availability and local expertise.
Testing Strategy Considerations in Patients Presenting with Chest Pain to the Emergency Department Although acute chest pain is a frequent reason for patient visits to the emergency department (ED), only a small minority of those presentations represent an acute coronary syndrome (ACS). Strategies used in the evaluation of these patients include novel cardiac biomarkers (e.g., serum troponins), conventional stress testing (ETT), and noninvasive cardiac imaging. It is generally accepted that the primary goal of this evaluation is exclusion of ACS and other serious conditions rather than detection of CAD.
The routine evaluation of acute chest pain in most centers in the United States includes admission to a chest pain unit to rule out ACS with the use of serial ECGs and cardiac biomarkers. In selected patients, stress testing with or without imaging may be used for further risk stratification. Stress echocardiography and radionuclide imaging are among the most frequently used imaging approaches in these patients. The relative strengths and weaknesses of these testing options have been discussed above. Both approaches have been shown to be effective for identifying low-risk patients who can be safely discharged from the ED. Multiparametric CMR imaging has also been used successfully in patients with acute chest pain. In addition to the combined assessment of regional and global left ventricular function, myocardial perfusion, and tissue viability, it is also possible to evaluate the presence of myocardial edema to characterize the myocardium at risk secondary to reduced coronary flow (Video 270e-5). Due to its ability to probe multiple aspects of myocardial physiology, cardiac anatomy, and tissue characterization with LGE imaging, CMR is also useful in diagnosing conditions that mimic ACS (e.g., acute myocarditis, takotsubo cardiomyopathy, pericarditis) (Fig. 270e-17). Thus, CMR imaging offers unique information of myocardial pathophysiology in the spectrum of ACS and is, perhaps, the most versatile of all noninvasive imaging techniques. Unfortunately, it is not widely available even at specialized centers and is not a first-line testing strategy. The main disadvantages of the “functional” testing strategy are that it is time consuming and is generally associated with a prolonged length of stay and, thus, is more costly.
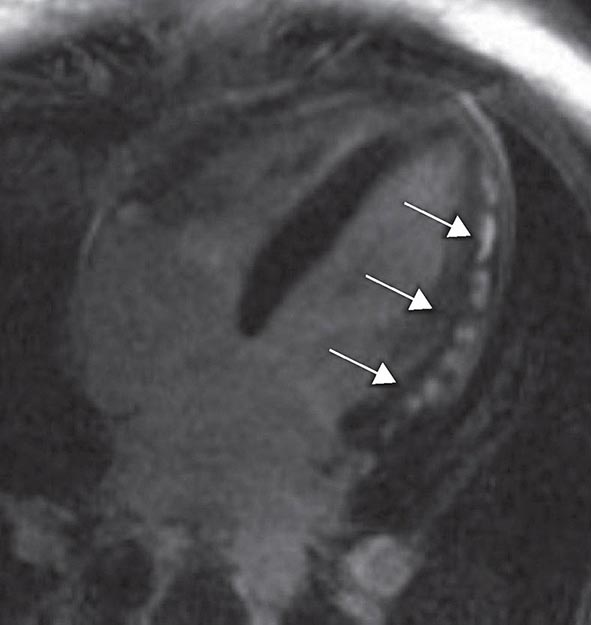
FIGURE 270e-17 A four-chamber long-axis late gadolinium enhancement (LGE) image of a patient with acute myocarditis. Note that the LGE primarily involved the epicardial aspect of the myocardium (arrows), sparing the endocardium, which is a feature that distinguishes myocarditis from myocardial infarction, which affects the endocardium. Also note the multiple foci of LGE in this case affecting the lateral wall of the left ventricle. Viral myocarditis often presents with this pattern.
As discussed above, coronary CTA is a rapid and accurate imaging technique to exclude the presence of CAD and is well suited for the evaluation of patients with acute chest pain (Fig. 270e-18). Several single-center and, more recently, multicenter studies have demonstrated the feasibility, safety, and accuracy of coronary CTA in the ED. There have been four randomized controlled trials evaluating the efficacy of coronary CTA as the initial testing strategy as compared to usual care (which typically includes stress imaging). Patients in these trials had a very low clinical risk. Overall, there were no deaths and very few myocardial infarctions without differences between the groups. Likewise, there were no differences in postdischarge ED visits or rehospitalizations. These studies showed decreased length of stay with coronary CTA, and most but not all reported cost savings. An observation from a recent meta-analysis was that, compared to usual care, more patients assigned to coronary CTA underwent cardiac catheterization (6.3% vs 8.4%, respectively) and revascularization (2.6% vs 4.6%, respectively). The relative increased frequency in the referral to cardiac catheterization and revascularization after coronary CTA compared to stress imaging testing strategies has also been observed in patients with stable chest pain syndromes.
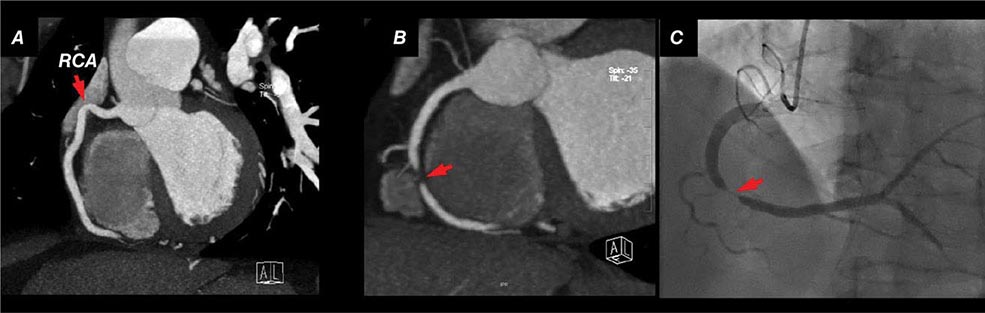
FIGURE 270e-18 Representative coronary computed tomography angiographic (CTA) images of two patients presenting to the emergency department with chest pain and negative biomarkers. The patient in A had angiographically normal coronary arteries; the panel shows a representative view of the right coronary artery (RCA). B and C show a corresponding significant stenosis in the mid portion of the RCA on both the CTA (B) and invasive angiographic view (C). (Images courtesy of Dr. Quynh Truong, Massachusetts General Hospital, Boston, MA.)
Taken together, the available data clearly suggest that not all patients presenting with acute chest pain require specialized imaging testing. Patients with very low clinical risk and negative biomarkers (especially high-sensitivity troponin assays) can be safely triaged. The use of imaging tests in patients with low-intermediate risk should be carefully considered, especially given the trade-offs discussed above.
VALVULAR HEART DISEASE
Abnormalities of any of the four valvular structures in the heart can lead to significant cardiac dysfunction, heart failure, or even death. Echocardiography, CMR, and cardiac CT can be used for the evaluation of valvular heart disease, although echocardiography has generally been considered the first imaging test of choice for the assessment of valvular heart disease. In addition, echocardiography is the most cost-effective screening method for valvular heart disease. In some cases, CMR can complement echocardiography when echocardiographic acoustic window is inadequate, quantifying blood flow data more precisely, or providing complimentary assessment of adjacent vascular structures relevant to the valvular condition.
Echocardiography can be used to assess both regurgitant and stenotic lesions of any of the cardiac valves. Typical indications for echocardiography to assess valvular heart disease include cardiac murmurs identified on physical examination, symptoms of breathlessness that may represent valvular heart disease, syncope or presyncope, and preoperative exams in patients undergoing bypass surgery. A standard echocardiographic examination should include qualitative and quantitative assessment of all valves regardless of indication and should serve as an adequate screening test for significant valvular disease.
General Principles of Valvular Assessment • DIRECT VISUALIZATION OF VALVULAR STRUCTURES Direct visualization of valve structures by two-dimensional echocardiography represents the first step in valvular evaluation. The morphology of valvular structures provides useful information regarding the etiology and severity of valvular disease. For example, two-dimensional imaging assessment of the aortic valve can identify the number of leaflets, determine whether the valve is bicuspid or tricuspid, and determine the severity of calcification and degree of leaflet excursion. Similarly, the classic appearance of a rheumatic mitral valve is extremely useful in determining the etiology of mitral stenosis, and mitral valve prolapse can be instantly identified without even the need for Doppler-based quantification.
EVALUATION OF STENOTIC VALVES As described earlier in the chapter, evaluation of stenotic valves generally includes estimation of the pressure gradient across the stenosis and determination of the valve area. Both of these measures have diagnostic and prognostic value. For example, when Doppler echocardiography is used to assess the maximal velocity across a stenotic aortic valve, this calculation will provide an accurate measure of the instantaneous gradient across the valve. This gradient will be higher than the mean gradient, as well as higher than that peak-to-peak gradient obtained at cardiac catheterization. This gradient is dependent on both the degree of stenosis and the contractile function of the left ventricle. Patients with significant left ventricular dysfunction may have severe aortic stenosis but will be unable to generate a high gradient across the valve because generated pressure within the left ventricle will be diminished.
Assessment of stenotic valves generally requires estimation of both the pressure gradient across the valve and the valve area. Pressure gradient is estimated through direct application of the Bernoulli principle, and the formula p = 4v2 is usually sufficient to estimate the gradient across the valve. Several methods can be used to estimate valve areas, including the continuity principle based on the principle of conservation of mass. By this method, flow is estimated in two places. For example, for assessment of the aortic valve area, we measure the flow in the region of the left ventricular outflow tract and the cross-sectional area in this region, the product of which should be equal to the flow across the stenotic aortic valve and its cross-sectional area. Estimation of the mitral valve area in patients with suspected mitral stenosis can also be performed in a number of ways, including planimetry of the valve directly, estimation with continuity methods, or the most commonly used pressure half-time method, in which the stenosis severity is estimated by the time it takes for the pressure—estimated from velocity by the Bernoulli equation—to reach half of its original value during mitral inflow.
EVALUATION OF REGURGITANT LESIONS Regurgitant lesions are generally assessed by both visual assessment of the valve morphology and a variety of Doppler-based methods to assess the severity of regurgitation. The etiology of regurgitation can often be inferred from visual inspection. For example, prolapse of the mitral valve leaflets—and to a lesser extent, the aortic valve leaflets—can be easily visualized with two-dimensional echocardiography. In general, valvular regurgitation can be caused by abnormalities of the valve leaflets themselves or abnormalities of the annulus and supporting structures, and these can usually be distinguished visually on transthoracic echocardiography (see discussion below).
Quantification of valvular regurgitation is more difficult with echocardiography than quantification of valvular stenoses. Doppler-based methods are best suited to assess blood velocities rather than volumetric flow. The most widely used technique for assessing the severity of valvular regurgitation is color flow Doppler estimation, which is qualitative. More quantitative methods such as the proximal isovelocity surface area (PISA) method (see below) allow for more accurate assessment of regurgitation and provide estimation of the regurgitant fraction and effective regurgitant orifice area but are less widely used. Assessment of regurgitant lesions with CMR also has a number of advantages (see below).
Assessment of Aortic Stenosis Aortic stenosis, one of the most common forms of valvular heart disease, most often occurs because of gradual progression of valvular calcification in both normal and congenitally abnormal valves. Assessment of aortic stenosis is most commonly performed with echocardiography, although techniques for quantitative assessment of aortic stenosis with CMR have been developed and increasingly used over the past decade. Echocardiographic assessment generally begins with visual inspection of the valve, usually in the parasternal long-axis and short-axis views. This allows for assessment of valvular morphology, whether it is tricuspid, bicuspid, or some variant; degree of leaflet calcification; and leaflet excursion.
The normal aortic valve consists of three leaflets or cusps: the right coronary, the left coronary, and the noncoronary cusps. Abnormalities of cusp development are some of the most common congenital heart anomalies, the most common of which is bicuspid aortic valve, with two opening leaflets rather than three (Fig. 270e-19). The aortic valve can be visualized on echocardiography, although sometimes it can be difficult to distinguish true bicuspid aortic valve from variants, including the presence of a vestigial commissure (raphe). Bicuspid aortic valve, one of the most common congenital anomalies, predisposes to both aortic stenosis and aortic insufficiency.
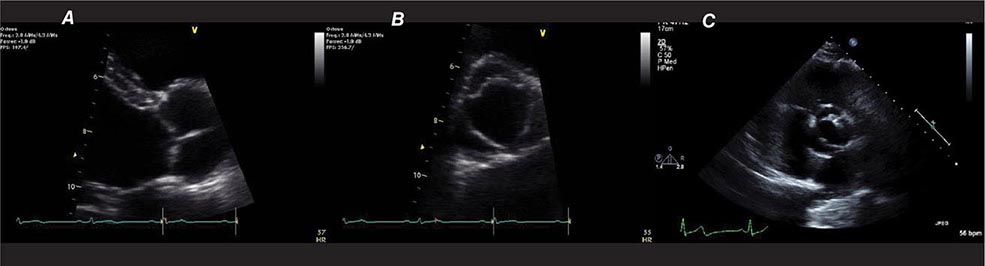
FIGURE 270e-19 Normal aortic valve in the parasternal long-axis view (A) and short-axis view (B), and bicuspid aortic valve showing typical 10 o’clock to 4 o’clock leaflet orientation (C).
As discussed above, the degree of aortic stenosis is assessed by estimating both the pressure gradient across the valve and the valve area. Patients with moderate aortic stenosis or higher generally have peak instantaneous velocities of 3.0 m/s and higher, and often higher than 4.0 m/s, corresponding to pressure gradients of 36 and 64 mmHg, respectively. Because pressure gradients across the aortic valve can be underestimated in patients with severe left ventricular dysfunction, estimation of valve area by the continuity principle is the most accurate technique for assessing the severity of the stenosis. However, evaluation of the patient with so-called low-flow or low-gradient aortic stenosis can be challenging and can sometimes require provocative testing such as dobutamine echocardiography. In these cases, it is important to distinguish whether the valve is indeed capable of opening further or simply behaving like a stenotic valve because of the low-pressure gradient.
Aortic valve areas less than 1.0 cm2 are generally considered severe, and valve areas less than 0.6 cm2 are considered critical. Because patients with good left ventricular function can often tolerate severe aortic stenosis for a considerable period of time, valve areas or gradients alone should not be used to determine whether an individual patient should undergo aortic valve surgery, as this remains a clinical decision.
Some patients with apparent aortic stenosis actually have subvalvular or even supravalvular obstruction. Hypertrophic cardiomyopathy represents the classic form of subvalvular aortic stenosis, but this is usually easily distinguished from aortic stenosis on echocardiography as the valve leaflets can be seen opening during systole. Subaortic membranes can behave very similarly to leaflet aortic stenosis, and the membranes themselves can be very thin and difficult to visualize, although the presence of a murmur, a gradient across the valve with aortic leaflets that appear to open normally, is highly suggestive of a membrane. Supravalvular aortic stenosis, although exceedingly rare, also occurs.
The emergence of transcatheter aortic valve intervention as a therapeutic option for patients with severe aortic stenosis who are not optimal candidates for surgical replacement has resulted in a very important clinical role for multimodality imaging. Imaging plays a critical role in preprocedural planning, intraprocedural implantation optimization, and follow-up of these patients. CT plays an important role in defining the eligibility of the proposed access site (CTA of the aorta and iliac arteries) and in defining the anatomic relationships between the aortic valve and aortic root, left ventricle, and coronary ostia. Cardiac CT and transesophageal echocardiography are also used to define the device size. Transesophageal echocardiography is used during the device implantation to ensure the best prosthesis–patient match, to assess prosthesis position and function after deployment, and to identify immediate complications (e.g., aortic insufficiency, paravalvular leak resulting from patient–prosthesis mismatch). Echocardiography is the imaging modality of choice for long-term surveillance.
Assessment of Aortic Regurgitation Assessment of aortic regurgitation requires qualitative assessment of the aortic valve structure. Aortic regurgitation is common with congenital abnormalities of the aortic valve, the most common of which is bicuspid aortic valve. Aortic regurgitation often coexists with aortic stenosis, and it is not uncommon for patients to have both severe aortic stenosis and regurgitation. Congenital abnormalities of the aortic leaflets, such as bicuspid aortic valve, are common causes of aortic insufficiency. Dilatation of the aortic root, as occurs in patients with hypertension and other disorders in which aortic dilatation can occur, can also lead to aortic regurgitation even when the valve leaflets are intrinsically normal due to malcoaptation of the leaflets. Aortic root dilatation is common in patients with aortic regurgitation, both as a cause or coexisting lesion, and the aortic root and ascending aorta should be measured and followed in these patients (Fig. 270e-20).
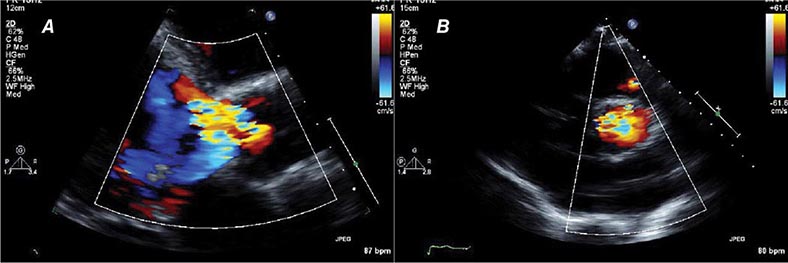
FIGURE 270e-20 Aortic regurgitation visualized by color flow Doppler in the parasternal long-axis view (A) and the parasternal short-axis view (B).
Because aortic regurgitation can result in dilatation of the left ventricle over time with ultimate reduction in ventricular function, caring for the patient with aortic regurgitation requires serial assessment of ventricular size and function. Patients whose ventricles dilate beyond an end-systolic diameter of 5.5 cm or whose LVEF declines below normal are at significantly higher risk of death or heart failure, and these measures are often used to decide the need for valve surgery. Quantitation of regurgitation itself can be performed using a number of methods. Semiquantitative visual assessment of aortic regurgitant jet width and depth by color flow Doppler remains the most used. The jet diameter as a ratio of the left ventricular outflow tract diameter proximal to the valve represents one of the most reliable indices of severity and correlates well with angiographic assessment. Similarly, the vena contracta, which represents the smallest diameter of the regurgitant flow at the level of the valve, can be used to assess the severity of aortic regurgitation. Other Doppler-based methods include assessing the pressure half-time, or rate of decline of the pressure gradient between the aorta and left ventricle, a measure of acuity of aortic regurgitation, and assessing aortic flow reversal in the descending aorta. The regurgitant volume can be calculated by comparing the flow across the aortic and pulmonic valves, assuming the pulmonic valve is competent.
CMR offers a number of advantages over echocardiography in the assessment of aortic regurgitation. CMR can be more accurate than echocardiography for assessing small changes in cardiac size or function that can occur over time in patients with aortic insufficiency. In addition, CMR techniques can very accurately quantify regurgitant volume in patients with aortic insufficiency, a known limitation of echocardiography. CMR can also capture three-dimensional imaging of the aortic size that in some cases can be helpful in determining the etiology of the aortic regurgitation or in monitoring the patient (Fig. 270e-21 and Video 270e-6).
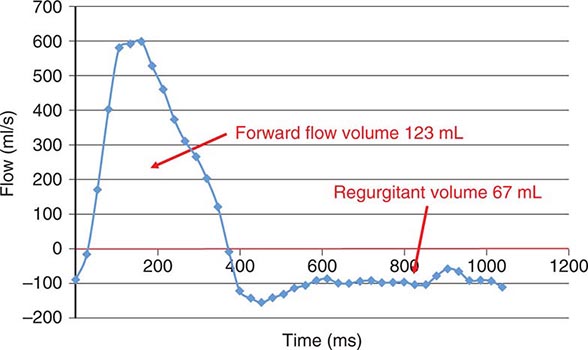
FIGURE 270e-21 The resultant flow curve generated from phase contrast imaging demonstrates a forward flow of 123 mL and a regurgitant volume of 67 mL, yielding a regurgitant fraction of 54% indicating severe aortic regurgitation.
Assessment of Mitral Regurgitation The normal mitral valve consists of an anterior and posterior leaflet in a saddle shape configuration (Fig. 270e-22). The leaflets are attached to the papillary muscles via chordae tendineae that insert on the ventricular side of the leaflets. Mitral regurgitation can occur due to abnormalities of the leaflets, the chordal structures, or the ventricle, or any combination of these (Fig. 270e-23).
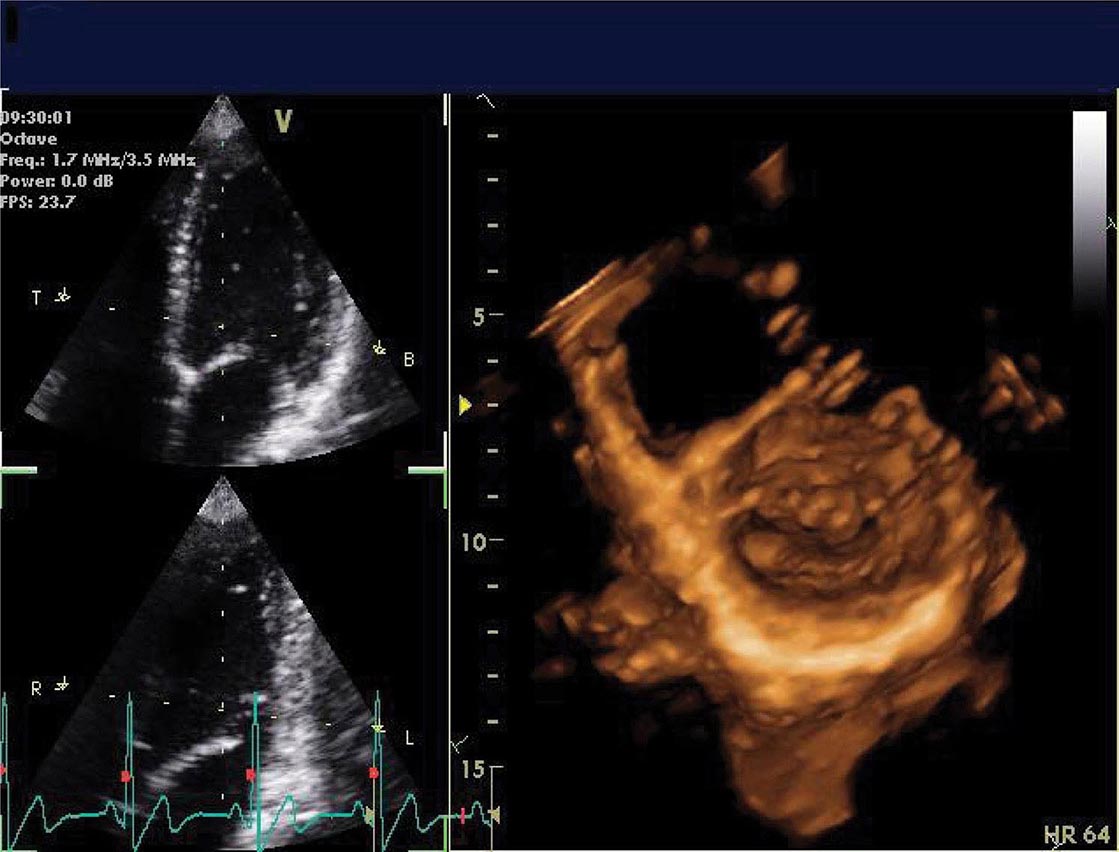
FIGURE 270e-22 Normal mitral valve in two-dimensional views (left) and with three-dimensional imaging (right).
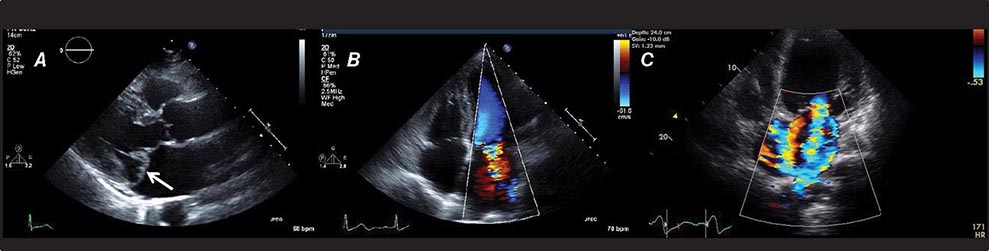
FIGURE 270e-23 A. Mitral valve prolapse with posterior leaflet visualized prolapsing behind the plane of the anterior leaflet (arrow). B. Color flow Doppler showing mitral regurgitation in a patient with mitral valve prolapse. C. Severe functional mitral regurgitation in a patient with a dilated left ventricle.
Mitral valve prolapse, in which one leaflet moves behind the plane of the other leaflet, can be due to myxomatous degeneration of the valves and leaflet redundancy, disruption of chordal structures secondary to degenerative disease, or papillary muscle rupture or dysfunction following myocardial infarction. Regurgitant jets can be visualized using color flow Doppler. The velocity of regurgitant jets is driven by the pressure gradient between the two chambers. This velocity tends to be quite high for left-sided regurgitant lesions, including mitral regurgitation and aortic regurgitation, resulting in turbulent jets on color flow Doppler (Fig. 270e-23). Visual estimation of color flow Doppler is generally sufficient for qualitative assessment of regurgitant severity but can dramatically under- or overestimate regurgitation severity, particularly when regurgitant jets are quite eccentric. For this reason, quantitative assessment is generally recommended, especially when making clinical decisions about surgical intervention. The PISA method is generally used for quantitative assessment of severity of mitral regurgitation. This method relies on estimation of the velocity of flow acceleration at a specific distance proximal to the valve with the assumption that the flow accelerates in concentric hemispheres.
As with aortic insufficiency, assessment of ventricular structure and function is also integral in the evaluation of mitral regurgitation. Although some patients have mitral regurgitation due to intrinsic abnormalities of the valve itself, in others, the valve can be relatively normal but the mitral regurgitation can be secondary to dilatation and remodeling of the left ventricle. So-called functional mitral regurgitation is generally secondary to apical displacement of the papillary muscles in a dilated ventricle, resulting in the leaflets of the mitral valve being pulled toward the apex of the heart, resulting in poor coaptation during systole and resultant relatively central mitral regurgitation. This type of mitral regurgitation can generally be distinguished from intrinsic mitral valve disease, and the surgical or procedural treatment of these conditions can be different. Knowledge of the etiology of mitral regurgitation can be important for a surgeon planning mitral valve surgery. Moreover, new procedural approaches to mitral valve disease may be different depending on the etiology.
Ventricular dilatation is an important predictor of outcome in patients with mitral regurgitation of any cause. It is important to realize that in a patient with significant mitral regurgitation, a large portion of the blood being ejected from the left ventricle with every beat is regurgitant, thus artificially increasing the ejection fraction. Thus, an ejection fraction of 55% in a patient with severe mitral regurgitation may actually represent substantial reduction in myocardial systolic function.
CMR can be helpful in evaluating mitral regurgitation in a subset of patients when echocardiographic assessment is inadequate. CMR can directly quantify regurgitant volume of the mitral regurgitant jet or indirectly quantify regurgitant volume by measuring the difference of left ventricular stroke volume and aortic forward flow.
Assessment of Mitral Stenosis Rheumatic mitral disease remains the most common cause of mitral stenosis, although mitral stenosis can also result from severe calcification of the mitral leaflets. Rheumatic mitral stenosis has a distinct appearance characterized by tethering at the leaflet tips and relative pliability of the leaflets themselves, resulting in a hockey stick–type deformation particularly of the anterior leaflet (Fig. 270e-24). Narrowing of the mitral orifice impedes flow from the left atrium to the left ventricle, resulting in increased pressures in the left atrium, which are then transmitted backward into the pulmonary vasculature and the right side of the heart. When mitral stenosis is suspected, echocardiography can be useful for determining etiology (specifically whether it is rheumatic or not), estimating the valve areas and gradients across the valve, assessing the left atrium, and assessing right ventricular size and function. Assessment of left atrial size and right ventricular size and function is particularly useful in helping determine the severity of the mitral stenosis.
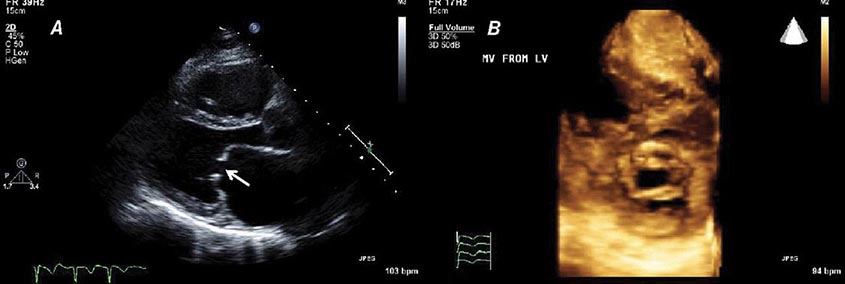
FIGURE 270e-24 A. Rheumatic mitral stenosis showing pliable leaflets tethered at the tips (arrow). Note the characteristically enlarged left atrium. B. Mitral stenosis visualized from a three-dimensional echocardiogram.
MYOCARDIAL INFARCTION AND HEART FAILURE
Role of Imaging after Myocardial Infarction Imaging can be particularly useful in the immediate and long-term follow-up of patients with myocardial infarction. As discussed earlier in the chapter, CMR is the best technique for direct assessment of infarcted myocardium. LGE imaging by CMR provides accurate delineation of infarct size and morphology. In a recent multicenter study, LGE imaging by CMR identified infarct location accurately and detected acute and chronic infarcts with a sensitivity of 99% and 94%, respectively. With an in-plane spatial resolution of 1.5–2 mm and a high contrast-to-noise ratio, LGE by CMR has excellent sensitivity in detecting small areas of myocardial scar. In addition, regions of microvascular obstruction (no-reflow) can be seen as dense hypoenhanced areas within the core of a bright region of infarction. Both the presence of LGE and microvascular obstruction are markers of increased clinical risk.
While echocardiography is often used to assess myocardial function immediately after myocardial infarction, myocardial stunning is common in the early post–myocardial infarction period, especially in patients who undergo reperfusion therapy. In these patients, either partial or complete recovery of ventricular function is common within several days, so that early estimation of ejection fraction may be misleading. In patients with uncomplicated myocardial infarction, imaging can generally be deferred for several days so that a more accurate assessment of cardiac function, including regional wall motion, can be assessed (Fig. 270e-25).
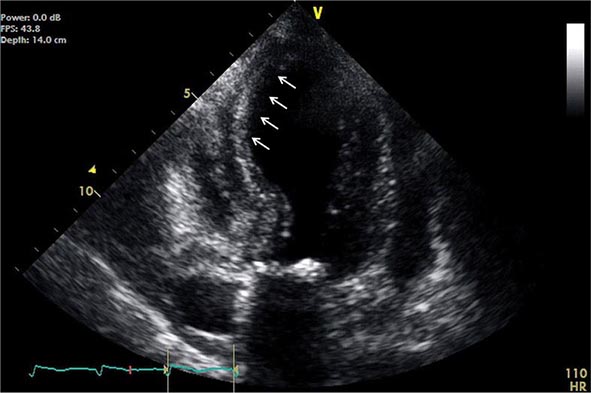
FIGURE 270e-25 Acute left anterior descending artery distribution myocardial infarction at end systole showing akinetic region (arrows).
Echocardiography is the best method for assessment of patients with suspected mechanical complications after myocardial infarction. These include mitral regurgitation secondary to either papillary muscle dysfunction or rupture of papillary muscle head, ventricular septal defect, or even cardiac rupture. A new severe systolic murmur should raise suspicions for either severe mitral regurgitation or ventricular septal defect. While cardiac rupture is often catastrophic, contained ruptures, also known as pseudoaneurysms, can occur, and early diagnosis and surgical treatment are the best way to maximize survival. The presence of thrombus within the pericardial space following myocardial infarction should immediately raise suspicion of myocardial rupture and represents a surgical emergency.
Some patients demonstrate progressive left ventricular dilatation and dysfunction, known as cardiac remodeling, after myocardial infarction. Assessment of cardiac function and regional wall motion is useful in the follow-up period, generally between 1 and 6 months following infarction. The persistence of left ventricular systolic dysfunction following infarction is used to determine the type of therapy (e.g., angiotensin-converting enzyme inhibitors or angiotensin receptor blockers are typically used in patients with systolic dysfunction following myocardial infarction).
In patients with acute or subacute myocardial infarction, investigation of residual ischemia and/or viability is occasionally an important clinical question, especially among those with recurrent symptoms after myocardial infarction (Fig. 270e-26). All cardiac imaging techniques can provide information regarding myocardial viability and ischemia. In the absence of definitive trials offering head-to-head comparisons between techniques in large series of patients, uncertainty persists concerning the relative accuracies of each method for predicting functional and prognostic benefit after revascularization. Thus, one should exercise caution in the interpretation of the relative diagnostic accuracy of each imaging technology. Nevertheless, the available data suggest that radionuclide imaging, especially PET, is highly sensitive, with higher negative predictive value than dobutamine echocardiography. In contrast, dobutamine echocardiography tends to be associated with higher specificity and positive predictive accuracy than the radionuclide imaging methods. The experience with CMR suggests that it offers similar predictive accuracies as those seen with dobutamine echocardiography.
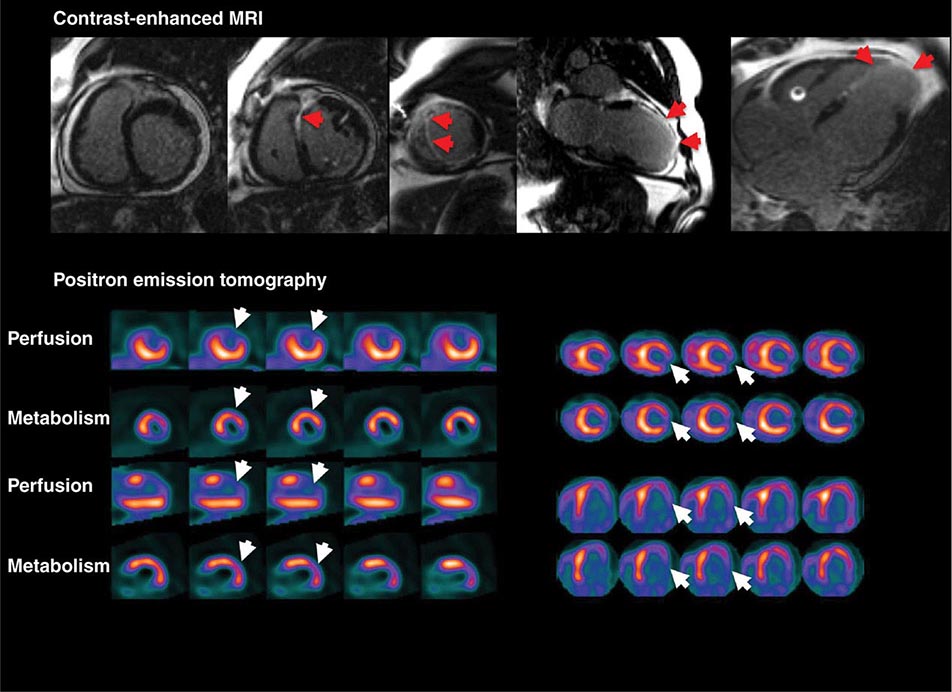
FIGURE 270e-26 Examples of myocardial viability patterns obtained with cardiac magnetic resonance imaging (MRI) and positron emission tomography (PET) in three different patients with coronary artery disease. The top panel demonstrates extensive late gadolinium enhancement (bright white areas) involving the anterior, anteroseptal, and apical left ventricular walls (arrows), consistent with myocardial scar and nonviable myocardium. The lower left panel demonstrates rubidium-82 myocardial perfusion and 18F-fluorodeoxyglucose (FDG) images showing a large and severe perfusion defect in the anterior, anterolateral, and apical walls, indicating preserved glucose metabolism (so-called perfusion-metabolic mismatch) consistent with viable myocardium. The right lower panel shows similar PET images demonstrating concordant reduction in perfusion and metabolism (so called perfusion-metabolic match) in the lateral wall, consistent with nonviable myocardium.
Role of Imaging in New-Onset Heart Failure Echocardiography is usually a first-line test in patients presenting with new-onset heart failure. As discussed above, this test provides a direct assessment of ventricular function and can help distinguish patients with reduced ejection fraction from those with preserved ejection fraction. In addition, it provides additional structural information including an assessment of valves, myocardium, and pericardium.
Although coronary angiography is commonly performed in patients with reduced ejection fraction, the determination of heart failure etiology in an individual patient may be difficult even if angiographically obstructive CAD is present. Indeed, patients with heart failure and no angiographic CAD may have typical angina or regional wall motion abnormalities on noninvasive imaging, whereas patients with angiographically obstructive CAD may have no symptoms of angina or history of myocardial infarction. Thus, the appropriate classification for any given patient is not always clear, and it often requires the complementary information of coronary angiography and noninvasive imaging. Stress radionuclide imaging and echocardiography can be helpful in delineating the extent and severity of inducible myocardial ischemia and viability. Multiparametric CMR can be quite helpful in the differential diagnosis of heart failure etiologies. Apart from quantifying left and right ventricular volumes and function, CMR can provide information about myocardial ischemia and scar. The pattern of LGE helps differentiate infarction (typically starting in the subendocardium and involving a coronary territory) from other forms of infiltrative or inflammatory cardiomyopathies (typically involving the mid- or subepicardial layers without following a coronary distribution) (Fig. 270e-27). In addition, it can assess the presence of myocardial edema (e.g., myocarditis) and quantify myocardial iron deposition that can potentially lead to cardiac toxicity. Infiltrative cardiomyopathy such as amyloidosis typically has a restrictive cardiomyopathy pattern (bilateral atrial enlargement and biventricular increased wall thickness). CMR of patients with cardiac amyloidosis often also demonstrates a characteristic pattern of diffuse endocardial infiltration of the left ventricle and the atria (Fig. 270e-27). Hypertrophic cardiomyopathy has variable degree of increased ventricular thickness, and often is seen to have outflow obstruction and intense LGE in regions with marked hypertrophy (Fig. 270e-28). CMR also can quantify myocardial iron content in patients at risk of iron-overload cardiomyopathy (Video 270e-7).
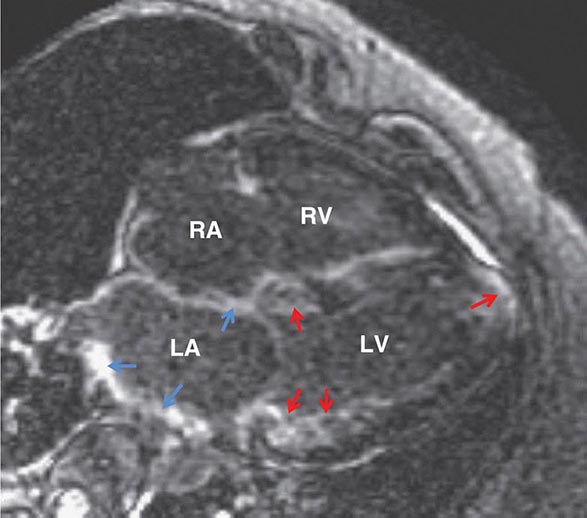
FIGURE 270e-27 A case of cardiac amyloidosis. Note on this late gadolinium enhancement image that there were multiple foci of gadolinium accumulation in the left ventricle (LV) myocardium (red arrows), as well as the left atrial (LA) walls (blue arrows). The LV walls were markedly increased in thickness, and both atria were dilated, consistent with a restrictive cardiac morphology. The blood pool signal was diminished after contrast injection, which was consistent with high burden of amyloid disease in other organs that causes gadolinium concentration in the blood to rapidly go down. RA, right atrium; RV, right ventricle.
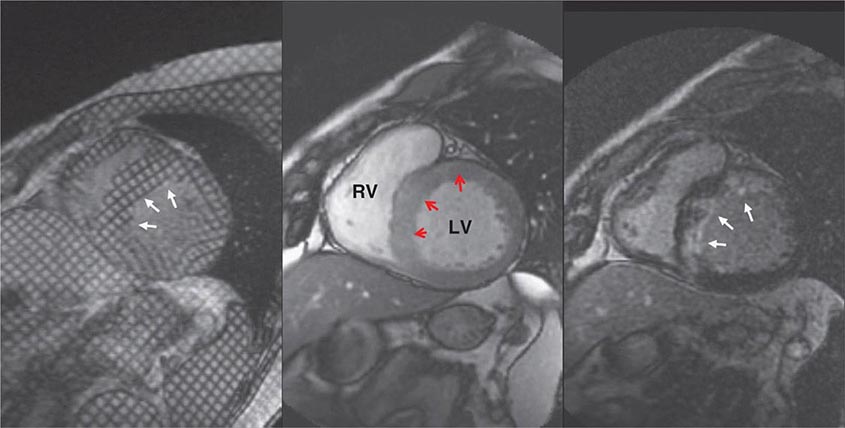
FIGURE 270e-28 This figure demonstrates three pulse sequence techniques by cardiac magnetic resonance that are often used to assess patients with hypertrophic cardiomyopathy, all displayed in the mid short-axis scan plane. The center panel demonstrates that the left ventricle (LV) was markedly thickened in its wall thickness especially in the LV septum (red arrows). This finding was matched by marked regions of late gadolinium enhancement (LGE), which was consistent with fibrosis in these segments (right panel, white arrows). The left panel was cine myocardial tagging in the same slice plane. Myocardial tagging is used to assess the normal intramyocardial strain by assessing distortion of the myocardial grids during systole. In this case, despite normalappearing systolic radial wall thickening, the myocardial strain as assessed by the distortion of grids was markedly reduced (left panel, white arrows). This finding is consistent with substantial myofibril disarray in the anterior and anteroseptal segments in this patient. RV, right ventricle.
PET metabolic imaging has a complementary role in the evaluation of inflammatory cardiomyopathies, especially sarcoidosis. In patients with suspected cardiac sarcoidosis, the presence of focal and/or diffuse glucose uptake can help identify areas of active sarcoidosis. In addition, for patients undergoing immunosuppressive therapy, PET is frequently used to monitor therapeutic response (Fig. 270e-29). In patients with ischemic cardiomyopathy, radionuclide imaging in general and PET in particular are frequently used to quantify the presence and extent of myocardial ischemia and viability to assist with clinical decision making related to myocardial revascularization (Fig. 270e-26).
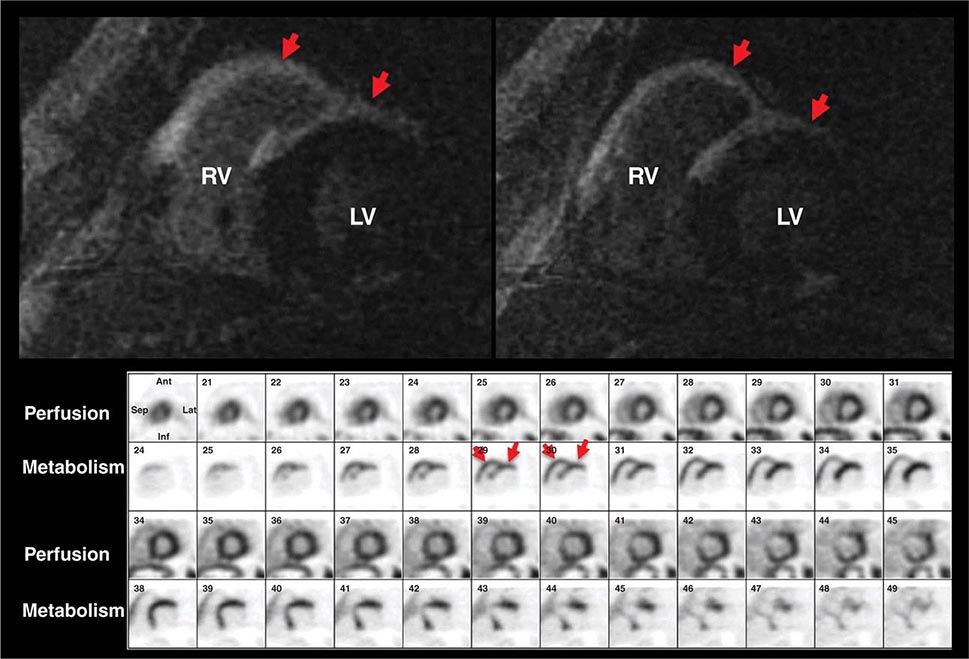
FIGURE 270e-29 Representative cardiac magnetic resonance (CMR; top panel) and positron emission tomography (PET; lower panel) images from a 45-year-old male presenting with complete heart block. The CMR images demonstrate extensive late gadolinium enhancement in the subepicardial left ventricular (LV) anterior and anteroseptal walls and also in the right ventricular (RV) free wall (arrows). The PET images demonstrate extensive fluorodeoxyglucose uptake in the same areas, most consistent with active inflammation due to sarcoidosis.
ASSESSING CARDIAC FUNCTION IN PATIENTS UNDERGOING CANCER TREATMENT
Therapies used to treat cancer can adversely affect the cardiovascular system. As the efficacy of cancer treatment and survival improve, many patients are presenting with late adverse consequences from chemotherapy and/or radiation therapy on cardiovascular function. Thus, the morbidity and mortality from late cardiovascular complications threaten to offset the early gains in cancer survival, especially among children and young adults. Early recognition and treatment of cardiomyocyte injury are critical for successful application of preventative therapies, but difficult because the adverse effects on cardiac function are a relatively late manifestation after exposure to anticancer therapy.
The accepted standard for clinical diagnosis of cardiotoxicity is defined as a >5% reduction in LVEF to <55% with symptoms of heart failure, or a >10% drop in LVEF to <55% in patients who are asymptomatic. Thus, noninvasive imaging plays a major role in diagnosing and monitoring for cardiac toxicity in patients undergoing cancer treatment. Radionuclide angiography has been the technique of choice for quite some time. However, this is rapidly changing, and echocardiography now plays a major role in this application.
Recently, more novel imaging approaches have been advocated, including deformation imaging with echocardiography and fibrosis imaging with CMR. These techniques have shown promising results in experimental animal models and in humans. In addition, there are also proof-of-concept studies in animal models using molecular imaging approaches targeting the mechanisms of cardiac toxicity (e.g., apoptosis and oxidant stress), which can presumably provide the earliest signs of the off-target effects of these therapies. However, all of these techniques are currently considered experimental.
PERICARDIAL DISEASE
The fibroelastic pericardial sac surrounding the heart consists of a visceral, or epicardial, layer and a parietal layer, with a generally small amount of pericardial fluid in between layers. The pericardium is generally quite pliable and moves easily with the heart during contraction and relaxation. Abnormalities of the pericardium can affect cardiac function primarily by impairing the heart’s ability to fill. Inflammation of the pericardium can lead to an accumulation of fluid between the two layers, or pericardial effusion, which can be visualized by echocardiography, CMR, or CT. Other reasons for accumulation of pericardial fluid include infection, malignancy, and bleeding into the pericardium. The latter can be the result of catastrophic processes such as trauma, cardiac rupture, perforation in the setting of a cardiac procedure, cardiac surgery, or dissection of the aorta with extension in the pericardium.
Echocardiography remains the initial test of choice for assessing pericardial disease, especially effusions (Fig. 270e-30). Moreover, echocardiography can be useful in evaluating for pericardial constrictive physiology, in which a thick noncompliant pericardium impairs cardiac filling. The location, size, and physiologic consequences of accumulated pericardial effusion can generally easily be determined by echocardiography. Pericardial tamponade occurs when enough pericardial fluid accumulates so that the intrapericardial pressure exceeds filling pressures of the heart, generally the right ventricle. The balance between intrapericardial pressure and ventricular pressure is more important than the extent of fluid accumulation. Conditions in which pericardial effusions accumulate over a long period of time, as can be the case in the setting of malignant effusions, can lead to large pericardial fluid accumulations without the classic hemodynamic findings associated with pericardial tamponade. In contrast, rapid accumulations of pericardial fluid, such as those that occur due to cardiac rupture or perforation, can lead to tamponade physiology without very large effusions. In patients with suspected pericardial effusion or tamponade, echocardiography can usually be performed rapidly, at the bedside, and even by operators with limited skill. The distance from the parietal to the visceral pericardial layer can be measured, and when this exceeds approximately 1 cm, an effusion is considered significant. Echocardiographic features suggestive of tamponade include diastolic collapse of the right ventricular free wall, suggestive of pericardial pressures that exceed right ventricular filling pressures, and Doppler evidence of respiratory flow variation, which is the Doppler equivalent of pulsus paradoxus. Despite the benefits of echocardiography in suspected pericardial tamponade, the diagnosis of tamponade remains a clinical diagnosis, and other important features, such as patient’s blood pressure in the presence of pulsus paradoxus, needs to be taken into account when considering therapeutic options.
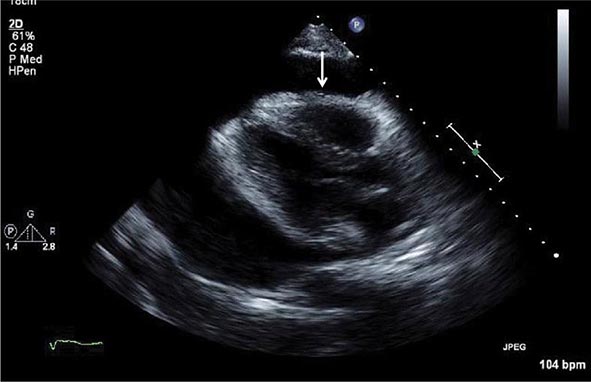
FIGURE 270e-30 Pericardial effusion with tamponade physiology. The right ventricle (arrow) is small and collapsing in end diastole due to increased pericardial pressure.
Chronic inflammation of the pericardium can lead to thickening and potentially calcification of the parietal pericardium, resulting in pericardial constriction in which diastolic filling can be severely impaired. In these cases, filling of the ventricles comes to an abrupt halt when the volume of ventricular filling is impaired by the constricting pericardium. Assessment of pericardial thickness in these patients is important, but it is just as important to note that approximately one in five patients with severe pericardial constriction have no significant pericardial thickening by imaging or at surgery. Thus, a lack of thickened pericardium does not rule out pericardial constriction, and patients’ signs and symptomatology and physiologic evidence of constriction should be assessed independently. Pericardial constriction typically demonstrates marked respiratory changes in diastolic flow on Doppler echocardiography, in contrast to restrictive cardiomyopathy, but substantial overlap exists. CT and CMR offer tomographic, whole-heart assessment of pericardial thickening and other anatomy abnormalities in pericardial constriction (enlarged atria, vena cavas, pleural and pericardial effusions) (Fig. 270e-31 and Video 270e-8). CMR offers the additional information of pericardial fibrosis and inflammation by LGE imaging, as well as evidence of constrictive physiology (e.g., regional relaxation concordance due to myocardial adhesions, paradoxical septal motion at rest or during Valsalva maneuver).
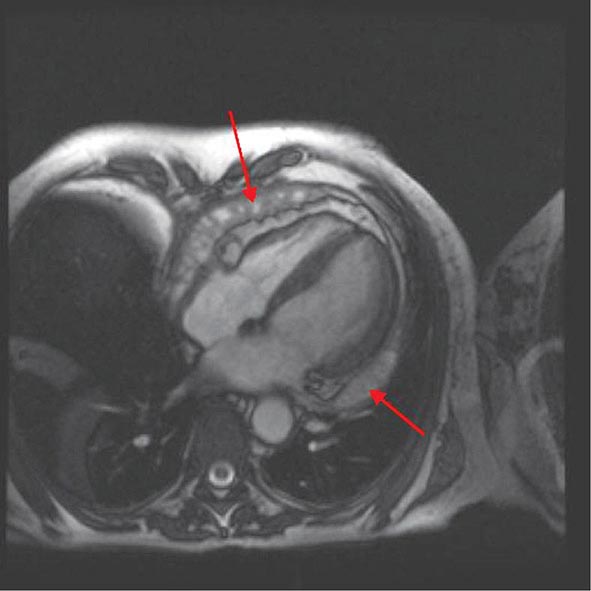
FIGURE 270e-31 A female patient developed pericardial constriction and right heart failure, secondary to radiation therapy for breast cancer. Note the multiple pericardial adhesions (red arrows).
CARDIAC THROMBUS AND MASS
Echocardiography is usually the modality that first detects the presence of a cardiac mass. Differential diagnoses of an intracardiac mass most often include thrombus, tumor, or vegetation. Given their unrestricted tomographic views and multiplanar three-dimensional imaging, CMR and CT can complement echocardiography by further characterizing the physical features of the cardiac mass. Compared to CT, CMR has the advantage of higher tissue contrast differentiation, more robust cine imaging, and the use of multifaceted techniques within the same imaging session to determine the physiologic characteristics of the mass. Gadolinium contrast enhancement patterns of increased capillary perfusion can help to determine the presence and extent of vascularity within the mass, relevant for differentiating tumor from thrombus. Structures that are known to mimic a cardiac mass include (1) anatomic variants, such as the Eustachian valve, Chiari network, crista sagittalis or terminalis, and the right ventricular moderator band, and (2) “pseudotumors,” such as interatrial septal aneurysm, coronary or aortic aneurysm, lipomatous hypertrophy of interatrial septum, hiatal hernia, or a catheter/pacemaker lead. A number of coexisting conditions should raise the likelihood of a cardiac thrombus (Fig. 270e-32), including regional wall motion abnormality from infarction or ventricular aneurysm, atrial fibrillation leading to slow flow in the left atrial appendage, or presence of venous catheters or recent endovascular injury. CMR has the advantage of being able to assess regional wall motion and infarction or ventricular aneurysm in matching scan planes, adjacent to the cardiac thrombus, using cine and LGE imaging, respectively. For ventricular thrombus, gadolinium-enhanced LGE imaging can detect thrombus at a higher sensitivity than echocardiography by depicting high-contrast difference between the dark thrombus and its adjacent structures and by imaging in three dimensions. In addition, mural thrombus does not enhance on first-pass perfusion and often has a characteristic “etched” appearance (black border surrounding a bright center) on LGE imaging, thus providing higher diagnostic specificity than anatomic information alone (Fig. 270e-33). Comparing the signal intensities of a mass before and after contrast injection may confirm the lack of tissue vascularity (i.e., thrombus) by the lack of signal enhancement after contrast administration. Like intracardiac thrombus, regions of microvascular obstruction also appear dark, but microvascular obstruction is confined within the myocardium and surrounded by infarction and thus can be differentiated from intracardiac thrombus. CMR imaging for small thrombus in the left atrial appendage is difficult due to slow flow in the atrium and rhythm irregularity from atrial fibrillation, but it may be helpful in cases where transesophageal echocardiography is suboptimal or not feasible.
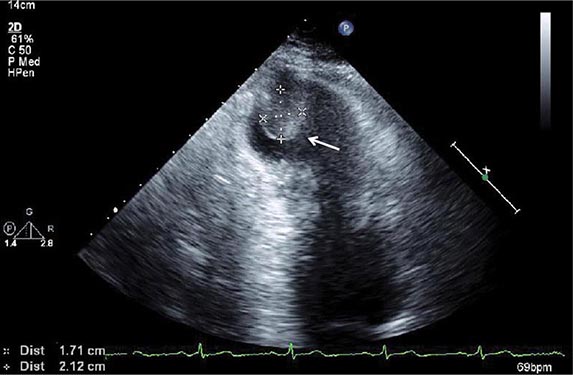
FIGURE 270e-32 Cardiac thrombus (arrow) in an apical aneurysmal region following acute myocardial infarction.
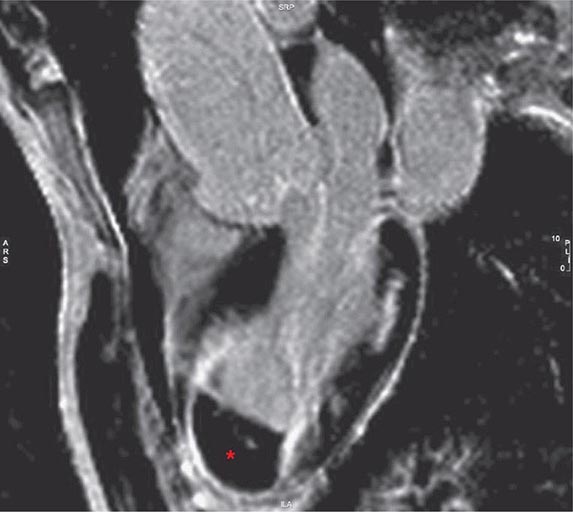
FIGURE 270e-33 Late gadolinium enhancement image of a massive anterior infarction complicated by a dyskinetic left ventricular LV aneurysm and intracavitary thrombus (red asterisk).
The majority of cardiac malignancy is metastatic, and metastatic cardiac malignancy is far more common than primary cardiac malignancies; these metastatic involvements of the heart are the result of direct invasion (e.g., lung and breast), lymphatic spread (e.g., lymphomas and melanomas), or hematogenous spread (e.g., renal cell carcinoma). Primary benign cardiac tumors are seen mostly in children and young adults and include atrial myxoma, rhabdomyoma, fibroma, and endocardial fibroelastoma (Fig. 270e-34). Atrial myxomas are often seen as a round or multilobar mass in the left atrium (75%), right atrium (20%), or ventricles or mixed chambers (5%). They typically have inhomogeneous brightness in the center on cine steady-state free precession imaging due to their gelatinous contents and may have a pedunculated attachment to the fossa ovalis. Primary malignant cardiac tumors are extremely rare and include angiosarcoma, fibrosarcoma, rhabdomyosarcoma, and liposarcoma.
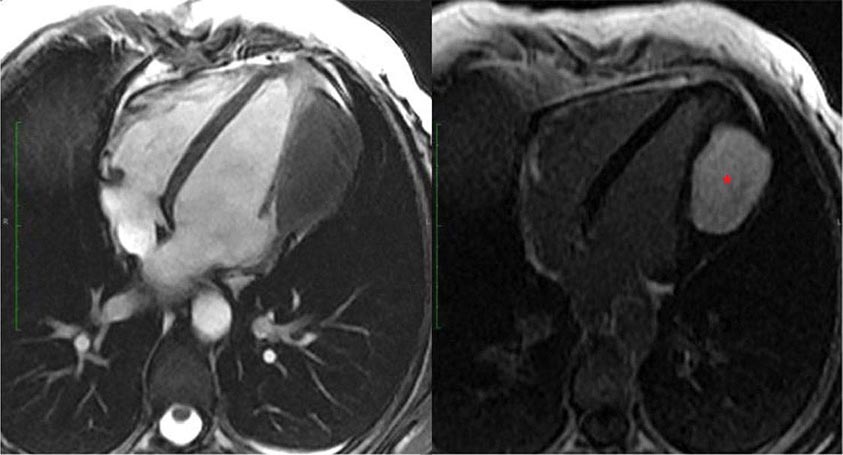
FIGURE 270e-34 A case of a cardiac fibroma. A patient presented with shortness of breath and was found to have a large myocardial mass on echocardiography. Cine cardiac magnetic resonance imaging confirmed the large myocardial mass involving the anterolateral wall. Shortly after gadolinium contrast was injected, the myocardial mass demonstrated intense accumulation of contrast on LGE imaging (right panel, asterisk). This is a case of cardiac fibroma. The patient also has gingival hyperplasia and bifid thoracic ribs, a part of the rare Gorlin’s syndrome.
ROLE OF IMAGING IN INFECTIOUS AND INFLAMMATORY DISEASE
Patients with suspected endocarditis often undergo echocardiography for the purpose of identifying vegetations or intramyocardial abscesses. Vegetations are generally highly mobile structures that most typically are attached to valves or present in areas of the heart with turbulent flow. The absence of a vegetation on echocardiography does not rule out endocarditis, because small vegetations below the resolution of the imaging techniques can be present. Echocardiography remains the best technique for assessment of vegetations because its high temporal resolution allows visualization of the typical oscillating motion, although large vegetations can be visualized with other techniques (Fig. 270e-35). The size and location of a vegetation do not necessarily provide any specific information about the type of infection. Abscesses, particularly around the aortic and mitral annuli, are particularly concerning in patients with endocarditis and should be suspected in patients with prolongation of cardiac intervals in the setting of endocarditis. Visualization of both vegetations and possible abscesses is best done with transesophageal echocardiography, particularly in patients with prosthetic valves. Indeed, transesophageal echocardiography is the first test of choice in a patient with a mechanical mitral or aortic valve and suspected endocarditis (Fig. 270e-35). Vegetations should be measured because their size has prognostic importance and can be used to decide whether a patient should be taken to surgery.
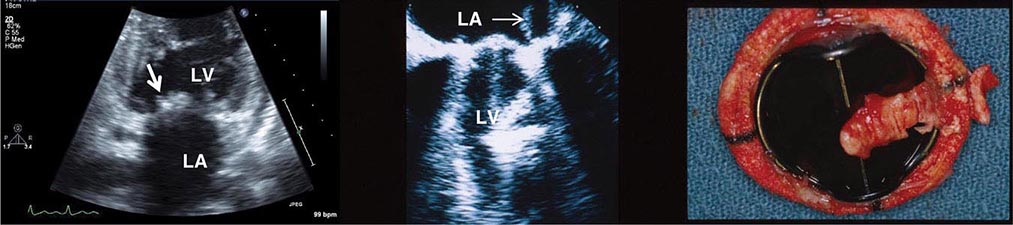
FIGURE 270e-35 Vegetation on native mitral valve (left panel, arrow). Left atrium (LA) and left ventricle (LV) are indicated. Middle panel shows a vegetation on a mechanical prosthesis (St. Jude) indicated by an arrow; right panel shows vegetation on prosthesis after excision.
PET metabolic imaging is emerging as a potentially useful imaging technique to identify the source of infection in patients with prosthetic valves, vascular grafts, and implantable pacemakers/defibrillators, especially in patients in whom echocardiography and/or blood cultures are negative. There is an emerging literature documenting the potential value of macrophage-targeted metabolic imaging with 18F-FDG and PET (Fig. 270e-36). Likewise, FDG PET is also useful to identify vascular inflammation and monitor the response to immunosuppressive therapy (Fig. 270e-37).
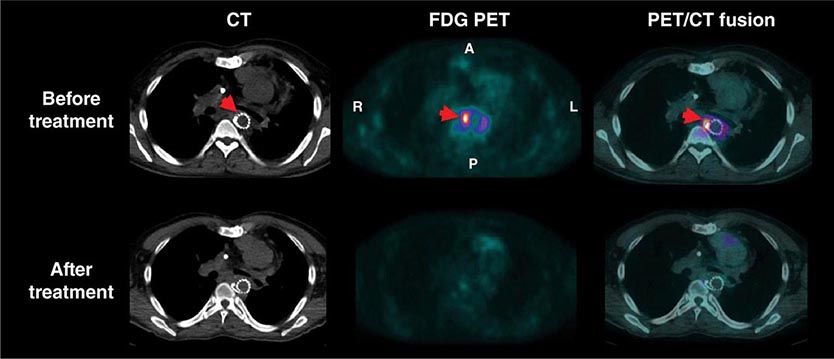
FIGURE 270e-36 Representative cross-sectional computed tomography (CT; left), fluorodeoxyglucose (FDG) positron emission tomography (PET; middle), and fused CT and PET (right) images before and after antibiotic treatment in a patient with fever and suspected infection of the stent placed in the descending portion of the aortic arch (arrow) for treatment of aortic coarctation. The FDG images before treatment demonstrate intense glucose uptake within the stent, consistent with inflammation/infection. The lower panel demonstrates significant attenuation of the FDG signal after treatment. (Images courtesy of Dr. Sharmila Dorbala, Brigham and Women’s Hospital.)
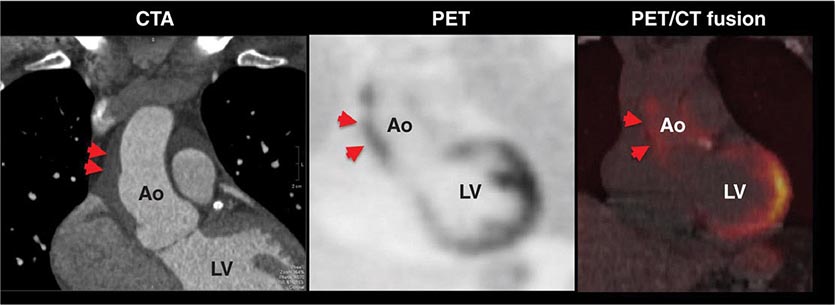
FIGURE 270e-37 Representative coronal computed tomography (CT) angiographic (CTA; left panel), fluorodeoxyglucose (FDG) positron emission tomography (PET; middle panel), and fused CT and PET (right panel) images in a patient with suspected aortitis. The CTA images demonstrate thickening of the ascending aorta (Ao), which correlates with intense, focal FDG uptake consistent with active inflammation. LV, left ventricle.
EVALUATION OF COMMON CONGENITAL ABNORMALITIES IN THE ADULT
While a discussion of complex congenital heart disease is beyond the scope of this chapter, a number of common congenital abnormalities are present in adults, and cardiac imaging is essential to diagnosing and managing these conditions. Abnormalities of the interatrial septum probably represent the most common adult congenital cardiac abnormalities. Patent foramen ovale (PFO) can be identified in almost 25% of patients. In patients with PFO, a one-way flap in the region of the fossa ovalis is normally kept close by the left atrial pressure, which is generally higher than right atrial pressure for the majority of the cardiac cycle. However, right-to-left flow through a PFO can occur any time the right atrial pressure exceeds the left atrial pressure, including with maneuvers or conditions in which intrathoracic pressure is increased. The presence of a PFO can increase the likelihood of the paradoxical embolus, and thus the presence of a PFO should be determined in patients with stroke or systemic embolus of unknown etiology. Because the one-way flap of the PFO will be closed during much of the cardiac cycle, color flow Doppler will usually not reveal a PFO. Instead, agitated saline (bubble study) is the best way to assess for PFO or atrial septal defect. Saline is agitated and injected peripherally and then enters the right atrium. If no shunt is present, only the right side of the heart will be pacified because the air bubbles will be too small to traverse the lungs. Because PFO is a one-way flap, maneuvers should be used to temporarily increase right atrial pressure. Either a Valsalva maneuver or sniff maneuver can be effective.
Atrial septal defects occur most commonly in the region of the fossa ovalis, referred to as secundum-type defects (Fig. 270e-38). Additional atrial septal defects include defects of the sinus venosus and atrium primum. Color flow Doppler echocardiography is usually sufficient for diagnosis of a secundum-type atrial septal defect, but agitated saline is generally needed for the diagnosis of other types of atrial septal defects.
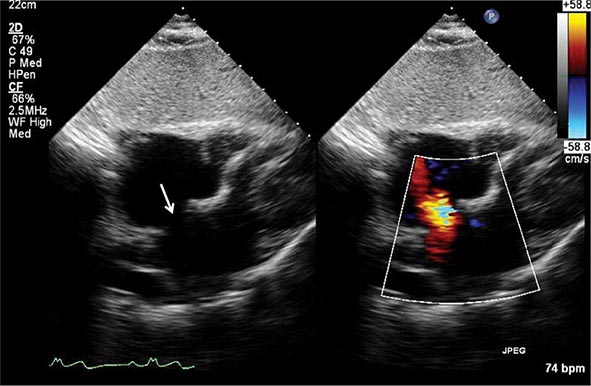
FIGURE 270e-38 Large secundum-type atrial septal defect (arrow) noted in the subcostal view with color flow Doppler showing flow through the defect (right).
Ventricular septal defects can generally be visualized by color flow Doppler as turbulent high-velocity jets from the left to the right ventricle. In cases where the jet origin is unclear, continuous wave Doppler can estimate the velocities. These would be expected to be extremely high to reflect the pressure gradient between the left and right ventricles. Defects can occur in both the muscular and membranous portions of the ventricular septum.
In patients with either atrial or ventricular septal defects, estimation of the severity of the left-to-right shunt is essential and can be an important determinant in management decisions. Shunts are generally assessed by echocardiography by assessing the relationship between pulmonary flow and aortic flow, the Qp/Qs ratio. Shunts and cardiac anatomy of most congenital heart diseases can also be accurately evaluated by CMR (Fig. 270e-39).
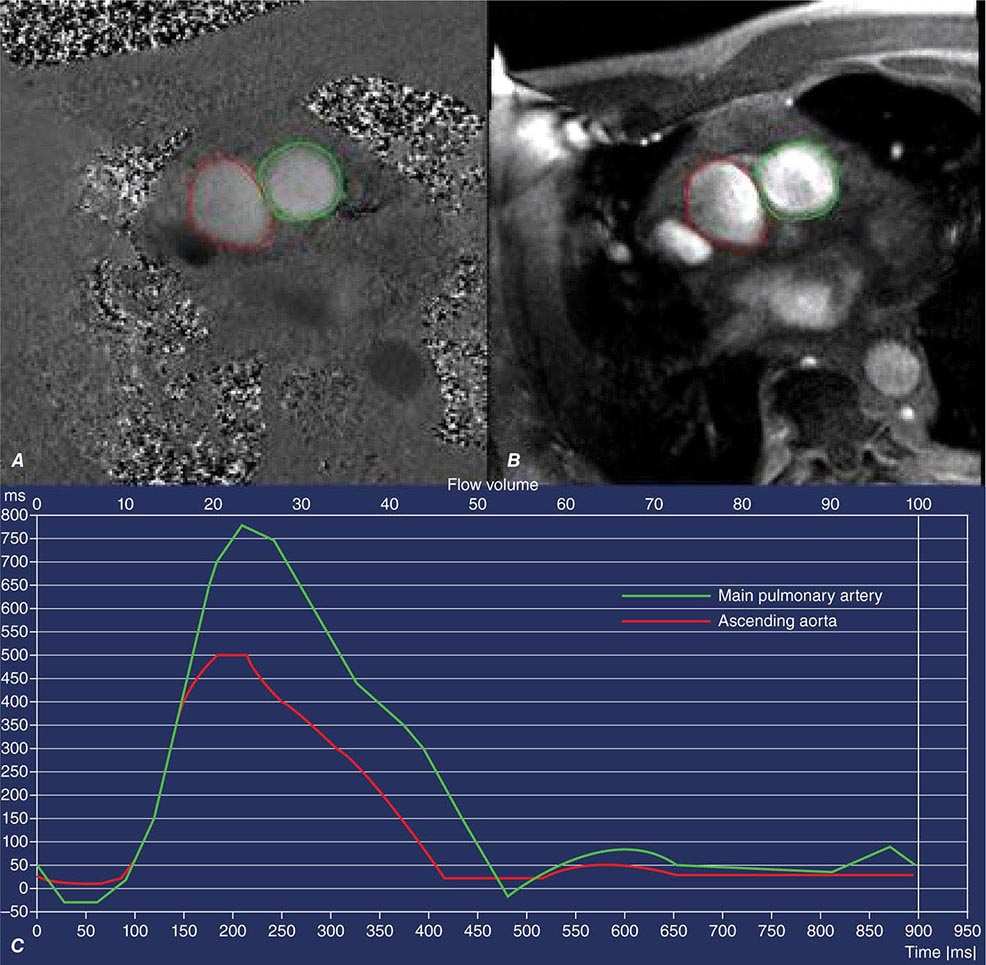
FIGURE 270e-39 A and B are phase contrast images that display blood flow (phase images on A) and anatomy (structural images on B) of the aorta (red) and pulmonary artery (green). C demonstrates the flow curves of the aorta (red) and the pulmonary artery (green). Note that the total flow (area under the curve) was substantially higher in the pulmonary artery than the aorta, indicative of a marked elevated pulmonary-to-systemic shunt ratio, as a result of the partial anomalous pulmonary venous return that drained into the superior vena cava.
VIDEO 270e-1 Cine steady-state free precession (SSFP) imaging (left) in short axis in a patient who had a large anterior myocardial infarction. Only one cut of a stack of short axis is shown. This method allows quantification of left ventricular (LV) and right ventricular (RV) volumes in diastole and systole and calculation of the LV ejection fraction, stroke volumes, and cardiac output (a product of LV stroke volume and heart rate). Note that in this case there is anterior and anteroseptal akinesia (lack of systolic wall thickening, as shown by the left cine movie, red arrows) matching by a near-transmural myocardial infarction as seen by the matching late gadolinium enhancement (LGE) image (right picture, white arrows).
VIDEO 270e-2 This is cine cardiac magnetic resonance (CMR) imaging of a patient in the long-axis four-chamber view. Note that the basal aspect of the right ventricular (RV) free wall is thickened, aneurysmal, and akinetic (red arrows). The global RV systolic function is mildly reduced, and the RV is dilated. CMR can image the RV using tomographic views and can quantify the RV volumes and ejection fraction volumetrically. This is a patient who presented with syncopal spells and inducible ventricular tachycardia on subsequent workup. He was diagnosed to have arrhythmogenic right ventricular dysplasia.
VIDEO 270e-3 Exercise echocardiogram showing rest images on left and poststress images on right, with parasternal long-axis, upper panel, and apical four-chamber, lower panel, end-systolic frames. Following exercise, the distal septal/apical region becomes akinetic. A = upper left (UL); B = upper right (UR); C = lower left (LL); D = lower right (LR).
VIDEO 270e-4 The video shows cardiac magnetic resonance (CMR) myocardial perfusion imaging during vasodilating stress, in three parallel-short-axis views. An bolus of gadolinium contrast was injected intravenously while rapid imaging acquisition occurred. The contrast enhances the right ventricle first, then travels through the pulmonary circulation, enters the left ventricle (LV), and then perfuses the LV myocardium. Myocardial perfusion defects with this technique show as black subendocardial rims, reflecting lack of contrast accumulation due to ischemia and/or scar. In this case, the anterior wall has a severe perfusion defect (red arrow). Figure 270-14 shows the late gadolinium enhancement (LGE) image of a mid short-axis view. There is no evidence of infarction in the anterior wall, which would be seen as bright white areas, indicating that the stress perfusion defect primarily represents myocardial ischemia. This patient had a significant stenosis of the left anterior descending coronary artery.
VIDEO 270e-5 A 60-year-old female presented with intermittent chest pain of 3 days in duration but was pain free at the time of assessment in the emergency room. Admission electrocardiogram (ECG) demonstrated T-wave inversion in the anterior precordial lead, but cardiac enzymes were normal. A resting cardiac magnetic resonance (CMR) study reviewed a large area of anteroseptal hypokinesia (left picture, region of hypokinesia shown by the red arrows), matching with a large resting perfusion defect (middle picture, perfusion defect shown by the blue arrows). Late gadolinium enhancement (LGE) imaging (right picture), however, did not show any enhancement to indicate any infarction in the anteroseptal wall, suggesting that the hypocontractile and hypoperfused anteroseptal wall was viable. Urgent coronary angiography demonstrated an acute thrombus in the mid left anterior descending coronary artery, which required coronary stenting. This case represents an example of acute coronary syndrome with hibernating but viable myocardium in the anteroseptal wall. The anteroseptal wall recovered contractile function when reassessed 6 months later.
VIDEO 270e-6 A patient with severe aortic regurgitation quantified by cardiac magnetic resonance (CMR). Notice the dark flow jet during diastolic across the aortic valve. For quantitation of the aortic regurgitation severity, a cross-sectional cut was made just below the aortic valve, perpendicular to the aortic regurgitation jet, using phase contrast flow imaging. Apart from aortic regurgitation fraction and volume, CMR also can volumetrically quantify ventricular sizes and dimensions of the aorta, which are useful in monitoring patients with aortic valve diseases.
VIDEO 270e-7 These are T2* images of the heart (left panel) and the liver (right panel) of a patient who has hemochromatosis. Note that iron and the liver are markedly darkened in these movies, indicating high load of iron in the heart muscle and liver. The rate of signal reduction (decay) in the myocardium and liver can be calculated as T2∗ value expressed in milliseconds. In this case, the T2∗ was at 10 ms. T2∗ <20 ms in patients with cardiomyopathy has been shown to indicate iron toxicity as the etiology of the cardiomyopathy, and it carries prognostic valve for such patients at risk of cardiac iron toxicity.
VIDEO 270e-8 This video shows the heart in long and short axis. Note the large atria, thickened pericardium, and extensive pericardial adhesions. Given the extensive pericardial adhesions, there is little shearing motion of the ventricles against the parietal pericardium.
271e |
Atlas of Noninvasive Imaging |
This chapter provides “movie” image clips as they are viewed in clinical practice, as well as additional static images. Noninvasive cardiac imaging is essential to the diagnosis and management of patients with known or suspected cardiovascular disease. This atlas supplements Chap. 270e, which describes the principles and clinical applications of these important techniques.
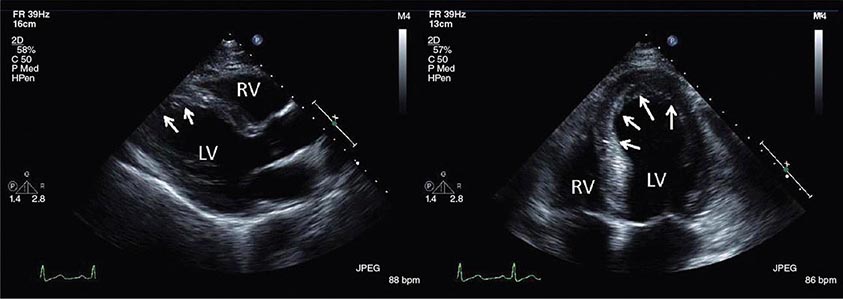
FIGURE 271e-1 A 48-year-old man with new-onset substernal chest pain. Echocardiography shows evidence of acute anterior myocardial infarction involving the interventricular septum and apex secondary to an occlusion of the left anterior descending coronary artery seen from the parasternal long axis view (left) and the apical four-chamber view (right). LV, left ventricle; RV, right ventricle. (See Videos 271e-1 and 271e-2.)
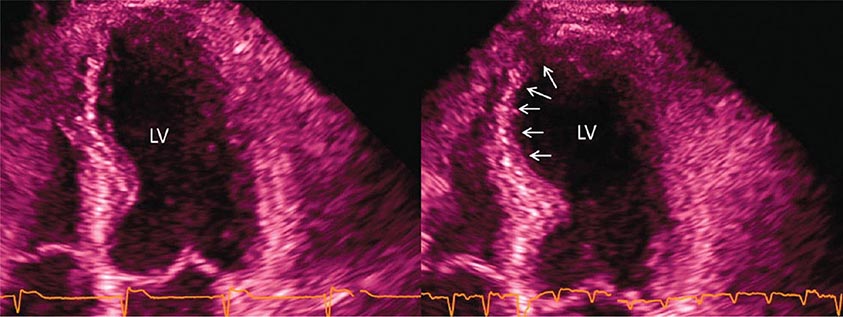
FIGURE 271e-2 A 55-year-old man with exertional chest discomfort and dyspnea. He exercised for 12 min on a standard Bruce protocol, experiencing typical chest pain and ST-segment depression in V2–V5. End-systolic frame of a stress echocardiogram shows apical four-chamber view at rest (left) and after exercise (right). After exercise, there is a clear regional wall motion abnormality in the distal septum through the apex, consistent with a stenosis in the left anterior descending artery distribution (arrows). LV, left ventricle. (See Videos 271e-3 and 271e-4.)
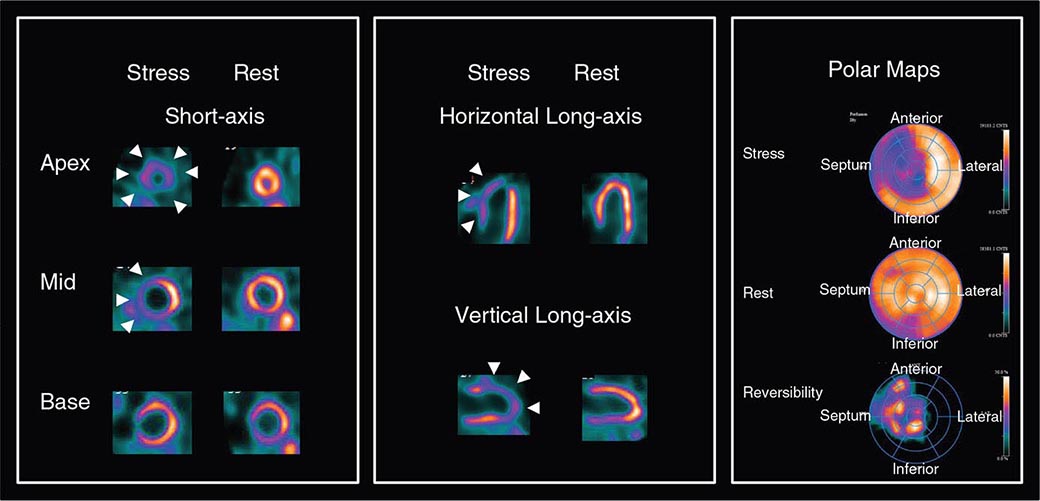
FIGURE 271e-3 Exercise single-photon emission computed tomography (SPECT) myocardial perfusion technetium-99m (99mTc) sestamibi scan in a 54-year-old male with a history of coronary artery disease and a prior coronary stent. The stress images (left and middle) show a large defect involving the apex, all apical segments, mid-inferior, mid-inferoseptum, and mid-anteroseptum (arrowheads), which is completely reversible at rest (right), reflecting a large area of exercise-induced myocardial ischemia throughout the left anterior descending coronary territory. The bull’s eye displays on the right panel depict the semiquantitative extent of ischemia (light yellow and blue areas represent the extent and severity of ischemia).
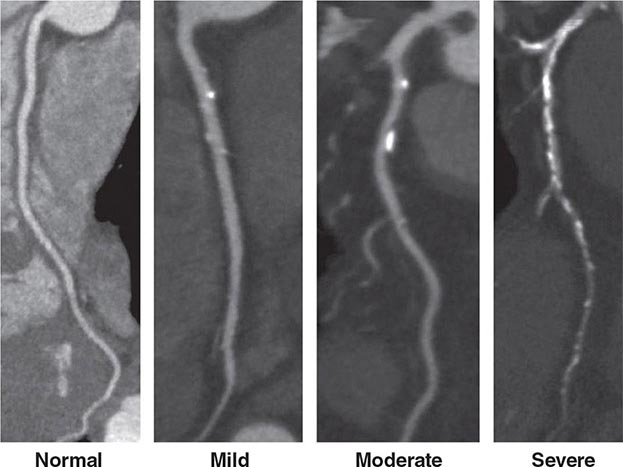
FIGURE 271e-4 Coronary computed tomography angiography (CTA). Curved multiplanar reformations demonstrating coronary artery disease severity, defined as normal (no plaque or stenosis), mild (<40%), moderate (40–69%), and severe (>70%) luminal narrowing. By guidelines for CTA reporting, alternative classification provides for stenosis grading as normal, minimal (1–24%), mild (25–49%), moderate (50–69%), severe (70–99%), and occluded (100%). (From GL Raff et al: SCCT guidelines for the interpretation and reporting of coronary computed tomographic angiography. J Cardiovasc Comput Tomogr 3:122, 2009; with permission.)
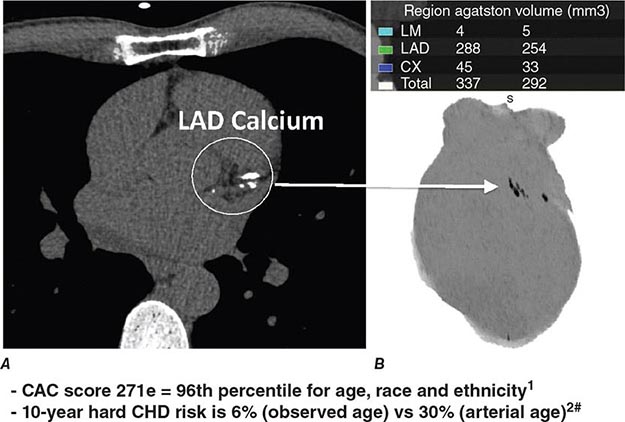
FIGURE 271e-5 Coronary artery calcium (CAC) scan on a 51-year-old white male without clinical cardiovascular disease or treated diabetes, referred for CAC for risk stratification to guide preventive therapies. A. Gated, noncontrast cardiac computed tomography (CT; 3-mm slice thickness), axial view, demonstrating calcified left anterior descending (LAD) artery atherosclerosis. B. Whole-heart three-dimensional image reconstruction, inverted maximum-intensity projection, demonstrating overall burden of CAC with predominant LAD distribution (arrow). Top right. CAC scores for each coronary artery with calcified plaque involvement, scored by Agatston method and total volume. #For white male with observed age 51 years, total cholesterol 220 mg/dL, high-density lipoprotein 45 mg/dL, nonsmoker, no hypertension, and systolic blood pressure 120 mmHg. Calculated arterial age is 81 years. CHD, coronary heart disease; CX, left circumflex artery; LM, left main artery. 1Data from RL McClelland et al: Circulation 113:30-37, 2006. 2Data from RL McClelland et al: Am J Cardiol 103:59-63, 2009.
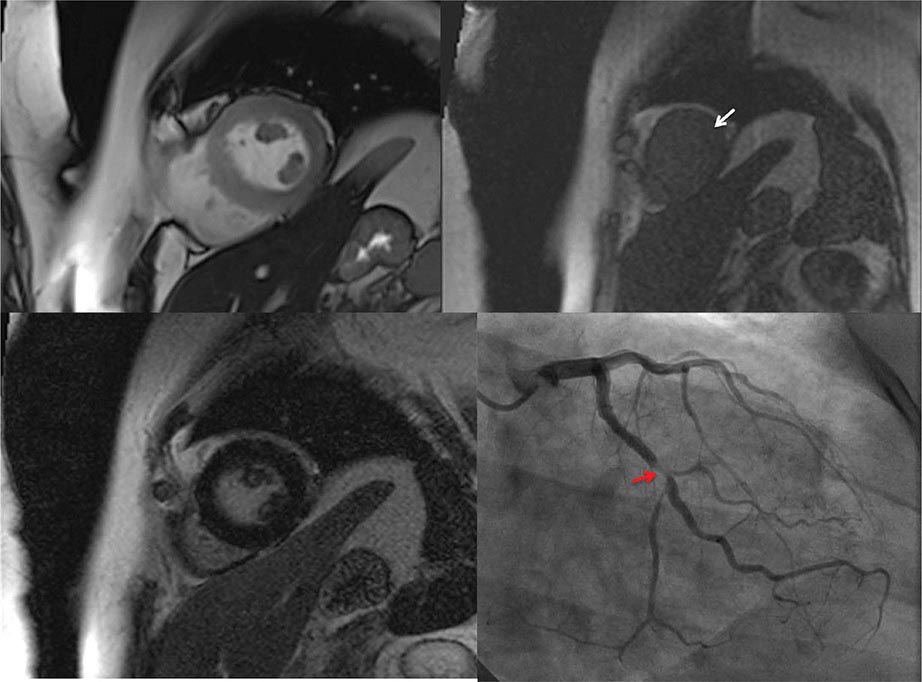
FIGURE 271e-6 Cardiac magnetic resonance (CMR) stress myocardial perfusion images in a 60-year-old patient with atypical chest pain. Cine movie short-axis image (left upper panel) shows normal left ventricle size and global and regional function at rest. During vasodilator stress, there is marked reduction of lateral wall perfusion (white arrow, right upper panel) as well as a mild defect in the septal wall. This region is confirmed to be viable by matching late gadolinium enhancement imaging (left lower panel), which demonstrated no evidence of infarction in the lateral wall. These findings are consistent with a severe coronary stenosis in the left circumflex artery. On angiography performed subsequently, there is a tight lesion in the left circumflex artery (red arrow, right lower panel). (See Videos 271e-5 and 271e-6.)
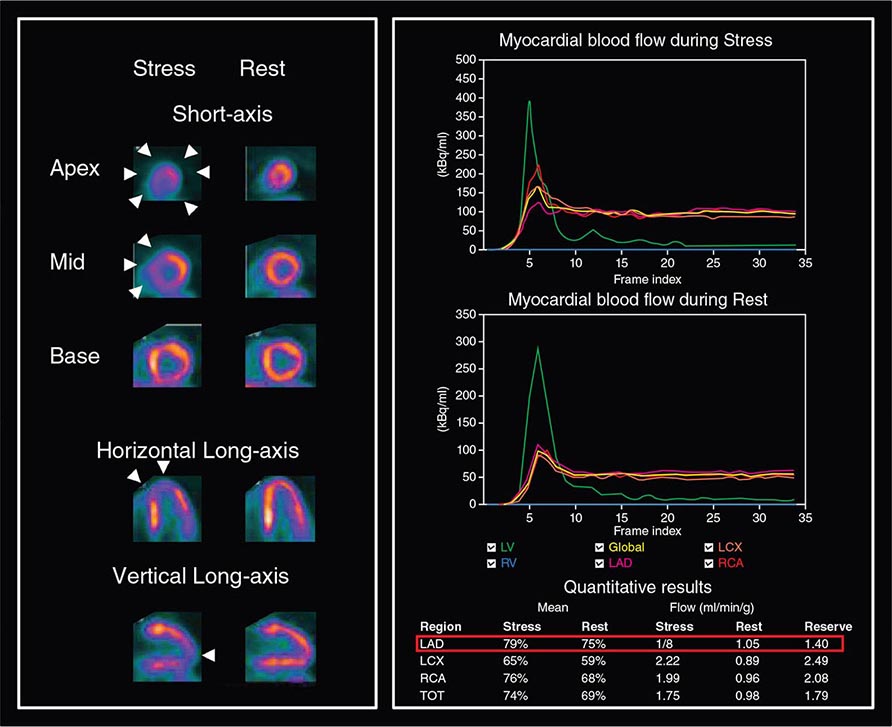
FIGURE 271e-7 Adenosine positron emission tomography (PET) myocardial perfusion 13N-ammonia scan in a 60-year-old female with atypical chest pain. The stress images (left) show a large defect involving the apex, all apical segments, mid-inferior, mid-inferoseptum, and midanteroseptum (arrowheads), which is completely reversible at rest (right). This is consistent with a medium-sized area of stress-induced ischemia in the mid portion of the left anterior descending (LAD) coronary artery. The right panel illustrates the time-activity curves used for quantification of myocardial blood flow (in mL/min per g of tissue) at peak stress (upper panel) and at rest (lower panel). Coronary flow reserve is then calculated as the ratio of stress/rest myocardial blood flow. The coronary flow reserve is abnormal in the LAD territory, and normal in the left circumflex (LCX) and right coronary artery (RCA) territories (i.e., >2.0). TOT, total left ventricle.
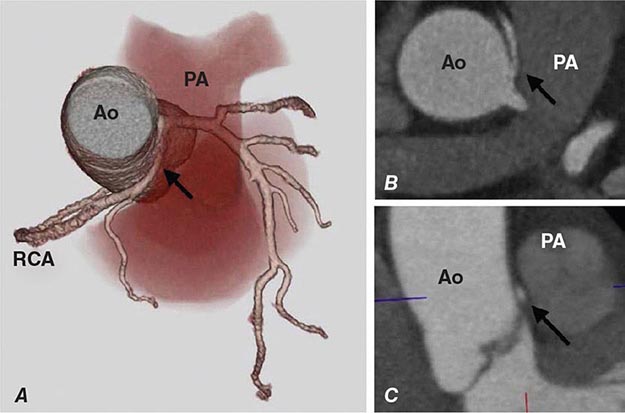
FIGURE 271e-8 Coronary computed tomography angiography (CTA) obtained on a 35-year-old female presenting to an outpatient clinic with a history of unexplained syncope and a 6-month complaint of intermittent, atypical chest pain occurring primarily during rest. Physical examination is normal. An exercise treadmill test is performed demonstrating good exercise capacity with no exertional chest pain or ischemic ECG changes. For persistent, unexplained symptoms, coronary CTA is obtained. A. Three-dimensional cardiac CT image reconstruction demonstrating anomalous right coronary artery (RCA) origin from the left coronary cusp with an acute angle takeoff (arrow) and an intraarterial course between the aorta (Ao) and main pulmonary artery (PA). B, C. Contrast-enhanced CTA in two-dimensional axial (B) and coronal oblique views (C) demonstrating proximal RCA intraarterial course between the Ao and main PA.
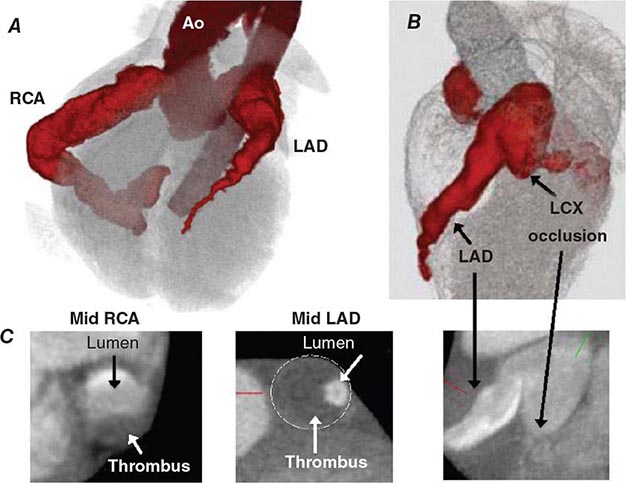
FIGURE 271e-9 Coronary computed tomography angiography (CTA) obtained from a 13-year-old boy with a history of Kawasaki disease who presented with limited exercise capacity and occasional, atypical chest pain. A, B. Three-dimensional cardiac CT image reconstruction demonstrating large three-vessel coronary artery diffuse aneurysms with proximal, nondominant left circumflex (LCX) artery occlusion. C. Two-dimensional contrast-enhanced coronary CTA demonstrating mid-RCA and mid-LAD thrombi that are nonocclusive layered and near circumferential thrombi, respectively, and proximal LCX occlusion. Ao, aorta; CT, computed tomography; LAD, left anterior descending; RCA, right coronary artery.
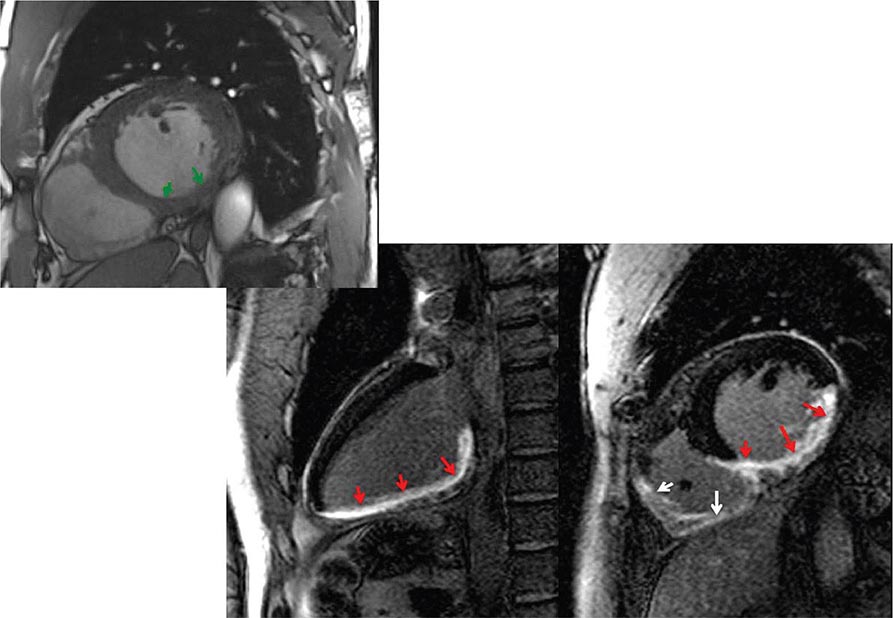
FIGURE 271e-10 A case of viability assessment in a patient with inferior myocardial infarction. The cine movie in the upper panel shows an area of inferior akinesis (green arrows). Magnetic resonance image demonstrates transmural contrast enhancement of the inferior wall (red arrows) and the right ventricle (white arrows), which is consistent with infarction. Imaging the heart 10–15 min after injection of gadolinium allows for the accumulation of gadolinium in infarcted tissue (red arrows), which identifies nonviable infarcted myocardium as bright. Viability assessment, as in this case, can provide guidance for any benefits of invasive coronary intervention. In this case, the inferior wall is nonviable. Apart from the inferior wall infarction (red arrows), there is extensive right ventricular infarction (white arrows). (See Video 271e-7.)
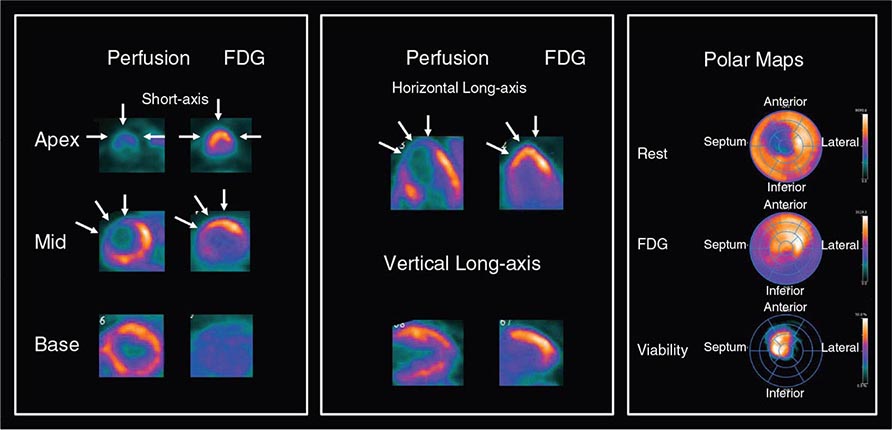
FIGURE 271e-11 Rest myocardial perfusion and metabolism positron emission tomography (PET) scan obtained with 13N-ammonia (perfusion) and 18F-fluorodeoxyglucose (FDG; glucose metabolism) in a 48-year-old male with a prior myocardial infarction. The rest perfusion images show a large defect involving the apex, apical segments, and mid-anteroseptal and anterior segments (arrowheads), which has associated increase in glucose uptake (perfusion-metabolic mismatch), reflecting viable but hibernating myocardium throughout the left anterior descending coronary territory.
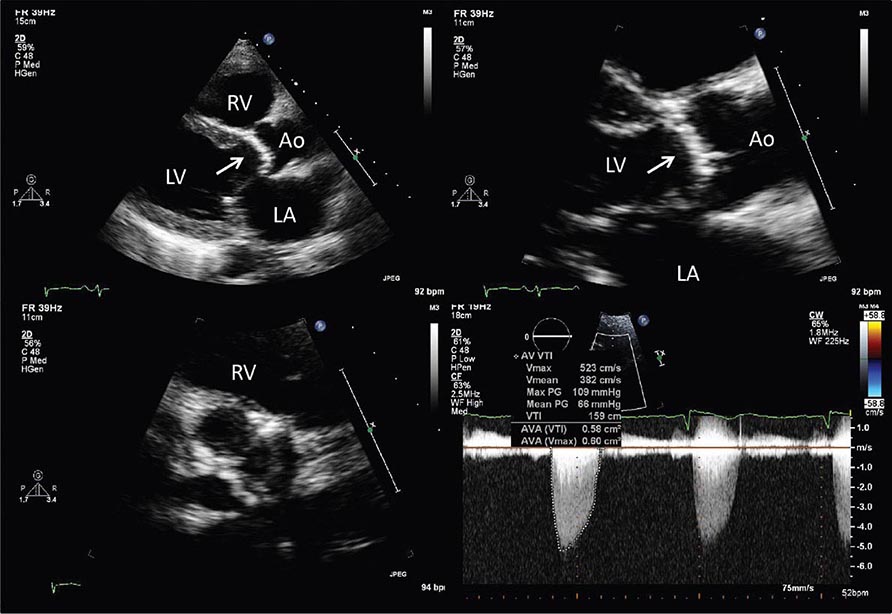
FIGURE 271e-12 A 70-year-old patient with known cardiac murmur and progressive shortness of breath and a recent episode of syncope. Echocardiography shows severe calcific aortic stenosis. A heavily calcified aortic valve (arrow) is shown in the parasternal long-axis views (top panels) and short-axis view (bottom left). Doppler interrogation shows a peak transaortic velocity of 5.2 m/s consistent with a peak instantaneous gradient of 109 mmHg and a mean gradient of 66 mmHg, and a corresponding aortic valve area of <0.6 cm2 (lower right). Ao, aorta; LA, left atrium; LV, left ventricle; RV, right ventricle. (See Videos 271e-8, 271e-9, and 271e-10.)
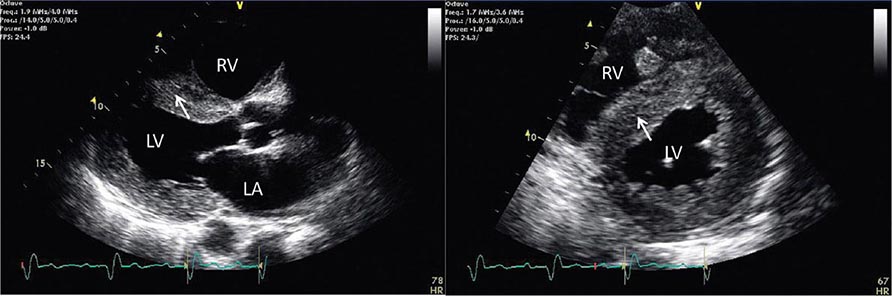
FIGURE 271e-13 A 66-year-old patient with multiple myeloma and progressive shortness of breath. Echocardiography shows features typical of cardiac amyloidosis, including thickened myocardium with a “sparkly” appearance and left atrial enlargement. Systolic function is mildly reduced, and diastolic function is severely reduced. LA, left atrium; LV, left ventricle; RV, right ventricle. (See Videos 271e-11 and 271e-12.)
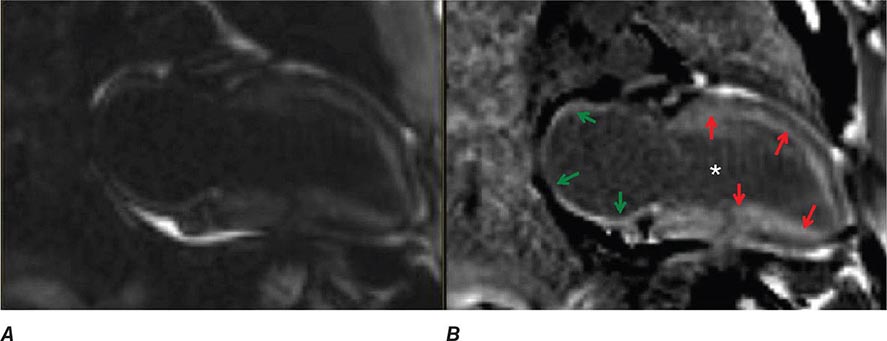
FIGURE 271e-14 Magnetic resonance image with contrast enhancement in magnitude (A), and phase-sensitive reconstructed images (B) 5–10 min after injection of gadolinium in a patient with transthyretin (TTR)-mediated amyloidosis. The phase-sensitive reconstruction (B) enhances the region of abnormal collection of gadolinium, making gadolinium enhancement in the ventricle (red arrows) and the atrium (green arrows) more prominent. Amyloidosis causes accumulation of abnormal interstitial proteins, which results in late gadolinium enhancement in a diffuse subendocardial pattern (red arrows). Blood pool signal is characteristically dark (asterisk) owing to sequestration of gadolinium into other organs.
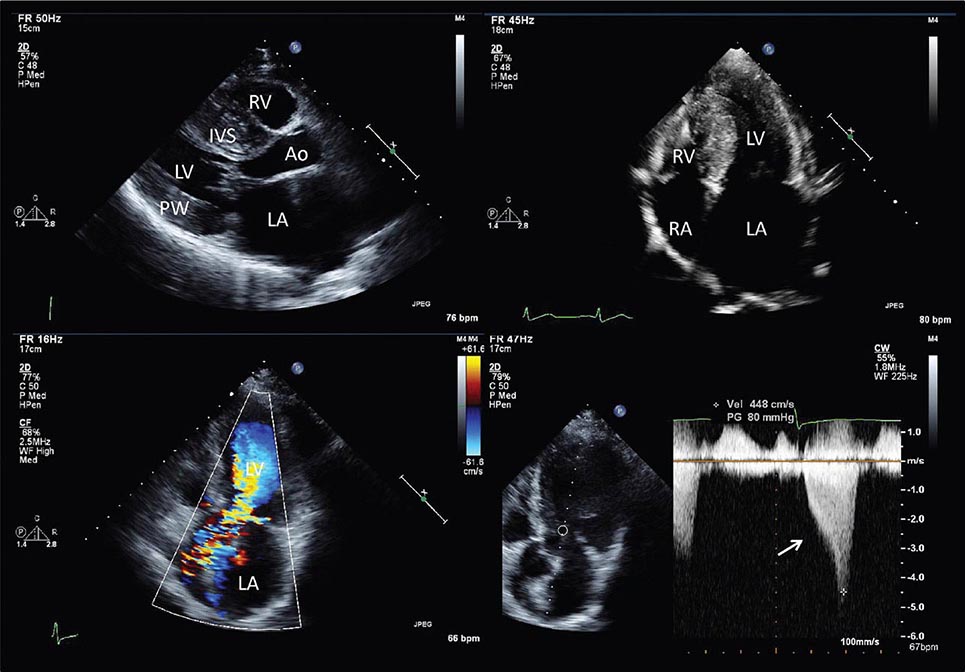
FIGURE 271e-15 A 34-year-old woman with known cardiac murmur and syncope with a family history of sudden cardiac death. Echocardiogram shows classic findings of hypertrophic cardiomyopathy, including marked left ventricular wall thickness, particularly in the interventricular septum, notable in the parasternal long-axis view (upper left) and apical view (upper right). Note reverse septal curvature in the apical view (upper left). There is substantial flow acceleration through the left ventricular outflow tract (lower left) with evidence of a late peaking systolic gradient (arrow, lower right) caused by outflow tract obstruction. Ao, aorta; IVS, interventricular septum; LA, left atrium; LV, left ventricle; PW, posterior wall; RV, right ventricle. (See Videos 271e-13, 271e-14, and 271e-15.)
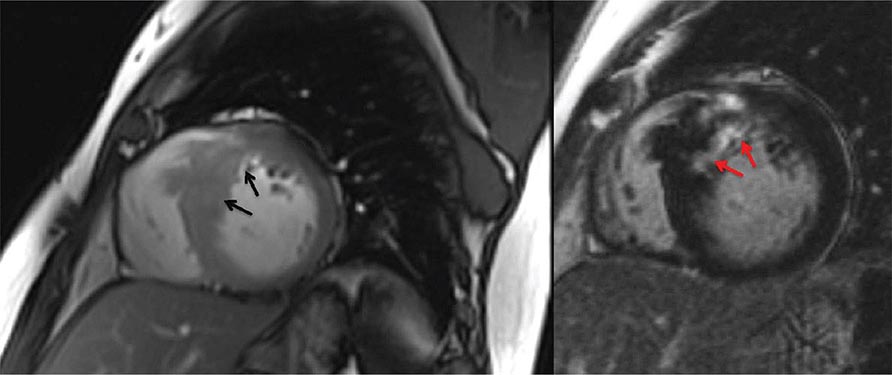
FIGURE 271e-16 Magnetic resonance image with contrast enhancement in a patient with hypertrophic cardiomyopathy. Note the marked thickened anteroseptal wall (black arrows, left panel) consistent with asymmetric septal hypertrophy. After contrast is injected, this region demonstrated heterogeneous foci of contrast enhancement (right panel, red arrows) consistent with myocardial fibrosis due to myofibril disarray in this condition. This typical enhancement pattern of hypertrophic cardiomyopathy is found in the areas of maximum wall thickness, typically at the anteroseptum as in this case. (See Video 271e-16.)
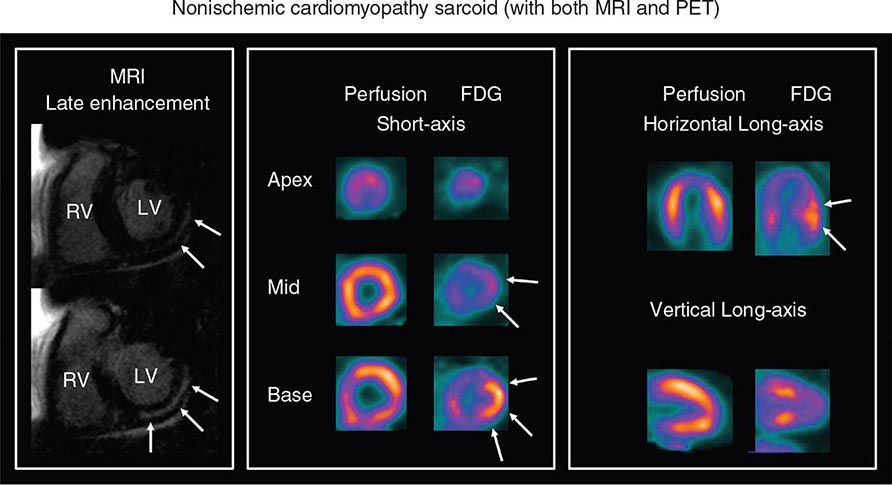
FIGURE 271e-17 Late gadolinium enhancement cardiac magnetic resonance imaging (MRI) (left panel) and rest myocardial perfusion and fluorodeoxyglucose (FDG) positron emission tomography (PET)/computed tomography (CT) studies (middle and right panels) in a 48-year-old male with a complete heart block. The MRI images demonstrate a linear area of mid-wall late gadolinium enhancement involving the inferior and inferolateral walls (arrows). The myocardial perfusion images were normal. However, the FDG images demonstrated a focal area of intense glucose uptake in the inferolateral wall, corresponding to the area of late enhancement on MRI. This is consistent with focal active sarcoidosis. LV, left ventricle; RV, right ventricle.
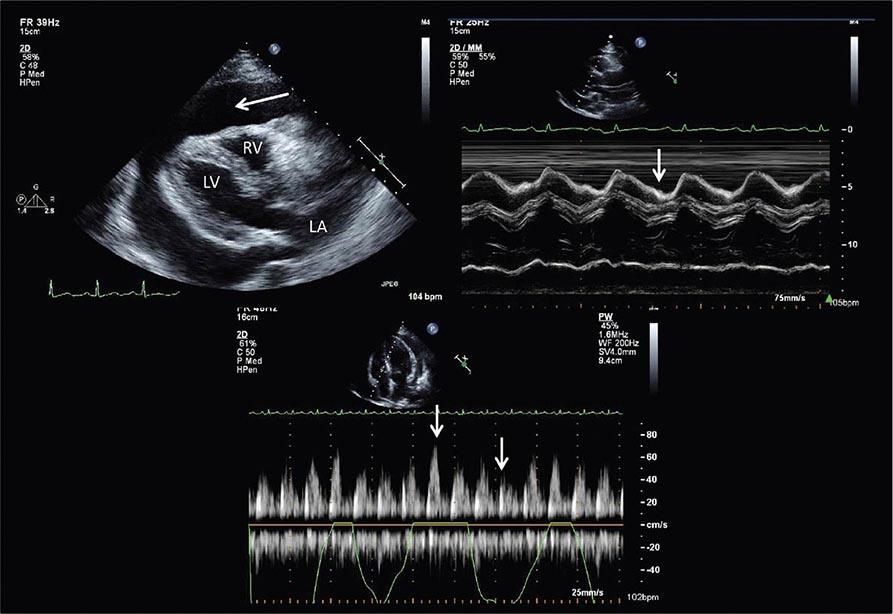
FIGURE 271e-18 A 46-year-old patient with malignant melanoma who presents with acute shortness of breath. Echocardiogram reveals a large pericardial effusion (arrow, upper left) with evidence of cardiac tamponade. M-mode echocardiography (upper right) shows evidence of collapse of the right ventricular free wall during diastole (arrow). Doppler echocardiography (lower panel) shows evidence of respiratory flow variation, consistent with a pulsus paradoxus. LA, left atrium; LV, left ventricle; RV, right ventricle. (See Video 271e-17.)
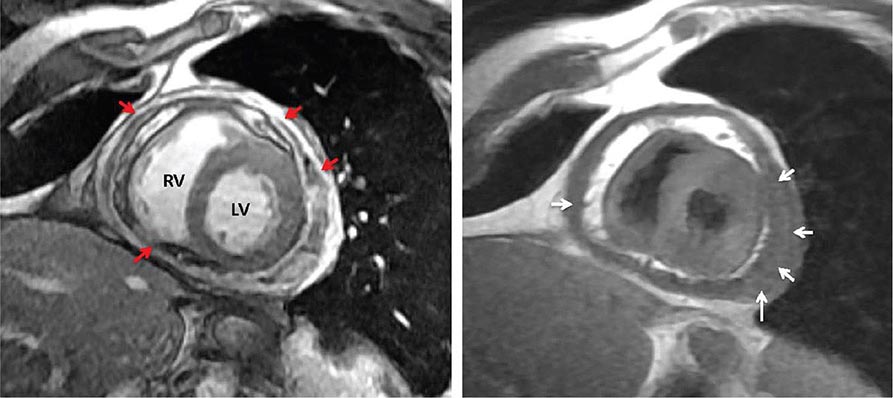
FIGURE 271e-19 Diffuse pericardial thickening (left; red arrows) and circumferential effusion (right; white arrows) associated with effusive-constrictive pericarditis. Effusive-constrictive pericarditis is a progressive condition that has varying degrees of hemodynamic consequences due initially to the collection of pericardial fluid and ultimately to pericardial constriction. It is typically suspected in cases where pericardiocentesis fails to normalize intracardiac pressures. In this example, pericardial fluid analysis resulted in a sterile exudate of leukocytes and erythrocytes. LV, left ventricle; RV, right ventricle.
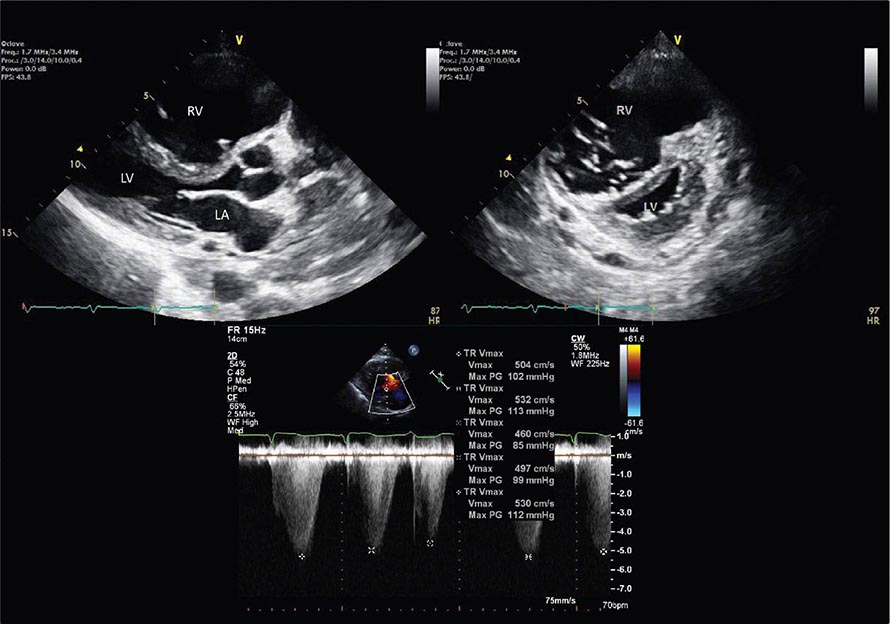
FIGURE 271e-20 A 48-year-old woman with severe idiopathic pulmonary hypertension. Echocardiography reveals evidence of marked right ventricular volume and pressure overload as evidenced by enlarged right ventricle (upper left and right), small left ventricle (upper left and upper right), and flattening of the interventricular septum (D-shaped septum) in systole and diastole (upper right). Tricuspid regurgitation velocity, which reflects the pressure gradient between the right ventricle and the left ventricle, is markedly elevated at 5 m/s, consistent with a right ventricle to right atrial pressure gradient of 100 mmHg, which is consistent with systemic right-sided pressures. LA, left atrium; LV, left ventricle; RV, right ventricle. (See Videos 271e-18 and 271e-19.)
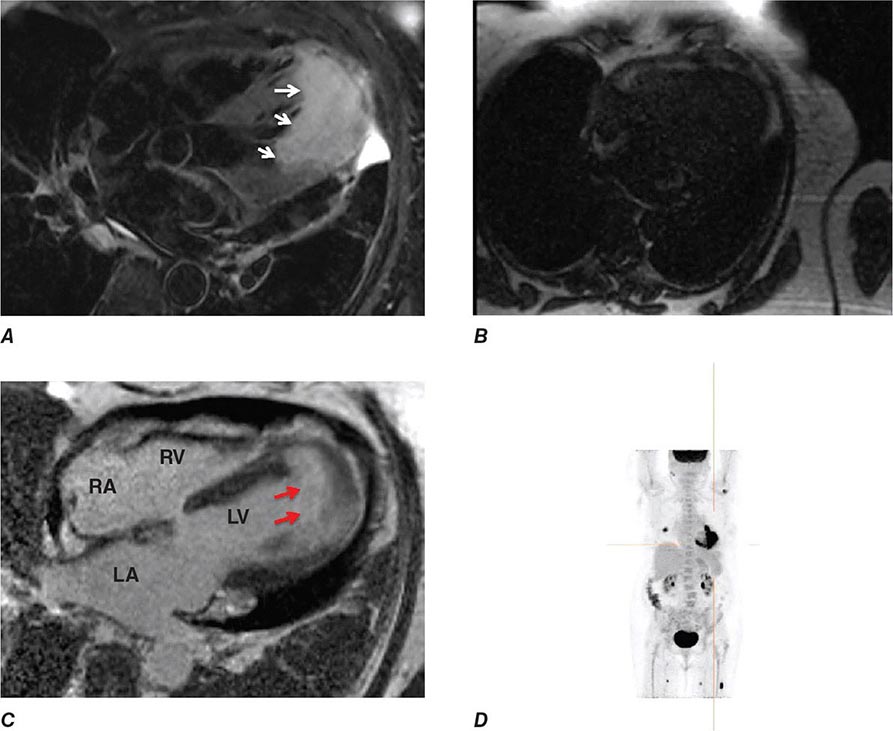
FIGURE 271e-21 Metastatic cardiac tumor diagnosed by cardiac magnetic resonance (MR) in a patient who presented with chest pain and inferior ST elevation. Left heart catheterization was normal. Cardiac MR demonstrates extensive myocardial edema (A, white arrows) with marked reduction in first perfusion (B) and accumulation of gadolinium within the cardiac mass 10–15 min after injection of gadolinium (C, red arrows). D. Positron emission tomography scan showed increased fluorodeoxyglucose uptake in a lung mass as well as in the cardiac mass, consistent with cardiac metastasis. Biopsy of the lung mass revealed adenosquamous carcinoma of the lung. LA, left atrium; LV, left ventricle; RA, right atrium; RV, right ventricle. (See Videos 271e-20 and 271e-21.)
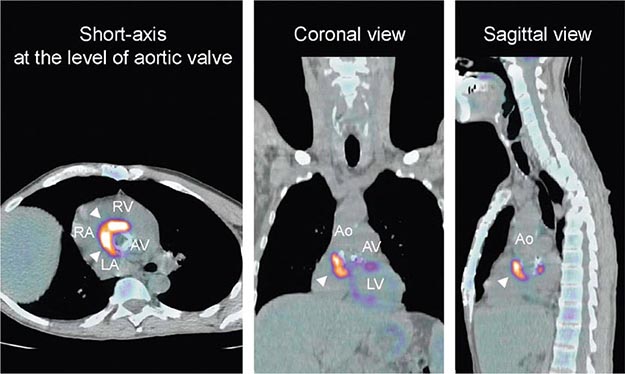
FIGURE 271e-22 Fluorodeoxyglucose (FDG) positron emission tomography (PET)/computed tomography (CT) in a 52-year-old male with a prior aortic valve replacement who presented with fever and was found to have Haemophilus parainfluenzae bacteremia. The multiplanar reformatted fused PET/CT images demonstrate intense FDG uptake surrounding the aortic valve prosthesis (arrowheads), compatible with a paravalvular abscess. The patient was found to have purulent fluid around the valve during surgery, and he underwent an aortic valve replacement. Ao, aorta; AV, aortic valve; LA, left atrium; LV, left ventricle; RA, right atrium; RV, right ventricle.
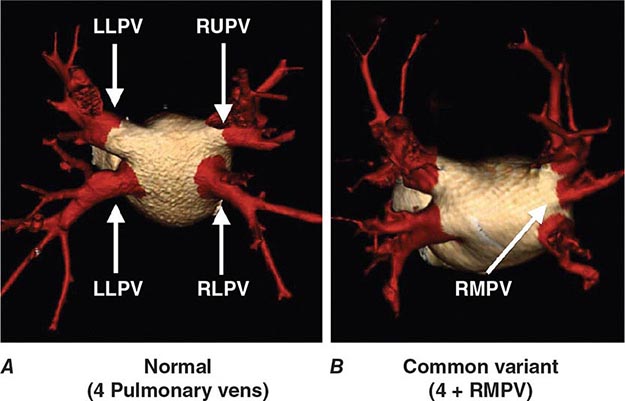
FIGURE 271e-23 Cardiac computed tomography (CT) pulmonary vein mapping in a 62-year-old male with symptomatic, paroxysmal atrial fibrillation referred for cardiac CT for pulmonary vein mapping prior to planned pulmonary vein isolation. Three-dimensional image reconstruction, demonstrating (A) normal pulmonary vein anatomy and (B) common variant with presence of separate right middle pulmonary vein (RMPV) ostium. LLPV, left lower pulmonary vein; LUPV, left upper pulmonary vein; RLPV, right lower pulmonary vein; RUPV, right upper pulmonary vein.
272 |
Diagnostic Cardiac Catheterization and Coronary Angiography |
Diagnostic cardiac catheterization and coronary angiography are considered the gold standard in the assessment of the anatomy and physiology of the heart and its associated vasculature. In 1929, Forssmann demonstrated the feasibility of cardiac catheterization in humans when he passed a urological catheter from a vein in his arm to his right atrium and documented the catheter’s position in the heart by x-ray. In the 1940s, Cournand and Richards applied this technique to patients with cardiovascular disease to evaluate cardiac function. These three physicians were awarded the Nobel Prize in 1956. In 1958, Sones inadvertently performed the first selective coronary angiography when a catheter in the left ventricle slipped back across the aortic valve, engaged the right coronary artery, and power-injected 40 mL of contrast down the vessel. The resulting angiogram provided superb anatomic detail of the artery, and the patient suffered no adverse effects. Sones went on to develop selective coronary catheters, which were modified further by Judkins, who developed preformed catheters and allowed coronary artery angiography to gain widespread use as a diagnostic tool. In the United States, cardiac catheterization is the second most common operative procedure, with more than one million procedures performed annually.
CARDIAC CATHETERIZATION
INDICATIONS, RISKS, AND PREPROCEDURE MANAGEMENT
Cardiac catheterization and coronary angiography are indicated to evaluate the extent and severity of cardiac disease in symptomatic patients and to determine if medical, surgical, or catheter-based interventions are warranted (Table 272-1). They are also used to exclude severe disease in symptomatic patients with equivocal findings on noninvasive studies and in patients with chest-pain syndromes of unclear etiology for whom a definitive diagnosis is necessary for management. Cardiac catheterization is not mandatory prior to cardiac surgery in some younger patients who have congenital or valvular heart disease that is well defined by noninvasive imaging and who do not have symptoms or risk factors that suggest concomitant coronary artery disease.
|
INDICATIONS FOR CARDIAC CATHETERIZATION AND CORONARY ANGIOGRAPHY |
The risks associated with elective cardiac catheterization are relatively low, with a reported risk of 0.05% for myocardial infarction, 0.07% for stroke, and 0.08–0.14% for death. These risks increase substantially if the catheterization is performed emergently, during acute myocardial infarction or in hemodynamically unstable patients. Additional risks of the procedure include tachy- or bradyarrhythmias that require countershock or pharmacologic therapy, acute renal failure leading to transient or permanent dialysis, vascular complications that necessitate surgical repair, and significant access-site bleeding. Of these risks, vascular access-site bleeding is the most common complication, occurring in 1.5–2.0% of patients, with major bleeding events associated with a worse short- and long-term outcome.
In patients who understand and accept the risks associated with cardiac catheterization, there are no absolute contraindications when the procedure is performed in anticipation of a life-saving intervention. Relative contraindications do, however, exist; these include decompensated congestive heart failure; acute renal failure; severe chronic renal insufficiency, unless dialysis is planned; bacteremia; acute stroke; active gastrointestinal bleeding; severe, uncorrected electrolyte abnormalities; a history of an anaphylactic/anaphylactoid reaction to iodinated contrast agents; and a history of allergy/bronchospasm to aspirin in patients for whom progression to a percutaneous coronary intervention is likely and aspirin desensitization has not been performed.
Contrast allergy and contrast-induced acute kidney injury merit further consideration, because these adverse events may occur in otherwise healthy individuals and prophylactic measures exist to reduce risk. Allergic reactions to contrast agents occur in <5% of cases, with severe anaphylactoid (clinically indistinguishable from anaphylaxis, but not mediated by an IgE mechanism) reactions occurring in 0.1%–0.2% of patients. Mild reactions manifest as nausea, vomiting, and urticaria, while severe anaphylactoid reactions lead to hypotensive shock, pulmonary edema, and cardiorespiratory arrest. Patients with a history of significant contrast allergy should be premedicated with corticosteroids and antihistamines (H1– and H2-blockers) and studies performed with nonionic, low-osmolar contrast agents that have a lower reported rate of allergic reactions.
Contrast-induced acute kidney injury, defined as an increase in creatinine >0.5 mg/dL or 25% above baseline that occurs 48–72 hours after contrast administration, occurs in ~2–7% of patients with rates of 20–30% reported in high-risk patients, including those with diabetes mellitus, congestive heart failure, chronic kidney disease, anemia, and older age. Dialysis is required in 0.3–0.7% of patients and is associated with a fivefold increase in in-hospital mortality. For all patients, adequate intravascular volume expansion with intravenous 0.9% saline (1.0–1.5 mL/kg per hour) for 3–12 hours before and continued 6–24 hours after the procedure limits the risk of contrast-induced acute kidney injury. Pretreatment with N-acetylcysteine (Mucomyst) has not reduced the risk of contrast-induced acute kidney injury consistently and, therefore, is no longer recommended routinely. Diabetic patients treated with metformin should stop the drug 48 hours prior to the procedure to limit the associated risk of lactic acidosis. Other strategies to decrease risk include the administration of sodium bicarbonate (3 mL/kg per hour) 1 hour before and 6 hours after the procedure; use of low- or iso-osmolar contrast agents; and limiting the volume of contrast to <100 mL per procedure.
Cardiac catheterization is performed after the patient has fasted for 6 hours and has received intravenous conscious sedation to remain awake but sedated during the procedure. All patients with suspected coronary artery disease are pretreated with 325 mg aspirin. In patients in whom the procedure is likely to progress to a percutaneous coronary intervention, an additional antiplatelet agent should be started: clopidogrel (600-mg loading dose and 75 mg daily) or prasugrel (60-mg loading dose and 10 mg daily), or ticagrelor (180-mg loading and 90 mg twice daily). Prasugrel should not be selected for individuals with prior stroke or transient ischemic attack. Warfarin is held starting 2–3 days prior to the catheterization to allow the international normalized ratio (INR) to fall to <1.7 and limit access-site bleeding complications. Cardiac catheterization is a sterile procedure, so antibiotic prophylaxis is not required.
TECHNIQUE
Cardiac catheterization and coronary angiography provide a detailed hemodynamic and anatomic assessment of the heart and coronary arteries. The selection of procedures is dependent on the patient’s symptoms and clinical condition, with some direction provided by noninvasive studies.
Vascular Access Cardiac catheterization procedures are performed using a percutaneous technique to enter the femoral artery and vein as the preferred access sites for left and right heart catheterization, respectively. A flexible sheath is inserted into the vessel over a guidewire, allowing diagnostic catheters to be introduced into the vessel and advanced toward the heart using fluoroscopic guidance. The radial artery (or brachial artery) may also be used as an arterial access site in patients, particularly those with peripheral arterial disease that involves the abdominal aorta, iliac, or femoral vessels; severe iliac artery tortuosity; morbid obesity; or preference for early postprocedure ambulation. Use of radial-artery access is gaining popularity due to a lower rate of access-site bleeding complications. A normal Allen’s test confirming dual blood supply to the hand from the radial and ulnar arteries is recommended prior to access at this site. The internal jugular or antecubital veins serve as alternate access sites to the right heart when the patient has an inferior vena cava filter in place or requires prolonged hemodynamic monitoring.
Right Heart Catheterization This procedure measures pressures in the right heart. Right heart catheterization is no longer a routine part of diagnostic cardiac catheterization, but it is reasonable in patients with unexplained dyspnea, valvular heart disease, pericardial disease, right and/or left ventricular dysfunction, congenital heart disease, and suspected intracardiac shunts. Right heart catheterization uses a balloon-tipped flotation catheter that is advanced sequentially to the right atrium, right ventricle, pulmonary artery, and pulmonary wedge position (as a surrogate for left atrial pressure) using fluoroscopic guidance; in each cardiac chamber, pressure is measured and blood samples are obtained for oxygen saturation analysis to screen for intracardiac shunts.
Left Heart Catheterization This procedure measures pressures in the left heart as a determinant of left ventricular performance. With the aid of fluoroscopy, a catheter is guided to the ascending aorta and across the aortic valve into the left ventricle to provide a direct measure of left ventricular pressure. In patients with a tilting-disc prosthetic aortic valve, crossing the valve with a catheter is contraindicated, and the left heart may be accessed via a transseptal technique from the right atrium using a needle-tipped catheter to puncture the atrial septum at the fossa ovalis. Once the catheter crosses from the right to the left atrium, it can be advanced across the mitral valve to the left ventricle. This technique is also used for mitral valvuloplasty. Heparin is given for prolonged procedures to limit the risk of stroke from embolism of clots that may form on the catheter. For patients with heparin-induced thrombocytopenia, the direct thrombin inhibitors bivalirudin (0.75 mg/kg bolus, 1.75 mg/kg per hour for the duration of the procedure) or argatroban (350 μg/kg bolus, 15 μg/kg per minute for the duration of the procedure) may be used.
HEMODYNAMICS
A comprehensive hemodynamic assessment involves obtaining pressure measurements in the right and left heart and peripheral arterial system and determining the cardiac output (Table 272-2). The shape and magnitude of the pressure waveforms provide important diagnostic information; an example of normal pressure tracings is shown in Fig. 272-1. In the absence of valvular heart disease, the atria and ventricles are “one chamber” during diastole when the tricuspid and mitral valves are open while in systole, when the pulmonary and aortic valves are open, the ventricles and their respective outflow tracts are considered “one chamber.” These concepts form the basis by which hemodynamic measurements are used to assess valvular stenosis. When aortic stenosis is present, there is a systolic pressure gradient between the left ventricle and the aorta; when mitral stenosis is present, there is a diastolic pressure gradient between the pulmonary capillary wedge (left atrial) pressure and the left ventricle (Fig. 272-2). Hemodynamic measurements also discriminate between aortic stenosis and hypertrophic obstructive cardiomyopathy where the asymmetrically hypertrophied septum creates a dynamic intraventricular pressure gradient during ventricular systole. The magnitude of this obstruction is measured using an end-hole catheter positioned at the left ventricular apex that is pulled back while recording pressure; once the catheter has passed the septal obstruction and is positioned in the apex of the left ventricle, a gradient can be measured between the left ventricular apex and the aorta. Hypertrophic obstructive cardiomyopathy is confirmed by the Brockenbrough-Braunwald sign: following a premature ventricular contraction, there is an increase in the left ventricular–aorta pressure gradient with a simultaneous decrease in the aortic pulse pressure. These findings are absent in aortic stenosis.
|
NORMAL VALUES FOR HEMODYNAMIC MEASUREMENTS |
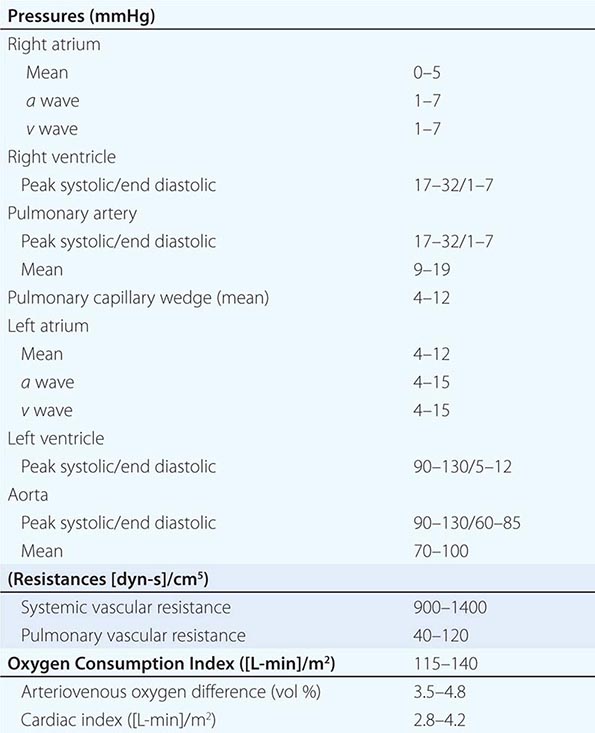
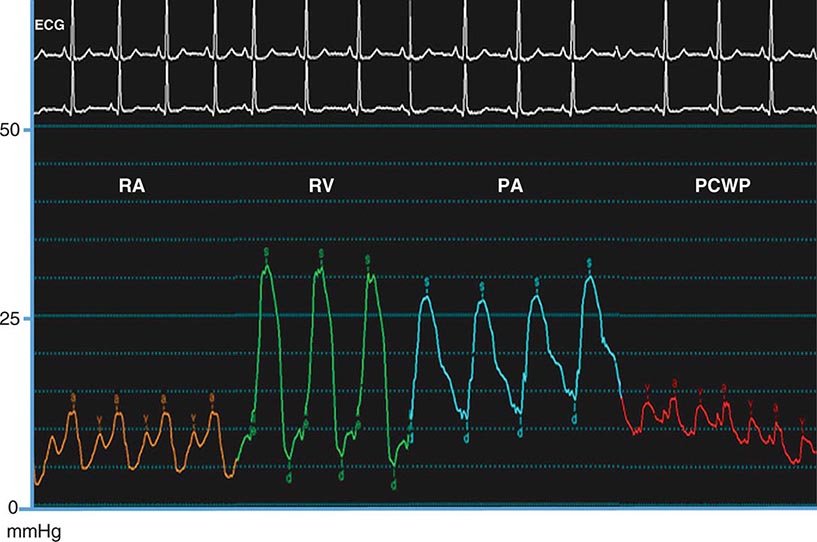
FIGURE 272-1 Normal hemodynamic waveforms recorded during right heart catheterization. Atrial pressure tracings have a characteristic “a” wave that reflects atrial contraction and a “v” wave that reflects pressure changes in the atrium during ventricular systole. Ventricular pressure tracings have a low-pressure diastolic filling period and a sharp rise in pressure that occurs during ventricular systole. d, diastole; PA, pulmonary artery; PCWP, pulmonary capillary wedge pressure; RA, right atrium; RV, right ventricle; s, systole.
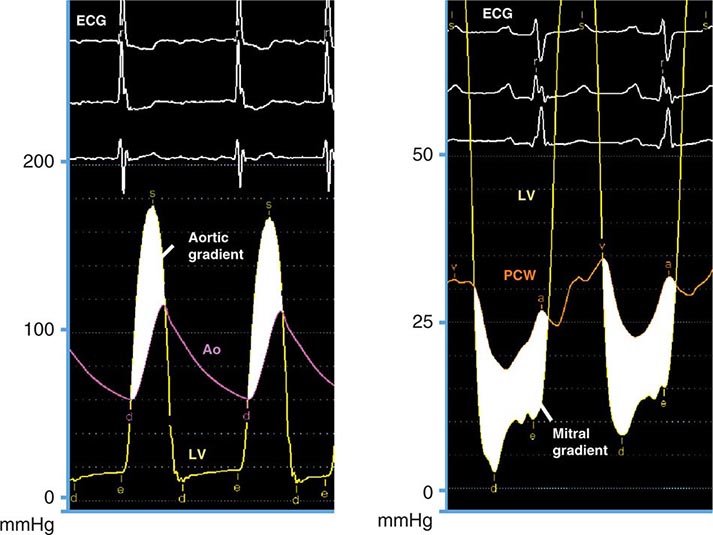
FIGURE 272-2 Severe aortic and mitral stenosis. Simultaneous recording of left ventricular (LV) and aortic (Ao) pressure tracings demonstrates a 62-mmHg mean systolic gradient (shaded area) that corresponds to an aortic valve area of 0.6 cm2 (left). Simultaneous recording of LV and pulmonary capillary wedge (PCW) pressure tracings reveals a 14-mmHg mean diastolic gradient (shaded area) that is consistent with critical mitral stenosis (mitral valve area = 0.5 cm2). d, diastole; e, end diastole; s, systole.
Regurgitant valvular lesions increase volume (and pressure) in the “receiving” cardiac chamber. In severe mitral and tricuspid regurgitation, the increase in blood flow to the atria takes place during ventricular systole, leading to an increase in the v wave (two times greater than the mean pressure). Severe aortic regurgitation leads to a decrease in aortic diastolic pressure with a concomitant rise in left ventricular end-diastolic pressure, resulting in equalization of pressures between the two chambers at end-diastole.
Hemodynamic measurements are also used to differentiate between cardiac tamponade, constrictive pericarditis, and restrictive cardiomyopathy (Table 272-3). In cardiac tamponade, right atrial pressure is increased with a decreased or absent “y” descent, indicative of impaired right atrial emptying in diastole, and there is diastolic equalization of pressures in all cardiac chambers. In constrictive pericarditis, right atrial pressure is elevated with a prominent “y” descent, indicating rapid filling of the right ventricle during early diastole. A diastolic dip and plateau or “square root sign,” in the ventricular waveforms due to an abrupt halt in ventricular filling during diastole; right ventricular and pulmonary artery pressures are elevated; and discordant pressure changes in the right and left ventricles with inspiration (right ventricular systolic pressure increases while left ventricular systolic pressure decreases) are observed. The latter hemodynamic phenomenon is the most specific for constriction. Restrictive cardiomyopathy may be distinguished from constrictive pericarditis by a marked increase in right ventricular and pulmonary artery systolic pressures (usually >60 mmHg), a separation of the left and right ventricular diastolic pressures by >5 mmHg (at baseline or with acute volume loading), and concordant changes in left and right ventricular diastolic filling pressures with inspiration (both increase).
|
HEMODYNAMIC FINDINGS IN TAMPONADE, CONSTRICTIVE PERICARDITIS, AND RESTRICTIVE CARDIOMYOPATHY |
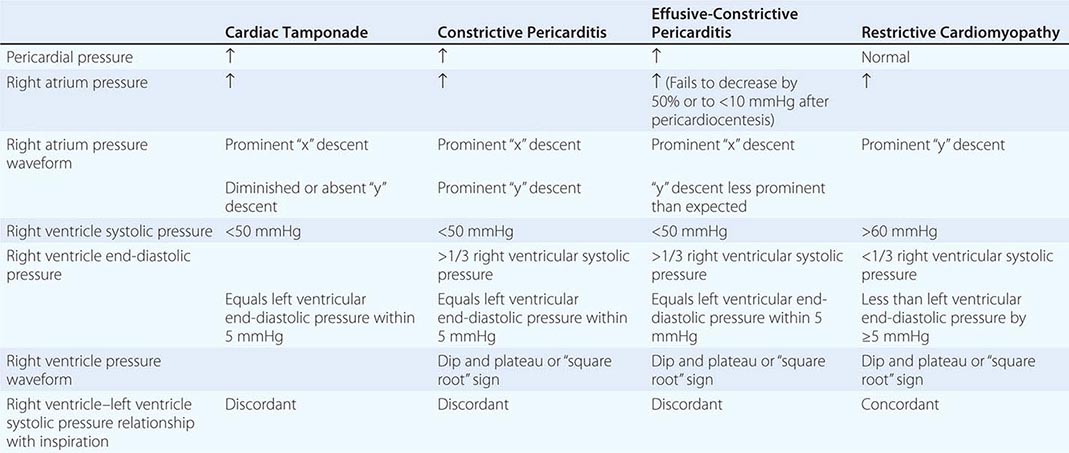
Cardiac Output Cardiac output is measured by the Fick method or the thermodilution technique. Typically, the Fick method and thermodilution technique are both performed during cardiac catheterization, although the Fick method is considered more reliable in the presence of tricuspid regurgitation and in low-output states. The Fick method uses oxygen as the indicator substance and is based on the principle that the amount of a substance taken up or released by an organ (oxygen consumption) is equal to the product of its blood flow (cardiac output) and the difference in the concentration of the substance in the arterial and venous circulation (arterial-venous oxygen difference). Thus, the formula for calculating the Fick cardiac output is:
Cardiac output (L/min) = (oxygen consumption [mL/min])/(arterial-venous oxygen difference [mL/L])
Oxygen consumption is estimated as 125 mL oxygen/minute × body surface area, and the arterial-venous oxygen difference is determined by first calculating the oxygen carrying capacity of blood (hemoglobin [g/100 mL] × 1.36 [mL oxygen/g hemoglobin] × 10) and multiplying this product by the fractional oxygen saturation. The thermodilution method measures a substance that is injected into and adequately mixes with blood. In contemporary practice, thermodilution cardiac outputs are measured using temperature as the indicator. Measurements are made with a thermistor-tipped catheter that detects temperature deviations in the pulmonary artery after the injection of 10 mL of room-temperature normal saline into the right atrium.
Vascular Resistance Resistance across the systemic and pulmonary circulations is calculated by extrapolating from Ohm’s law of electrical resistance and is equal to the mean pressure gradient divided by the mean flow (cardiac output). Therefore, systemic vascular resistance is ([mean aortic pressure – mean right atrial pressure]/cardiac output) multiplied by 80 to convert the resistance from Wood units to dyn-s-cm–5. Similarly, the pulmonary vascular resistance is ([mean pulmonary artery – mean pulmonary capillary wedge pressure]/cardiac output) × 80. Pulmonary vascular resistance is lowered by oxygen, nitroprusside, calcium channel blockers, prostacyclin infusions, and inhaled nitric oxide; these therapies may be administered during catheterization to determine if increased pulmonary vascular resistance is fixed or reversible.
Valve Area Hemodynamic data may also be used to calculate the valve area using the Gorlin formula that equates the area to the flow across the valve divided by the pressure gradient between the cardiac chambers surrounding the valve. The formula for the assessment of valve area is: Area = (cardiac output [cm3/min]/[systolic ejection period or diastolic filling period][heart rate])/44.3 C × square root of the pressure gradient, where C = 1 for aortic valve and 0.85 for the mitral valve. A valve area of <1.0 cm2 and a mean gradient of greater than 40 mmHg indicate severe aortic stenosis, while a valve area of <1.5 cm2 and a mean gradient >5–10 mmHg is consistent with moderate-to-severe mitral stenosis; in symptomatic patients with a mitral valve area >1.5 cm2, a mean gradient >15 mmHg, pulmonary artery pressure >60 mmHg, or a pulmonary artery wedge pressure >25 mmHg after exercise is also considered significant and may warrant intervention. The modified Hakki formula has also been used to estimate aortic valve area. This formula calculates the valve area as the cardiac output (L/min) divided by the square root of the pressure gradient. Aortic valve area calculations based on the Gorlin formula are flow-dependent and, therefore, for patients with low cardiac outputs, it is imperative to determine if a decreased valve area actually reflects a fixed stenosis or is overestimated by a low cardiac output and stroke volume that is insufficient to open the valve leaflets fully. In these instances, cautious hemodynamic manipulation using dobutamine to increase the cardiac output and recalculation of the aortic valve area may be necessary.
Intracardiac Shunts In patients with congenital heart disease, detection, localization, and quantification of the intracardiac shunt should be evaluated. A shunt should be suspected when there is unexplained arterial desaturation or increased oxygen saturation of venous blood. A “step up” or increase in oxygen content indicates the presence of a left-to-right shunt while a “step down” indicates a right-to-left shunt. The shunt is localized by detecting a difference in oxygen saturation levels of 5–7% between adjacent cardiac chambers. The severity of the shunt is determined by the ratio of pulmonary blood flow (Qp) to the systemic blood flow (Qs), or Qp/Qs = ([systemic arterial oxygen content – mixed venous oxygen content]/pulmonary vein oxygen content – pulmonary artery oxygen content). For an atrial septal defect, a shunt ratio of 1.5 is considered significant and factored with other clinical variables to determine the need for intervention. When a congenital ventricular septal defect is present, a shunt ratio of ≥2.0 with evidence of left ventricular volume overload is a strong indication for surgical correction.
VENTRICULOGRAPHY AND AORTOGRAPHY
Ventriculography to assess left ventricular function may be performed during cardiac catheterization. A pigtail catheter is advanced retrograde across the aortic valve into the left ventricle and 30–45 mL of contrast is power-injected to visualize the left ventricular chamber during the cardiac cycle. The ventriculogram is usually performed in the right anterior oblique projection to examine wall motion and mitral valve function. Normal wall motion is observed as symmetric contraction of all segments; hypokinetic segments have decreased contraction, akinetic segments do not contract, and dyskinetic segments appear to bulge paradoxically during systole (Fig. 272-3). Ventriculography may also reveal a left ventricular aneurysm, pseudoaneurysm, or diverticulum and can be used to assess mitral valve prolapse and the severity of mitral regurgitation. The degree of mitral regurgitation is estimated by comparing the density of contrast opacification of the left atrium with that of the left ventricle. Minimal contrast reflux into the left atrium is considered 1+ mitral regurgitation, while contrast density in the left atrium that is greater than that in the left ventricle with reflux of contrast into the pulmonary veins within three beats defines 4+ mitral regurgitation. Ventriculography performed in the left anterior oblique projection can be used to identify a ventricular septal defect. Calculation of the ventricular volumes in systole and diastole allows calculation of stroke volume and cardiac output.
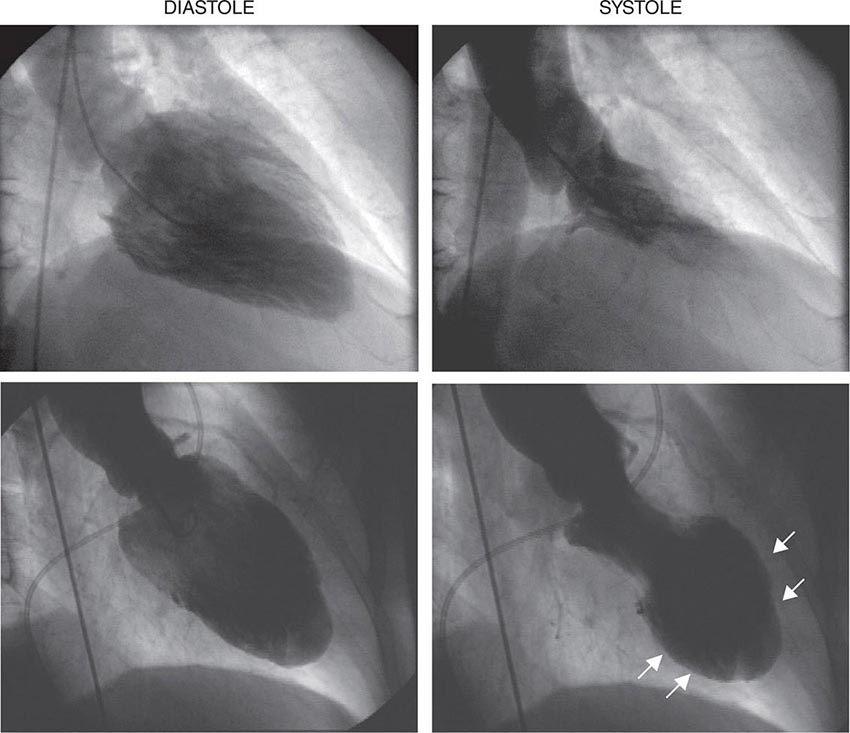
FIGURE 272-3 Left ventriculogram at end diastole (left) and end systole (right). In patients with normal left ventricular function, the ventriculogram reveals symmetric contraction of all walls (top). Patients with coronary artery disease may have wall motion abnormalities on ventriculography as seen in this 60-year-old male following a large anterior myocardial infarction. In systole, the anterior, apical, and inferior walls are akinetic (white arrows) (bottom).
Aortography in the cardiac catheterization laboratory visualizes abnormalities of the ascending aorta, including aneurysmal dilation and involvement of the great vessels, as well as dissection with compression of the true lumen by an intimal flap that separates the true and false lumina. Aortography can also be used to identify patent saphenous vein grafts that elude selective cannulation, identify shunts that involve the aorta such as a patent ductus arteriosus, and provide a qualitative assessment of aortic regurgitation using a 1+–4+ scale similar to that used for mitral regurgitation.
CORONARY ANGIOGRAPHY
Selective coronary angiography is almost always performed during cardiac catheterization and is used to define the coronary anatomy and determine the extent of epicardial coronary artery and coronary artery bypass graft disease. Specially shaped coronary catheters are used to engage the left and right coronary ostia. Hand injection of radiopaque contrast agents creates a coronary “luminogram” that is recorded as radiographic images (cine angiography). Because the coronary arteries are three-dimensional objects that are in motion with the cardiac cycle, angiograms of the vessels using several different orthogonal projections are taken to best visualize the vessels without overlap or foreshortening.
The normal coronary anatomy is highly variable between individuals, but, in general, there are two coronary ostia and three major coronary vessels—the left anterior descending, the left circumflex, and the right coronary arteries with the left anterior descending and left circumflex arteries arising from the left main coronary artery (Fig. 272-4). When the right coronary artery is the origin of the atrioventricular nodal branch, the posterior descending artery, and the posterior lateral vessels, the circulation is defined as right dominant; this is found in ~85% of individuals. When these branches arise from the left circumflex artery as occurs in ~5% of individuals, the circulation is defined as left dominant. The remaining ~10% of patients have a codominant circulation with vessels arising from both the right and left coronary circulation. In some patients, a ramus intermedius branch arises directly from the left main coronary artery; this finding is a normal variant. Coronary artery anomalies occur in 1–2% of patients, with separate ostia for the left anterior descending and left circumflex arteries being the most common (0.41%).
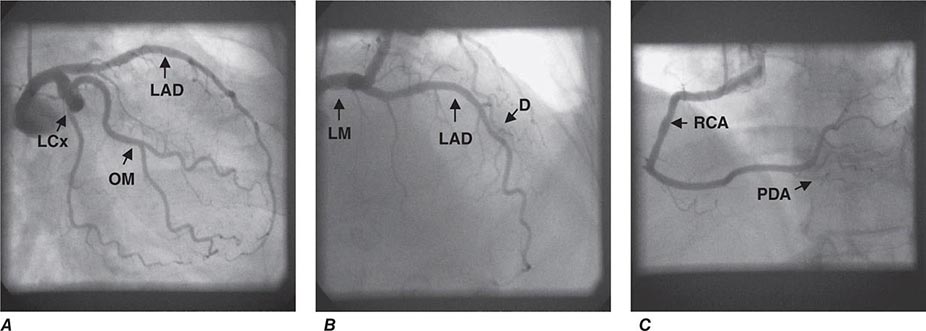
FIGURE 272-4 Normal coronary artery anatomy. A. Coronary angiogram showing the left circumflex (LCx) artery and its obtuse marginal (OM) branches. The left anterior descending artery (LAD) is also seen but may be foreshortened in this view. B. The LAD and its diagonal (D) branches are best seen in cranial views. In this angiogram, the left main (LM) coronary artery is also seen. C. The right coronary artery (RCA) gives off the posterior descending artery (PDA), so this is a right dominant circulation.
Coronary angiography visualizes coronary artery stenoses as luminal narrowings on the cine angiogram. The degree of narrowing is referred to as the percent stenosis and is determined visually by comparing the most severely diseased segment with a proximal or distal “normal segment”; a stenosis >50% is considered significant (Fig. 272-5). Online quantitative coronary angiography can provide a more accurate assessment of the percent stenosis and lessen the tendency to overestimate lesion severity visually. The presence of a myocardial bridge, which most commonly involves the left anterior descending artery, may be mistaken for a significant stenosis; this occurs when a portion of the vessel dips below the epicardial surface into the myocardium and is subject to compressive forces during ventricular systole. The key to differentiating a myocardial bridge from a fixed stenosis is that the “stenosed” part of the vessel returns to normal during diastole. Coronary calcification is also seen during angiography prior to the injection of contrast agents. Collateral blood vessels may be seen traversing from one vessel to the distal vasculature of a severely stenosed or totally occluded vessel. Thrombolysis in myocardial infarction (TIMI) flow grade, a measure of the relative duration of time that it takes for contrast to opacify the coronary artery fully, may provide an additional clue to the degree of lesion severity, and the presence of TIMI grade 1 (minimal filling) or 2 (delayed filling) suggests that a significant coronary artery stenosis is present.
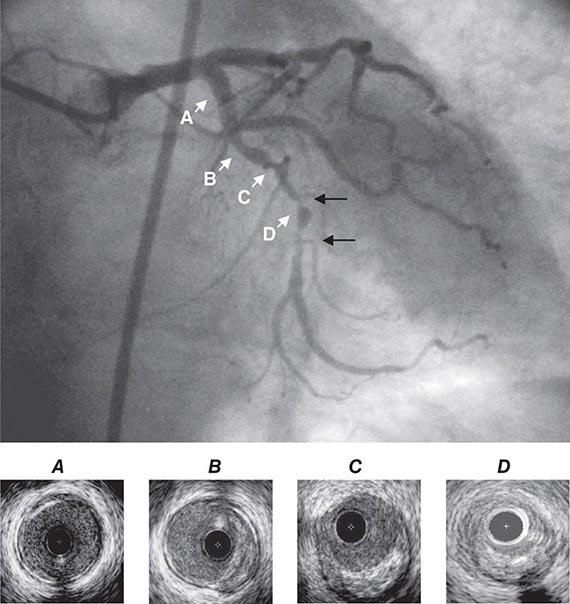
FIGURE 272-5 Coronary stenoses on cine angiogram and intravascular ultrasound. Significant stenoses in the coronary artery are seen as narrowings (black arrows) of the vessel. Intravascular ultrasound shows a normal segment of artery (A), areas with eccentric plaque (B, C), and near total obliteration of the lumen at the site of the significant stenosis (D). Note that the intravascular ultrasound catheter is present in the images as a black circle.
INTRAVASCULAR ULTRASOUND, OPTICAL COHERENCE TOMOGRAPHY, AND FRACTIONAL FLOW RESERVE
During coronary angiography, intermediate stenoses (40–70%), indeterminate findings, or anatomic findings that are incongruous with the patient’s symptoms may require further interrogation. In these cases, intravascular ultrasound provides a more accurate anatomic assessment of the coronary artery and the degree of coronary atherosclerosis (Fig. 272-5). Intravascular ultrasound (IVUS) is performed using a small flexible catheter with a 40-mHz transducer at its tip that is advanced into the coronary artery over a guidewire. Data from intravascular ultrasound studies may be used to image atherosclerotic plaque precisely, determine luminal cross-sectional area, and measure vessel size; it is also used during or following percutaneous coronary intervention to assess the stenosis and determine the adequacy of stent placement. Optical coherence tomography (OCT) is a catheter-based imaging technique that uses near-infrared light to generate images with better spatial resolution than IVUS; however, the depth of field is smaller. The advantage of OCT imaging over IVUS lies in its ability to image characteristics of the atherosclerotic plaque (lipid, fibrous cap) with high definition and to assess coronary stent placement, apposition, and patency (Fig. 272-6).
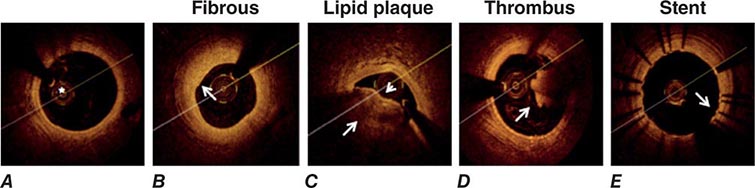
FIGURE 272-6 Optical coherence tomography imaging. A. The optical coherence tomography (OCT) catheter (*) in the lumen of a coronary artery with limited neointima formation. The intima is seen with high definition, but unlike intravascular ultrasound imaging, the vessel media and adventitia are not well visualized. B. A fibrous plaque (arrow) is characterized by a bright signal. C. A large, eccentric, lipid-rich plaque obscures part of the vessel lumen. Because lipid in the plaque absorbs light, the lipid-rich plaque appears as a dark area with irregular borders (arrow). The plaque is covered by a thin fibrous cap (arrowhead) typical of a vulnerable plaque. D. A thrombus (arrow) adherent to a ruptured plaque that is protruding into the vessel lumen. E. A coronary stent is that is well opposed to the vessel wall. The stent struts appear as short bright lines with dropout behind the struts (arrow).
Measurement of the fractional flow reserve provides a functional assessment of the stenosis and is more accurate in predicting long-term clinical outcome than imaging techniques. The fractional flow reserve is the ratio of the pressure in the coronary artery distal to the stenosis divided by the pressure in the artery proximal to the stenosis at maximal vasodilation. Fractional flow reserve is measured using a coronary pressure–sensor guidewire at rest and at maximal hyperemia following the injection of adenosine. A fractional flow reserve of <0.80 indicates a hemodynamically significant stenosis that would benefit from intervention.
POSTPROCEDURE CARE
Once the procedure is completed, vascular access sheaths are removed. If the femoral approach is used, direct manual compression or vascular closure devices that immediately close the arteriotomy site with a staple/clip, collagen plug, or sutures are used to achieve hemostasis. These devices decrease the length of supine bed rest (from 6 hours to 2–4 hours) and improve patient satisfaction but have not been shown definitively to be superior to manual compression with respect to access-site complications. With radial-artery access, bed rest is needed for only 2 hours. When cardiac catheterization is performed as an elective outpatient procedure, the patient completes postprocedure bed rest in a monitored setting and is discharged home with instructions to liberalize fluids because contrast agents promote an osmotic diuresis, to avoid strenuous activity, and to observe the vascular access site for signs of complications. Overnight hospitalization may be required for high-risk patients with significant comorbidities, patients with complications occurring during the catheterization, or patients who have undergone a percutaneous coronary intervention. Hypotension early after the procedure may be due to inadequate fluid replacement or retroperitoneal bleeding from the access site. Patients who received >2 Gy of radiation during the procedure should be examined for signs of erythema. For patients who received higher doses (>5 Gy), clinical follow-up within 1 month to assess for skin injury is recommended.
SECTION 3 |
DISORDERS OF RHYTHM |
273e |
Principles of Electrophysiology |
HISTORY AND INTRODUCTION
The field of cardiac electrophysiology was ushered in with the development of the electrocardiogram (ECG) by Einthoven at the turn of the twentieth century. Subsequent recording of cellular membrane currents demonstrated that the body surface ECG is the timed sum of the cellular action potentials in the atria and ventricles. In the late 1960s, the development of intracavitary recording, in particular, His bundle electrograms, marked the beginning of contemporary clinical electrophysiology. Adoption of radiofrequency technology to ablate cardiac tissue in the early 1990s heralded the birth of interventional cardiac electrophysiology.
The clinical problem of sudden death caused by ventricular arrhythmias, most commonly in the setting of coronary artery obstruction, was recognized as early as the late nineteenth century. The problem was vexing and led to the development of pharmacologic and nonpharmacologic therapies, including transthoracic defibrillators, cardiac massage, and, most recently, implantable defibrillators. Over time the limitations of antiarrhythmic drug therapy have been highlighted repeatedly in clinical trials, and now ablation and devices are first-line therapy for a number of cardiac arrhythmias.
In the last two decades, the genetic basis of a number of heritable arrhythmias has been elucidated, revealing important insights into the mechanisms not only of these rare arrhythmias but also of similar rhythm disturbances observed in more common forms of heart disease.
DESCRIPTIVE PHYSIOLOGY
The normal cardiac impulse is generated by pacemaker cells in the sinoatrial node situated at the junction of the right atrium and the superior vena cava (see Fig. 268-1). This impulse is transmitted slowly through nodal tissue to the anatomically complex atria, where it is conducted more rapidly to the atrioventricular node (AVN), inscribing the P wave of the ECG (see Fig. 268-2). There is a perceptible delay in conduction through the anatomically and functionally heterogeneous AVN. The time needed for activation of the atria and the AVN delay is represented as the PR interval of the ECG. The AVN is the only electrical connection between the atria and the ventricles in the normal heart. The electrical impulse emerges from the AVN and is transmitted to the His-Purkinje system, specifically the common bundle of His, then the left and right bundle branches, and then to the Purkinje network, facilitating activation of ventricular muscle. In normal circumstances, the ventricles are activated rapidly in a well-defined fashion that is determined by the course of the Purkinje network, and this inscribes the QRS complex (see Fig. 268-2). Recovery of electrical excitability occurs more slowly and is governed by the time of activation and duration of regional action potentials. The relative brevity of epicardial action potentials in the ventricle results in repolarization that occurs first on the epicardial surface and then proceeds to the endocardium, which inscribes a T wave normally of the same polarity as the QRS complex. The duration of ventricular activation and recovery is determined by the action potential duration and is represented on the body surface ECG by the QT interval (see Fig. 268-2).
Cardiac myocytes exhibit a characteristically long action potential (200–400 ms) compared with neurons and skeletal muscle cells (1–5 ms). The action potential profile is sculpted by the orchestrated activity of multiple distinctive time- and voltage-dependent ionic currents (Fig. 273e-1A). The currents are carried by transmembrane proteins that passively conduct ions down their electrochemical gradients through selective pores (ion channels), actively transport ions against their electrochemical gradient (pumps, transporters), or electrogenically exchange ionic species (exchangers).
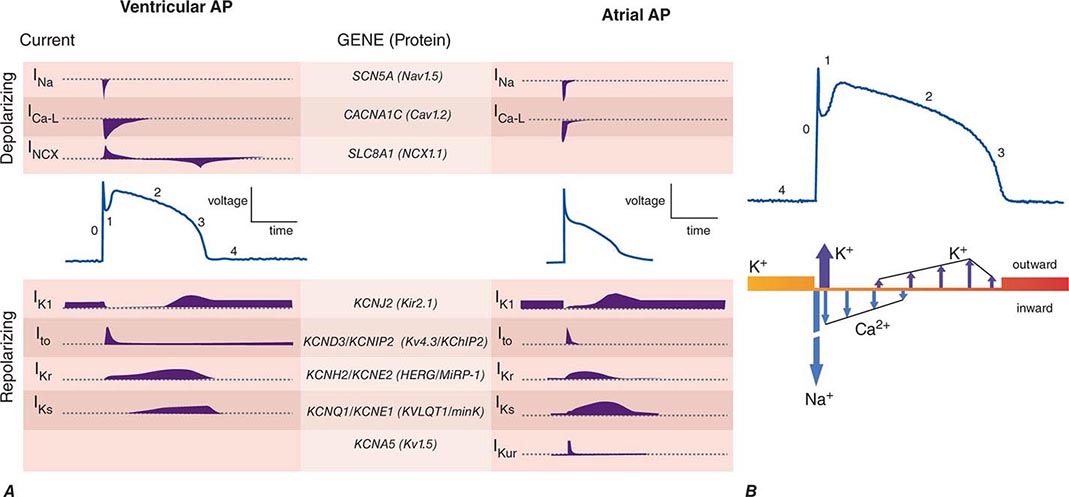
FIGURE 273e-1 A. Cellular atrial and ventricular action potentials. Phases 0–4 are the rapid upstroke, early repolarization, plateau, late repolarization, and diastole, respectively. The ionic currents and their respective genes are shown above and below the action potentials. The currents that underlie the action potentials vary in atrial and ventricular myocytes. B. A ventricular action potential with a schematic of the ionic currents flowing during the phases of the action potential. Potassium current (IK1) is the principal current during phase 4 and determines the resting membrane potential of the myocyte. Sodium current generates the upstroke of the action potential (phase 0); activation of Ito with inactivation of the Na current inscribes early repolarization (phase 1). The plateau (phase 2) is generated by a balance of repolarizing potassium currents and depolarizing calcium current. Inactivation of the calcium current with persistent activation of potassium currents (predominantly IKr and IKs) causes phase 3 repolarization.
Action potentials in the heart are regionally distinct. The regional variability in cardiac action potentials is a result of differences in the number and types of ion channel proteins expressed by different cell types in the heart. Further, unique sets of ionic currents are active in pacemaking and muscle cells, and the relative contributions of these currents may vary in the same cell type in different regions of the heart (Fig. 273e-1A).
Ion channels are complex, multisubunit transmembrane glycoproteins that open and close in response to a number of biologic stimuli, including a change in membrane voltage, ligand binding (directly to the channel or to a G protein–coupled receptor), and mechanical deformation (Fig. 273e-2). Other ion motive exchangers and transporters contribute importantly to cellular excitability in the heart. Ion pumps establish and maintain the ionic gradients across the cell membrane that serve as the driving force for current flow through ion channels. Transporters or exchangers that do not move ions in an electrically neutral manner (e.g., the sodium-calcium exchanger transports three Na+ for one Ca2+) are termed electrogenic and contribute directly to the action potential profile.
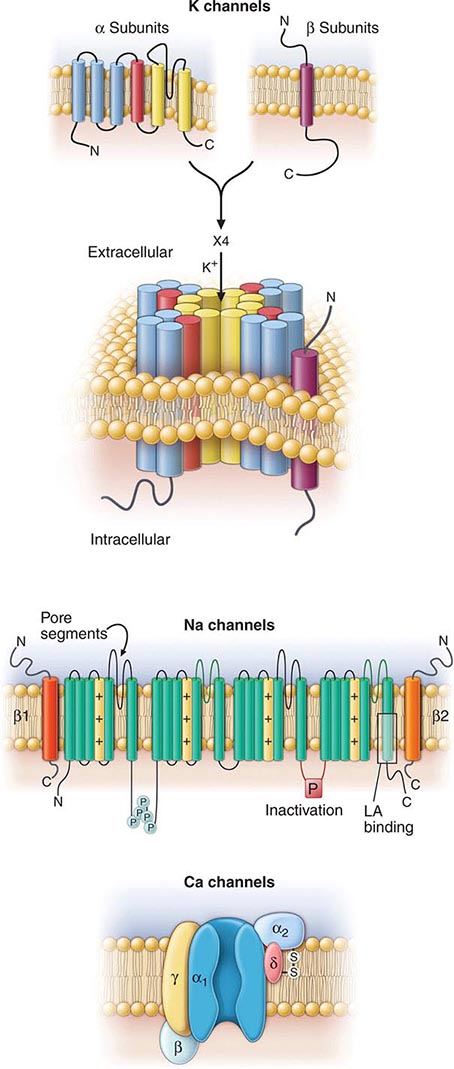
FIGURE 273e-2 Topology and subunit composition of the voltage-dependent ion channels. Potassium channels are formed by the tetramerization of α or pore-forming subunits and one or more β subunits; only single β subunits are shown for clarity. Sodium and calcium channels are composed of α subunits with four homologous domains and one or more ancillary subunits. In all channel types, the loop of protein between the fifth and sixth membrane-spanning repeat in each subunit or domain forms the ion-selective pore. In the case of the sodium channel, the channel is a target for phosphorylation, the linker between the third and fourth homologous domain is critical to inactivation, and the sixth membrane-spanning repeat in the fourth domain is important in local anesthetic antiarrhythmic drug binding. The Ca channel is a muiltisubunit protein complex with the α1 subunit containing the pore and major drug binding domain.
The most abundant superfamily of ion channels expressed in the heart is voltage gated. Several structural themes are common to all voltage-dependent ion channels. First, the architecture is modular, consisting either of four homologous subunits (e.g., K channels) or of four internally homologous domains (e.g., Na and Ca channels). Second, the proteins fold around a central pore lined by amino acids that exhibit exquisite conservation within a given channel family of like selectivity (e.g., all Na channels have very similar P segments). Third, the general strategy for activation gating (opening and closing in response to changes in membrane voltage) is highly conserved: the fourth transmembrane segment (S4), studded with positively charged residues, lies within the membrane field and moves in response to depolarization, opening the channel. Fourth, most ion channel complexes include not only the pore-forming proteins (α subunits) but also auxiliary subunits (e.g., β subunits) that modify channel function (Fig. 273e-2).
Na and Ca channels are the primary carriers of depolarizing current in both the atria and the ventricles; inactivation of these currents and activation of repolarizing K currents hyperpolarize the heart cells, reestablishing the negative resting membrane potential (Fig. 273e-1B). The plateau phase is a time when little current is flowing, and relatively minor changes in depolarizing or repolarizing currents can have profound effects on the shape and duration of the action profile. Mutations in subunits of these channel proteins produce arrhythmogenic alterations in the action potentials that cause long and short QT syndrome, Brugada syndrome, idiopathic ventricular fibrillation, familial atrial fibrillation, and some forms of conduction system disease.
MECHANISMS OF CARDIAC ARRHYTHMIAS
Cardiac arrhythmias result from abnormalities of electrical impulse generation, conduction, or both. Bradyarrhythmias typically arise from disturbances in impulse formation at the level of the sinoatrial node or from disturbances in impulse propagation at any level, including exit block from the sinus node, conduction block in the AVN, and impaired conduction in the His-Purkinje system. Tachyarrhythmias can be classified according to mechanism, including enhanced automaticity (spontaneous depolarization of atrial, junctional, or ventricular pacemakers), triggered arrhythmias (initiated by afterdepolarizations occurring during or immediately after cardiac repolarization, during phase 3 or 4 of the action potential), or reentry (circus propagation of a depolarizing wavefront). A variety of mapping and pacing maneuvers typically performed during invasive electrophysiologic testing can often determine the underlying mechanism of a tachyarrhythmia (Table 273e-1).
|
ARRHYTHMIA MECHANISMS |
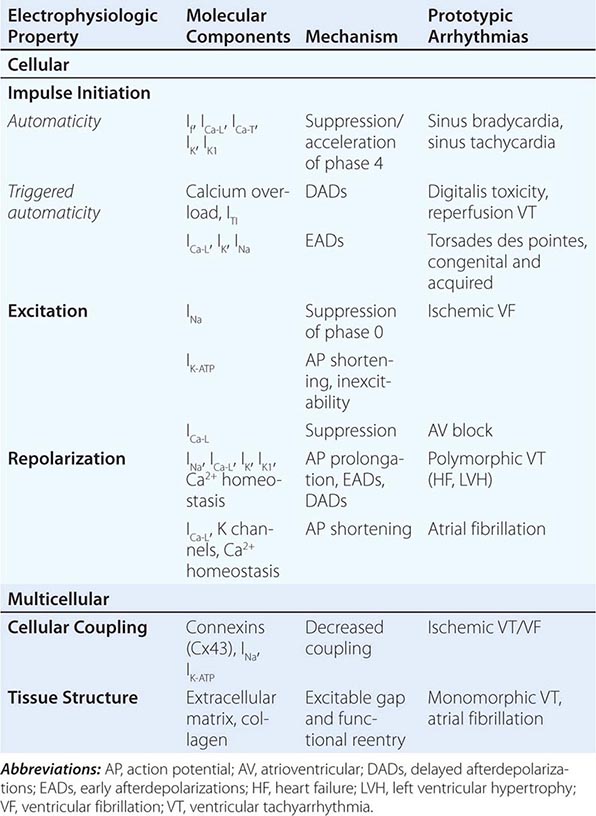
Alterations in Impulse Initiation: Automaticity Spontaneous (phase 4) diastolic depolarization underlies the property of automaticity characteristic of pacemaking cells in the sinoatrial (SA) and atrioventricular (AV) nodes, His-Purkinje system, coronary sinus, and pulmonary veins. Phase 4 depolarization results from the concerted action of a number of ionic currents, including K+ currents, Ca2+ currents, electrogenic Na, K-ATPase, the Na-Ca exchanger, and the so-called funny, or pacemaker, current (If); however, the relative importance of these currents remains controversial.
The rate of phase 4 depolarization and, therefore, the firing rates of pacemaker cells are dynamically regulated. Prominent among the factors that modulate phase 4 is autonomic nervous system tone. The negative chronotropic effect of activation of the parasympathetic nervous system is a result of the release of acetylcholine that binds to muscarinic receptors, releasing G protein βγ subunits that activate a potassium current (IKACh) in nodal and atrial cells. The resulting increase in K+ conductance opposes membrane depolarization, slowing the rate of rise of phase 4 of the action potential. Conversely, augmentation of sympathetic nervous system tone increases myocardial catecholamine concentrations, which activate both α- and β-adrenergic receptors. The effect of β1-adrenergic stimulation predominates in pacemaking cells, augmenting both L-type Ca current (ICa-L) and If, thus increasing the slope of phase 4. Enhanced sympathetic nervous system activity can dramatically increase the rate of firing of SA nodal cells, producing sinus tachycardia with rates >200 beats/min. By contrast, the increased rate of firing of Purkinje cells is more limited, rarely producing ventricular tachyarrhythmias >120 beats/min.
Normal automaticity may be affected by a number of other factors associated with heart disease. Hypokalemia and ischemia may reduce the activity of Na, K-ATPase, thereby reducing the background repolarizing current and enhancing phase 4 diastolic depolarization. The end result would be an increase in the spontaneous firing rate of pacemaking cells. Modest increases in extracellular potassium may render the maximum diastolic potential more positive, thereby also increasing the firing rate of pacemaking cells. A more significant increase in [K+]o, however, renders the heart inexcitable by depolarizing the membrane potential.
Normal or enhanced automaticity of subsidiary latent pacemakers produces escape rhythms in the setting of failure of more dominant pacemakers. Suppression of a pacemaker cell by a faster rhythm leads to an increased intracellular Na+ load ([Na+]i), and extrusion of Na+ from the cell by Na, K-ATPase produces an increased background repolarizing current that slows phase 4 diastolic depolarization. At slower rates, [Na+]i is decreased, as is the activity of the Na, K-ATPase, resulting in progressively more rapid diastolic depolarization and warm-up of the tachycardia rate. Overdrive suppression and warm-up are characteristic of, but may not be observed in, all automatic tachycardias. Abnormal conduction into tissue with enhanced automaticity (entrance block) may blunt or eliminate the phenomena of overdrive suppression and warm-up of automatic tissue.
Abnormal automaticity may produce atrial tachycardia, accelerated idioventricular rhythms, and ventricular tachycardia, particularly associated with ischemia and reperfusion. It has also been suggested that injury currents at the borders of ischemic myocardium may depolarize adjacent nonischemic tissue, predisposing to automatic ventricular tachycardia.
Afterdepolarizations and Triggered Automaticity Triggered automaticity or activity refers to impulse initiation that is dependent on afterdepolarizations (Fig. 273e-3). Afterdepolarizations are membrane voltage oscillations that occur during (early afterdepolarizations, EADs) or after (delayed afterdepolarizations, DADs) an action potential.
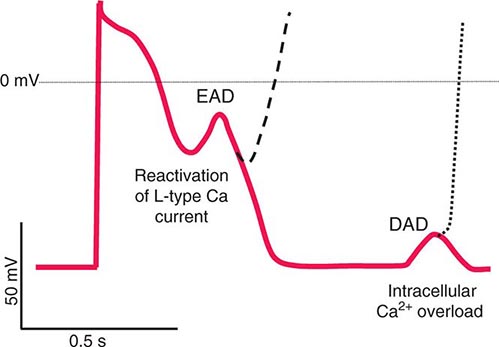
FIGURE 273e-3 Schematic action potentials with early afterdepolarizations (EADs) and delayed afterdepolarizations (DADs). Afterdepolarizations are spontaneous depolarizations in cardiac myocytes. EADs occur before the end of the action potential (phases 2 and 3), interrupting repolarization. DADs occur during phase 4 of the action potential after completion of repolarization. The cellular mechanisms of EADs and DADs differ (see text).
The cellular feature common to the induction of DADs is the presence of an increased Ca2+ load in the cytosol and sarcoplasmic reticulum. Digitalis glycoside toxicity, catecholamines, and ischemia all can enhance Ca2+ loading sufficiently to produce DADs. Accumulation of lysophospholipids in ischemic myocardium with consequent Na+ and Ca2+ overload has been suggested as a mechanism for DADs and triggered automaticity. Cells from damaged areas or cells that survive a myocardial infarction may display spontaneous release of calcium from the sarcoplasmic reticulum, and this may generate “waves” of intracellular calcium elevation and arrhythmias.
EADs occur during the action potential and interrupt the orderly repolarization of the myocyte. Traditionally, EADs have been thought to arise from action potential prolongation and reactivation of depolarizing currents, but more recent experimental evidence suggests a previously unappreciated interrelationship between intracellular calcium loading and EADs. Cytosolic calcium may increase when action potentials are prolonged. This, in turn, appears to enhance L-type Ca current, further prolonging action potential duration as well as providing the inward current driving EADs. Intracellular calcium loading by action potential prolongation may also enhance the likelihood of DADs. The interrelationship among intracellular [Ca2+], EADs, and DADs may be one explanation for the susceptibility of hearts that are calcium loaded (e.g., in ischemia or congestive heart failure) to develop arrhythmias, particularly on exposure to action potential–prolonging drugs.
EAD-triggered arrhythmias exhibit rate dependence. In general, the amplitude of an EAD is augmented at slow rates when action potentials are longer. Indeed, a fundamental condition that underlies the development of EADs is action potential and QT prolongation. Hypokalemia, hypomagnesemia, bradycardia, and, most commonly, drugs can predispose to the generation of EADs, invariably in the context of prolonging the action potential. Antiarrhythmics with class IA and III action (see below) produce action potential and QT prolongation intended to be therapeutic but frequently causing arrhythmias. Noncardiac drugs such as phenothiazines, nonsedating antihistamines, and some antibiotics can also prolong the action potential duration and predispose to EAD-mediated triggered arrhythmias. Decreased [K+]o paradoxically may decrease membrane potassium currents (particularly the delayed rectifier current, IKr) in the ventricular myocyte, explaining why hypokalemia causes action potential prolongation and EADs. In fact, potassium infusions in patients with the congenital long QT syndrome (LQTS) and in those with drug-induced acquired QT prolongation shorten the QT interval.
EAD-mediated triggered activity probably underlies initiation of the characteristic polymorphic ventricular tachycardia, torsades des pointes, seen in patients with congenital and acquired forms of LQTS. Structural heart disease, such as cardiac hypertrophy and heart failure, may also delay ventricular repolarization (so-called electrical remodeling) and predispose to arrhythmias related to abnormalities of repolarization. The abnormalities of repolarization in hypertrophy and heart failure are often magnified by concomitant drug therapy or electrolyte disturbances.
Abnormal Impulse Conduction: Reentry The most common arrhythmia mechanism is reentry resulting from abnormal electrical impulse conduction and is defined as the circulation of an activation wave around an inexcitable obstacle. The requirements for reentry are two electrophysiologically dissimilar pathways for impulse propagation around an inexcitable region (Fig. 273e-4). Reentry can occur around a fixed anatomic structure (e.g., myocardial scar), with a stable pattern of cardiac depolarization moving in series over the anterograde and retrograde limbs of the circuit. This form of reentry, referred to as anatomic reentry or excitable gap reentry (see below), is initiated when a depolarizing wavefront encounters an area of unidirectional conduction block in the retrograde limb of the circuit. Conduction across the anterograde limb occurs with a delay that, if of sufficient duration, allows for recovery of conduction in the retrograde limb with reentry of the depolarization wave into the retrograde limb of the circuit. Sustained reentry requires that the functional dimension of depolarized tissue or the tachycardia wavelength (λ = conduction velocity × refractory period) fits within the total anatomic length of the circuit, referred to as the path length. When the path length of the circuit exceeds the λ of the tachycardia, the region between the head of the activation wave and the refractory tail is referred to as the excitable gap. Anatomically determined, excitable gap reentry can explain several clinically important tachycardias, such as AV reentry, atrial flutter, bundle branch reentry ventricular tachycardia, and ventricular tachycardia in scarred myocardium.
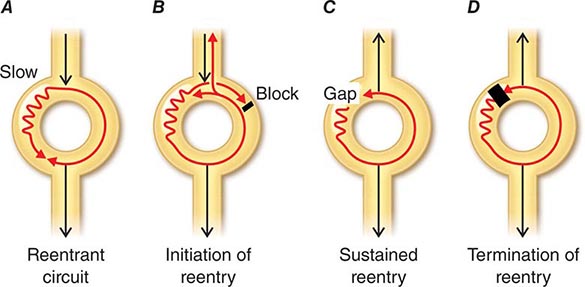
FIGURE 272-4 Schematic diagram of reentry. A. The circuit contains two limbs, one with slow conduction. B. A premature impulse blocks in the fast pathway and conducts over the slow pathway, allowing the fast pathway to recover so that the activation wave can reenter the fast pathway from the retrograde direction. C. During sustained reentry utilizing such a circuit, a gap (excitable gap) exists between the activating head of the wave and the recovering tail. D. One mechanism of termination of reentry occurs when the conduction and recovery characteristics of the circuit change and the activating head of the wave collides with the tail, extinguishing the tachycardia.
Reentrant arrhythmias may exist in the heart in the absence of an excitable gap and with a tachycardia wavelength nearly the same size as the path length. In this case, the wavefront propagates through partially refractory tissue without a fixed anatomic obstacle and no fully excitable gap; this is referred to as leading circle reentry, a form of functional reentry (reentry that depends on functional properties of the tissue). Unlike excitable gap reentry, there is no fixed anatomic circuit in leading circle reentry, and it may, therefore, not be possible to disrupt the tachycardia with pacing or destruction of a part of the circuit. Furthermore, the circuit in leading circle reentry tends to be less stable than that in excitable gap reentrant arrhythmias, with large variations in cycle length and a predilection to termination. There is strong evidence to suggest that less organized arrhythmias, such as atrial and ventricular fibrillation, are associated with more complex activation of the heart and are due to functional reentry.
Catheter-based and pharmacologic therapies for reentrant arrhythmias are designed to disrupt the anatomic circuit or alter the relationship between the wavelength and path length of the arrhythmia circuit, eliminating pathologic conduction. For example, antiarrhythmic drugs that prolong the action potential (Class III) are effective if they sufficiently prolong the λ such that it can no longer fit within the anatomic circuit. Catheter ablation is often undertaken with the goal of identifying and destroying a critical limb of the reentrant circuit (i.e., ablation of the cavotricuspid isthmus in the treatment of typical, right atrial flutter). Due to the less defined pathways of myocardial activation seen in functional reentry, ablation of these rhythms tends to target initiating triggers (e.g., pulmonary vein potentials in catheter ablation of atrial fibrillation) rather than the anatomic circuit.
Structural heart disease is associated with changes in conduction and refractoriness that increase the risk of reentrant arrhythmias. Chronically ischemic myocardium exhibits a downregulation of the gap junction channel protein (connexin 43) that carries intercellular ionic current. The border zones of infarcted and failing ventricular myocardium exhibit not only functional alterations of ionic currents but also remodeling of tissue and altered distribution of gap junctions. The changes in gap junction channel expression and distribution, in combination with macroscopic tissue alterations, support a role for slowed conduction in reentrant arrhythmias that complicate chronic coronary artery disease (CAD). Aged human atrial myocardium exhibits altered conduction, manifest as highly fractionated atrial electrograms, producing an ideal substrate for the reentry that may underlie the very common development of atrial fibrillation in the elderly.
|
TREATMENT |
CARDIAC ARRHYTHMIAS |
ANTIARRHYTHMIC DRUG THERAPY
The interaction of antiarrhythmic drugs with cardiac tissues and the resulting electrophysiologic changes are complex. An incomplete understanding of the effects of these drugs has produced serious missteps that have had adverse effects on patient outcomes and the development of newer pharmacologic agents. Currently, antiarrhythmic drugs have been relegated to an ancillary role in the treatment of most cardiac arrhythmias.
There are several explanations for the complexity of antiarrhythmic drug action: the structural similarity of target ion channels; regional differences in the levels of expression of channels and transporters, which change with disease; time and voltage dependence of drug action; and the effect of these drugs on targets other than ion channels. Because of the limitations of any scheme to classify antiarrhythmic agents, a shorthand that is useful in describing the major mechanisms of action is of some utility. Such a classification scheme was proposed in 1970 by Vaughan-Williams and later modified by Singh and Harrison. The classes of antiarrhythmic action are class I, local anesthetic effect due to blockade of Na+ current; class II, interference with the action of catecholamines at the β-adrenergic receptor; class III, delay of repolarization due to inhibition of K+ current or activation of depolarizing current; and class IV, interference with calcium conductance (Table 273e-2). Class I antiarrhythmics have been further subdivided based on the kinetics and potency of Na+ channel binding; class Ia agents (quinidine, procainamide) are those with moderate potency and intermediate kinetics; class Ib agents (lidocaine, mexiletine) are those with low potency and rapid kinetics; and class Ic drugs (flecainide, propafenone) are those with high potency and the slowest kinetics. The limitations of the Vaughan-Williams classification scheme include multiple actions of most drugs, overwhelming consideration of antagonism as a mechanism of action, and the fact that several agents have none of the four classes of action in the scheme.
|
ANTIARRHYTHMIC DRUG ACTIONS |
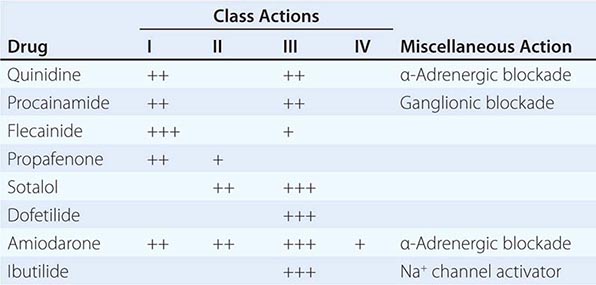
CATHETER ABLATION
The use of catheter ablation is based on the principle that there is a critical anatomic region of impulse generation or propagation that is required for the initiation and maintenance of cardiac arrhythmias. Destruction of such a critical region results in the elimination of the arrhythmia. The use of radiofrequency (RF) energy in clinical medicine is nearly a century old. The first catheter ablation using a DC energy source was performed in the early 1980s by Scheinman and colleagues. By the early 1990s, RF had been adapted for use in catheter-based ablation in the heart (Fig. 273e-5).
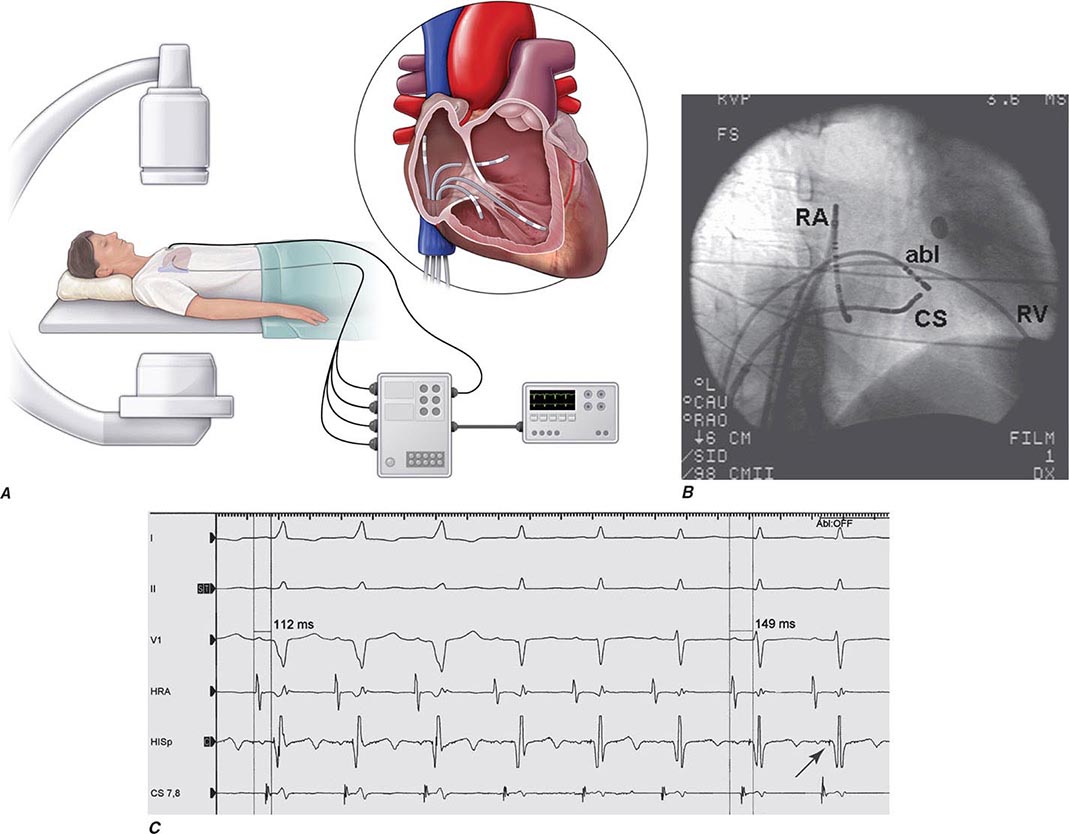
FIGURE 273e-5 Catheter ablation of cardiac arrhythmias. A. A schematic of the catheter system and generator in a patient undergoing radiofrequency catheter ablation (RFCA); the circuit involves the catheter in the heart and a dispersive patch placed on the body surface (usually the back). The inset shows a diagram of the heart with a catheter located at the AV valve ring for ablation of an accessory pathway. B. A right anterior oblique fluoroscopic image of the catheter position for ablation of a left-sided accessory pathway. A catheter is placed in the atrial side of the mitral valve ring (abl) via a transseptal puncture. Other catheters are placed in the coronary sinus (CS), in the right atrium (RA), and in the right ventricular (RV) apex to record local electrical activation. C. Body surface electrocardiogram recordings (I, II, V1) and endocardial electrograms (HRA, high right atrium; HISp, proximal His bundle electrogram; CS 7, 8, recordings from poles 7 and 8 of a decapolar catheter placed in the coronary sinus) during RFCA of a left-sided accessory pathway in a patient with Wolff-Parkinson-White syndrome. The QRS narrows at the fourth complex; the arrow shows the His bundle electrogram, which becomes apparent with elimination of ventricular preexcitation over the accessory pathway.
The RF band (300–30,000 kHz) is used to generate energy for several biomedical applications, including coagulation and cauterization of tissues. Energy of this frequency will not stimulate skeletal muscle or the heart and heats tissue by a resistive mechanism, with the intensity of heating and tissue destruction being proportional to the delivered power. Alternative, less frequently used energy sources for catheter ablation of cardiac arrhythmias include microwaves (915 MHz or 2450 MHz), lasers, ultrasound, and freezing (cryoablation). Of these alternative ablation techniques, cryoablation is being used clinically with the most frequency, especially ablation in the region of the AVN. At temperatures just below 32°C, membrane ion transport is disrupted, producing depolarization of cells, decreased action potential amplitude and duration, and slowed conduction velocity (resulting in local conduction block)—all of which are reversible if the tissue is rewarmed in a timely fashion. Tissue cooling can be used for mapping and ablation. Cryomapping can be used to confirm the location of a desired ablation target, such as an accessory pathway in WPW syndrome, or can be used to determine the safety of ablation around the AVN by monitoring AV conduction during cooling. Another advantage of cryoablation is that once the catheter tip cools below freezing, it adheres to the tissue, increasing catheter stability independent of the rhythm or pacing.
DEVICE THERAPY
Bradyarrhythmias due either to primary sinus node dysfunction or to atrioventricular conduction defects are readily treated through implantation of a permanent pacemaker. Clinical indications for pacemaker implantation often depend on the presence either of symptomatic bradycardia or of an unreliable endogenous escape rhythm and are more fully reviewed in Chaps. 274 and 275.
Ventricular tachyarrhythmias, particularly those occurring in the context of progressive structural heart diseases such as ischemic cardiomyopathy or arrhythmogenic right ventricular cardiomyopathy, may recur despite therapy with antiarrhythmic drugs or catheter ablation. In appropriate candidates, implantation of an internal cardioverter-defibrillator (ICD) may reduce mortality rates from sudden cardiac death. In a subset of patients with congestive heart failure (CHF) and ventricular mechanical dyssynchrony, ICD or pacemaker platforms can be used to provide cardiac resynchronization therapy, typically through implantation of a left ventricular pacing lead. In patients with dyssynchronous CHF, such therapy has been shown to improve both morbidity and mortality rates.