16 Defibrillation Testing, Implant Testing, and Relation to Empiric ICD Programming
Defibrillation testing also provides important information that could be used to program a device. Such testing would also verify that the sensing thresholds are adequate to detect VF reliably. A low DFT can allow the programming of a low-output initial shock that would reduce postshock ventricular dysfunction.1 Treatment with antiarrhythmic medication such as amiodarone may raise DFTs such that defibrillation testing may be indicated.2 When a patient is known to have a sustained monomorphic VT, testing of antitachycardia pacing efficacy may allow optimal programming of such parameters to terminate clinical events more expeditiously and to lessen acceleration of VT or conversion to VF.
 Strength-Duration Nature of Defibrillating Shocks
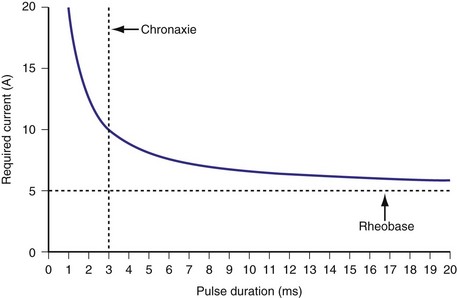
Similar to pacing impulses, defibrillation waveforms also have a strength-duration relationship3–11 (Fig. 16-1). However, important differences exist. In pacing, the strength-duration curve, marking the necessary current strength for a particular pulse duration that would elicit myocardial capture, separates the two-dimensional graph plane into two zones, one where capture consistently occurs and the other where there is no capture. These two zones are sharply demarcated by the strength-duration curve. That is, the probability of capture rises extremely steeply as one crosses the strength-duration curve from one zone to the other, so steeply that it appears to be almost an all-or-none phenomenon (Fig. 16-2).
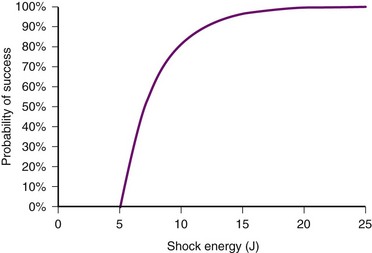
In contrast, the strength-duration relationship for defibrillation, described for monophasic waveforms or for the first phase of biphasic waveforms, is more probabilistic.12–14 For a particular pulse width, the probability of defibrillation changes over a much wider range of current strengths. Rather than a narrow line forming the strength-interval curve for pacing, this is a wide, fuzzy band where, at a particular pulse width, the probability of defibrillation at the lower end of the band is near zero and at the upper end of the band, near 100%. Alternatively, the strength-duration relation of defibrillation can be seen as a family of strength-duration curves having varying probabilities of defibrillation. For example, one curve can define the strength-duration of a waveform that would achieve a 50% successful defibrillation rate (DFT50). Another curve, located higher on the graph, would represent 90% successful defibrillation rate (DFT90).
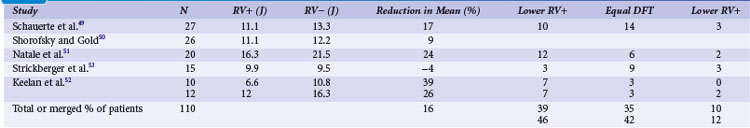
The differences between the pacing and defibrillation strength-duration curves can be attributed to several factors. Pacing occurs during diastole, where the resting membrane state is quite stable. Defibrillation, in contrast, occurs when the myocardium is in a highly inhomogeneous state of depolarization and repolarization. Multiple wavefronts may exist, the paths of which vary over time. Thus, the distribution of such depolarizing and repolarizing wavefronts is continuously changing. During pacing, the impulse needs to elicit an action potential in only a small volume of myocardium directly under the electrode, whereas the defibrillation shock needs to extinguish all or a critical number of wavefronts throughout the myocardium. It has been demonstrated that a minimum gradient of around 5 V/cm needs to be achieved throughout the myocardium to defibrillate at 80% effectiveness with a monophasic waveform, to obtain a high probability of terminating VF.15 The postulated mechanisms by which defibrillation shocks terminate VF have changed over the years. Multiple factors influence DFT, including size of the heart, location of the right ventricular (RV) electrode, polarity of the first phase, waveform durations, system impedance, heterogeneity of conduction and repolarization, number of propagating wavelets,16 virtual electrode effect, and non-RV electrode locations. Several reports have detailed these factors, primarily antiarrhythmic drugs17–21 (Table 16-1); a thorough discussion is beyond the scope of this chapter.
TABLE 16-1 Drugs and Clinical Conditions Affecting Defibrillation Threshold (DFT)
| Drugs/Condition | Effect on DFT | |
|---|---|---|
| Drugs | Atropine, azimilide, diltiazem, fentanyl, halothane, isoflurane, lidocaine, mexiletine, moricizine, phenylephrine, sildenafil (IV), verapamil | Increase |
| Sotalol, dofetilide, ibutilide, β-blockers | Decrease | |
| Amiodarone,* epinephrine, flecainide, isoproterenol | Variable | |
| Clinical/Other | High shock impedance, intracellular hypercalcemia, pneumopericardium, pneumothorax | Increase |
| Hyperkalemia, atrial natriuretic peptide (ANP) | Decrease | |
| Electrode polarity,* electrode position | Variable |
 Shock Waveform
Although early implantable defibrillators tended to have larger capacitors, experimental studies demonstrate that lower capacitance values of 60 to 90 microfarad (µF) offer more efficient defibrillation energies, thus minimizing use of battery power.22–27 Technology limits the maximum voltage that capacitors can be charged, and concerns regarding the adequacy of small capacitor pulse width in the presence of low impedance have resulted in most defibrillators now having capacitance in the 90-µF range. This capacitance allows an adequate pulse width of the first phase at typical impedances seen in human implants and still preserves enough charge for delivery during the second phase.
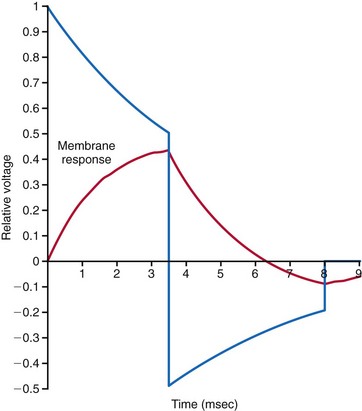
Pulse width is important because the effect of a shock delivered to the myocardium is to depolarize the cell membrane. When the myocardial cell is exposed to a sudden voltage gradient generated by the shock, the cell membrane responds by changing the transmembrane voltage. The rate of such change in transmembrane voltage is not instantaneous but exponential. Experimental studies have defined the ranges of time constants of such depolarization.28,29 These time constants indicate that charging of the cell membranes would essentially be near maximum with pulse widths of 4 to 5 msec. Thus, pulse widths beyond 5 to 7 msec probably do not add much to the defibrillation effect30,31 (Fig. 16-3). In fact, very long pulse widths (>10 msec) may have detrimental effects in defibrillation.32,33 Capacitors larger than 90 µF can easily deliver waveforms with optimal duration, but would leave a large residual charge in the capacitor at the end of a shock, wasting battery power. In addition, because the capacitors occupy the largest volume in an ICD generator, these larger capacitors would result in larger ICD generators. Much of the reduction in current generator size has resulted from the ability to reduce the capacitor size used in earlier ICDs.
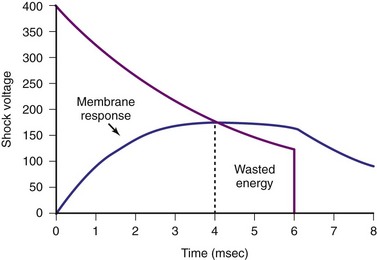
Since the early 1990s, biphasic waveforms have become standard in all implantable defibrillators. Early work on the biphasic waveform33 led to experimental34–38 and then human39,40 studies that demonstrated the superiority of the biphasic waveforms over the monophasic in achieving lower DFTs.34–40 However, the mechanism of this superiority was postulated theoretically and demonstrated experimentally much later. The “charge burping” theory was postulated in 1994 to explain this superiority.41 Essentially, this theory proposed that the residual charge on the myocardial cell membrane at the end of a monophasic shock is proarrhythmic, because it could initiate new waves to continue VF. Thus, the second phase of the biphasic waveform served to discharge the residual transmembrane polarization so as to eliminate this proarrhythmic effect (Fig. 16-4).
Clinical testing supported the predictions of the charge-burping theory.42 Experimentally, the phenomenon of the second-phase effects corroborated this theory and provided additional insight into how polarity matters. Recordings of actual transmembrane voltage changes during the shock waveform became possible once technology to record transmembrane voltages using optical techniques became available. Before this, transmembrane voltages could be measured only by direct electrical recordings. Such recordings, in the millivolt range, are completely overwhelmed by the electrical artifacts of the shock, in the hundreds of volts, three to five orders of magnitude larger. The optical techniques essentially utilize voltage-sensitive dyes impregnated into the cell membrane, whose florescence changes depending on the transmembrane voltage. This fluorescence can be measured optically; thus the electrical artifacts of the shock would not affect such measurements. Until the development of these optical techniques, the transmembrane effects of the shock waveform could not be directly observed.43 A series of experimental studies using optical techniques then provided direct observational data on the potential mechanisms of the superiority of biphasic waveforms.44 Furthermore, these studies also demonstrated how anodal shocks, especially with monophasic waveforms, could be more effective.
During delivery of the shock, the cardiac cell membrane surrounding the region of the shock electrode does not depolarize or hyperpolarize in a uniform manner. This nonuniform depolarization pattern has been labeled the virtual electrode effect and was predicted to occur based on computer modeling of cardiac tissue response to an externally applied, single-source (or point-source) voltage gradient.45 Interestingly, the nonhomogeneous pattern consists of a depolarization area near the electrode, surrounded by areas of hyperpolarization in the case of a cathodal shock, and vice versa with an anodal shock. At the end of a cathodal shock, the depolarized area in the center of the virtual electrode effect enhances propagation of a new wavefront toward surrounding tissue of hyperpolarized membranes. This increases the propensity to generate new wavefronts that would perpetuate VF. With an anodal shock, the favored propagation is from the surrounding areas toward the center of the virtual electrode effect. This direction of propagation favors the extinguishing of wavefronts as they collide toward the center, thus reducing the propensity to generate new wavefronts that would perpetuate VF. These same effects explain why cathodal pacing has a somewhat lower threshold than anodal pacing.
These observations also provide a mechanistic explanation of why monophasic shocks with an anodal polarity have a lower DFT. Observations of biphasic shocks using optical recordings of transmembrane voltages show that reentrant wavefronts generated at the end of a monophasic shock cannot propagate when the second phase reduces (cancels out) the virtual electrode effect. Thus, the basic mechanism of the “burping” hypothesis was experimentally confirmed.46 Theoretically, a biphasic waveform in which the second phase appropriately cancels out the remaining transmembrane voltages at the end of the first phase should demonstrate no difference in DFT between anodal and cathodal shocks.
Clinical studies with the monophasic waveforms consistently demonstrate that anodal shocks are more effective than cathodal shocks.47,48 With the biphasic waveform, anodal shocks have been more effective in a majority of clinical studies,49–52 although one study reported slightly improved cathodal (9.9 J) versus anodal (9.5 J) DFT53 (Table 16-2). Experimental animal studies using more optimized first-phase and second-phase waveforms, in which more thorough testing of DFT is feasible, have shown no difference in anodal versus cathodal first-phase shocks.54 The occasional patient who demonstrates a better cathodal then anodal DFT may be explained in two ways. First, clinical testing necessarily limits the number of defibrillation trials during an implantation. Thus, based on the probabilistic nature of defibrillation, an occasional patient may show a defibrillation at slightly lower shock strength with a cathodal shock than with an anodal shock, especially if the biphasic waveform is near ideal, such that the two waveforms would be comparable. Second, but less likely, when the second phase delivers an excessive amount of charge, a cathodal-type virtual electrode effect would occur at the end of the second phase if the first phase was anodal, thus making the shock less effective than the reverse polarity. Kroll et al.55 explored first-phase shock polarity and advocated for routine programming of an anodal first phase.
In practice, it is difficult to determine exactly how to optimize the first and second phases so as to achieve the best cancellation of the virtual electrode effect across the entire myocardium. Thus, programming the first phase as an anodal shock is generally the best practice. Calculations have been reported of the “optimal” first and second phases to provide the proper charging and then “burping.”56,57 In devices where the pulse width of the two phases can be programmed, optimizing these parameters can sometimes yield an acceptable DFT when the “standard” pulse widths do not provide an adequate DFT safety margin.
 Postimplant Testing
Arrhythmia Detection
Implantable defibrillators are generally tested at implantation or generator replacement for appropriate detection, pacing, and therapy effectiveness. Once the generator has been attached to the new or existing lead(s), sensing parameters of intrinsic cardiac rhythm (if present) are usually tested first. In some devices, lead testing is performed using a pacing analyzer before attachment to the ICD generator. R waves of 5 mV or greater are usually considered the minimum necessary amplitude, but in some clinical situations, lower amplitudes may be acceptable. During tachyarrhythmias, in particular VF, ventricular detection amplitudes may be substantially reduced, which is why ICD generators contain “autogain” amplifiers.58 This function automatically increases the sensitivity of the device to detect R waves of lower amplitude. In most cases, it is desirable to position the ICD lead where the greatest R-wave amplitude is observed, to minimize underdetection. ICD manufacturers provide additional programmable detection functions to improve or reduce these sensitivity settings for specific clinical situations. For example, patients with long QT syndrome may exhibit oversensing caused by T-wave detection outside the usual detection “window” where various T-wave rejection algorithms are active. This can result in inappropriate shocks caused by “double counting.” Reprogramming the parameters affecting the autogain/autothreshold functions of the ICD after a sensed R wave may help prevent this problem.
Defibrillation Testing
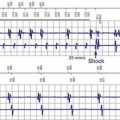
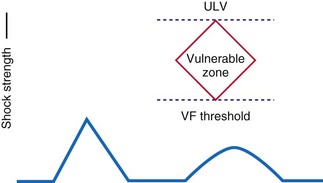
There is some controversy as to whether defibrillation testing should be part of a new implant or generator change. We favor such testing for the reasons listed here, provided the patient’s clinical condition makes this a low-risk test. Defibrillation testing usually consists of induction of VF by various means: T-wave shocks, delivery of a low-amplitude direct current (DC) through the lead, or more rarely, rapid burst pacing. The T-wave shock method is based on the presence of a vulnerable window surrounding the peak of the T wave within which a low-amplitude shock will induce VF59 (Fig. 16-5). The DC method captures the heart at rapidly accelerating rates generating polymorphic VT that quickly degenerates into VF. In most cases, a lowered ventricular sensitivity (higher sensing threshold of 1.0-1.2 mV) is used to assess adequate detection. If VF is promptly sensed with minimal “dropout” of fibrillation waves, an optimal sensitivity may be assumed. In some patients, testing at 0.45 to 0.9 mV may be necessary to achieve an acceptable sensitivity. Most patients are sent from the implant procedure at a sensitivity of 0.3 mV or less to ensure prompt clinical arrhythmia detection. VF detection criteria are usually set at this time, as discussed later. Once VF is detected, the ICD charges its capacitors to deliver the high-energy shock. Most current devices have a maximal energy output of 35 to 40 J, with additional programmable lower-energy settings.
Energy testing can be done by different methods. In some cases, a single shock may be adequate to ensure defibrillation adequacy. For example, if a single shock at 15 J is successful in terminating VF, a device having a maximum output of 35 J using the same waveform would likely have a high probability (>90%) of defibrillating on the first shock. If tested at 25 J, it is advisable to have two consecutive successful defibrillation shocks to ensure a high probability of successful defibrillation on the first shock. Ideally, the first shock would be programmed with a safety margin of 7 to 10 J from the DFT90 (90% successful defibrillation). However, such testing in a particular patient should be weighed against the potential risks in a patient with tenuous cardiac function, in a marginal state of decompensated heart failure, or with minimally adequate cardiac output. Induction of VF accompanied by a defibrillation shock is frequently followed by a short period of depressed mechanical function that usually recovers over 5 to 10 seconds. In a patient with severe heart failure, this may be longer, lasting several minutes.1,60 With multiple consecutive shocks to convert VF, this may take much longer. In a patient with marginally compensated heart failure, this period may turn into prolonged electrical-mechanical dissociation requiring cardiopulmonary resuscitation (CPR). Such myocardial mechanical depression may be related to electroporation61–63 or disruption of calcium fluxes.64 This degree of risk may be too high to warrant defibrillation testing. Interestingly, the presence of ST-segment elevation on the postshock RV electrogram, an indication of myocardial injury, may be a prognostic factor predicting the progression of heart failure in these patients.65 Programming their devices to maximal output on the first shock may well be the best approach without testing. Testing can be reconsidered once the patient’s heart failure has improved with optimal medical therapy or biventricular pacing.
An alternative defibrillation testing protocol is termed the upper limit of vulnerability (ULV) method. Multiple studies have demonstrated a close correlation between ULV and DFT, at about 90% success rates.66–74 The ULV approach, well summarized by Swerdlow et al.,75 can reduce the number of actual VF episodes during testing and any adverse hemodynamic responses to such testing. During ULV testing, a test shock of appropriate amplitude is delivered during intrinsic or paced rhythm at the T-wave peak. This point in ventricular repolarization is considered the vulnerable period, and low-energy shocks delivered during this interval often result in VF induction (i.e., T-wave shock induction). Theoretically, there is an upper energy limit above which T-wave shocks cannot induce VF. In this manner, testing of progressively lower shocks delivered during the vulnerable period is performed until VF occurs. Thus, the final test shock intensity that results in VF is considered the “upper limit” of vulnerability and the next highest energy, where VF does not occur, might be considered to be comparable to the defibrillation “threshold.” Therefore, only the final test shock results in VF (and requires a “rescue” shock).
The recent multicenter ASSURE study compared limited ULV with limited DFT testing.76 The Arrhythmia Single Shock Defibrillation Threshold Testing versus Upper Limit of Vulnerability: Risk Reduction Evaluation with ICD Implantations study randomized 426 patients to an initial 14-J defibrillation test versus a test of “vulnerability” to 14-J T-wave synchronized shock in sinus rhythm, with crossover testing after the initial randomized method. The first shock and overall success rates were comparable between both methods (P > 0.10). ASSURE did not directly compare the two methods but suggests that either may be acceptable. Posttesting hemodynamic events were assessed at only one test center, and 2 of 87 patients demonstrated a systolic blood pressure drop greater than 20 mm Hg after a defibrillation test, with spontaneous resolution, whereas no events were seen after T-wave shocks at that center.
Another approach is not to perform defibrillation testing.77–79 Gula et al.80 compared the 5-year survival of patients who underwent DFT testing to patients using a decision analysis model and found a “small and non-significant survival advantage with routine DFT testing.” An Italian survey of DFT testing performed at implantation showed that of 7857 first ICD implant procedures, no defibrillation testing was done in 30% (n = 2356) of patients .81 Of the remaining 70% of implant procedures where testing was performed, only 0.4% (n = 22) had life-threatening procedural complications, with two patients dying as a result. The ICD shock failure rate in the tested group was 2.7% (n = 148), in which a backup external defibrillator was required for conversion. The main reasons for not testing the ICD at implant were use of a cardiac resynchronization therapy (CRT) device and primary prevention. Other, less common reasons include age over 70, LVEF 30% or less, dilated cardiomyopathy, and New York Heart Association (NYHA) functional class above II. Therefore, some evidence suggests that defibrillation testing provides no survival benefit. However, no large prospective trials have been performed to answer this question.
Risks of Defibrillation Testing
Most studies of defibrillation testing safety have been comparatively small and retrospective. Russo et al.82 retrospectively looked at 1139 patients undergoing ICD implant at the University of Pennsylvania Heath system between October 1997 and November 2003 to determine the need for system modification based on the testing performed. Ninety-five percent (n = 1085) of patients underwent defibrillation testing. The remaining 54 patients did not undergo testing at implant for various clinical reasons, including presence of left atrial (LA) or left ventricular (LV) thrombus, hemodynamic instability, recent cerebrovascular accident (CVA, stroke)/transient ischemic attack (TIA) or atrial fibrillation (AF) without adequate anticoagulation, as well as severe coronary artery disease (CAD) or aortic stenosis. Of patients undergoing defibrillation testing, 71 (6.2%) required modification because of inadequate defibrillation safety margin. The majority received a higher-output device, subcutaneous leads, reversal of shock polarity, or a combination.
Controversy on whether to perform defibrillation testing focuses on the possible adverse clinical events. A recent analysis of more than 19,000 ICD procedures in Canada between January 2000 and September 2006 showed a low incidence of death (0.016%) and CVA/TIA (0.026%).83 However, the percentage of implantations with defibrillation testing was estimated to be significantly lower (80% in 2005 alone), and the results may underestimate the incidence of complications. In addition, the lack of defibrillation testing was likely not random, and the clinicians performing the procedures may have elected not to perform testing on the sickest patients, in whom risk of complications is considered high. The controversy over defibrillation testing generally refers to this group of patients, with impaired cardiovascular reserve, although no good studies have been performed to establish the actual risk associated with testing in this group. As mentioned, defibrillation testing may be delayed until the patient’s status improves, or completely avoided because of concern about the patient’s ongoing clinical status. This practice appears to have arisen from unfortunate clinical experiences in which patients with particularly severe LV dysfunction or those who are not optimally treated have demonstrated hypotension, occasionally requiring aggressive resuscitation efforts after defibrillation testing. This can sometimes occur despite prompt, successful defibrillation by the implanted device.
Another concern about defibrillation testing is neurologic damage from repeated episodes of cerebral hypoperfusion caused by VF. Reports of electroencephalographic and neurocognitive changes after ICD implant and testing prompted Silva et al.84 to perform mental status examinations on ICD patients preoperatively and 24 hours postoperatively. As a control group, patients undergoing pacemaker implant surgery underwent identical preoperative and postoperative testing. No significant decrease in mental status was seen in either group after implant surgery. Thus, this concern appears to be unfounded.
Patients with High Defibrillation Threshold
If the connections are correct, polarity reversal is a useful next step in the high-DFT patient. In some devices (out of the box) the nominal biphasic waveform polarity is programmed for the RV lead having an initial negative polarity (cathodal) in the first phase. However, a meta-analysis of biphasic shock polarity studies showed that although 41% of patients failed to show a difference in DFT between the two polarities, another 41% exhibited lower DFT when the RV was programmed to the positive polarity (anodal). Only 18% of patients exhibited a lower DFT if the RV cathodal polarity was used. Thus, Kroll et al.55 suggest that the initially tested polarity should always be the RV anodal polarity. Another simple change that can be made, in the case of a dual-coil lead, is to remove the SVC coil from the shock configuration altogether. This can be done through the device programmer in some models, but in others the SVC coil connector needs to be completely removed and capped, with the SVC connector port on the ICD plugged. This may be helpful in some patients, whereas the addition of an SVC coil to a single-coil system may be helpful in other cases.
If the previous changes do not result in defibrillation success at acceptable energies, repositioning of the RV coil is a useful next step. One study reported that repositioning RV leads initially placed more laterally, nearer the RV free wall, to a position nearer the RV septum significantly reduced the DFT.85 The addition of auxiliary leads in less common positions has also been reported. Cooper et al.86 reported a series of seven patients implanted from either the left subclavian or the right subclavian approach.86 When unacceptably high DFTs were encountered, the addition of another intravenous coil lead in the right azygos vein was successful in reducing DFT energy to acceptable levels. Another, more common approach is to implant a nontransvenous subcutaneous coil. This is usually best performed on the left side, often laterally and posteriorly, and has been shown to reduce the DFT.87 If none of these approaches is successful, it may be necessary to add an epicardial patch to the system. However, this is a much more invasive approach and increases the implant complexity and morbidity. In rare patients, a left azygos vein or a left-sided SVC may be present. These locations, because of their posterior lateral location from the heart, could be used for locating another electrode to improve the direction of current propagation through the myocardium.
Another noninvasive option available in some ICD generators is manually changing the biphasic waveform parameters. This is particularly useful in patients with high DFT values and elevated lead impedance, in whom standard, fixed “tilt” biphasic waveforms will be prolonged and may not be optimal for defibrillation. By using a “tuned” waveform of shorter duration, the DFT can be reduced to acceptable levels.88
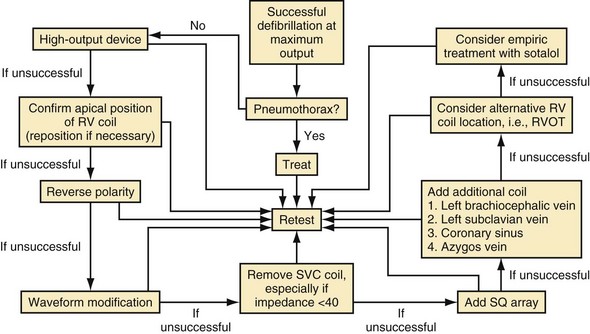
It is also important to consider metabolic or pathologic causes for the elevated energy requirements. Metabolic abnormalities such as hyperkalemia, acidosis, and hypoxia should be reversed and pathologic causes such as pneumothorax89–92 and possibly pneumomediastinum corrected before further testing. Mainigi and Callans93 have extensively reviewed these considerations and provide a useful flow diagram for management of high-DFT patients (Fig. 16-6).
 Postimplant Programming of Tachyarrhythmia Therapy
Once an acceptable endpoint to the implantation is achieved, the ICD detection zones and therapies need to be programmed before sending the patient home. In some cases, this programming is done before testing, especially when the patient has previously exhibited a sustained clinical VT. Reported data to the American College of Cardiology ICD Registry, established in 2006, indicates that approximately 83.4% of all ICD implants reported between January 2006 and June 2007 were placed for primary prevention.94 In most patients, therefore, ICD programming is not designed to treat a previously encountered arrhythmia.
Poole et al.95 analyzed response to therapy of 811 ICD patients from the Sudden Cardiac Death in Heart Failure Trial (SCD-HeFT). Patients received single-chamber Medtronic ICDs programmed to a single zone of therapy (shocks only) for rates above 188 beats per minute (bpm), equivalent to a cycle length of 320 msec, and were followed for a median of 45.5 months. Of 269 patients who received a shock, 182 received an “appropriate” shock and 87 received “inappropriate” shocks, as judged by two independent cardiologists. Appropriate shocks were defined as those received for ventricular tachycardia or fibrillation, and inappropriate shocks as those resulting from supraventricular arrhythmias, oversensing of P or T waves, double counting of R waves, or artifact from lead fractures or electromagnetic interference. Patients receiving the appropriate shocks had a worse survival rate, with a higher hazard ratio for death (5.68) than the 542 patients who received no shocks (P < .001). This group was also found to have a lower LVEF and higher NYHA class for heart failure than those who received no shocks. The patients who received inappropriate shocks also exhibited a higher hazard ratio for death (1.98) than those receiving no shocks (P < .002). No ATP therapies were programmed for these patients.
Antitachycardia pacing (ATP) has been used to treat VT episodes by the delivery of pacing impulses that are slightly faster than the detected arrhythmia. The aim is to “break” the tachycardia by forcing the myocardial circuit to conduct the faster impulses beyond its physiologic limits. Two types of ATP therapy are generally available: burst and ramp. Burst ATP consists of a sequence of paced beats delivered at a programmable rate that is faster (i.e., shorter cycle length) than the detected VT. This sequence has a stable cycle length of variable but programmable duration (generally 8 cycles). Ramp pacing also consists of a sequence of paced beats, faster than the detected VT, but with a detrimental cycle length; that is, each paced impulse in the sequence is faster (i.e., shorter cycle length) than the preceding cycle. The number of beats in each ramp is programmable, as is the rate by which each cycle shortens from the prior cycle. The most recent comparison study of ATP effectiveness showed that burst pacing of eight beats at 88% of the VT confidence limit (CL) results in a higher percentage of conversions (75.2%) than ramp pacing (52.1%) of VTs detected in the fast-VT zone of 320 to 240 msec (P < .015). The ramp consisted of eight beats with 91% decrement between successive beats.96
The advantage of ATP is painless and more rapid disruption of the arrhythmia, as well as reducing the energy drain of the ICD. Unfortunately, crafting an ATP strategy for each patient individually can be time-consuming, with concerns that this may result in acceleration of the tachycardia to a more rapid and hemodynamically unstable form. However, the PainFREE Rx II trial tested an empirically programmed ATP strategy for rapid VT up to 250 bpm, which would have triggered shock therapy with standard programmed parameters. Successful conversion of these rapid VTs occurred in 72% of patients using the empiric ATP strategy.97 The subsequent reduction in shock therapies resulted in improved quality of life indicators.
The EMPIRIC and PREPARE studies were designed to test a more standardized and safe approach to overall ICD programming. The EMPIRIC study randomized 900 unselected primary and secondary prevention patients to receive a standardized programming strategy versus physician-selected programming at Medtronic ICD implantation.98 The standardized (termed empiric) programming included three zones of therapy. A VT zone of 150 to 200 bpm was programmed to receive two trials of burst ATP therapy, one trial of ramp ATP therapy, then a 20-J shock, and then three 30-J shocks. A fast-VT zone at 200 bpm was programmed to receive one burst of ATP and then five 30-J shocks. Finally, the VF zone at 250 bpm was programmed to deliver six 30-J shocks. The empiric programming was comparable to physician-tailored therapy for time to first all-cause shock and percentage of VT/VF and non-VT/VF episodes. However, the number of patients experiencing five or more all-cause shocks was less in the empirically programmed group (P < .018).
The PREPARE study was specifically aimed at comparing somewhat less intensive empiric therapy selections to physician-tailored programming in a cohort of 700 primary prevention patients receiving a Medtronic ICD.99 The standard programming prescribed for half the group was for two zones of fast-VT and VF therapy plus a monitor zone for VT. The slower VT zone was programmed between 167 and 182 bpm, with all therapies “off” (e.g., Monitor zone). The fast-VT zone was programmed from 182 to 250 bpm with one burst of ATP and then five shocks of 30 to 35 J (maximum output). The VF zone was programmed to detect at more than 250 bpm and deliver up to six shocks at maximum energy output. The detection scheme was also prolonged to minimize device therapies triggered by self-terminating ventricular tachyarrhythmias of short durations. Fast-VT and VF therapies were triggered only for tachyarrhythmias that met rate cutoff criteria for 30 of 40 consecutive beats. This particular detection and therapy strategy significantly reduced the morbidity index (P < .003) and the number of patients who received a shock during the first year of therapy (P < .01) compared to the physician-directed programming group. These studies underline the importance of randomized controlled trials (RCTs) to help select optimal ICD programming parameters.
Patient survival outcomes of ATP versus shocks from ICDs were recently studied in a retrospective meta-analysis of four trials of ICD programming, including the EMPIRIC and PREPARE studies.100 A total of 2135 patients were included, and the investigators found that those with VT/VF episodes successfully treated with ATP, without the need for shocks, had a significantly lower 1-year mortality rate than those who received shocks in the same period. Interestingly, mortality was not significantly different between patients receiving ATP therapies and those who experienced no VT/VF episodes. The baseline clinical characteristics of the ATP and shock groups were indistinguishable. It is unclear from this study whether the shocks contributed to the increased mortality or were simply a marker of increased risk. However, ICD shocks have produced microscopic cardiac damage and biomarker evidence of myocardial cell disruption.101 Future studies of therapeutic shock and ATP therapies may help explain this phenomenon.
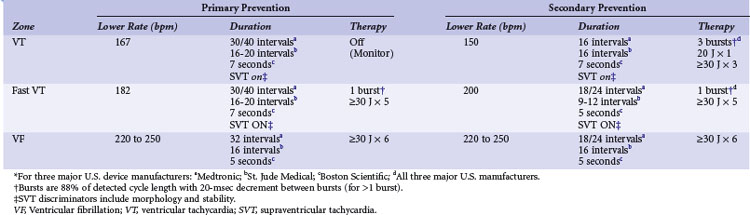
Recommendations
Given the results of the previous trials, we recommend initially programming different strategies in the primary prevention and secondary prevention groups (Table 16-3). For patients implanted for primary prevention indications, the PREPARE results provide the most useful guidelines, with two zones of therapies, specifically recommending longer detection periods to prevent unneeded ATP or shocks.99 For patients implanted for secondary prevention indications, the EMPIRIC trial provides the most useful guidelines, using two zones of VT therapy in addition to the VF zone.98 The VT and VF zones use longer detection periods than generally programmed in the past, although not as prolonged as in the PREPARE trial. In addition, supraventricular tachycardia (SVT) discriminators, as with morphology discrimination and rate stability, should be routinely used in the VT zones for both primary and secondary prevention patients, to prevent unnecessary therapies for nonventricular arrhythmias.
1 Tokano T, Bach D, Chang J, et al. Effect of ventricular shock strength on cardiac hemodynamics. J Cardiovasc Electrophysiol. 1998;9:791-797.
2 Leong-Sit P, Gula LJ, Diamantouros P, et al. Effect of defibrillation testing on management during implantable cardioverter-defibrillator implantation. Am Heart J. 2006;152:1104-1108.
3 Koning G, Schneider H, Hoelen AJ, et al. Amplitude-duration relation for direct ventricular defibrillation with rectangular current pulses. Med Biol Eng. 1975;13:388-395.
4 Gold JH, Schuder JC, Stoeckle H, et al. Transthoracic ventricular defibrillation in the 100 kg calf with unidirectional rectangular pulses. Circulation. 1977;56:745-750.
5 Bourland JD, Tacker WA, Geddes LA. Strength-duration curves for trapezoidal waveforms of various tilts for transchest defibrillation in animals. Med Instr. 1978;12:38-41.
6 Geddes LA, Bourland JD, Tacker WA. Energy and current requirements for ventricular defibrillation using trapezoidal waves. Am J Physiol. 1980;238:H231-H236.
7 Niebauer MJ, Babbs CF, Geddes LA, et al. Efficacy and safety of defibrillation with rectangular waves of 2 to 20-milliseconds duration. Crit Care Med. 1983;11:95-98.
8 Geddes LA, Niebauer MJ, Babbs CF, et al. Fundamental criteria underlying the efficacy and safety of defibrillating current waveforms. Med Biol Eng Comp. 1985;23:122-130.
9 Wessale JL, Bourland JD, Tacker WA, Geddes LA. Bipolar catheter defibrillation in dogs using trapezoidal waveforms of various tilts. J Electrocardiol. 1980;13:359-365.
10 Gold MR, Shorofsky SR. Strength-duration relationship for human transvenous defibrillation. Circulation. 1997;18(96):3517-3520.
11 Yamanouchi Y, Mowrey K, Mazgalev TN, et al. The strength-duration relationship of monophasic waveforms with varying capacitance sizes in external defibrillation. Pacing Clin Electrophysiol. 2003;26:2213-2218.
12 Davy JM, Fain ES, Dorian P, Winkle RA. The relationship between successful defibrillation and delivered energy in open-chest dogs: reappraisal of the “defibrillation threshold” concept. Am Heart J. 1987;113:77-84.
13 Malkin RA, Souza JJ, Ideker RE. The ventricular defibrillation and upper limit of vulnerability dose-response curves. J Cardiovasc Electrophysiol. 1997;8:895-903.
14 Degroot PJ, Church TR, Mehra R, et al. Derivation of a defibrillator implant criterion based on probability of successful defibrillation. Pacing Clin Electrophysiol. 1997;20:1924-1935.
15 Zhou X, Daubert JP, Wolf PD, et al. Epicardial mapping of ventricular defibrillation with monophasic and biphasic shocks in dogs. Circ Res. 1993;72:145-160.
16 Hsu W, Lin Y, Lang DJ, Jones JL. Improved internal defibrillation success with shocks timed to the morphology electrogram. Circulation. 1998;98:808-812.
17 Dillon SM, Kwaku KF. Progressive depolarization: a unified hypothesis for defibrillation and fibrillation induction by shocks. J Cardiovasc Electrophysiol. 1998;9:529-552.
18 Chen PS, Swerdlow CD, Hwang C, Karacueuzian HS. Current concepts of ventricular defibrillation. J Cardiovasc Electrophysiol. 1998;9:552-562.
19 Cheng Y, Mowrey KA, Van Wagoner DR, et al. Virtual electrode induced reexcitation: a mechanism of defibrillation. Circ Res. 1999;85:1056-1066.
20 Efimov IR, Cheng Y, Yamanouchi Y, Tchou PJ. Direct evidence of the role of virtual electrode induced phase singularity in success and failure of defibrillation. J Cardiovasc Electrophysiol. 2000;11:861-868.
21 Dopp AL, Miller JM, Tisdale JE. Effect of drugs on defibrillation capacity. Drugs. 2008;68:607-630.
22 Leonelli FM, Kroll MW, Brewer JE. Defibrillation thresholds are lower with smaller storage capacitors. Pacing Clin Electrophysiol. 1995;18:1661-1665.
23 Rist K, Tchou PJ, Mowrey K, et al. Smaller capacitors improve the biphasic waveform. J Cardiovasc Electrophysiol. 1994;5:771-776.
24 Bahu M, Knight BP, Weiss R, et al. Randomized comparison of a 90-µF capacitor three-electrode defibrillation system with a 125-µF two-electrode defibrillation system. J Interv Card Electrophysiol. 1998;2:41-45.
25 Swerdlow CD, Brewer JE, Kass RM, Kroll MW. Application of models of defibrillation to human defibrillation data: implications for optimizing implantable defibrillator capacitance. Circulation. 1997;96:2813-2822.
26 Yamanouchi Y, Brewer JE, Mowrey KA, et al. Optimal small-capacitor biphasic waveform for external defibrillation: influence of phase-1 tilt and phase-2 voltage. Circulation. 1998;98:2487-2493.
27 Yamanouchi Y, Brewer JE, Olson KF, et al. Fully discharging phases: a new approach to biphasic waveforms for external defibrillation. Circulation. 1999;100:826-831.
28 Mowrey KA, Cheng Y, Tchou PJ, Efimov R. Kinetics of defibrillation shock-induced response: design implications for the optimal defibrillation waveform. Europace. 2002;4:27-39.
29 Mowrey KA, Efimov IR, Cheng Y. Membrane time constant during internal defibrillation strength shocks in intact heart: effects of Na+ and Ca2+ channel blockers. J Cardiovasc Electrophysiol. 2009;20:85-92.
30 Kroll MW. A minimal model of the monophasic defibrillation pulse. Pacing Clin Electrophysiol. 1993;16:769-777.
31 Irnich W. Optimal truncation of defibrillation pulses. Pacing Clin Electrophysiol. 1995;18:673-688.
32 Lampert R, Soufer R, McPherson CA, et al. Implantable cardioverter-defibrillator shocks increase T-wave alternans. J Cardiovasc Electrophysiol. 2007;18:512-517.
33 Al-Khadra A, Nikolski V, Efimov IR. The role of electroporation in defibrillation. Circ Res. 2000;87:797-804.
34 Gurvich NL, Makarychev VA. Defibrillation of the heart with biphasic electric impulsation. Kardiologiia. 1967;7:109-112.
35 Dixon EG, Tang AS, Wolf PD, et al. Improved defibrillation thresholds with large contoured epicardial electrodes and biphasic waveforms. Circulation. 1987;76:1176-1184.
36 Chapman PD, Vetter JW, Souza JJ, et al. Comparative efficacy of monophasic and biphasic truncated exponential shocks for nonthoracotomy internal defibrillation in dogs. J Am Coll Cardiol. 1988;12:739-745.
37 Fain ES, Sweeney MB, Franz MR. Improved internal defibrillation efficacy with a biphasic waveform. Am Heart J. 1989;117:358-364.
38 Kavanagh KM, Tang AS, Rollins DL, et al. Comparison of the internal defibrillation thresholds for monophasic and double and single capacitor biphasic waveforms. J Am Coll Cardiol. 1989;114:1343-1349.
39 Winkle RA, Mead RH, Ruder MA, et al. Improved low-energy defibrillation efficacy in man with the use of a biphasic truncated exponential waveform. Am Heart J. 1989;117:122-127.
40 Bardy GH, Ivey TD, Allen MD, et al. A prospective randomized evaluation of biphasic versus monophasic waveform pulses on defibrillation efficacy in humans. J Am Coll Cardiol. 1989;14:728-733.
41 Kroll MW. A minimal model of the single capacitor biphasic defibrillation waveform. Pacing Clin Electrophysiol. 1994;17:1782-1792.
42 Swerdlow CD, Fan W, Brewer JE. Charge-burping theory correctly predicts optimal ratios of phase duration for biphasic defibrillation waveforms. Circulation. 1996;94:2278-2284.
43 Efimov IR, Cheng YN, Biermann M, et al. Transmembrane voltage changes produced by real and virtual electrodes during monophasic defibrillation shock delivered by an implantable electrode. J Cardiovasc Electrophysiol. 1997;8:1031-1045.
44 Efimov IR, Cheng Y, Van Wagoner DR, et al. Shock induced phase singularities: mechanism for the failure to defibrillate. Circ Res. 1998;82:918-925.
45 Roth BJ, Wikswo JPJr. Electrical stimulation of cardiac tissue: a bidomain model with active membrane properties. IEEE Trans Biomed Eng. 1994;41:232-240.
46 Efimov IR, Cheng Y, Yamanouchi Y, Tchou PJ. Direct evidence of the role of virtual electrode induced phase singularity in success and failure of defibrillation. J Cardiovasc Electrophysiol. 2000;11:861-868.
47 Strickberger SA, Hummel JD, Horwood LE, et al. Effect of shock polarity on ventricular defibrillation threshold using a transvenous lead system. J Am Coll Cardiol. 1994;24:1069-1072.
48 Thakur RK, Souza JJ, Chapman PD, et al. Electrode polarity is an important determinant of defibrillation efficacy using a nonthoracotomy system. Pacing Clin Electrophysiol. 1994;17:919-923.
49 Schauerte P, Stellbrink C, Schondube FA, et al. Polarity reversal improves defibrillation efficacy in patients undergoing transvenous cardioverter defibrillator implantation with biphasic shocks. Pacing Clin Electrophysiol. 1997;20:301-306.
50 Shorofsky SR, Gold MR. Effects of waveform and polarity on defibrillation thresholds in humans using a transvenous lead system. Am J Cardiol. 1996;78:313-316.
51 Natale A, Sra J, Dhala A, Jazayeri M, et al. Effects of initial polarity on defibrillation threshold with biphasic pulses. Pacing Clin Electrophysiol. 1995;18:1889-1893.
52 Keelan ET, Sra JS, Axtell K, et al. The effect of polarity of the initial phase of a biphasic shock waveform on the defibrillation threshold of pectorally implanted defibrillators. Pacing Clin Electrophysiol. 1997;20:337-342.
53 Strickberger SA, Man KC, Daoud E, et al. Effect of first-phase polarity of biphasic shocks on defibrillation threshold with a single transvenous lead system. J Am Coll Cardiol. 1995;25:1605-1608.
54 Yamanouchi Y, Mowrey KA, Nadzam GR, et al. Effects of polarity on defibrillation thresholds using a biphasic waveform in a hot can electrode system. Pacing Clin Electrophysiol. 1997;20:2911-2916.
55 Kroll MW, Efimov IR, Tchou PJ. Present understanding of shock polarity for internal defibrillation: the obvious and non-obvious clinical implications. PACE. 2006;29:885-891.
56 Natarajan S, Henthorn R, Burroughs J, et al. “Tuned” defibrillation waveforms outperform 50/50% tilt defibrillation waveforms: a randomized multi-center study. PACE. 2007;30:14-24.
57 Denman RA, Umesan C, Martin PT, et al. Benefit of millisecond waveform durations for patients with high defibrillation thresholds. Heart Rhythm. 2006;3:536-541.
58 Gillberg J. Detection of cardiac tachyarrhythmias in implantable devices. J Electrocardiol. 2007;40(Suppl 6):123-128.
59 Sharma AD, Fain E, O’Neill PG, et al. Shock on T versus direct current voltage for induction of ventricular fibrillation: a randomized prospective comparison. Pacing Clin Electrophysiol. 2004;27:89-94.
60 Mollerus M, Naslund L. Myocardial stunning following defibrillation threshold testing. J Interv Card Electrophysiol. 2007;19:213-216.
61 Tokano T, Bach D, Chang J, et al. Effect of ventricular shock strength on cardiac hemodynamics. J Cardiovasc Electrophysiol. 1998;9:791-797.
62 Tovar O, Tung L. Electroporation of cardiac cell membranes with monophasic or biphasic rectangular pulses. Pacing Clin Electrophysiol. 1991;14:1887-1892.
63 Nikolski VP, Efimov IR. Electroporation of the heart. Europace. 2005;7:S146-S154.
64 Jones DL, Narayanan N. Defibrillation depresses heart sarcoplasmic reticulum calcium pump: a mechanism of postshock dysfunction. Am J Physiol Heart Circ Physiol. 1998;274:98-105.
65 Tereshchenko LG, Faddis MN, Fetics BJ, et al. Transient local injury current in right ventricular electrogram after implantable cardioverter-defibrillator shock predicts heart failure progression. J Am Coll Cardiol. 2009;54:822-828.
66 Chen PS, Feld GK, Kriett JM, et al. Relation between upper limit of vulnerability and defibrillation threshold in humans. Circulation. 1993;88:186-192.
67 Behrens S, Li C, Franz MR. Timing of the upper limit of vulnerability is different for monophasic and biphasic shocks: implications for the determination of the defibrillation threshold. Pacing Clin Electrophysiol. 1997;20:2179-2187.
68 Hwang C, Swerdlow CD, Kass RM, et al. Upper limit of vulnerability reliably predicts the defibrillation threshold in humans. Circulation. 1994;90:2308-2314.
69 Swerdlow CD, Ahern T, Kass RM, et al. Upper limit of vulnerability is a good estimator of shock strength associated with 90% probability of successful defibrillation in humans with transvenous implantable cardioverter defibrillators. J Am Coll Cardiol. 1996;27:1112-1118.
70 Swerdlow CD, Davie S, Ahern T, Chen PS. Comparative reproducibility of defibrillation threshold and upper limit of vulnerability. Pacing Clin Electrophysiol. 1996;19:2103-2111.
71 Souza JJ, Malkin RA, Ideker RE. Comparison of upper limit of vulnerability and defibrillation probability of success curves using a nonthoracotomy lead system. Circulation. 1995;91:1247-1252.
72 Behrens S, Li C, Franz MR. Effects of myocardial ischemia on ventricular fibrillation inducibility and defibrillation efficacy. J Am Coll Cardiol. 1997;29:817-824.
73 Martin DJ, Chen PS, Hwang C, et al. Upper limit of vulnerability predicts chronic defibrillation threshold for transvenous implantable defibrillators. J Cardiovasc Electrophysiol. 1997;8:241-248.
74 Huang J, KenKnight BH, Walcott GP, et al. Effects of transvenous electrode polarity and waveform duration on the relationship between defibrillation threshold and upper limit of vulnerability. Circulation. 1997;96:1351-1359.
75 Swerdlow CD, Shehata M, Chen PS. Using the upper limit of vulnerability to assess defibrillation efficacy at implantation of ICDs. Pacing Clin Electrophysiol. 2007;30:258-270.
76 Day JD, Doshi RN, Belott P, et al. Inductionless or limited shock testing is possible in most patients with implantable cardioverter-defibrillators/cardiac resynchronization therapy defibrillators: results of the multicenter ASSURE Study (Arrhythmia Single Shock Defibrillation Threshold Testing versus Upper Limit of Vulnerability: Risk Reduction Evaluation with Implantable Cardioverter-Defibrillator Implantations). Circulation. 2007;115:2382-2389.
77 Blatt JA, Poole JE, Johnson GW, et al. SCD-HeFT Investigators. No benefit from defibrillation threshold testing in the SCD-HeFT (Sudden Cardiac Death in Heart Failure Trial). J Am Coll Cardiol. 2008;52:551-556.
78 Kolb C, Tzeis S, Zrenner B. Defibrillation threshold testing: tradition or necessity? PACE. 2009;32:570-572.
79 Pires LA, Johnson KM. Intraoperative testing of the implantable defibrillator: how much is enough? J Cardiovasc Electrophysiol. 2006;17:140-145.
80 Gula LJ, Massel D, Krahn AD, et al. Is defibrillation testing still necessary? A decision analysis and Markov model. J Cardiovasc Electrophysiol. 2008;19:400-405.
81 Brignole M, Raciti G, Borgiorni MG, et al. Defibrillation testing at the time of implantation of cardioverter defibrillator in clinical practice: a nation-wide survey. Europace. 2007;9:540-543.
82 Russo AM, Sauer W, Gerstenfeld EP, et al. Defibrillation threshold testing: is it really necessary at the time on implantable cardioverter-defibrillator insertion? Heart Rhythm. 2005;2:456-461.
83 Birnie D, Tung S, Simpson C, et al. Complications associated with defibrillation threshold testing: the Canadian experience. Heart Rhythm. 2008;5:387-390.
84 Karaoguz R, Altln T, Atbasoglu EC, et al. Defibrillation testing and early neurologic outcome. Int Heart J. 2008;49:553-563.
85 Winter J, Zimmermann N, Lidolt H, et al. Optimal method to achieve consistently low defibrillation energy requirements. Am J Cardiol. 2000;86:71K-75K.
86 Cooper JA, Latacha MP, Soto GE, et al. The azygos defibrillator lead for elevated defibrillation thresholds: implant technique, lead stability, and patient series. PACE. 2008;31:1405-1410.
87 Osswald BR, DeSimone R, Most S, et al. High defibrillation threshold in patients with implantable defibrillator: how effective is the subcutaneous finger lead? Eur J Cardiothorac Surg. 2009;35:489-492.
88 Mouchawar G, Kroll M, Val-Mejias JE, et al. ICD waveforms optimization: a randomized, prospective, pair sampled multicenter study. Pacing Clin Electrophysiol. 2000;23:1992-1995.
89 Luria D, Stanton MS, Eldar M, Glikson M. Pneumothorax: an unusual cause of ICD defibrillation failure. Pacing Clin Electrophysiol. 1998;21:474-475.
90 Schuchert A, Hoffmann M, Steffgen F, Meinertz T. Several unsuccessful internal and external defibrillations during active can ICD implantation in a patient with pneumothorax. Pacing Clin Electrophysiol. 1998;21:471-473.
91 Cohen TJ, Lowenkron DD. The effects of pneumothorax on defibrillation thresholds during pectoral implantation of an active can implantable cardioverter-defibrillator. Pacing Clin Electrophysiol. 1998;21:468-470.
92 Furman S. Defibrillation threshold and pneumothorax. Pacing Clin Electrophysiol. 1998;21:337-338.
93 Mainigi SK, Callans DJ. How to manage the patient with a high defibrillation threshold. Heart Rhythm. 2006;3:492-495.
94 Curtis JP, Luebbert JJ, Wang Y, et al. Association of physician certification and outcomes among patients receiving an implantable cardioverter-defibrillator. JAMA. 2009;301:1661-1670.
95 Poole JE, Johnson GW, Hellkamp AS, et al. Prognostic importance of defibrillator shocks in patients with heart failure. N Engl J Med. 2008;359:1009-1017.
96 Gulizia MM, Piraino L, Scherillo M, et al. A randomized study to compare ramp versus burst antitachycardia pacing therapies to treat fast ventricular tachyarrhythmias in patients with implantable cardioverter-defibrillators. Circ Arrhythm Electrophysiol. 2009;2:146-153.
97 Wathen MS, DeGroot PJ, Sweeney MO, et al. PainFREE Rx II Investigators. Prospective randomized multicenter trial of empirical antitachycardia pacing versus shocks for spontaneous rapid ventricular tachycardia in patients with implantable cardioverter-defibrillators: Pacing Fast Ventricular Tachycardia Reduces Shock Therapies (PainFREE Rx II) trial results. Circulation. 2004;110:2591-2596.
98 Wilkoff BL, Ousdigian KT, Sterns LD, et al. A comparison of empiric to physician-tailored programming of implantable cardioverter-defibrillators. J Am Coll Cardial. 2006;48:330-339.
99 Wilkoff BL, Williamson BD, Stern RS, et al. Strategic programming of detection and therapy parameters in implantable cardioverter-defibrillators reduces shocks in primary prevention patients. J Am Coll Cardiol. 2008;52:541-550.
100 Sweeney MO, Sherfesee L, DeGroot PJ, et al. Differences in effects of electrical therapy type for ventricular arrhythmias on mortality in implantable cardioverter-defibrillator patients. Heart Rhythm. 2010;7:353-360.
101 Epstein AE, Kay GN, Plumb VJ, et al. Gross and microscopic pathological changes associated with nonthoracotomy implantable defibrillator leads. Circulation. 1998;98:1517-1524.