[level-membership-for-neurosurgery-category]
CHAPTER 13 CT Evaluation of Meningiomas
INTRODUCTION
The majority of meningiomas have a typical appearance on CT, and the diagnosis is straightforward in these cases.1 The nonenhanced CT examination detects 85% and contrast-enhanced CT detects 95% of all intracranial meningiomas.2,3 Small intraventricular meningiomas or small lesions without surrounding brain edema may be missed on nonenhanced CT examinations. The typical meningioma appears as a sharply delineated round or hemispherical mass of iso- to high density on nonenhanced CT.
CT TECHNOLOGY
CT is one of the most outstanding inventions in the history of medicine. CT has contributed to the development of all disciplines in medicine and revolutionized brain imaging by displaying the brain directly in two dimensions, hence contributing significantly to progress in neurologic sciences. The first CT was designed and built by the English engineer Sir Godfrey Newbold Hounsfield at EMI Research Laboratories in England. The first CT image was acquired at the Atkinson Morley Hospital in London in 1972 and displayed a frontal brain tumor, which immediately convinced the medical profession of this new technology’s diagnostic capability.4 Allan McLeod Cormack at Tufts University independently invented a mathematical technique for the CT scan. G.N. Hounsfield and A.M. Cormack shared the Nobel prize in Medicine in 1979 for their achievements.4 Since the production of the first CT equipment, which was called the EMI head scanner, major technical advances were made in faster patient scanning and faster image reconstruction. First-generation CT scanners acquired a single brain slice in about 5 minutes.5 The introduction of new technologies such as spiral and helical CT has significantly shortened the scanning time. Finally, multidetector row CT technology was introduced in 1998. With this new technology, which uses an array of detectors to scan up to 64 slices per gantry rotation, a tissue block of 250 mm scan range can be visualized in a mere 4 seconds, while a whole-body examination can be completed in about 30 seconds. Such short scan times are a major advantage in emergency, traumatic, pediatric, and neurovascular cases.
Although CT is already a very practical and versatile imaging modality, it is still undergoing rapid technologic improvement. With increasing scanning speed new clinical applications such as CT angiography, CT venography, and CT perfusion studies are possible. Lately, the quality of CT angiography was improved to such an extent that it rivals catheter angiography. Multidetector row CT reconstruction protocols such as multiplanar reformation (MPR), maximum intensity projection (MIP), and volume rendering techniques yield images in three dimensions with resolution equal to that of primary images. The high spatial and temporal resolution and the excellent quality of 3D reformations certainly are some of the factors that make CT the most widely used diagnostic modality at present. Dynamic CT angiography was introduced in 2005 by Matsumoto and colleagues6 to demonstrate the cerebral arteries and veins separately in arteriovenous malformations (AVM) and meningiomas. In 2007 this technique evolved into true dynamic imaging after the introduction of multidetector row CT.7 Multidetector row CTs with 64 detector rows perform 40 rotations around the patient in 2 seconds7 and provide hemodynamic information on local cerebral blood flow, demonstrate feeding arteries, nidi, and draining veins of cerebral AVMs within a scanning range of 32 mm. Dynamic CT examination of the whole brain will soon be possible with the use of 256 detector row CT scanners, which will make CT angiography the procedure of choice for evaluating every blood vessel in the body.7 Further refinements are also performed, such as bone-subtraction CT angiography, in which a nonenhanced scan is subtracted from the contrast-enhanced second scan to yield better resolution of vascular structures adjacent to bone.8
Advances are also being made to make CT a safer imaging modality. Radiation exposure related to CT is a major drawback. Although CT examinations comprise 15% of all radiologic examinations, CT is responsible for 70% of the total patient radiation dose, which introduces concerns on increased cancer risk, especially in children and young adults.9 Radiation dose-limiting paradigms such as “as low as reasonably allowable-ALARA” are more strictly implemented. Radiation dose delivered to the patient during a CT examination depends on scanning parameters such as x-ray tube current, tube rotation time, peak voltage, pitch, and x-ray collimation. Lowering any of these parameters results in decreased patient radiation dose, however, at the cost of increased noise and image quality. It is suggested that the ordering physician should primarily decide on the quality expected from the examination to yield satisfactory clinical information and guide the dose reduction. Similarly, dose modulation strategies are used to modify the x-ray tube current according to the patient’s thickness or attenuation, to match a preset reference image quality and noise level. The reference quality is determined according to the need, for example, reconstruction of thin slices is used during screening for small aneurysms, while thick scanning and thin reconstruction is used for evaluating the spine. Newer, multiplanar reconstruction techniques have eliminated the need for scanning in different planes, further decreasing patient radiation exposure. In addition, a few simple actions may also help further decrease the dose: repeat CT examinations for high-density lesions (such as hematomas) or for studies in which resolution is not a primary concern (e.g., perfusion CT) can be performed with low-dose settings. Unnecessary repeat examinations can be avoided, and lastly, scanning of the lens and the cornea can be avoided in repeat examinations.
CT IMAGING FEATURES OF MENINGIOMAS
Routine CT examination of an intracranial meningioma will assess the tumor location and extent; evaluate tumor margins; characterize the tumor; and determine the presence of any mass effect, edema, or brain herniations.10,11 A summary of common CT features is provided in Table 13-1. However, meningiomas are common tumors with variable appearances, so that specific consideration is warranted for each finding.
| Criterion | Common findings |
|---|---|
| Location and extent |
Location and Extent
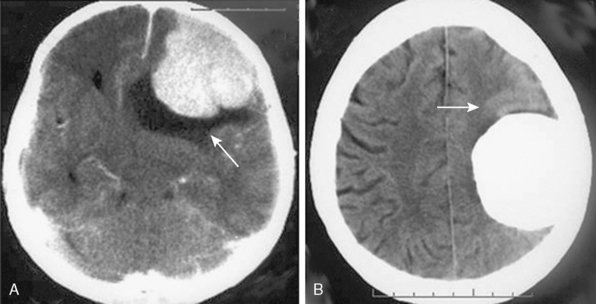
Meningiomas are extra-axial tumors, and the demonstration of this extra-axial origin is important for the diagnosis. In cases where the tumor attaches with a broad base to the dura or bone, the extra-axial origin is quite evident on CT examination. In certain cases, however, where the dural attachment is narrow it may not be easily demonstrated on CT.12 Two other CT findings that support the extra-axial localization are cerebrospinal fluid (CSF) clefts, surrounding or partially neighboring the tumor mass, and buckling of the cortex.12,13 CSF clefts appear as curvilinear hypodensities and form as a result of meningeal adhesions and tumor compression11 (Fig. 13-1A). This sign may not be evident on CT if the tumor has caused much mass effect. Buckling of the cortex, which denotes distortion and folding of the cortex and effacement of the sulcus under compression, is another finding common to extra-axial tumors14 (Fig. 13-1A, B).
Most common intracranial localizations for meningiomas, in decreasing order, are hemispheric convexity, parasagittal/falcine, sphenoid wing, olfactory groove, suprasellar and tuberculum sella, posterior fossa, cerebellar convexity, tentorium, cerebellopontine angle, foramen magnum, and intraventricular.10 The majority of these meningiomas are single. Multiple meningiomas may be encountered sporadically or as a manifestation of neurofibromatosis or meningiomatosis. Multiplicity is encountered in 10% of sporadic cases.15 Multiple meningiomas are encountered in 4.2% of neurofibromatosis type II patients.16–18 Multiplicity is common in families with a hereditary predisposition to meningiomas.18 Seldom, meningiomas can coexist with other intracranial tumors or even more rarely, intracranial meningiomas can be the site for metastasis of systemic cancer.
Tumor Shape and Margins
Most meningiomas are single, globoid (Fig. 13-2A) or lobulated tumors (Fig. 13-2B). The margins of the tumor are most commonly smooth and well circumscribed. Brain invasion may be seen in malignant meningiomas; however, most atypical and malignant meningiomas are sharply delineated from surrounding tissues.10,12 As described previously, CSF clefts may be seen around meningiomas.11 The shape may be influenced by surrounding anatomic structures (Fig. 13-2C). Multilobular meningiomas may also be encountered. “Mushrooming” is defined as the appearance of irregular, indistinct margins or finger-like extensions from the surface (Fig. 13-2D). Some authors have associated this finding with potentially malignant behavior.19 However, mushrooming may also be seen in a significant proportion of benign meningiomas. As demonstrated by this example, benign and malignant meningiomas can have very similar CT imaging findings. Malignant meningiomas may also have sharp, well demarcated margins and very little or no peritumoral edema. Therefore benign and malignant meningiomas cannot be differentiated based on CT findings alone.12
En plaque meningiomas, which are less common, grow flat along the dura like a carpet (Fig. 13-2E). A lucent line between the bone and the calcified en plaque meningioma corresponds to the dura (Fig. 13-2F) and is considered a specific sign for meningioma by some authors.20 En plaque meningiomas have a higher incidence of hyperostosis on CT.20
Density
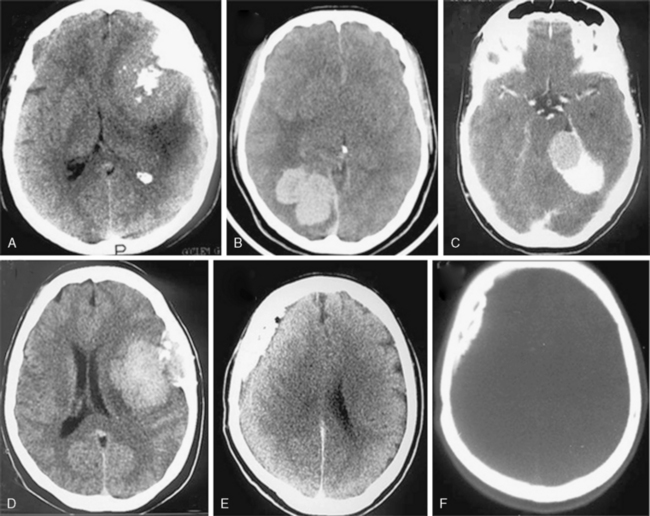
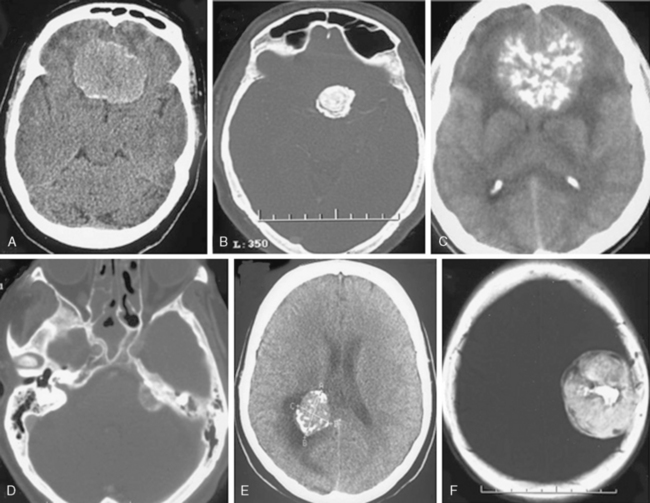
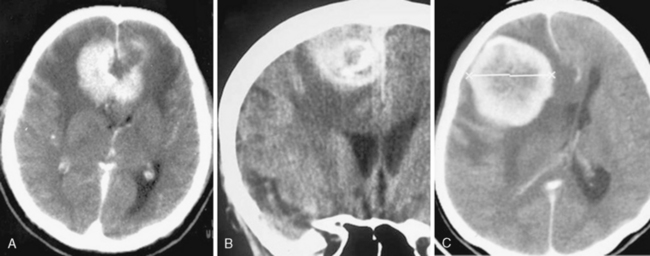
On nonenhanced CT scans, 54% to 75% of meningiomas appear as homogeneous masses that are hyperdense compared to the adjacent brain cortex10,12,16 (Fig. 13-3A). Up to 25% appear isodense. Small isodense meningiomas may be overlooked on CT if they have no associated brain edema (Fig. 13-3B). Homogeneously hypodense meningiomas are quite uncommon and comprise 1% to 5% of all meningiomas.10,16 Hyperdensity can be attributed to hypervascularity, hypercellularity, reduced water content, or calcifications.2,16,21 Dense and widespread calcifications or acute hemorrhage will present as focal areas of marked hyperdensity.22 Gross hemorrhage within the tumor is rare in meningiomas. The density of acute hemorrhage is higher than that of the tumor but lower than that of calcifications (Fig. 13-3C). Follow-up CT scans will reveal decreasing density of the hemorrhage, which will finally become hypodense in 3 to 4 weeks. Large calcifications, cysts, necrosis, or hemorrhage can cause inhomogeneity of CT images. Such focal hypodense, nonenhancing areas, representing cystic changes, old hemorrhage, or necrosis, are encountered in 5% to 23% of all cases1,12 (Fig. 13-3D). Coexistence of hemorrhage and necrosis is extremely rare. Although extremely rare, metastasis into meningiomas from systemic cancer can also be seen.23 Lipoblastic or xanthomatous variants of meningiomas are extremely rare and may appear markedly hypodense on CT.24
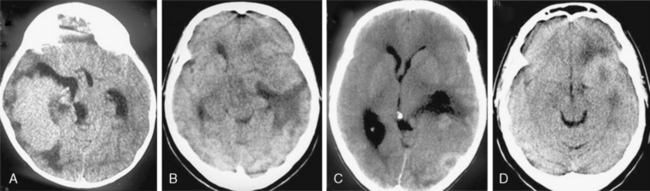
FIGURE 13-3 The typical meningioma appears hyperdense on nonenhanced CT images. The hyperdensity is easily appreciated if there is associated peritumoral edema (A). Small isodense meningiomas, on the other hand, may be missed in the absence of associated findings such as edema (B). Acute hemorrhage will appear denser than the parent mass (C) but less so than calcifications (see Fig. 13-4). Small areas of hypodensity in the meningioma may indicate cystic changes, old hemorrhage, or necrosis (D).
(Courtesy of Canan Erzan, MD, Marmara University School of Medicine, Istanbul, Turkey.)
Contrast Enhancement
Meningiomas are extra-axial and very vascular tumors. On standard contrast-enhanced CT examinations, about 90% of meningiomas enhance strongly and homogeneously (Fig. 13-4A). Ten percent of meningiomas show mild contrast enhancement12 (Fig. 13-4B). Poor enhancement is commonly encountered in the microcystic histologic variant.15 Cystic meningiomas exhibit an enhancing cyst wall adjacent to the dura (Fig. 13-4C). Necrotic or totally calcified meningiomas enhance less strongly or the enhancement may only be detectable upon measurement of CT density units. Necrosis in meningiomas, which is more commonly seen in large or highly vascular meningiomas, may result in heterogeneous contrast enhancement (Fig. 13-4D, E). These large, hypervascular meningiomas are usually surrounded by capsule veins, which are seen as small, enhancing, round structures that can be traced into the tumor (Fig. 13-4F).
The dural tail as described on MRI imaging, results form pronounced dural contrast enhancement due to the inflammation or tumor cell infiltration of the dura and is encountered in 60% of meningiomas.12,25 This typical MRI finding of meningiomas is less pronounced on CT, because of milder enhancement with CT contrast agents and the difficulty in differentiating the enhanced dura and the surrounding hyperdense bone.
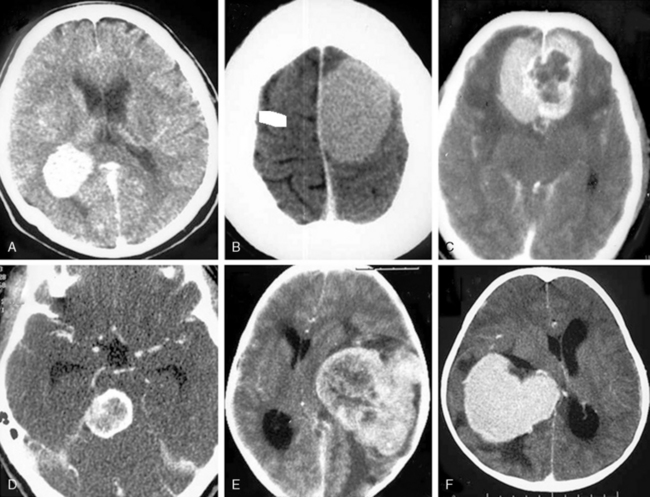
Calcifications
Historically, calcifications have been the most reliable diagnostic feature of meningiomas on conventional x-ray examination.21 This holds true also for CT examinations.21 Intratumoral calcifications are one of the most characteristic features of meningiomas on CT. Calcifications are identified in 20% to 30% of all meningiomas on nonenhanced CT.2,5,26 Size and distribution of the calcifications may vary and they may be focal or diffuse. Very small and uniformly distributed, “sand-like” calcifications are called “psammomatous” and may result in an increased CT density (Fig. 13-5A). This is the most common type of calcification in meningiomas. Large sized calcifications are less common than sand-like calcifications and may vary in shape and appear punctuate, irregular, circular, star shaped or ring shaped on CT (Fig. 13-5B–E). Densely calcified meningiomas may also be encountered. Total or partial ossification of a meningioma may also be encountered (Fig. 13-5F). Calcifications are more common in transitional and fibroblastic menginiomas.22 Atypical and malignant meningiomas have lower rates of calcifications. Some authors claim that calcifications in meningiomas have also a prognostic significance and conclude that calcified meningiomas do not recur.27
Bone Changes
The reported incidence of bone involvement in meningiomas adjacent to bone ranges from 20% to 44%.16,20,28–30 Bone changes are seen in the form of hyperostosis in 78% and bone destruction in 22%.16 When more closely analyzed, bone changes on CT can be grouped into three categories: hyperostosis, osteolysis and permeation. Each of these three changes can coexist with the others or one or the other may predominate at different times (Table 13-2).
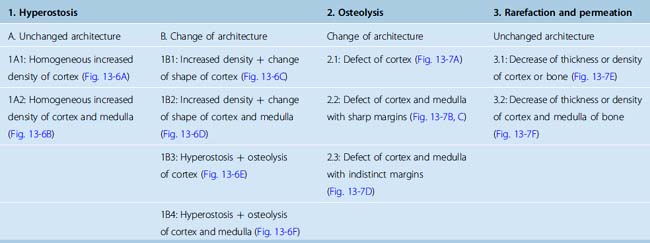
Hyperostosis denotes increased density either of the cortex (Fig. 13-6A) or both the cortex and medulla (Fig. 13-6B). Hyperostosis can be homogeneous and exhibit a fine structure so that the bone architecture remains unchanged. Heterogeneous and coarse hyperostosis with cystic areas distorts the bone architecture (Fig. 13-6C, D). Hyperostotic changes can coexist with osteolysis (Fig. 13-6E, F). Although reactive sub-periosteal bone deposition has been postulated by some authors, other studies have shown that the extensive hyperostosis encountered in sphenoid wing and anterior fossa meningiomas contained meningioma tumor cells filling up the medullary spaces in pathologic specimens.15,26,28 In addition, osteolytic changes next to a meningioma indicate rapid tumor growth.28 Other studies have shown that radical resection of the involved dura and bone is required to ascertain a long recurrence-free period after surgery.29 Therefore, demonstration of bone involvement is of great diagnostic importance in meningioma patients and visualization of adjacent bone with thin-section and high-resolution CT.
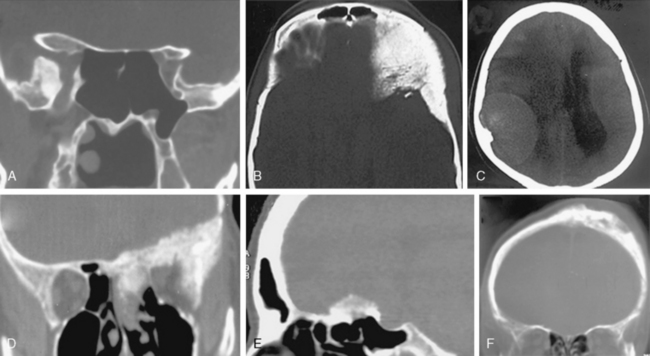
FIGURE 13-6 Meningiomas can cause hyperostosis of the adjacent bone. Hyperostosis may leave the architecture intact (A, B) or may change the architecture (C–F). In hyperostotic bone with normal architecture, increased density may be observed in the cortex (A and 1A1 in Table 13-2) or in the cortex and medulla (B and 1A2 in Table 13-2). In other cases the architecture is destroyed, either only in the cortex (C and 1B1 in Table 13-2) or both in the cortex and medulla (D and 1B2 in Table 13-2). Hyperostosis may coexist with bone destruction in the cortex (E and 1B3 in Table 13-2) or in the cortex and medulla (F and 1B4 in Table 13-2).
(Courtesy of Canan Erzan, MD, Marmara University School of Medicine, Istanbul, Turkey.)
Bone destruction may also be evident in meningioma cases. Osteolysis is bone destruction with distinct (Fig. 13-7A, B) or irregular margins (Fig. 13-7C, D). The process may involve only the cortex or the entire of the bone, but it invariably changes the bone architecture. This may be a finding associates with malignancy.31 Kim and colleagues32 indicated that 56% of rhabdoid meningiomas had hyperostotic bone changes on CT and half of these cases had bone destruction as well. Nakasu and colleagues27 have shown that osteolytic meningiomas exhibited the highest recurrence rates.
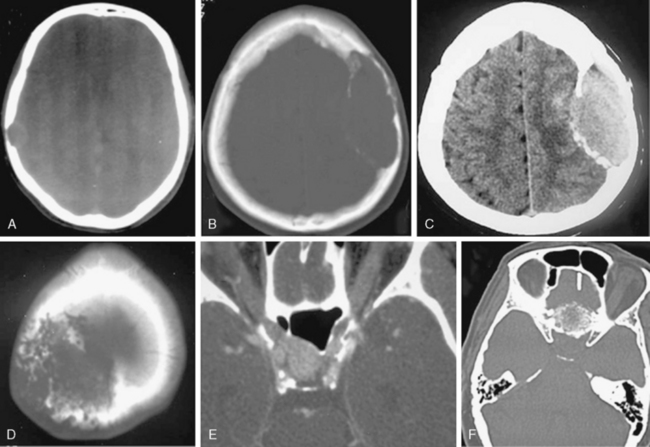
FIGURE 13-7 Meningiomas can cause bone destruction or rarefaction. Osteolytic areas may exhibit distinct margins with only cortical (A and 2.1 in Table 13-2) or both cortical and medullary involvement (B, C, and 2.2 in Table 13-2). Osteolysis may also result in irregular bone margins (D and 2.3 in Table 13-2). Another form of bone change is permeation and rarefaction, which is decrease in density and thickness without loss of bone architecture. Permeation may only involve the cortex (E and 3.1 in Table 13-2) or both the cortex and medulla (F and 3.2 in Table 13-2).
(Courtesy of Canan Erzan, MD, Marmara University School of Medicine, Istanbul, Turkey.)
A third type of secondary bone change observed in meningiomas is permeation and rarefaction. The term denotes decrease in bone density and thinning of the bone without major changes in bone architecture (Fig. 13-7E, F).
Bone changes in specific meningiomas
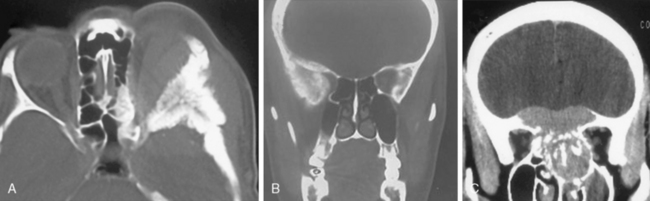
Sphenoid wing meningiomas exhibit a very high incidence of hyperostosis, which can be observed in up to 90% of cases.33 Hyperostosis is caused by tumor infiltration and the high recurrence rates after surgery of sphenoid wing meningiomas may be related to the difficulty of resection of the widely infiltrated bone.34 Hyperostosis frequently involves the inner table, widening it and causing an increase in density. This increased density may be homogeneous, coarse, or spiculated at the margin (Fig. 13-8A). The bone architecture will be grossly affected, which will become more evident upon comparison to contralateral side on CT (Fig. 13-8B). Meningioma associated bone changes in the sphenoid wing may mimic fibrous dysplasia. Expansion of the medullar cavity and the ground glass appearance of the bone on CT support the diagnosis of fibrous dysplasia. Olfactory groove meningiomas may extend directly into ethmoid and sphenoid sinuses by invasion in up to one fifth of cases as they are located next to the cribriform plate and planum sphenoidale.35 As in sphenoid wing meningiomas, high recurrence rates are observed after surgery.34 Contrast-enhanced, high-resolution, thin-section CT with multiplanar reconstructions is effective in clearly defining bone invasion and paranasal sinus extensions (Fig. 13-8C).
Temporal bone meningiomas: Hamilton and colleagues36 analyzed imaging characteristics of temporal bone meningiomas and grouped them into tegmen tympani, jugular foramen and internal auditory canal meningiomas based on primary location and the vector of spread. Both tegmen tympani and jugular foramen meningiomas spread into the middle ear cavity. Tegmen tympani meningiomas arise from the floor of the middle fossa and extend into the middle ear cavity and cause thickening of the bone trabeculae while they transverse the temporal bone.36 In contrast, jugular foramen meningiomas cause diffuse skull base infiltration in the form of primary intraosseous spread and result in permeation and rarefaction of the bone without marked hyperostosis or destruction so that the architecture is preserved.36,37 This rarefaction may be so marked that at times a differential diagnosis from temporal bone osteomyelitis may be needed. Internal acoustic canal meningiomas are rare and their differential diagnosis from vestibular schwannomas can be done based on the presence of calcifications or secondary hyperostosis on CT.38,39
Petroclival meningiomas cause secondary changes in the petrous bone in close to one third of the cases.40,41 Calcifications are observed in up to 40%. Osteolytic changes may warrant differential diagnosis from other invasive tumors in the region including chordomas, chondrosarcomas and metastases. In petroclival meningiomas 3D dynamic CT angiography can provide information on encasement of vascular structures.6,7
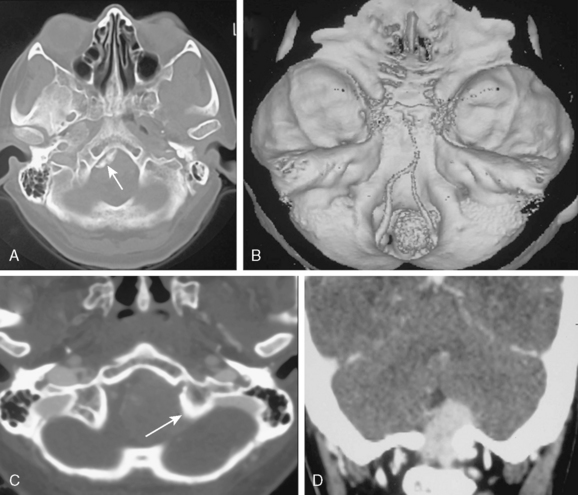
Hyperostosis is observed in approximately one fifth of foramen magnum meningiomas42 (Fig. 13-9A–D). Osteolysis, however, is rarely observed. Primary intraosseous meningiomas are very rare. Primary extradural and ectopic meningiomas make up 2% of all cases. Among these, primary intraosseous meningiomas make up 14% of the cases.43–46 Lang classified intracranial primary intraosseous meningiomas into convexity and skull base types. CT demonstrates hyperostosis, thickening and outward bulging of the bone, spiculations on the surface in 59% of the cases or osteolysis with destruction of the cortex and permeation of the bone in 35% or a mixture of both hyperostosis and osteolysis in 6%47 (Fig. 13-10A, B). Although the major component is located within the bone, dural invasion can be seen in up to 26% of the cases, which makes differentiation from an en-plaque meningioma difficult.43–46,48
Edema and Mass Effect
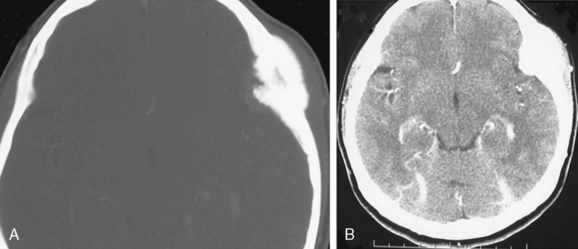
A mass effect is encountered in almost all meningiomas. Edema in the peritumoral brain is observed in 60% of meningioma cases26,49–51 (Fig. 13-11A). Edema is most pronounced in the white mater. Meningiomas in certain localizations tend to present with more severe peritumoral edema. Olfactory groove, parasagittal and parietal convexity meningiomas commonly present with marked edema.16 The edema may be extensive and the degree is independent from the size and histology of the meningioma, nor does it have any prognostic significance.11 The pathophysiology of peritumoral edema in meningiomas is not entirely clear.52 Shift of midline structures due to edema related mass effect is severe in 30%, mild in 40%, and minimal in 30% of the cases16 (Fig. 13-11B, C). Uncal herniation should be suspected and sought in cases of middle fossa meningiomas presenting with marked edema.
Vasculature
3D CT angiography can demonstrate the vascular supply and the relationship of the tumor to important surrounding vascular structures7,53 (Fig. 13-12A, B). Skull base meningiomas may encircle or incase the internal carotid artery, the basilar artery or their branches and may result in narrowing of the artery.11 Irregularities of the arterial wall caused by meningioma encasement can be demonstrated on 3D CT angiography (Fig. 13-12C). Dynamic CT scanning may be used to differentiate between the enhancement of major vessels and the meningioma.53
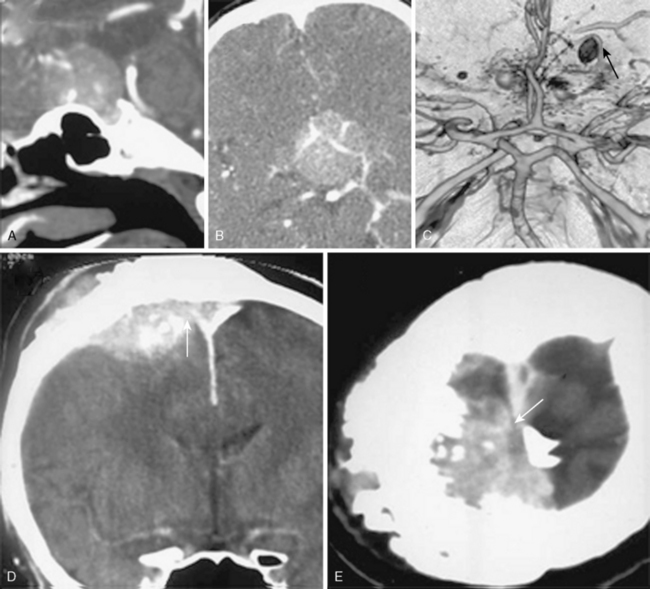
Compression or shifting of major cerebral veins or sinuses can be reliably demonstrated on routine CT venography, which is performed as a late phase of CT angiography54 (Fig. 13-12D, E). However; invasion of major venous sinuses may be difficult if both the tumor and the sinus enhance to the same degree.54 Demonstration of enlarged meningeal vascular channels on skull bones or impressions of dilated veins as a result of venous congestion are well known x-ray findings in meningiomas.10,11 Same findings can also be demonstrated on CT examination of the skull, especially in 3D CT reconstructions.
CT DIFFERENTIAL DIAGNOSIS OF MENINGIOMAS
Meningiomas make up 13% to 26% of all intracranial tumors, hence they are very common.15 Interestingly a large percentage of even ordinary, benign meningiomas have unusual radiologic appearances.1 Therefore, there is a large list of other neoplastic, inflammatory, infectious, and vascular pathologies and nonpathologic changes that may need differentiation from a meningioma.
Tumors of the bone as well as extraaxial and intraaxial brain tumors may mimic meningiomas.55 Osteomas, osteoblastomas, or enchondromas may be encountered at the falx. Malignant mesenchymal tumors such as sarcomas around the falx may also mimic meningiomas. Eosinophilic granulomas, dermoid cysts, plasmocytomas, aneurismal bone cysts, and giant cell and metastatic carcinomas will all cause focal ostelolytic lesions. These lesions may resemble intraosseous meningiomas. Osteomas or osteoblastomas are focal, dense lesions with well defined margins, distinct from the more diffusely hyperostosing meningiomas. Differential diagnosis of a hyperostosing meningioma form fibrous dysplasia, which manifests as expansion of medullary spaces, with minor thinning of the cortex may be a diagnostic challenge. A homogeneous, “ground-glass” density on CT is typical for fibrous dysplasia, although inhomogeneous sclerosis is also possible. Meningiomas almost invariably involve the bony cortex and visualization of a contrast enhancing extra-osseous soft tissue mass will support the diagnosis of a meningioma. A single meningeal metastasis is the most difficult tumor to differentiate from a meningioma, especially if it is located near or in the dura and if it causes secondary bone changes.56 A sunburst pattern of hyperostosis of the skull may be seen in meningiomas, hemangiomas, plasmocytomas, leukemic infiltration, osteosarcomas, and Ewing’s sarcomas and in a diffuse manner in hemolytic anemias.57 The differentiation of an osteoblastic prostate metastasis from an intraosseous meningioma is also very challenging. In contrast, secondary leukemic infiltration of the leptomeninges will most commonly present as multiple small enhancing nodules, which will differentiate them from single meningiomas.
Common extraaxial tumors such as schwannomas may resemble meningiomas.58 The most common site for such a differential is the cerebellopontine angle.38,58,59 Radiologic findings that suggest a schwannoma are the absence of calcifications and the expansion of the internal acoustic canal without bone destruction or hyperostosis. On the contrary, meningiomas appear as homogeneously and intensely enhancing masses in the cerebellopontine angle cistern; attach with a broad base to the petrous bone; contain focal and dense calcifications and frequently cause secondary changes in the bone. CT will easily demonstrate the anatomical configuration and measurements of the internal acoustic canal and bone changes in the area.60 Among other common extraaxial tumors are well circumscribed, moderately enhancing neurofibromas, which are commonly found in the spine and the craniocervical junction. Especially in patients with Neurofibromatosis they may mimic foramen magnum or jugular foramen meningiomas. Hemangiopericytomas are rare lesions that resemble strongly enhancing meningiomas.55,61 CT angiography may demonstrate the intense vascularization of these tumors.
Intra-axial tumors that should be included in the differential diagnosis are gliomas, hemangioblastomas, craniopharyngiomas. On CT scanning high grade gliomas may be difficult to differentiate from meningiomas, which contain central necrosis.62,63 Hemangioblastomas may mimic cystic cerebellar meningiomas, especially when they are located near the leptomeninges. The intensely enhancing mural nodule of hemangioblastomas helps in differentiating them from cystic meningiomas, which show enhancement of the entire cyst wall. Calcified craniopharyngiomas may mimic tuberculum sella meningiomas. 3D CT reconstructions will better define the primary localization, while changes in the adjacent bone will also aid in the diagnosis.
Inflammatory lesions such as granulomas or tuberculomas are frequently encountered in the suprasellar cistern and may mimic tuberculum sella meningiomas.64 These lesions, especially tuberculomas may be calcified as in meningiomas. However, tuberculomas are mostly multiple. Sarcoid, tuberculous or fungal granulomas cause meningitis which manifests as a diffusely thickened and intensely enhancing dura on CT examinations, which is quite distinct from the typical dural tail of a meningioma.
Chronic lobar hemorrhages may mimic convexity meningiomas; however, multiplanar reconstructions of CT imaging will usually differentiate intraaxial hemorrhages from large-convexity meningiomas with associated bone changes, that intensely enhance with contrast.65 Similarly, thrombosed and partially calcified giant cerebral aneurysms may mimic cavernous sinus meningiomas with calcifications. Dural arteriovenous malformations may also mimic meningiomas.66 CT angiography may yield information on the feeding or parent arteries or demonstrate the connection of the aneurysm to the artery.
[1] Russell E.J., George A.E., Kricheff II, Budzilovich G. Atypical computed tomography features of intracranial meningioma: radiological-pathological correlation in a series of 131 consecutive cases. Radiology. 1980;135:673-682.
[2] Williams A.L., Haughton V.M. Cranial Computerized Tomography. St. Louis: Mosby, 1985.
[3] Ketonen L. Computerized tomography for diagnosis of supratentorial tumors. Acta Neurol Scand Suppl. 1978;67:153-164.
[4] Oransky I., Sir Godfrey N. Hounsfield. Lancet. 2004;364:1032.
[5] Claveria L., Sutton D., Tress B.M. The radiological diagnosis of meningiomas, the impact of EMI scanning. Br J Radiol. 1977;50:15-22.
[6] Matsumoto M., Kodama N., Sakuma J., et al. 3D-CT arteriography and 3D-CT venography: the separate demonstration of arterial-phase and venous-phase on 3D-CT angiography in a single procedure. AJNR Am J Neuroradiol. 2005;26:635-641.
[7] Matsumoto M., Kodama N., Endo Y., et al. Dynamic 3D-CT angiography. AJNR Am J Neuroradiol. 2007;28:299-304.
[8] Tomandl B.F., Hammen T., Klotz E., Ditt H., Stemper B., Lell M. Bone-subtraction CT angiography for the evaluation of intracranial aneurysms. AJNR Am J Neuroradiol. 2006;27:55-59.
[9] Linton O.W., Mettler F.A.Jr. National conference on dose reduction in CT, with an emphasis on pediatric patients. AJR Am J Roentgenol. 2003;181:321-329.
[10] Osborn A.G. Diagnostic Neuroradiology. St. Louis: Mosby, 1994.
[11] Taveras J.M. Neuroradiology, 3rd ed. Baltimore: Williams & Wilkins, 1996.
[12] Osborn A.G. Brain tumors and tumorlike masses: classification and differential diagnosis. In: Osborn A.G., editor. Diagnostic Neuroradiology. St. Louis: Mosby; 1994:401-528.
[13] Higer H.P., Pedrosa P., Schuth M. MR imaging of cerebral tumors: state of the art and work in progress. Neurosurg Rev. 1989;12:91-106.
[14] George A.E., Russell E.J., Kricheff II. White matter buckling: CT sign of extraaxial intracranial mass. AJR Am J Roentgenol. 1980;135:1031-1036.
[15] Louis D.N., Scheithauer B.W., Budka H., von Deimling A., Kepes J.J. Kleihues P., Cavenee W.K., editors. Meninigomas. The WHO Classification of Tumors of the Nervous System, Lyon, 2002;176-184.
[16] Pamir M.N., Erbengi A., Zileli T., Ozgen T. Diagnostic features and efficacy of cranial computerized tomography in intracranial meningiomas. Cerrahpasa Tip Fakultesi Dergisi. 1983;1983:47.
[17] Mautner V.F., Lindenau M., Baser M.E., et al. The neuroimaging and clinical spectrum of neurofibromatosis 2. Neurosurgery. 1996;38:880-885. discussion 885–6
[18] Louis D.N., Ramesh V., Gusella J.F. Neuropathology and molecular genetics of neurofibromatosis 2 and related tumors. Brain Pathol. 1995;5:163-172.
[19] New P.F., Hesselink J.R., O’Carroll C.P., Kleinman G.M. Malignant meningiomas: CT and histologic criteria, including a new CT sign. AJNR Am J Neuroradiol. 1982;3:267-276.
[20] Kim K.S., Rogers L.F., Lee C. The dural lucent line: characteristic sign of hyperostosing meningioma en plaque. AJR Am J Roentgenol. 1983;141:1217-1221.
[21] Gouliamos A.D., Jimenez J.P., Goree J.A. Computed tomography and skull radiography in the diagnosis of calcified brain tumor. AJR Am J Roentgenol. 1978;130:761-764.
[22] Vassilouthis J., Ambrose J. Computerized tomography scanning appearances of intracranial meningiomas. An attempt to predict the histological features. J Neurosurg. 1979;50:320-327.
[23] Elmaci L., Ekinci G., Kurtkaya O., Sav A., Pamir M.N. Tumor in tumor: metastasis of breast carcinoma to intracranial meningioma. Tumori. 2001;87:423-427.
[24] Kepes J.J. Lipidized meningothelial tumor cells in “xanthomatous” meningioma express macrophage antigen. J Neuropathol Exp Neurol. 1994;53:384-388.
[25] Goldsher D., Litt A.W., Pinto R.S., Bannon K.R., Kricheff II. Dural “tail” associated with meningiomas on Gd-DTPA-enhanced MR images: characteristics, differential diagnostic value, and possible implications for treatment. Radiology. 1990;176:447-450.
[26] Rohringer M., Sutherland G.R., Louw D.F., Sima A.A. Incidence and clinicopathological features of meningioma. J Neurosurg. 1989;71:665-672.
[27] Nakasu S., Nakasu Y., Nakajima M., Matsuda M., Handa J. Preoperative identification of meningiomas that are highly likely to recur. J Neurosurg. 1999;90:455-462.
[28] Sheporaitis L.A., Osborn A.G., Smirniotopoulos J.G., Clunie D.A., Howieson J., D’Agostino A.N. Intracranial meningioma. AJNR Am J Neuroradiol. 1992;13:29-37.
[29] Simpson D. Recurrence of intracranial meningiomas after surgical treatment. J Neurol Neurosurg Psychiatry. 1957;20:22-39.
[30] Pieper D.R., Al-Mefty O., Hanada Y., Buechner D. Hyperostosis associated with meningioma of the cranial base: secondary changes or tumor invasion. Neurosurgery. 1999;44:742-746.
[31] Alvarez F., Roda J.M., Perez Romero M., Morales C., Sarmiento M.A., Blazquez M.G. Malignant and atypical meningiomas: a reappraisal of clinical, histological, and computed tomographic features. Neurosurgery. 1987;20:688-694.
[32] Kim E.Y., Weon Y.C., Kim S.T., et al. Rhabdoid meningioma: clinical features and MR imaging findings in 15 patients. AJNR Am J Neuroradiol. 2007;28:1462-1465.
[33] Terstegge K., Schorner W., Henkes H., Heye N., Hosten N., Lanksch W.R. Hyperostosis in meningiomas: MR findings in patients with recurrent meningioma of the sphenoid wings. AJNR Am J Neuroradiol. 1994;15:555-560.
[34] Mirimanoff R.O., Dosoretz D.E., Linggood R.M., Ojemann R.G., Martuza R.L. Meningioma: analysis of recurrence and progression following neurosurgical resection. J Neurosurg. 1985;62:18-24.
[35] Nakamura M., Struck M., Roser F., Vorkapic P., Samii M. Olfactory groove meningiomas: clinical outcome and recurrence rates after tumor removal through the frontolateral and bifrontal approach. Neurosurgery. 2007;60:844-852. discussion 844–52
[36] Hamilton B.E., Salzman K.L., Patel N., et al. Imaging and clinical characteristics of temporal bone meningioma. AJNR Am J Neuroradiol. 2006;27:2204-2209.
[37] Macdonald A.J., Salzman K.L., Harnsberger H.R., Gilbert E., Shelton C. Primary jugular foramen meningioma: imaging appearance and differentiating features. AJR Am J Roentgenol. 2004;182:373-377.
[38] Nakamura M., Roser F., Mirzai S., Matthies C., Vorkapic P., Samii M. Meningiomas of the internal auditory canal. Neurosurgery. 2004;55:119-127. discussion 127–8
[39] Asaoka K., Barrs D.M., Sampson J.H., McElveen J.T.Jr, Tucci D.L., Fukushima T. Intracanalicular meningioma mimicking vestibular schwannoma. AJNR Am J Neuroradiol. 2002;23:1493-1496.
[40] Carvalho G.A., Matthies C., Tatagiba M., Eghbal R., Samii M. Impact of computed tomographic and magnetic resonance imaging findings on surgical outcome in petroclival meningiomas. Neurosurgery. 2000;47:1287-1294. discussion 1294–5
[41] Van Havenbergh T., Carvalho G., Tatagiba M., Plets C., Samii M. Natural history of petroclival meningiomas. Neurosurgery. 2003;52:55-62. discussion 62–4
[42] Pamir M.N., Kilic T., Ozduman K., Ture U. Experience of a single institution treating foramen magnum meningiomas. J Clin Neurosci. 2004;11:863-867.
[43] Arana E., Diaz C., Latorre F.F., et al. Primary intraosseous meningiomas. Acta Radiol. 1996;37:937-942.
[44] Agrawal V., Ludwig N., Agrawal A., Bulsara K.R. Intraosseous intracranial meningioma. AJNR Am J Neuroradiol. 2007;28:314-315.
[45] Tokgoz N., Oner Y.A., Kaymaz M., Ucar M., Yilmaz G., Tali T.E. Primary intraosseous meningioma: CT and MRI appearance. AJNR Am J Neuroradiol. 2005;26:2053-2056.
[46] Ammirati M., Mirzai S., Samii M. Primary intraosseous meningiomas of the skull base. Acta Neurochir (Wien). 1990;107:56-60.
[47] Crawford T.S., Kleinschmidt-DeMasters B.K., Lillehei K.O. Primary intraosseous meningioma. Case report. J Neurosurg. 1995;83:912-915.
[48] Som P.M., Sachdev V.P., Sacher M.M., Stollman A.L., Lawson W. Intrafrontal sinus primary meningioma. Neuroradiology. 1991;33:251-252.
[49] Goldman C.K., Bharara S., Palmer C.A., et al. Brain edema in meningiomas is associated with increased vascular endothelial growth factor expression. Neurosurgery. 1997;40:1269-1277.
[50] Kilic T., Bayri Y., Ozduman K., et al. Tenascin in meningioma: expression is correlated with anaplasia, vascular endothelial growth factor expression, and peritumoral edema but not with tumor border shape. Neurosurgery. 2002;51:183-192. discussion 192–3
[51] Ide M., Jimbo M., Kubo O., Yamamoto M., Takeyama E., Imanaga H. Peritumoral brain edema and cortical damage by meningioma. Acta Neurochir Suppl (Wien). 1994;60:369-372.
[52] Sklar E.M., Schatz N.J., Glaser J.S., Sternau L., Seffo F. Optic tract edema in a meningioma of the tuberculum sellae. AJNR Am J Neuroradiol. 2000;21:1661-1663.
[53] Hirsch W.L.Jr, Hryshko F.G., Sekhar L.N., et al. Comparison of MR imaging, CT, and angiography in the evaluation of the enlarged cavernous sinus. AJR Am J Roentgenol. 1988;151:1015-1023.
[54] Wetzel S.G., Kirsch E., Stock K.W., Kolbe M., Kaim A., Radue E.W. Cerebral veins: comparative study of CT venography with intraarterial digital subtraction angiography. AJNR Am J Neuroradiol. 1999;20:249-255.
[55] Johnson M.D., Powell S.Z., Boyer P.J., Weil R.J., Moots P.L. Dural lesions mimicking meningiomas. Hum Pathol. 2002;33:1211-1226.
[56] Laidlaw J.D., Kumar A., Chan A. Dural metastases mimicking meningioma. Case report and review of the literature. J Clin Neurosci. 2004;11:780-783.
[57] Isla A., Alvarez F., Gutierrez M., Gamallo C., Garcia-Blazquez M., Vega A. Primary cranial vault lymphoma mimicking meningioma. Neuroradiology. 1996;38:211-213.
[58] Louw D., Sutherland G., Halliday W., Kaufmann J. Meningiomas mimicking cerebral schwannoma. J Neurosurg. 1990;73:715-719.
[59] Jackler R.K., Parker D.A. Radiographic differential diagnosis of petrous apex lesions. Am J Otol. 1992;13:561-574.
[60] Naidich T.P., Lin J.P., Leeds N.E., et al. Computed tomography in the diagnosis of extra-axial posterior fossa masses. Radiology. 1976;120:333-339.
[61] Kochanek S., Schroder R., Firsching R. Hemangiopericytoma of meninges. I. Histopathological variability and differential diagnosis. Zentralbl Neurochir. 1986;47:183-190.
[62] Amundsen P., Dugstad G., Syvertsen A.H. The reliability of computer tomography for the diagnosis and differential diagnosis of meningiomas, gliomas, and brain metastases. Acta Neurochir (Wien). 1978;41:177-190.
[63] Steinhoff H., Lanksch W., Kazner E., et al. Computed tomography in the diagnosis and differential diagnosis of glioblastomas. A qualitative study of 295 cases. Neuroradiology. 1977;14:193-200.
[64] Sandhu F.A., Schellinger D., Martuza R.L. A vascular sarcoid mass mimicking a convexity meningioma. Neuroradiology. 2000;42:195-198.
[65] Schwartz A., Gass A., Hennerici M. Stroke vignette. Epidural hematoma and hemorrhagic infarction mimicking a left temporal meningioma. Cerebrovasc Dis. 1999;9:251-252.
[66] Perry J.R., Tucker W.S., Chui M., Bilbao J.M. Dural cavernous hemangioma: an under-recognized lesion mimicking meningioma. Can J Neurol Sci. 1993;20:230-233.
[/level-membership-for-neurosurgery-category][not-level-membership-for-neurosurgery-category]
CHAPTER 13 CT Evaluation of Meningiomas
INTRODUCTION
The majority of meningiomas have a typical appearance on CT, and the diagnosis is straightforward in these cases.1 The nonenhanced CT examination detects 85% and contrast-enhanced CT detects 95% of all intracranial meningiomas.2,3 Small intraventricular meningiomas or small lesions without surrounding brain edema may be missed on nonenhanced CT examinations. The typical meningioma appears as a sharply delineated round or hemispherical mass of iso- to high density on nonenhanced CT.
CT TECHNOLOGY
CT is one of the most outstanding inventions in the history of medicine. CT has contributed to the development of all disciplines in medicine and revolutionized brain imaging by displaying the brain directly in two dimensions, hence contributing significantly to progress in neurologic sciences. The first CT was designed and built by the English engineer Sir Godfrey Newbold Hounsfield at EMI Research Laboratories in England. The first CT image was acquired at the Atkinson Morley Hospital in London in 1972 and displayed a frontal brain tumor, which immediately convinced the medical profession of this new technology’s diagnostic capability.4 Allan McLeod Cormack at Tufts University independently invented a mathematical technique for the CT scan. G.N. Hounsfield and A.M. Cormack shared the Nobel prize in Medicine in 1979 for their achievements.4 Since the production of the first CT equipment, which was called the EMI head scanner, major technical advances were made in faster patient scanning and faster image reconstruction. First-generation CT scanners acquired a single brain slice in about 5 minutes.5 The introduction of new technologies such as spiral and helical CT has significantly shortened the scanning time. Finally, multidetector row CT technology was introduced in 1998. With this new technology, which uses an array of detectors to scan up to 64 slices per gantry rotation, a tissue block of 250 mm scan range can be visualized in a mere 4 seconds, while a whole-body examination can be completed in about 30 seconds. Such short scan times are a major advantage in emergency, traumatic, pediatric, and neurovascular cases.
Although CT is already a very practical and versatile imaging modality, it is still undergoing rapid technologic improvement. With increasing scanning speed new clinical applications such as CT angiography, CT venography, and CT perfusion studies are possible. Lately, the quality of CT angiography was improved to such an extent that it rivals catheter angiography. Multidetector row CT reconstruction protocols such as multiplanar reformation (MPR), maximum intensity projection (MIP), and volume rendering techniques yield images in three dimensions with resolution equal to that of primary images. The high spatial and temporal resolution and the excellent quality of 3D reformations certainly are some of the factors that make CT the most widely used diagnostic modality at present. Dynamic CT angiography was introduced in 2005 by Matsumoto and colleagues6 to demonstrate the cerebral arteries and veins separately in arteriovenous malformations (AVM) and meningiomas. In 2007 this technique evolved into true dynamic imaging after the introduction of multidetector row CT.7 Multidetector row CTs with 64 detector rows perform 40 rotations around the patient in 2 seconds7 and provide hemodynamic information on local cerebral blood flow, demonstrate feeding arteries, nidi, and draining veins of cerebral AVMs within a scanning range of 32 mm. Dynamic CT examination of the whole brain will soon be possible with the use of 256 detector row CT scanners, which will make CT angiography the procedure of choice for evaluating every blood vessel in the body.7 Further refinements are also performed, such as bone-subtraction CT angiography, in which a nonenhanced scan is subtracted from the contrast-enhanced second scan to yield better resolution of vascular structures adjacent to bone.8
Advances are also being made to make CT a safer imaging modality. Radiation exposure related to CT is a major drawback. Although CT examinations comprise 15% of all radiologic examinations, CT is responsible for 70% of the total patient radiation dose, which introduces concerns on increased cancer risk, especially in children and young adults.9 Radiation dose-limiting paradigms such as “as low as reasonably allowable-ALARA” are more strictly implemented. Radiation dose delivered to the patient during a CT examination depends on scanning parameters such as x-ray tube current, tube rotation time, peak voltage, pitch, and x-ray collimation. Lowering any of these parameters results in decreased patient radiation dose, however, at the cost of increased noise and image quality. It is suggested that the ordering physician should primarily decide on the quality expected from the examination to yield satisfactory clinical information and guide the dose reduction. Similarly, dose modulation strategies are used to modify the x-ray tube current according to the patient’s thickness or attenuation, to match a preset reference image quality and noise level. The reference quality is determined according to the need, for example, reconstruction of thin slices is used during screening for small aneurysms, while thick scanning and thin reconstruction is used for evaluating the spine. Newer, multiplanar reconstruction techniques have eliminated the need for scanning in different planes, further decreasing patient radiation exposure. In addition, a few simple actions may also help further decrease the dose: repeat CT examinations for high-density lesions (such as hematomas) or for studies in which resolution is not a primary concern (e.g., perfusion CT) can be performed with low-dose settings. Unnecessary repeat examinations can be avoided, and lastly, scanning of the lens and the cornea can be avoided in repeat examinations.
CT IMAGING FEATURES OF MENINGIOMAS
Routine CT examination of an intracranial meningioma will assess the tumor location and extent; evaluate tumor margins; characterize the tumor; and determine the presence of any mass effect, edema, or brain herniations.10,11 A summary of common CT features is provided in Table 13-1. However, meningiomas are common tumors with variable appearances, so that specific consideration is warranted for each finding.
| Criterion | Common findings |
|---|---|
| Location and extent |
Location and Extent
Meningiomas are extra-axial tumors, and the demonstration of this extra-axial origin is important for the diagnosis. In cases where the tumor attaches with a broad base to the dura or bone, the extra-axial origin is quite evident on CT examination. In certain cases, however, where the dural attachment is narrow it may not be easily demonstrated on CT.12 Two other CT findings that support the extra-axial localization are cerebrospinal fluid (CSF) clefts, surrounding or partially neighboring the tumor mass, and buckling of the cortex.12,13 CSF clefts appear as curvilinear hypodensities and form as a result of meningeal adhesions and tumor compression11 (Fig. 13-1A). This sign may not be evident on CT if the tumor has caused much mass effect. Buckling of the cortex, which denotes distortion and folding of the cortex and effacement of the sulcus under compression, is another finding common to extra-axial tumors14 (Fig. 13-1A, B).
Most common intracranial localizations for meningiomas, in decreasing order, are hemispheric convexity, parasagittal/falcine, sphenoid wing, olfactory groove, suprasellar and tuberculum sella, posterior fossa, cerebellar convexity, tentorium, cerebellopontine angle, foramen magnum, and intraventricular.10 The majority of these meningiomas are single. Multiple meningiomas may be encountered sporadically or as a manifestation of neurofibromatosis or meningiomatosis. Multiplicity is encountered in 10% of sporadic cases.15 Multiple meningiomas are encountered in 4.2% of neurofibromatosis type II patients.16–18 Multiplicity is common in families with a hereditary predisposition to meningiomas.18 Seldom, meningiomas can coexist with other intracranial tumors or even more rarely, intracranial meningiomas can be the site for metastasis of systemic cancer.
Tumor Shape and Margins
Most meningiomas are single, globoid (Fig. 13-2A) or lobulated tumors (Fig. 13-2B). The margins of the tumor are most commonly smooth and well circumscribed. Brain invasion may be seen in malignant meningiomas; however, most atypical and malignant meningiomas are sharply delineated from surrounding tissues.10,12 As described previously, CSF clefts may be seen around meningiomas.11 The shape may be influenced by surrounding anatomic structures (Fig. 13-2C). Multilobular meningiomas may also be encountered. “Mushrooming” is defined as the appearance of irregular, indistinct margins or finger-like extensions from the surface (Fig. 13-2D). Some authors have associated this finding with potentially malignant behavior.19 However, mushrooming may also be seen in a significant proportion of benign meningiomas. As demonstrated by this example, benign and malignant meningiomas can have very similar CT imaging findings. Malignant meningiomas may also have sharp, well demarcated margins and very little or no peritumoral edema. Therefore benign and malignant meningiomas cannot be differentiated based on CT findings alone.12
En plaque meningiomas, which are less common, grow flat along the dura like a carpet (Fig. 13-2E). A lucent line between the bone and the calcified en plaque meningioma corresponds to the dura (Fig. 13-2F) and is considered a specific sign for meningioma by some authors.20 En plaque meningiomas have a higher incidence of hyperostosis on CT.20
Density
On nonenhanced CT scans, 54% to 75% of meningiomas appear as homogeneous masses that are hyperdense compared to the adjacent brain cortex10,12,16 (Fig. 13-3A). Up to 25% appear isodense. Small isodense meningiomas may be overlooked on CT if they have no associated brain edema (Fig. 13-3B). Homogeneously hypodense meningiomas are quite uncommon and comprise 1% to 5% of all meningiomas.10,16 Hyperdensity can be attributed to hypervascularity, hypercellularity, reduced water content, or calcifications.2,16,21 Dense and widespread calcifications or acute hemorrhage will present as focal areas of marked hyperdensity.22 Gross hemorrhage within the tumor is rare in meningiomas. The density of acute hemorrhage is higher than that of the tumor but lower than that of calcifications (Fig. 13-3C). Follow-up CT scans will reveal decreasing density of the hemorrhage, which will finally become hypodense in 3 to 4 weeks. Large calcifications, cysts, necrosis, or hemorrhage can cause inhomogeneity of CT images. Such focal hypodense, nonenhancing areas, representing cystic changes, old hemorrhage, or necrosis, are encountered in 5% to 23% of all cases1,12 (Fig. 13-3D). Coexistence of hemorrhage and necrosis is extremely rare. Although extremely rare, metastasis into meningiomas from systemic cancer can also be seen.23 Lipoblastic or xanthomatous variants of meningiomas are extremely rare and may appear markedly hypodense on CT.24
FIGURE 13-3 The typical meningioma appears hyperdense on nonenhanced CT images. The hyperdensity is easily appreciated if there is associated peritumoral edema (A). Small isodense meningiomas, on the other hand, may be missed in the absence of associated findings such as edema (B). Acute hemorrhage will appear denser than the parent mass (C) but less so than calcifications (see Fig. 13-4). Small areas of hypodensity in the meningioma may indicate cystic changes, old hemorrhage, or necrosis (D).
(Courtesy of Canan Erzan, MD, Marmara University School of Medicine, Istanbul, Turkey.)
