Chapter 24 Cost-Effectiveness of Neurostimulation


Introduction
Efficacy and safety have traditionally been the key evidentiary cornerstones for a new health technology to obtain market access. This evidence is a required part of the licensing of a new drug or medical device. However, over the last decade, with increasing pressure on health care budgets there has been a global trend for health care systems to also provide evidence of cost-effectiveness before they will reimburse or cover a new health care technology.1,2 Indeed, many countries have established agencies such as the National Institute for Health and Clinical Excellence (NICE) in the United Kingdom (UK), with a mandate to undertake economic evaluations of new and emerging treatments and thus determine if they represent good value for money for that health care jurisdiction. Although often focused on drugs, the consequence of economic evaluation for medical devices, and therefore neurostimulation, are even more potentially challenging given their high up-front cost.
Methods of Economic Evaluation
Economic evaluation is the “comparative analysis of [two or more] courses of action in terms of their costs and consequences”3 and is a tool to assist health care policy makers. A decision maker can then decide whether the intervention is worth paying for by comparing its benefits with the benefits foregone (so-called opportunity cost), in paying for it. Or, to put it another way, given that budgets are finite, economic evaluation seeks to maximize outcomes for the resources available (so-called economic efficiency).
Grounded in economic theory, utility measures reflect the preferences of groups of persons for particular treatment outcomes and disease states and combine many different health domains into a single number, weighting the different domains with the values people have for the particular health states. Utilities can be elicited directly, using the standard gamble or time trade-off (TTO) methods, or indirectly, using questionnaire-based measures (such as EuroQol [EQ-5D] or Health Utilities Index [HUI] for which population preference weights have previously been obtained). Indirect preference measurement techniques obtain utilities using questionnaires to elicit individuals’ valuations of multiple attributes, or domains, of their quality of life (e.g., mobility, emotional well-being, and cognitive ability); responses are then converted into utility values using preestablished formulas. An example of the utility of a male patient age 65 years with diabetic neuropathic pain based on completion of the EQ-5D is shown in Box 24-1. The utility index of 0.228 is contrast to an age-sex matched score of 0.78 for an otherwise healthy member of the UK population.4
Box 24-1 Hypothetical EQ-5D Scoring for a 65-year-old Male with Diabetic Neuropathy
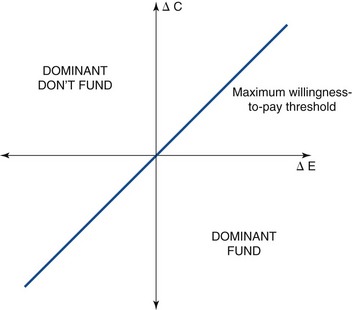
The result of an economic evaluation is a total cost and total outcome of each of the alternative strategies. However, the results are often presented as an incremental cost-effectiveness ratio (ICER), a summary statistic defined as ΔC/ΔE, where ΔC is the incremental cost (i.e., the difference in costs) and ΔE is the incremental effectiveness (i.e., the difference in health outcomes) in the comparison of a strategy of interest vs. a baseline, or reference, strategy (Fig. 24-1). When one strategy produces greater health outcomes than another but at greater cost, threshold (or trade-off) ratios, or societal willingness-to-pay cut-off points, are used to arrive at a choice among strategies. This threshold may differ among countries (e.g., in the United States it is often quoted as $50,000/QALY,5 and in the UK it is £20,000 to £30,000/QALY).6
Guidelines for Conducting Economic Evaluation
A number of international guidelines for conducting economic evaluations have been published, notably Drummond and associates,3 the U.S. Panel on Cost-Effectiveness in Health and Medicine,7 and NICE Technology Appraisal Guidance.8
A number of steps are needed to carry out an economic evaluation (Box 24-2). The first is to define the question. It is critical to define exactly what is being compared with what, who the patients are, and what treatments each group is receiving. For example, is the neurostimulatory device to be applied to patients who are otherwise refractory to drug treatment and is the device regarded as an add-on therapy rather than a specific replacement for a current therapy? The scope is equally important. At whose costs are we looking? At whose outcomes? The ideal scope is that of society, meaning that costs incurred by the health service, patients, social services, voluntary sector and all others are included in the analysis. In practice it is often very difficult to estimate some of these; thus analyses are frequently restricted to a health care perspective.


Cost-Effectiveness of Spinal Cord Stimulation
Over the last 20 years a number publications have included some consideration of the costs of SCS. This economic literature has been the subject to three systematic reviews.9–11 The literature searches undertaken by these previous reviews across a range of databases (Medline, CINAHL, EMBASE, CDSR, DARE, CENTRAL, NHS EED and HTA) were updated (to March 2010) for the purposes of this article. From these searches, five studies that were full economic evaluations of SCS were identified. Two additional economic evaluations currently in publication were also included. The characteristics of these seven studies are summarized in see Table 24-1.12–18
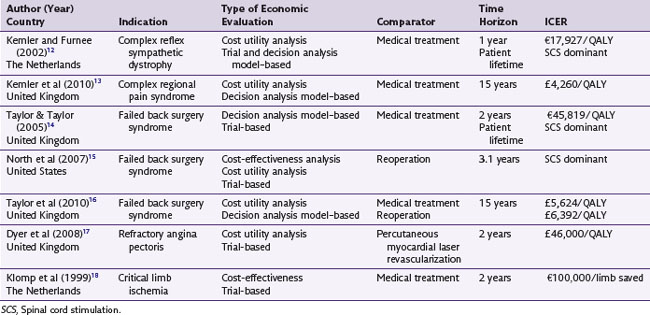
The studies were undertaken in a variety of patient groups that included failed back surgery syndrome (FBSS), complex regional pain syndrome (CRPS), refractory angina, and chronic limb ischemia. All studies involved a comparison of costs and outcomes of SCS to usual care, the choice of usual care depending on the medical indication being studied (e.g., analgesia management or spinal reoperation for FBSS and percutaneous myocardial laser revascularization for refractory angina). Studies undertook an analysis of costs and outcomes collected within the trial time horizon (trial-based analysis) or were based on decision analytic modeling to extrapolate beyond the trial data. It is very rare for a single trial to measure all necessary costs and outcomes relevant to decision making; therefore modeling techniques are often used to combine data from different sources (e.g., costs from an observational study and long-term intervention outcomes from a registry) and to project likely future values to arrive at a total cost and consequence from each strategy. Commonly used approaches include decision trees and Markov models.19 For example, the economic evaluation by Taylor and Taylor14 used modeling to derive an indirect comparison of SCS vs. medical therapy (from two trials, one comparing SCS vs. reoperation and the other comparing reoperation vs. medical therapy), to convert pain relief into quality of life (utility) and, using observational data on the long-term impact of SCS, to extrapolate 6-month trial data over the patient’s lifetime.
The ICERs of these studies generally show that SCS is cost-effective treatment for FBSS and CRPS (i.e., SCS is either less costly and more effective than the comparative therapy, or SCS has an ICER of less than a maximal willing threshold of £30,000/QALY). Based on these analyses, NICE in 2009 recommended to the UK National Health Service that SCS be made available routinely to selected patients with FBSS and CRPS20:
However, the evidence suggested that the cost-effectiveness of SCS for refractory angina and chronic limb ischemia to be less attractive. The ICER for refractory angina is in excess of the £30,000/QALY threshold. The analysis of SCS for critical limb ischemia demonstrates the disadvantage of using CEA: is  saved good value for money? Given this evidence NICE concluded20:
The last stage in an economic evaluation is sensitivity analysis. These “what if” analyses test the robustness of the evaluation and thus the degree of confidence that can be placed in the results. The importance of such analysis is illustrated by the following statement from the Dyer and associates’ study assessing the cost-effectiveness of SCS for refractory angina17:
In other words, after a period of clinical learning and familiarity, SCS was a potentially cost-effective therapy (i.e., <£23,000/QALY).
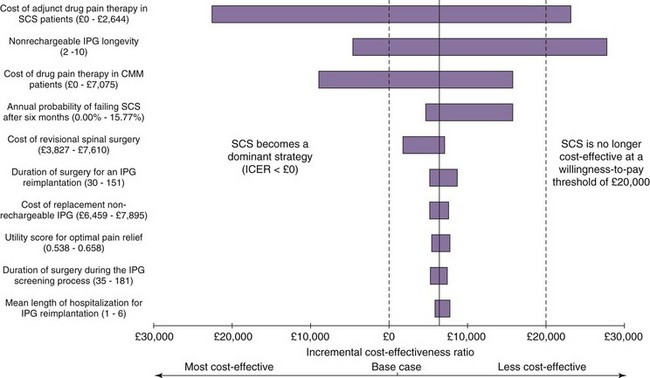
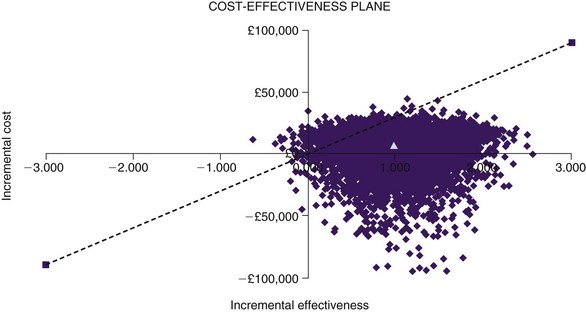
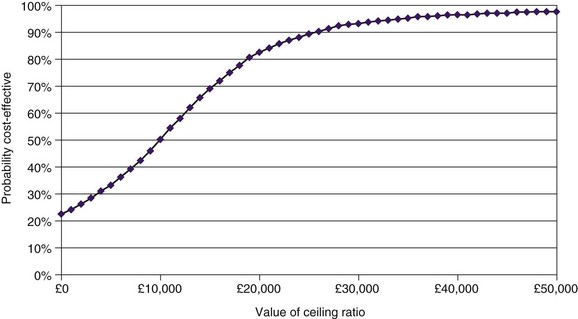
One-way sensitivity analysis has traditionally been used to assess uncertainty in economic evaluations, one variable at a time being changed through a range of values. The resulting set of ICERs is then examined to assess the influence of this variable. Fig. 24-2 shows the one-way sensitivity analyses for SCS compared to medical therapy for FBSS. For example, although the implantable pulse generator (IPG) longevity was assumed to be 4 years in the base case analysis (shown in fifth row of Table 24-1), across a range of plausible range of IPG longevities the cost-effectiveness of SCS could range from being dominant to medical therapy (assuming an IPG longevity as long as 10 years) to be being dominated by medical therapy (assuming an IPG longevity of only 2 years). However, recent methodological advances have motivated the gradual adoption of more sophisticated approaches to measuring and reporting uncertainty in CEA. In probabilistic sensitivity analysis, all model parameters are varied simultaneously over a large number of draws, or simulated trials called Monte Carlo simulations.21 The incremental cost and QALY values arising from 1000 Monte Carlo simulations are shown a cost-effectiveness quadrant in Fig. 24-3. That the majority of these simulations lie in the Southeast and lower part of the Northeast quadrants below the £30,000/QALY is evidence that SCS is cost-effective in this case. The cost-effectiveness acceptability curve (CEAC) shows the probability of a health technology being cost-effective over a range of maximum willingness-to-pay thresholds.22 As shown in Fig. 24-4, taking into account all parameter uncertainty, there is a 93% probability that SCS (compared to medical therapy for FBSS) is cost effective at £30,000/QALY.
1 Taylor RS, et al. Inclusion of cost effectiveness in licensing requirements of new drugs: the fourth hurdle. Br Med J. 2004;23:972-975.
2 Detsky AS, Laupacis A. Relevance of cost-effectiveness analysis to clinicians and policy makers. JAMA. 2007;298:221-224.
3 Drummond MF, et al. Methods for the economic evaluation of health care programmes. Oxford: Oxford University Press; 2005.
4 Kind P, Hardman G, Macran S. UK population norms for the EQ-5D. The University of York Centre for Health Economics, Discussion paper 172, November 1999. Accessed March 1, 2010 from http://www.york.ac.uk/inst/che/pdf/DP172.pdf
5 Neumann PJ, Greenberg D. Is The United States ready For QALYs? Health Affairs. 2009;28:1366-1371.
6 Rawlins MD, Culyer AJ. National Institute for Clinical Excellence and its value judgments. Br Med J. 2004;329:224-227.
7 Siegel JE, et al. Recommendations for reporting cost-effectiveness analyses: Panel on Cost-Effectiveness in Health and Medicine. JAMA. 1996;276:1339-1341.
8 NICE. Guide to the methods of technology appraisal. London: National Institute for Health and Clinical Excellence; 2008. Accessed September 30, 2009, from http://www.nice.org.uk/media/B52/A7/TAMethodsGuideUpdatedJune2008.pdf
9 Taylor RS, et al. The cost-effectiveness of spinal cord stimulation in the treatment of pain: a systematic review of the literature. J Pain Symptom Manage. 2004;27:370-378.
10 Simpson EL, et al. Spinal cord stimulation for chronic pain of neuropathic or ischaemic origin: systematic review and economic evaluation. Health Technol Assess. 2009;13(17):iii. ix-x, 1-154
11 Bala MM, et al. Systematic review of the (cost-)effectiveness of spinal cord stimulation for people with failed back surgery syndrome. Clin J Pain. 2008;24:741-756.
12 Kemler MA, Furnée CA. Economic evaluation of spinal cord stimulation for chronic reflex sympathetic dystrophy. Neurology. 2002;59:1203-1209.
13 Kemler MA, et al. The cost-effectiveness of spinal cord stimulation for complex regional pain syndrome. Value in Health. 2010. (in press)
14 Taylor RJ, Taylor RS. Spinal cord stimulation for failed back surgery syndrome: a decision-analytic model and cost-effectiveness analysis. Int J Technol Assess Health Care. 2005;21:351-358.
15 North RB, et al. Spinal cord stimulation versus reoperation for failed back surgery syndrome: a cost-effectiveness and cost utility analysis based on a randomized controlled trial. Neurosurgery. 2007;61:361-368.
16 Taylor RS, et al. The cost-effectiveness of spinal cord stimulation in the treatment of failed back surgery syndrome. Clin J Pain. 2010;26:463-469.
17 Dyer MT, et al. Clinical and cost-effectiveness analysis of an open label, single-centre, randomised trial of spinal cord stimulation (SCS) versus percutaneous myocardial laser revascularisation (PMR) in patients with refractory angina pectoris: The SPiRiT trial. Trials. 2008;9:40-45.
18 Klomp HM, et al. Spinal cord stimulation is not cost-effective for non-surgical management of critical limb ischaemia. Eur J Vasc Endovasc Surg. 1995;10:478-485.
19 Sonnerberg FA, Beck JB. Markov models in medical decision making: a practical guide. Med Decis Making. 1993;13:322-339.
20 NICE. Spinal cord stimulation for chronic pain of neuropathic or ischaemic origin. London: National Institute for Health and Clinical Excellence; 2008. Accessed September 30, 2009, from http://www.nice.org.uk/Guidance/TA159
21 Briggs AH. Handling uncertainty in cost-effectiveness models. Pharmacoeconomics. 2000;17:479-500.
22 Fenwick E, Claxton K, Sculpher M. Representing uncertainty: the role of cost-effectiveness acceptability curves. Health Econ. 2001;10:779-787.


