Chapter 14 Coronary Artery Disease Detection
Exercise Stress SPECT
INTRODUCTION
In the United States alone, more than 7.7 million patients are referred yearly for diagnostic cardiac stress testing with radionuclide imaging. Although patients may require pharmacologic stress testing because they are unable to perform adequate physical exercise, dynamic exercise on treadmill or bicycle remains the preferred stress modality. In our nuclear stress laboratory, the percentage of myocardial perfusion studies performed with exercise has remained approximately 50% since 2004. Exercise variables, including maximal workload, duration, hemodynamic response, exercise-induced symptoms, and electrocardiographic (ECG) changes provide invaluable additional information for assessing a patient’s prognosis that are not available with pharmacologic stress. The Duke exercise treadmill score incorporates some of these important exercise variables and allows for risk stratification.1 However, because of the inherent diagnostic limitations of the exercise ECG and subjective symptoms, patients stratified by the Duke Treadmill Score can be further stratified on the basis of (semi)quantitative stress radionuclide myocardial perfusion imaging (MPI).2
PHYSIOLOGY OF EXERCISE STRESS TESTING
Dynamic exercise increases the metabolic demand of the exercising skeletal muscle which can be met only by increasing the blood flow to the exercising muscle. Under conditions of maximal exertion, the cardiac output may increase more than fourfold to meet this need.3 As shown in Figure 14-1, at low levels of exercise, the increase in cardiac output is due to an increase in both stroke volume and heart rate. However, as the intensity of exercise increases, the contribution of the stroke volume to cardiac output reaches a plateau, and the augmentation of cardiac output becomes primarily dependent on the ability to increase the heart rate further. Of note, the inability to appropriately increase the heart rate in response to exercise predicts severity of coronary artery disease (CAD) and mortality.4,5 The increase in cardiac output results in a greater myocardial metabolic demand, inducing coronary vasodilation. A recent positron emission tomography (PET) study in human subjects quantifying the change in myocardial perfusion with exercise demonstrated that myocardial blood flow can increase more than fourfold to meet the metabolic demands of the heart during exercise.6
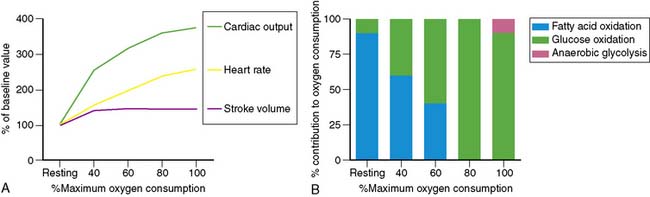
Metabolic changes occur in association with these hemodynamic adaptations. Specifically, in exercising skeletal muscles, there is a decreasing dependence on fatty acid oxidation and an increasing dependence on glucose oxidation to meet the energy needs until maximum oxygen consumption is achieved. At that point, glucose is the exclusive oxidative substrate. Further increases in the level of exercise above the anaerobic threshold cause the release of lactate from exercising skeletal muscle. Interestingly and in contrast, with increasing exercise, the myocardium continues to oxidize both fatty acids and glucose and also increases the utilization of lactate produced by the exercising skeletal muscle for energy (see Fig. 14-1).
EXERCISE PROTOCOLS
In the United States, most exercise tests are performed using a motorized treadmill and graded Bruce, modified Bruce, or Naughton protocols. In many other countries, the upright bicycle is the preferred exercise equipment. An important aspect of diagnostic exercise protocols is the gradual, linear increase in workload from a very low level to the maximally tolerated workload. This gradual increase in workload is of importance, since the purpose of physical exercise testing is to reproduce symptoms, and one can generally not predict at which workload symptoms will occur. It is therefore important to also evaluate the patient carefully prior to starting a stress test to determine if the patient is appropriate for exercise stress testing (Table 14-1). Exercise protocols are generally terminated because of the onset of symptoms or fatigue, but they may also be terminated because of the development of significant ECG changes or because the patient becomes hypotensive or develops pulmonary edema. Termination of exercise solely because the predicted target heart rate (85% of age-predicted max) was achieved is a commonly made mistake. Many elderly patients, for example, are capable of achieving a considerably higher heart rate and workload at which symptoms may be unmasked.
| Absolute Contraindications | Relative Contraindications |
|---|---|
| Acute myocardial infarction | Aortic stenosis |
| Unstable angina | Suspected left main equivalent |
| Acute myocarditis or pericarditis | Severe hypertension (>240/130) |
| Ongoing ventricular or atrial tachyarrhythmias | Severe outflow tract obstruction |
| Second- or third-degree heart block | Left bundle branch block |
| Known severe left main disease | |
| Decompensated heart failure | |
| Acutely ill patients | |
| Patients unable to exercise due to neurologic or musculoskeletal limitations |
PREPARATION FOR EXERCISE
Patients should be instructed to wear comfortable clothing and shoes and be in a fasted state on the morning of the exercise test. Moreover, it is prudent to instruct all patients scheduled for stress testing not to consume any caffeine-containing beverages or food on the morning of testing. The reason for this is that it is not uncommon that a patient is not able to perform adequate exercise. If the patient has not consumed caffeine-containing items, it is easy to switch to pharmacologic stress and ensure a diagnostic test result without having to reschedule the patient. On the other hand, a recent study suggested that a small amount of caffeine does not significantly affect the presence and magnitude of perfusion abnormalities. Although it appears prudent to continue to recommend that patients abstain from caffeine usage prior to the test, consumption of a single cup of coffee may not be a valid reason for cancellation of a vasodilator stress test.7
BASIS OF STRESS IMAGING
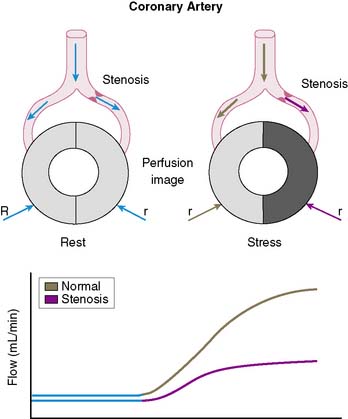
The conceptual underpinning of radionuclide imaging is the visualization of heterogeneity of regional myocardial blood flow secondary to impaired regional coronary flow reserve downstream of coronary arteries with significant obstructive disease (Fig. 14-2).
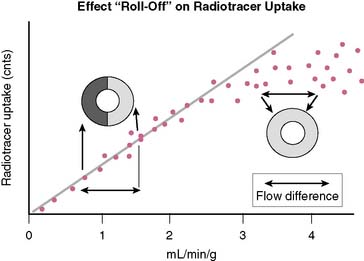
In order to visualize such heterogeneity of blood flow reliably, a linear relationship must exist between regional myocardial blood flow and regional myocardial uptake of a radiotracer.8 Although in general this is true for relatively low flow ranges (up to 1 mL/min/g), as is present under resting conditions and resting myocardial ischemia, at the higher flow ranges (>2 mL/min/g) achieved during stress, especially during vasodilator stress, regional myocardial radiotracer uptake may no longer be linear. At higher rates of blood flow, the uptake of many radiotracers presently used in clinical imaging demonstrates a plateau (Fig. 14-3) known as the roll-off phenomenon.
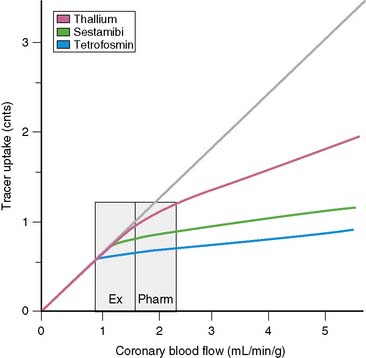
The suboptimal linearity at higher flow ranges is caused by the limited first-pass extraction fraction of many single-photon radiopharmaceuticals used for MPI. Table 14-2 shows the myocardial extraction fractions of commonly used radiotracers. In addition to myocardial extraction fraction, mechanisms involved in the transmembrane transport and myocardial washout and wash-in affect net myocardial uptake of radiopharmaceuticals. Fortunately this roll-off phenomenon does not significantly affect the ability to identify patients with high-degree (>70%) coronary stenoses. However, in patients with relatively mild CAD, the roll-off phenomenon may potentially result in falsely normal images (Fig. 14-4).
Table 14-2 First-Pass Myocardial Extraction Fraction of Various Radiopharmaceuticals
| Thallium-201 | 82%–88% |
| Technetium (99mTc) sestamibi | 55%–68% |
| 99mTc tetrofosmin | 54% |
| 99mTc teboroxime | >90% |
| 99mTc NOET | 75%–85% |
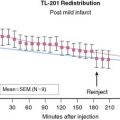
Thallium (201Tl), a potassium analog, has a relatively high initial extraction fraction and good linearity to flow. After intravenous administration, continuous washout and wash-in occurs in the myocardium, resulting in Tl-201 myocardial redistribution. Technetium (99mTc)-labeled agents, such as sestamibi and tetrofosmin, are lipophilic compounds that have lower first-pass extraction fractions than 201Tl and bind to mitochondrial membranes in a stable manner based on the mitochondrial membrane potential, and demonstrate minimal washout. Consequently the ultimate net retention of 201Tl-labeled and 99mTc-labeled agents in the myocardium is similar.9
INJECTION OF RADIOTRACER
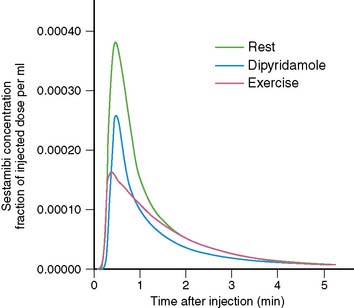
The timing of injection of radiotracer relative to peak exercise and termination of exercise is an important and often not well-appreciated aspect of stress testing. Because the first-pass extraction of the radiotracers is not 100%, myocardial uptake of a radiotracer is not instantaneous at the moment of injection. After injection during stress, the injected bolus reaches the central circulation in about 10 to 15 seconds, and first-pass myocardial extraction takes place. After the initial first transit, recirculation occurs with a rapidly decreasing blood concentration of radiotracer. On average, it takes about 1.5 to 2 minutes for blood radioactivity to decrease to 50% of maximum (Fig. 14-5). This may differ among patients, depending on the level of exercise effort. Furthermore, blood clearance curves are different for various radiotracers (e.g., slightly faster for 99mTc-labeled agents than for 201Tl). The timing of radioisotope injection is based on the fact that it is important to have most of the dose accumulate in the myocardium under conditions in which the heterogeneity of blood flow is maximal, that is, at peak exercise. Termination of exercise at about 1 minute after injection, as is frequently done in clinical practice, may be too early. A substantial amount of radiotracer may still be recirculating at that time. Therefore, it is advisable to encourage patients to continue exercising for at least 2 minutes after injection of radiotracer.
IMAGING PROTOCOLS
Reliable interpretation of stress myocardial perfusion images depends for a large part on optimal quality images. Consistently good quality can be ensured by following image acquisition guidelines published by the American Society of Nuclear Cardiology.10
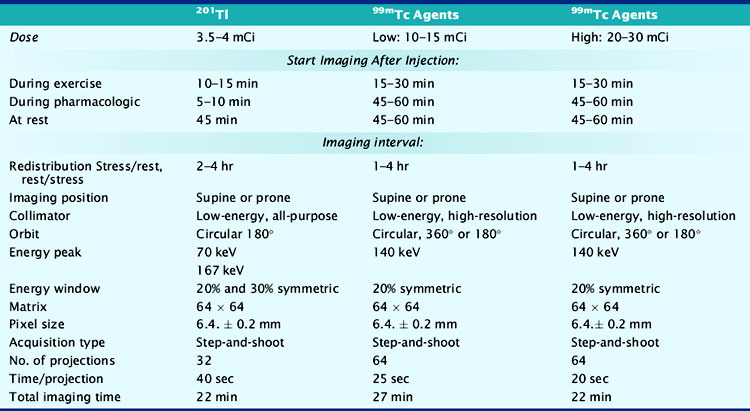
At present, four image-acquisition protocols are most commonly used: the 1-day or 2-day rest-exercise 99mTc-agent imaging protocol, the exercise-redistribution Tl-201 imaging protocol, and the rest/exercise dual-isotope imaging protocol. Numerous studies have shown that each of these protocols yields equivalent clinical results for detection of CAD and for risk stratification. If many patients referred to an imaging facility are overweight (body mass index > 30 kg/m2), 99mTc-labeled agents and 2-day imaging protocols may be preferred. The most frequently used imaging protocols for 201Tl and 99mTc-labeled agents are schematically shown in Figure 14-6A-D. Technical details of imaging are tabulated in Table 14-3.
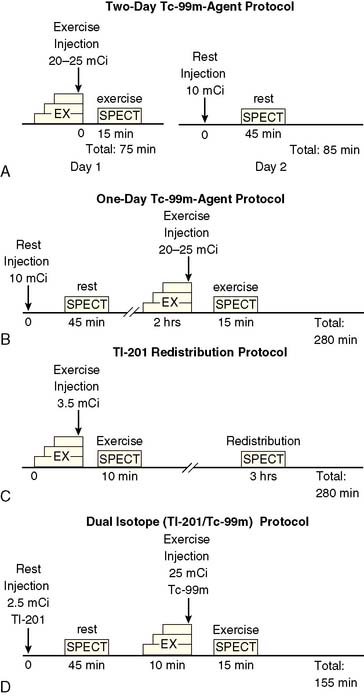
Table 14-3 Summary of Typical Acquisition Parameters for SPECT Myocardial Perfusion Imaging with 201Tl and 99mTc-Labeled Imaging Agents
Increasing attention is being paid to the radiation exposure associated with imaging procedures, including myocardial perfusion studies. The exposure and the biological effect of radiation, generally assessed in terms of the effective dose, is dependent not only on the absolute amount of radioactivity that is injected but also the quality of the radiation that is emitted, which is the same for the gamma-photon emitting radionuclides used in single-photon emission computed tomography (SPECT) MPI, the half-life of the agent, and the sensitivities of specific organs to the radiation. Based on these factors, the lowest effective dose is achieved with 99mTc-labeled agents used in a 1-day stress/rest protocol, whereas the highest effective dose is achieved with a dual-isotope protocol (Table 14-4).11 In patients with low to intermediate pretest likelihood of CAD, normal exercise parameters, and normal MPI, it may be possible to perform only stress imaging, thereby reducing the radiation exposure.
Table 14-4 Estimated Effective Doses for Various Myocardial Perfusion Imaging Protocols
| Protocol | Effective Dose (mSv) |
|---|---|
| Thallium stress/redistribution | 22.0 |
| One-day stress/rest 99mTc sestamibi | 11.3 |
| Two-day stress/rest 99mTc sestamibi | 15.7 |
| One-day stress/rest 99mTc tetrofosmin | 9.3 |
| Two-day stress/rest 99mTc tetrofosmin | 12.8 |
Based on data from Einstein AJ, Moser KW, Thompson RC, et al: Radiation dose to patients from cardiac diagnostic imaging. Circulation 116:1290–1305, 2007.
DIAGNOSTIC VALUE OF EXERCISE SPECT IMAGING
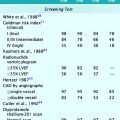
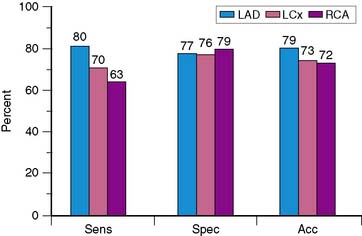
Because of the proven prognostic value of stress MPI, it is unlikely that angiographic correlation and sensitivity and specificity will continue to be assessed in large numbers of patients using state-of-the-art technology, other than for local quality assurance purposes or to evaluate new technical advances such as attenuation-correction devices. The sensitivity, specificity, and normalcy values for exercise SPECT MPI have been evaluated in multiple studies and confirm the diagnostic power of this modality.12–24 Based on a meta-analysis of 79 studies that included a total of 8964 patients, the sensitivity, specificity, and normalcy rate of SPECT MPI are 86%, 74%, and 89%, respectively.25,26 Figure 14-7 shows representative data for the diagnostic yield for identifying disease in individual coronary arteries.27 Sensitivity for recognizing disease in the left anterior descending coronary artery is higher than that for disease in the right coronary artery or left circumflex coronary artery, with no significant difference in accuracy. The relatively low specificity of SPECT imaging suggests that artifacts due to attenuation and motion are not always recognized. Referral bias has been proposed as another potential explanation for the limited specificity of SPECT imaging.
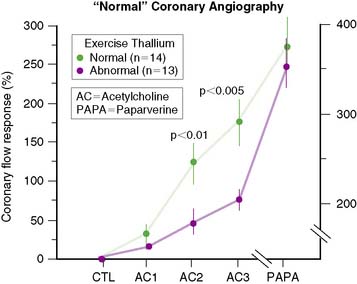
Through the years, it has also become clear that complete agreement with coronary angiography is an elusive goal, because stress perfusion imaging and coronary angiography evaluate two different aspects of CAD. Whereas contrast coronary angiography visualizes coronary anatomy and the presence or absence of regional coronary luminal narrowings, radionuclide stress MPI provides noninvasive information about the pathophysiologic consequences of coronary atherosclerosis. Specifically, patients with apparently significant angiographic CAD but normal exercise myocardial perfusion images nevertheless have a favorable prognosis.28 In contrast, patients with relatively mild angiographic CAD but markedly abnormal SPECT images have a less favorable outcome. One study29 demonstrated that in patients with apparently “false-positive” 201Tl images and “normal” epicardial coronary arteries, coronary blood flow response to acetylcholine infusion was blunted, indicating endothelial dysfunction (Fig. 14-8). This suggests that “false-positive” images probably were true positives. A better measure of the true specificity of stress MPI is the assessment of normalcy rate in subjects with low (<3%) likelihood of CAD. In our own laboratory, the normalcy rate of 99mTc sestamibi SPECT was 99% using quantitative analysis of exercise myocardial perfusion SPECT images acquired in 40 normal subjects.
ECG-GATED SPECT
Evaluating the left ventricular ejection fraction (LVEF) is important in any cardiac patient. Currently, more than 80% of all SPECT studies are acquired with ECG gating. Gated SPECT provides a means of assessing postexercise resting LVEF, as well as regional wall motion and wall thickening. The routine assessment of LVEF by ECG-gated SPECT has added an important dimension to the overall assessment of patients referred for exercise testing and MPI.30 Although the appearance of motion and the change in count density on cine display of ECG-gated SPECT myocardial perfusion studies is in fact artifactual and caused by improved count recovery during the cardiac cycle due to diminishing partial volume effect, a linear relationship exists with myocardial thickening.31
Assessment of LVEF, either normal or abnormal, in a patient with exercise-induced ischemia has important clinical and management consequences.32,33 Furthermore, it is not rare that a patient is diagnosed as having a previously unknown cardiomyopathy on the basis of the information from a gated SPECT. In some patients, postexercise LVEF may be significantly lower than LVEF on rest SPECT imaging.34 This may indicate postexercise ischemic stunning, which is a marker signifying severe CAD, although the specificity of this finding reflecting stunning may be limited in the setting of a large reversible defect.35
Visual assessment of regional myocardial thickening on gated SPECT has also improved the diagnostic yield of exercise MPI by improving identification of attenuation artifacts and thereby increasing the certainty of the image interpretation. Specifically, the inspection of gated SPECT images has been shown to decrease the number of “borderline” interpretations by 68%, increasing the number of normal studies in patients with a low likelihood of CAD and increasing the detection of abnormal perfusion in patients with a known history of CAD.36
When nongated exercise thallium SPECT was compared to ECG-gated exercise sestamibi SPECT images in women, specificity improved from 67% to 92%, mainly because of better identification of breast attenuation.37 A fixed defect that shows normal wall thickening is most likely due to attenuation. Unfortunately, attenuation artifacts, either caused by breast or diaphragm, may be at times more severe on stress images than on rest images, mimicking myocardial ischemia. In this scenario, normal wall thickening is unhelpful in differentiating between the two possibilities. It is then necessary to consider other available clinical and exercise information to solve this conundrum. However, when a rest defect is more severe than a stress defect and regional wall thickening is normal, the defect in question is very likely artifactual.
It has been shown that the quality and accuracy of LVEF derived from ECG-gated SPECT studies are dependent on the amount of injected dose, stable heart rhythm, size of left ventricle, and the amount of gastrointestinal activity adjacent to the heart.38 Sixteen frames per R-R interval acquisition provide more accurate (~5% higher) LVEF than the traditionally used 8-frame acquisition.39 Although in many laboratories, both the rest and exercise studies are acquired in ECG-gated mode, gated SPECT acquisition is preferably applied to the higher dose study. Provided that a SPECT study has adequate count density, no gating problems due to arrhythmias, no intense adjacent gastrointestinal activity, and normal left ventricular size, LVEF quantification by gated SPECT is highly reproducible and accurate in most patients.40 Most software packages also provide end-diastolic and end-systolic volumes.41 These volume measurements generally demonstrate greater variation than that of LVEF. Normal values for gated SPECT LVEF are significantly lower in men than in women (median LVEF: 52% versus 56%), whereas normal end-diastolic volumes are larger in men than in women (median volume: 109 mL versus 79 mL). In addition to the assessment of global left ventricular function, which is an important diagnostic and prognostic variable in cardiac patients, evaluation of regional wall motion has become an extremely useful aid for identifying attenuation artifacts and thus has helped to improve specificity.37
MOTION CORRECTION
Technologists use a number of ways to ensure that patients remain immobile during image acquisition. Velcro straps are commonly used to immobilize a patient’s arms and body. Furthermore, technologists emphasize to patients the importance of lying still during image acquisition. Nevertheless, a substantial number of patients show motion during the acquisition. All vendors provide motion correction software. However, it is not always possible to correct appropriately for motion in all directions. Prevention is better than correction.42
STATE-OF-THE-ART MYOCARDIAL PERFUSION SPECT WITH ATTENUATION CORRECTION
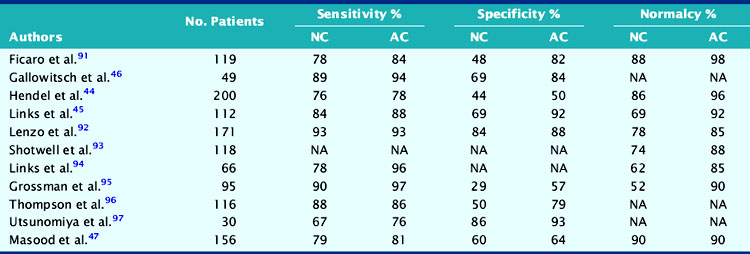
Recent clinical studies using non-uniform attenuation-correction devices (Table 14-5) show improved specificity and normalcy rate with preserved sensitivity compared to uncorrected studies.43–47 In one study, it was suggested that attenuation correction not only improves specificity but also enhances the identification of multivessel disease.48 In clinical practice, experienced interpreters are well capable of recognizing attenuation artifacts from indirect evidence and thus avoiding false-positive interpretations. However, it is of interest to note that the application of attenuation correction has been shown to improve the overall diagnostic performance of individual readers with different interpretive attitudes.47,49
Table 14-5 Comparative Diagnostic Results of Non-Attenuation-Corrected (NC) and Attenuation-Corrected (AC) SPECT Myocardial Perfusion Imaging
In clinical practice, the performance of attenuation correction devices has not been consistently successful, in part due to the accentuation of scatter from adjacent bowel activity or improper registration of CT and SPECT images.50 Although significant progress has been made, further development of scatter correction algorithms is necessary. It is important that rigorous and practical criteria for quality assurance of attenuation maps and their registration with the SPECT images be developed to improve the reliability of attenuation correction in every patient.
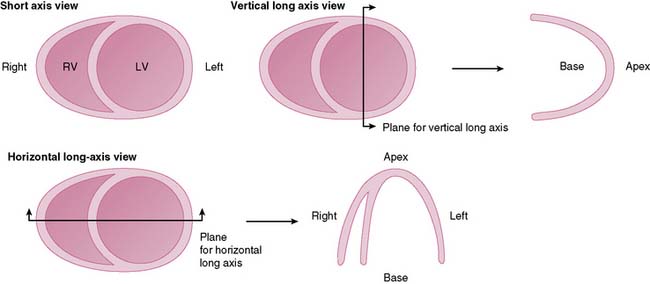
DISPLAY OF EXERCISE SPECT IMAGES
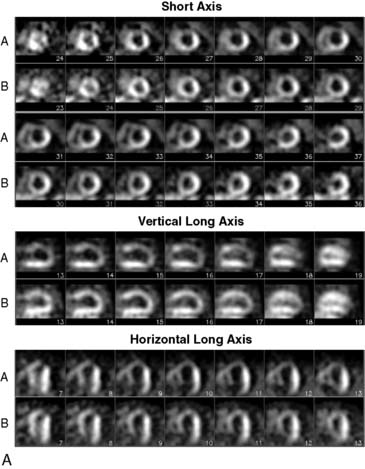
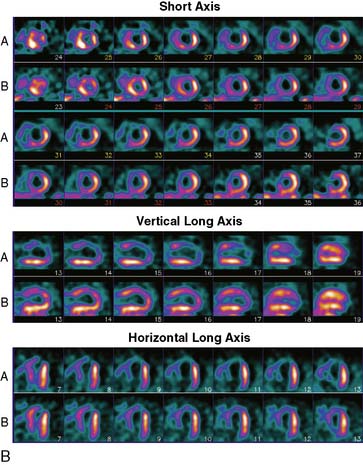
Tomographic reconstruction of the heart generates a multitude of images. To simplify image interpretation, the display of SPECT images has been standardized (Fig. 14-9).51 This is also important for communication and exchange of images between imaging facilities. Three sets of reconstructed tomographic slices are usually displayed for interpretation: short-axis slices, horizontal long-axis slices, and vertical long-axis slices (Fig. 14-10). Stress and rest (or delayed) images are displayed in two rows (stress on top and rest below) to facilitate comparison. The short-axis slices are displayed from apex (upper left) to base (lower right), the vertical long-axis slices are displayed from septum (left) to lateral wall (right), and the horizontal long-axis slices are displayed from inferior wall (left) to anterior wall (right).
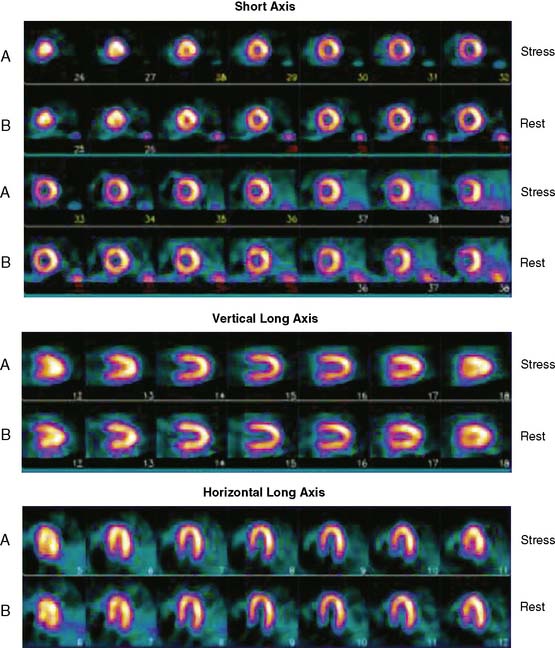
Figure 14-9 Standardized display of stress/rest SPECT images. Representative normal exercise stress and rest SPECT images. The reconstructed short-axis slices (top four rows), vertical long-axis slices (rows 5 and 6), horizontal long-axis slices (rows 7 and 8) shown are displayed according to the format explained in Figure 14-7.
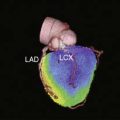
To simplify and standardize interpretation further, myocardial slices are divided into segments.51 The American Heart Association, the American College of Cardiology, and the American Society of Nuclear Cardiology adopted a 17-segment model for interpretation of nuclear, echocardiographic, and magnetic resonance images (Fig. 14-11).51,52 Each segment can be assigned to one of three coronary artery perfusion territories, as shown in the diagram in Figure 14-11. A detailed three-dimensional atlas of coronary anatomy territories for MPI has been developed based on extensive angiographic correlation (Fig. 14-12).53 Last, the nomenclature for each segment has been standardized as well (Fig. 14-13). The most important difference with the older nomenclature is that the term posterior is no longer used.
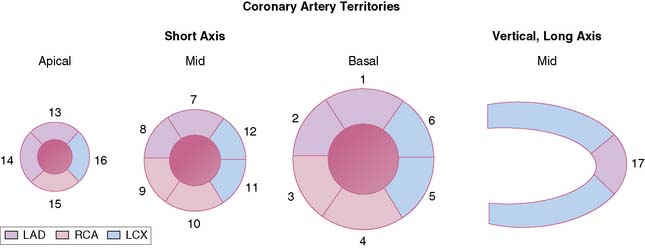
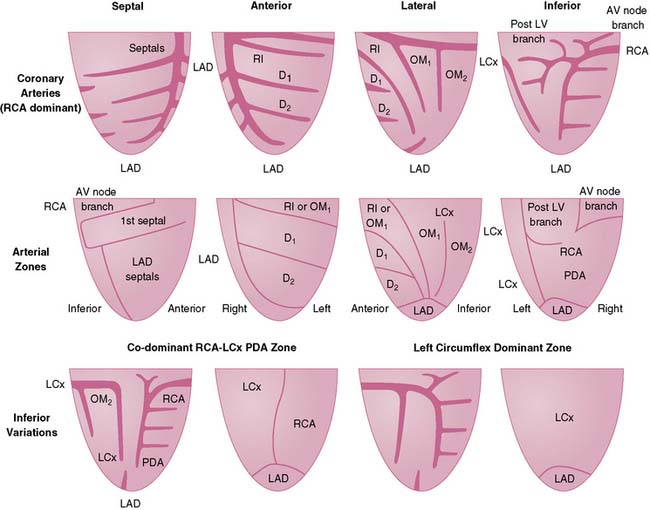
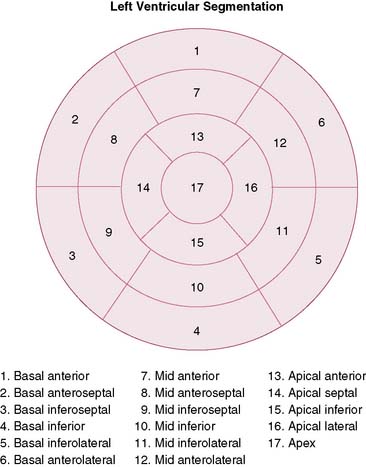
Figure 14-13 Standardized nomenclature of 17 segments. The display is the bull’s eye plot. The segmentation and numbers are the same as in Figure 14-8.
(Reproduced with permission from Cerqueira MD, Weissman NJ, Dilsizian V, et al: Standardized myocardial segmentation and nomenclature for tomographic imaging of the heart: A statement for healthcare professionals from the Cardiac Imaging Committee of the Council on Clinical Cardiology of the American Heart Association, J Nucl Cardiol 9:240–245, 2002.)
SEMIQUANTITATIVE VISUAL ANALYSIS AND QUANTITATIVE ANALYSIS OF MYOCARDIAL PERFUSION IMAGES
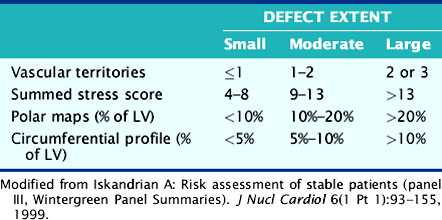
Myocardial perfusion images should not be interpreted simply in a binary fashion as either “normal” or “abnormal.” Myocardial perfusion abnormalities should be characterized according to the degree of decreased radiotracer uptake. A commonly employed scoring system uses a 4-point scale: 0 = normal; 1 = mildly reduced; 2 = moderately reduced; 3 = severely reduced; 4 = absent uptake.54 By applying this scoring system to each segment of the 17-segment model, to both the rest and stress images, a summed stress score, a summed rest score, and a summed difference score can be derived. These semiquantitative visual scores have been shown to provide important prognostic information.2 A normal image thus has a score of 0, whereas the maximal abnormal score is 68 (no heart visualized). A summed score of less than 8 is considered a small perfusion abnormality, 9 to 13 a moderate abnormality, and over 13 a large perfusion abnormality.
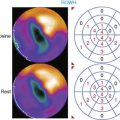
A purely visual assessment of SPECT images is subjective and may result in suboptimal reproducibility of the results. Therefore, an important complement to visual inspection of images is the quantitative evaluation of perceived perfusion defects, which is based on the inherently quantifiable nature of nuclear images. A number of validated software packages based on the concept of count profiles extracted from the emission tomographic images have been developed, and most are commercially available for quantification of myocardial perfusion and function (QPS-QGS; Emory Toolbox; 4D-MSPECT, and WLCQ). While evaluation of SPECT images using a quantitative program provides greater reproducibility than visual assessment,55 a recent comparative study showed that the performance of currently available software packages for quantification of myocardial perfusion differs significantly in their diagnostic performance and therefore cannot be used interchangeably.56
The basic quantitative approaches are similar for each of the programs: regional radiotracer uptake is quantitatively compared to normal databases, although each of the programs is based on slightly different models that are used to generate the quantitative profiles. Specific information about the various quantitative programs has been published in a recent review that will provide the reader with a greater understanding of the assumptions and modeling upon which the programs are based.57–61 The difference is largely in the display of data. Four of the programs display relative radiotracer uptake on SPECT images as polar plots or bull’s eyes. The fourth package, WLCQ, used routinely in our laboratory, involves the generation of circumferential count distribution profiles.62 Circumferential count profiles are generated for each of the short-axis slices and displayed with a curve representing the lower limit of normal myocardial count distribution. This provides a readily appreciable quantitative measure of the degree of abnormality of the patient’s image compared to normal image files. Table 14-6 compares various ways to categorize the extent of myocardial perfusion abnormalities.63
Table 14-6 Comparative Categorization of Extent of Exercise Myocardial Perfusion Abnormalities (Modified from Wintergreen Panel Summaries)
INTERPRETATION OF EXERCISE SPECT STUDIES
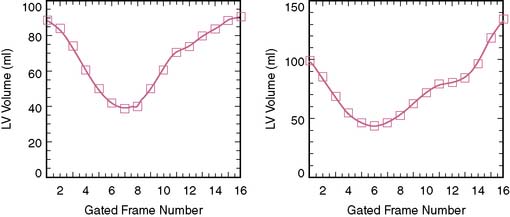
IMAGE INTERPRETATION
Care should always be taken in interpreting SPECT images as showing no perfusion abnormalities. SPECT imaging only reflects relative flow heterogeneity but offers no information about absolute flow. As a result, multivessel disease causing balanced ischemia may not be appreciated. It is therefore critical to evaluate all of the imaging and exercise data to identify any findings that might suggest the presence of diffuse ischemia.65 For example, the evaluation of function by gated SPECT can increase the identification of abnormal segments in patients with three-vessel disease by almost 50% compared to perfusion imaging alone.66 Furthermore, identification of transient ischemic dilation will increase the identification of high-risk patients with left main disease from 56% to 83%.67
Defect. A defect represents a localized myocardial area with a relative decrease in radiotracer uptake exceeding normal variation. Quantitatively abnormal regional radiotracer uptake is below lower limits of normal. Defects may vary in intensity from slightly reduced activity to almost total absence of activity. Using the earlier-mentioned semiquantitative scoring system, mildly reduced uptake = 1; moderately reduced uptake = 2; severely reduced uptake = 3; and absent uptake = 4.54 The degree of abnormality can be quantified in terms of the extent and severity of abnormal uptake. A defect can be further quantified as “percent of total left ventricle.” Severe breast or diaphragmatic attenuation may occasionally create a quantitative defect, but it is vital that the reader exclude the possibility that a true perfusion abnormality is contributing to the defect before interpreting the defect as being artifact.
Reverse Defect. The initial images are either normal or show a defect, whereas the delayed or rest images show a more severe defect. This pattern is frequently observed in patients who had thrombolytic therapy or percutaneous coronary intervention for acute coronary syndrome. This pattern may persist for years, and the phenomenon is thought to be caused by initial excess radiotracer uptake in a reperfused myocardial area consisting of a mixture of scar tissue and viable myocytes. Initial excess accumulation is subsequently followed by rapid clearance from scar tissue. Although the clinical significance of this finding is controversial, it does not represent evidence of exercise-induced ischemia.68
Lung Uptake. Normally no, or very little, radiotracer is noted in the lung fields on postexercise images. Increased lung uptake on planar images can be quantified as the lung-to-heart ratio (normal < 0.5 for 201Tl and < 0.4 for 99mTc-labeled agents).69–71 Increased lung uptake of radiotracer represents an important abnormal image pattern, which is associated with an elevated left ventricular end-diastolic pressure,72 and indicates exercise-induced ischemic left ventricular dysfunction and severe multivessel CAD. Occasionally, increased lung uptake is also observed after pharmacologic stress and has a similar unfavorable significance. Not surprisingly, increased lung uptake occurs also in patients with severely decreased resting LVEF, with or without demonstrable exercise-induced ischemia.
Transient Left Ventricular Dilation. Occasionally, the left ventricle is noted to be larger following exercise than on the rest or delayed image.73 This pattern is more likely caused by apparent thinning of the myocardium by circumferential endocardial ischemia rather than true and persistent dilation of the left ventricular cavity.74 At times this image pattern may occur without apparent regional perfusion abnormalities.75
Transient Right Ventricular Visualization. The right ventricle is more clearly visualized on postexercise images than on rest images. This pattern indicates ischemic left ventricular dysfunction during exercise.76 The mechanism responsible for this finding remains unknown but may involve either increased right ventricular strain or a relative decrease in count intensity in the left ventricle due to diffuse hypoperfusion.
LOW-RISK AND HIGH-RISK IMAGE PATTERNS
Low-Risk Patterns
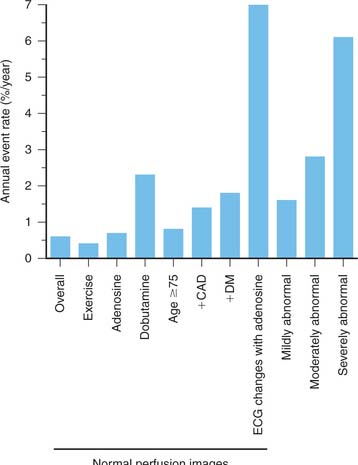
Patients with entirely normal or near-normal exercise myocardial perfusion images, even in the presence of known angiographic CAD, have a very low (<1%) yearly cardiac event rate.28,54,77–84 This was already demonstrated in the early 1980s for planar exercise 201Tl and sestamibi images, and was subsequently confirmed in the 1990s in large numbers of patients with SPECT imaging. In recent years, it has been recognized that although this notion is generally correct, there are small but important subgroups of patients with a less favorable outcome (Fig. 14-15).84 These subgroups are elderly patients, patients (especially women) with diabetes,85 African-Americans,86 and patients with known CAD. In addition, patients who require pharmacologic testing with either adenosine or dobutamine87 have a relatively poorer outcome despite normal myocardial perfusion images. Obviously, patients who require pharmacologic stress testing often have additional significant comorbidity. Furthermore, patients who exercise less than 7 METs, patients who have ischemic ECG changes during adenosine infusion,88 or patients who have transient ischemic dilation of the left ventricle75 may have a higher cardiac event rate even though myocardial perfusion images appear normal. It was assumed previously that the “warranty period” of normal stress myocardial perfusion images was about 2 years. In view of the data, it seems reasonable that patients in the higher-risk categories should undergo repeat stress imaging after 1 year.84
High-Risk Patterns
When assessing the overall results of an exercise SPECT study, exercise variables should be taken into consideration as well. The Duke Treadmill Score provides a simple first estimate of risk that can be refined subsequently by considering additional information derived from SPECT imaging.1 The Duke Treadmill Score is calculated as follows: exercise time (minutes) minus 5 times maximal exercise ST segment deviation (mm) minus 4 times angina index (0 = no angina, 1 = angina occurs; 2 = exercise-limiting angina) or can be assessed from a simple nomogram.1 In addition to low exercise tolerance (<7 METs), exercise-limiting angina, and marked ST depression, exercise-induced hypotension, or exercise-induced ventricular arrhythmias indicate also poor outcome.
High-risk SPECT myocardial perfusion images (Fig. 14-16) are characterized by any one or more of the following image patterns:
REPORTING SPECT IMAGING RESULTS
The results of exercise SPECT may have an important impact on decision making and management of cardiac patients. If communication with referring physicians is ineffective, patients may not fully benefit from nuclear cardiology procedures. In recent years it has become clear that in many imaging facilities, the quality of reporting was inadequate.89 Reports should be concise and clear. In most circumstances, it is possible to decide if a study is normal or abnormal. If a study is abnormal, the degree of abnormality should be defined (i.e., small, moderate, or large) as well as the type of abnormality, fixed or reversible. The anatomic location of a perfusion defect, the possible coronary territory involved, and presence of high-risk features should be stated. Interpretation should also be formulated with consideration of exercise parameters: one should never interpret images alone. A relatively small exercise-induced myocardial perfusion abnormality has markedly different clinical significance in a patient who achieved only a low workload as compared to a patient who exercised for 15 minutes. Reasons for suboptimal quality of images that affect the confidence of interpretation (attenuation artifacts, intense gastrointestinal uptake, motion) should be mentioned as well. Examples of optimized reports have been published.89,90
1. Mark D.B., Shaw L., Harrell F.E.Jr, et al. Prognostic value of a treadmill exercise score in outpatients with suspected coronary artery disease. N Engl J Med. 1991;325(12):849-853.
2. Hachamovitch R., Berman D.S., Kiat H., et al. Exercise myocardial perfusion SPECT in patients without known coronary artery disease: incremental prognostic value and use in risk stratification. Circulation. 1996;93(5):905-914.
3. Christie J., Sheldahl L.M., Tristani F.E., et al. Determination of stroke volume and cardiac output during exercise: comparison of two-dimensional and Doppler echocardiography, Fick oximetry, and thermodilution. Circulation. 1987;76(3):539-547.
4. Hammond H.K., Kelly T.L., Froelicher V. Radionuclide imaging correlatives of heart rate impairment during maximal exercise testing. J Am Coll Cardiol. 1983;2(5):826-833.
5. Lauer M.S., Okin P.M., Larson M.G., et al. Impaired heart rate response to graded exercise. Prognostic implications of chronotropic incompetence in the Framingham Heart Study. Circulation. 1996;93(8):1520-1526.
6. Laaksonen M.S., Kalliokoski K.K., Luotolahti M., et al. Myocardial perfusion during exercise in endurance-trained and untrained humans. Am J Physiol Regul Integr Comp Physiol. 2007;293(2):R837-R843.
7. Zoghbi G.J., Htay T., Aqel R., et al. Effect of caffeine on ischemia detection by adenosine single-photon emission computed tomography perfusion imaging. J Am Coll Cardiol. 2006;47(11):2296-2302.
8. Kailasnath P., Sinusas A.J. Comparison of Tl-201 with Tc-99m-labeled myocardial perfusion agents: technical, physiologic, and clinical issues. J Nucl Cardiol. 2001;8(4):482-498.
9. Marshall R.C., Leidholdt E.M.Jr., Zhang D.Y., Barnett C.A. Technetium-99m hexakis 2-methoxy-2-isobutyl isonitrile and thallium-201 extraction, washout, and retention at varying coronary flow rates in rabbit heart. Circulation. 1990;82(3):998-1007.
10. DePuey E., Garcia E. Updated imaging guidelines for nuclear cardiology procedures, part 1. J Nucl Cardiol. 2001;8(1):G5-G58.
11. Einstein A.J., Moser K.W., Thompson R.C., et al. Radiation dose to patients from cardiac diagnostic imaging. Circulation. 2007;116(11):1290-1305.
12. Wackers F.J., Bodenheimer M., Fleiss J.L., Brown M. Factors affecting uniformity in interpretation of planar thallium-201 imaging in a multicenter trial. The Multicenter Study on Silent Myocardial Ischemia (MSSMI) Thallium-201 Investigators. J Am Coll Cardiol. 1993;21(5):1064-1074.
13. Kiat H., Maddahi J., Roy L.T., et al. Comparison of technetium 99m methoxy isobutyl isonitrile and thallium 201 for evaluation of coronary artery disease by planar and tomographic methods. Am Heart J. 1989;117(1):1-11.
14. Iskandrian A.S., Heo J., Kong B., et al. Use of technetium-99m isonitrile (RP-30A) in assessing left ventricular perfusion and function at rest and during exercise in coronary artery disease, and comparison with coronary arteriography and exercise thallium-201 SPECT imaging. Am J Cardiol. 1989;64(5):270-275.
15. Kahn J.K., McGhie I., Akers M.S., et al. Quantitative rotational tomography with 201Tl and 99mTc 2-methoxy-isobutyl-isonitrile. A direct comparison in normal individuals and patients with coronary artery disease. Circulation. 1989;79(6):1282-1293.
16. Solot G., Hermans J., Merlo P., et al. Correlation of 99Tcm-sestamibi SPECT with coronary angiography in general hospital practice. Nucl Med Commun. 1993;14(1):23-29.
17. Chae S.C., Heo J., Iskandrian A.S., et al. Identification of extensive coronary artery disease in women by exercise single-photon emission computed tomographic (SPECT) thallium imaging. J Am Coll Cardiol. 1993;21(6):1305-1311.
18. Van Train K.F., Garcia E.V., Maddahi J., et al. Multicenter trial validation for quantitative analysis of same-day rest-stress technetium-99m-sestamibi myocardial tomograms. J Nucl Med. 1994;35(4):609-618.
19. Rubello D., Zanco P., Candelpergher G., et al. Usefulness of 99mTc-MIBI stress myocardial SPECT bull’s-eye quantification in coronary artery disease. Q J Nucl Med. 1995;39(2):111-115.
20. Hambye A.S., Vervaet A., Lieber S., Ranquin R. Diagnostic value and incremental contribution of bicycle exercise, first-pass radionuclide angiography, and 99mTc-labeled sestamibi single-photon emission computed tomography in the identification of coronary artery disease in patients without infarction. J Nucl Cardiol. 1996;3(6 Pt 1):464-474.
21. Iskandrian A.E., Heo J., Nallamothu N. Detection of coronary artery disease in women with use of stress single-photon emission computed tomography myocardial perfusion imaging. J Nucl Cardiol. 1997;4(4):329-335.
22. Santana-Boado C., Candell-Riera J., Castell-Conesa J., et al. Diagnostic accuracy of technetium-99m-MIBI myocardial SPECT in women and men. J Nucl Med. 1998;39(5):751-755.
23. Azzarelli S., Galassi A.R., Foti R., et al. Accuracy of 99mTc-tetrofosmin myocardial tomography in the evaluation of coronary artery disease. J Nucl Cardiol. 1999;6(2):183-189.
24. Elhendy A., van Domburg R.T., Sozzi F.B., et al. Impact of hypertension on the accuracy of exercise stress myocardial perfusion imaging for the diagnosis of coronary artery disease. Heart. 2001;85(6):655-661.
25. Schuijf J.D., Poldermans D., Shaw L.J., et al. Diagnostic and prognostic value of non-invasive imaging in known or suspected coronary artery disease. Eur J Nucl Med Mol Imaging. 2006;33(1):93-104.
26. Underwood S.R., Anagnostopoulos C., Cerqueira M., et al. Myocardial perfusion scintigraphy: the evidence. Eur J Nucl Med Mol Imaging. 2004;31(2):261-291.
27. Elhendy A., Sozzi F.B., van Domburg R.T., et al. Accuracy of exercise stress technetium 99m sestamibi SPECT imaging in the evaluation of the extent and location of coronary artery disease in patients with an earlier myocardial infarction. J Nucl Cardiol. 2000;7(5):432-438.
28. Brown K.A., Rowen M. Prognostic value of a normal exercise myocardial perfusion imaging study in patients with angiographically significant coronary artery disease. Am J Cardiol. 1993;71(10):865-867.
29. Zeiher A.M., Krause T., Schachinger V., et al. Impaired endothelium-dependent vasodilation of coronary resistance vessels is associated with exercise-induced myocardial ischemia. Circulation. 1995;91(9):2345-2352.
30. Sharir T., Germano G., Kavanagh P.B., et al. Incremental prognostic value of post-stress left ventricular ejection fraction and volume by gated myocardial perfusion single photon emission computed tomography. Circulation. 1999;100(10):1035-1042.
31. Shen M.Y., Liu Y.H., Sinusas A.J., et al. Quantification of regional myocardial wall thickening on electrocardiogram-gated SPECT imaging. J Nucl Cardiol. 1999;6(6):583-595.
32. Sharir T., Germano G., Kang X., et al. Prediction of myocardial infarction versus cardiac death by gated myocardial perfusion SPECT: risk stratification by the amount of stress-induced ischemia and the poststress ejection fraction. J Nucl Med. 2001;42(6):831-837.
33. Spinelli L., Petretta M., Acampa W., et al. Prognostic value of combined assessment of regional left ventricular function and myocardial perfusion by dobutamine and rest gated SPECT in patients with uncomplicated acute myocardial infarction. J Nucl Med. 2003;44(7):1023-1029.
34. Johnson L.L., Verdesca S.A., Aude W.Y., et al. Postischemic stunning can affect left ventricular ejection fraction and regional wall motion on post-stress gated sestamibi tomograms. J Am Coll Cardiol. 1997;30(7):1641-1648.
35. Ward R.P., Gundeck E.L., Lang R.M., et al. Overestimation of postischemic myocardial stunning on gated SPECT imaging: correlation with echocardiography. J Nucl Cardiol. 2006;13(4):514-520.
36. Smanio P.E., Watson D.D., Segalla D.L., et al. Value of gating of technetium-99m sestamibi single-photon emission computed tomographic imaging. J Am Coll Cardiol. 1997;30(7):1687-1692.
37. Taillefer R., DePuey E.G., Udelson J.E., et al. Comparative diagnostic accuracy of Tl-201 and Tc-99m sestamibi SPECT imaging (perfusion and ECG-gated SPECT) in detecting coronary artery disease in women. J Am Coll Cardiol. 1997;29(1):69-77.
38. Vallejo E., Dione D.P., Sinusas A.J., Wackers F.J. Assessment of left ventricular ejection fraction with quantitative gated SPECT: accuracy and correlation with first-pass radionuclide angiography. J Nucl Cardiol. 2000;7(5):461-470.
39. Navare S.M., Wackers F.J., Liu Y.H. Comparison of 16-frame and 8-frame gated SPET imaging for determination of left ventricular volumes and ejection fraction. Eur J Nucl Med Mol Imaging. 2003;30(10):1330-1337.
40. Germano G., Kiat H., Kavanagh P.B., et al. Automatic quantification of ejection fraction from gated myocardial perfusion SPECT. J Nucl Med. 1995;36:2138-2147.
41. Iskandrian A.E., Germano G., VanDecker W., et al. Validation of left ventricular volume measurements by gated SPECT 99mTc-labeled sestamibi imaging. J Nucl Cardiol. 1998;5(6):574-578.
42. Fitzgerald J., Danias P.G. Effect of motion on cardiac SPECT imaging: recognition and motion correction. J Nucl Cardiol. 2001;8:701-706.
43. Ficaro E.P., Fessler J.A., Shreve P.D., et al. Simultaneous transmission/emission myocardial perfusion tomography. Diagnostic accuracy of attenuation-corrected 99mTc-sestamibi single-photon emission computed tomography. Circulation. 1996;93(3):463-473.
44. Hendel R.C., Berman D.S., Cullom S.J., et al. Multicenter clinical trial to evaluate the efficacy of correction for photon attenuation and scatter in SPECT myocardial perfusion imaging. Circulation. 1999;99(21):2742-2749.
45. Links J.M., Becker L.C., Rigo P., et al. Combined corrections for attenuation, depth-dependent blur, and motion in cardiac SPECT: a multicenter trial. J Nucl Cardiol. 2000;7(5):414-425.
46. Gallowitsch H.J., Sykora J., Mikosch P., et al. Attenuation-corrected thallium-201 single-photon emission tomography using a gadolinium-153 moving line source: clinical value and the impact of attenuation correction on the extent and severity of perfusion abnormalities. Eur J Nucl Med. 1998;25(3):220-228.
47. Masood Y., Liu Y.H., Depuey G., et al. Clinical validation of SPECT attenuation correction using x-ray computed tomography-derived attenuation maps: multicenter clinical trial with angiographic correlation. J Nucl Cardiol. 2005;12(6):676-686.
48. Duvernoy C.S., Ficaro E.P., Karabajakian M.Z., et al. Improved detection of left main coronary artery disease with attenuation-corrected SPECT. J Nucl Cardiol. 2000;7(6):639-648.
49. O’Connor M.K., Kemp B., Anstett F., et al. A multicenter evaluation of commercial attenuation compensation techniques in cardiac SPECT using phantom models. J Nucl Cardiol. 2002;9(4):361-376.
50. Goetze S., Wahl R.L. Prevalence of misregistration between SPECT and CT for attenuation-corrected myocardial perfusion SPECT. J Nucl Cardiol. 2007;14(2):200-206.
51. Standardization of cardiac tomographic imaging. From the Committee on Advanced Cardiac Imaging and Technology, Council on Clinical Cardiology, American Heart Association; Cardiovascular Imaging Committee, American College of Cardiology; and Board of Directors, Cardiovascular Council, Society of Nuclear Medicine. Circulation. 1992;86(1):338-339.
52. Cerqueira M.D., Weissman N.J., Dilsizian V., et al. Standardized myocardial segmentation and nomenclature for tomographic imaging of the heart: a statement for healthcare professionals from the Cardiac Imaging Committee of the Council on Clinical Cardiology of the American Heart Association. J Nucl Cardiol. 2002;9(2):240-245.
53. Nakagawa Y., Nakagawa K., Sdringola S., et al. A precise, three-dimensional atlas of myocardial perfusion correlated with coronary arteriographic anatomy. J Nucl Cardiol. 2001;8(5):580-590.
54. Hachamovitch R., Berman D.S., Shaw L.J., et al. Incremental prognostic value of myocardial perfusion single photon emission computed tomography for the prediction of cardiac death: differential stratification for risk of cardiac death and myocardial infarction. Circulation. 1998;97(6):535-543.
55. Berman D.S., Kang X., Gransar H., et al. Quantitative assessment of myocardial perfusion abnormality on SPECT myocardial perfusion imaging is more reproducible than expert visual analysis. J Nucl Cardiol. 2009;16(1):45-53.
56. Wolak A., Slomka P.J., Fish M.B., et al. Quantitative myocardial-perfusion SPECT: comparison of three state-of-the-art software packages. J Nucl Cardiol. 2008;15(1):27-34.
57. Garcia E.V., Faber T.L., Cooke C.D., et al. The increasing role of quantification in clinical nuclear cardiology: The Emory approach. J Nucl Cardiol. 2007;14(4):420-432.
58. Germano G., Kavanagh P.B., Slomka P.J., et al. Quantitation in gated perfusion SPECT imaging: The Cedars-Sinai approach. J Nucl Cardiol. 2007;14(4):433-454.
59. Ficaro E.P., Lee B.C., Kritzman J.N., Corbett J.R. Corridor4DM: The Michigan method for quantitative nuclear cardiology. J Nucl Cardiol. 2007;14(4):455-465.
60. Watson D.D., Smith Ii W.H. The role of quantitation in clinical nuclear cardiology: The University of Virginia approach. J Nucl Cardiol. 2007;14(4):466-482.
61. Liu Y.-H. Quantification of nuclear cardiac images: The Yale approach. J Nucl Cardiol. 2007;14(4):483-491.
62. Liu Y.H., Sinusas A.J., DeMan P., et al. Quantification of SPECT myocardial perfusion images: methodology and validation of the Yale-CQ method. J Nucl Cardiol. 1999;6(2):190-204.
63. Iskandrian A. Risk assessment of stable patients (panel III Wintergreen Panel Summaries). J Nucl Cardiol. 1999;6(1 Pt 1):93-155.
64. Wackers F.J. Science, art, and artifacts: how important is quantification for the practicing physician interpreting myocardial perfusion studies? J Nucl Cardiol. 1994;1(5 Pt 2):S109-S117.
65. Higgins J.P., Higgins J.A., Williams G. Stress-induced abnormalities in myocardial perfusion imaging that are not related to perfusion but are of diagnostic and prognostic importance. Eur J Nucl Med Mol Imaging. 2007;34(4):584-595.
66. Lima R.S.L., Watson D.D., Goode A.R., et al. Incremental value of combined perfusion and function over perfusion alone by gated SPECT myocardial perfusion imaging for detection of severe three-vessel coronary artery disease. J Am Coll Cardiol. 2003;42(1):64-70.
67. Berman D.S., Kang X., Slomka P.J., et al. Underestimation of extent of ischemia by gated SPECT myocardial perfusion imaging in patients with left main coronary artery disease. J Nucl Cardiol. 2007;14(4):521-528.
68. Smith E.J., Hussain A., Manoharan M., et al. A reverse perfusion pattern during Technetium-99m stress myocardial perfusion imaging does not predict flow limiting coronary artery disease. Int J Cardiovasc Imaging. 2004;20(4):321-326.
69. Gill J.B., Ruddy T.D., Newell J.B., et al. Prognostic importance of thallium uptake by the lungs during exercise in coronary artery disease. N Engl J Med. 1987;317(24):1486-1489.
70. Choy J.B., Leslie W.D. Clinical correlates of Tc-99m sestamibi lung uptake. J Nucl Cardiol. 2001;8(6):639-644.
71. Bacher-Stier C., Sharir T., Kavanagh P.B., et al. Postexercise lung uptake of 99mTc-sestamibi determined by a new automatic technique: validation and application in detection of severe and extensive coronary artery disease and reduced left ventricular function. J Nucl Med. 2000;41(7):1190-1197.
72. Patel G.M., Hauser T.H., Parker J.A., et al. Quantitative relationship of stress Tc-99m sestamibi lung uptake with resting Tl-201 lung uptake and with indices of left ventricular dysfunction and coronary artery disease. J Nucl Cardiol. 2004;11(4):408-413.
73. Weiss A.T., Berman D.S., Lew A.S., et al. Transient ischemic dilation of the left ventricle on stress thallium-201 scintigraphy: a marker of severe and extensive coronary artery disease. J Am Coll Cardiol. 1987;9(4):752-759.
74. McLaughlin M.G., Danias P.G. Transient ischemic dilation: a powerful diagnostic and prognostic finding of stress myocardial perfusion imaging. J Nucl Cardiol. 2002;9(6):663-667.
75. Abidov A., Bax J.J., Hayes S.W., et al. Transient ischemic dilation ratio of the left ventricle is a significant predictor of future cardiac events in patients with otherwise normal myocardial perfusion SPECT. J Am Coll Cardiol. 2003;42(10):1818-1825.
76. Williams K.A., Schneider C.M. Increased stress right ventricular activity on dual isotope perfusion SPECT: a sign of multivessel and/or left main coronary artery disease. J Am Coll Cardiol. 1999;34(2):420-427.
77. Wackers F.J., Russo D.J., Russo D., Clements J.P. Prognostic significance of normal quantitative planar thallium-201 stress scintigraphy in patients with chest pain. J Am Coll Cardiol. 1985;6(1):27-30.
78. Raiker K., Sinusas A.J., Wackers F.J., Zaret B.L. One-year prognosis of patients with normal planar or single-photon emission computed tomographic technetium 99m-labeled sestamibi exercise imaging. J Nucl Cardiol. 1994;1(5 Pt 1):449-456.
79. Soman P., Parsons A., Lahiri N., Lahiri A. The prognostic value of a normal Tc-99m sestamibi SPECT study in suspected coronary artery disease. J Nucl Cardiol. 1999;6(3):252-256.
80. Gibbons R.J., Hodge D.O., Berman D.S., et al. Long-term outcome of patients with intermediate-risk exercise electrocardiograms who do not have myocardial perfusion defects on radionuclide imaging. Circulation. 1999;100(21):2140-2145.
81. Vanzetto G., Ormezzano O., Fagret D., et al. Long-term additive prognostic value of thallium-201 myocardial perfusion imaging over clinical and exercise stress test in low to intermediate risk patients : study in 1137 patients with 6-year follow-up. Circulation. 1999;100(14):1521-1527.
82. Groutars R.G., Verzijlbergen J.F., Muller A.J., et al. Prognostic value and quality of life in patients with normal rest thallium-201/stress technetium 99m-tetrofosmin dual-isotope myocardial SPECT. J Nucl Cardiol. 2000;7(4):333-341.
83. Galassi A.R., Azzarelli S., Tomaselli A., et al. Incremental prognostic value of technetium-99m-tetrofosmin exercise myocardial perfusion imaging for predicting outcomes in patients with suspected or known coronary artery disease. Am J Cardiol. 2001;88(2):101-106.
84. Hachamovitch R., Hayes S., Friedman J.D., et al. Determinants of risk and its temporal variation in patients with normal stress myocardial perfusion scans: what is the warranty period of a normal scan? J Am Coll Cardiol. 2003;41(8):1329-1340.
85. Giri S., Shaw L.J., Murthy D.R., et al. Impact of diabetes on the risk stratification using stress single-photon emission computed tomography myocardial perfusion imaging in patients with symptoms suggestive of coronary artery disease. Circulation. 2002;105(1):32-40.
86. Akinboboye O.O., Idris O., Onwuanyi A., et al. Incidence of major cardiovascular events in black patients with normal myocardial stress perfusion study results. J Nucl Cardiol. 2001;8(5):541-547.
87. Calnon D.A., McGrath P.D., Doss A.L., et al. Prognostic value of dobutamine stress technetium-99m-sestamibi single-photon emission computed tomography myocardial perfusion imaging: stratification of a high-risk population. J Am Coll Cardiol. 2001;38(5):1511-1517.
88. Abbott B.G., Afshar M., Berger A.K., Wackers F.J. Prognostic significance of ischemic electrocardiographic changes during adenosine infusion in patients with normal myocardial perfusion imaging. J Nucl Cardiol. 2003;10(1):9-16.
89. Wackers F.J. Intersocietal Commission for the Accreditation of Nuclear Medicine Laboratories (ICANL) position statement on standardization and optimization of nuclear cardiology reports. J Nucl Cardiol. 2000;7(4):397-400.
90. Hendel R.C., Wackers F.J., Berman D.S., et al. American Society of Nuclear Cardiology consensus statement: Reporting of radionuclide myocardial perfusion imaging studies. J Nucl Cardiol. 2006;13(6):e152-e156.
91. Ficaro E.P., Fessler J.A., Ackermann R.J., et al. Simultaneous transmission-emission thallium-201 cardiac SPECT: effect of attenuation correction on myocardial tracer distribution. J Nucl Med. 1995;36(6):921-931.
92. Lenzo N., Ficaro E., Kritzman J.N., Corbett J.R. Clinical comparison of Profile attenuation correction and the Michigan modified STEP method. J Nucl Cardiol. 2001;8:S19.
93. Shotwell M., Singh B.M., Fortman C., et al. Improved coronary disease detection with quantitative attenuation-corrected Tl-201 images. J Nucl Cardiol. 2002;9(1):52-62.
94. Links J.M., DePuey E.G., Taillefer R., Becker L.C. Attenuation correction and gating synergistically improve the diagnostic accuracy of myocardial perfusion SPECT. J Nucl Cardiol. 2002;9:183-187.
95. Grossman G.B., Garcia E.V., Bateman T.M., et al. Quantitative Tc-99m sestamibi attenuation-corrected SPECT: development and multicenter trial validation of myocardial perfusion stress gender-independent normal database in an obese population. J Nucl Cardiol. 2004;11(3):263-272.
96. Thompson R.C., Heller G.V., Johnson L.L., et al. Value of attenuation correction on ECG-gated SPECT myocardial perfusion imaging related to body mass index. J Nucl Cardiol. 2005;12(2):195-202.
97. Utsunomiya D., Tomiguchi S., Shiraishi S., et al. Initial experience with X-ray CT based attenuation correction in myocardial perfusion SPECT imaging using a combined SPECT/CT system. Ann Nucl Med. 2005;19(6):485-489.