Chapter 20
Control of Cardiac Output and Hemodynamic Measurements
After reading this chapter you will be able to:
• Describe how various physiological factors affect preload, afterload, and contractility
• Distinguish between factors that affect venous return and cardiac output
• Describe the way in which cardiac output and venous return are interdependent
• Use combined cardiac and venous return curves to illustrate the compensatory interaction between the heart and vasculature during abnormal hemodynamic conditions
• Explain why decreased left ventricular contractility leads to pulmonary edema
• Explain why various clinical hemodynamic measurements are indicators of preload, afterload, and contractility
• Develop diagnostic classifications based on analysis of hemodynamic data
• Develop a general therapeutic approach based on analysis of hemodynamic data
left ventricular end-diastolic pressure (LVEDP)
mean circulatory filling pressure
mean pulmonary artery pressure (MPAP)
pulmonary artery end-diastolic pressure (PAEDP)
pulmonary vascular resistance index (PVRI)
right ventricular end-diastolic pressure (RVEDP)
Factors Controlling Cardiac Output
Cardiac output is determined by (1) peripheral circulatory factors that affect venous return, such as vascular resistance and blood volume, and (2) the heart’s ability to pump the amount of blood it receives through the veins. The factors affecting venous return are normally the most important in controlling cardiac output in healthy people. The built-in Frank-Starling mechanism in the normal heart automatically adjusts to any amount of blood returning from the veins. Any increase in venous return is immediately pumped into the aorta. Only in pathological conditions does the heart fail to pump all of the blood it receives—in which case pumping ability becomes the factor that determines cardiac output.1
Cardiac Factors
Preload: Frank-Starling Mechanism
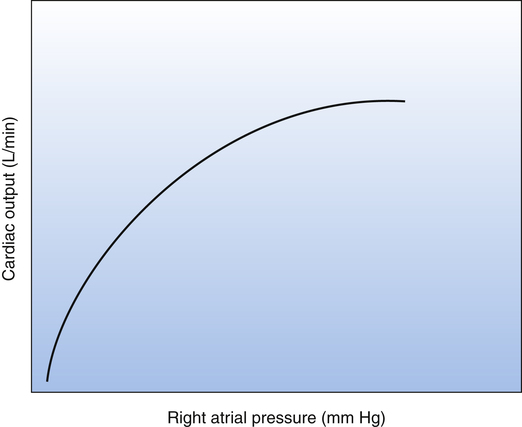
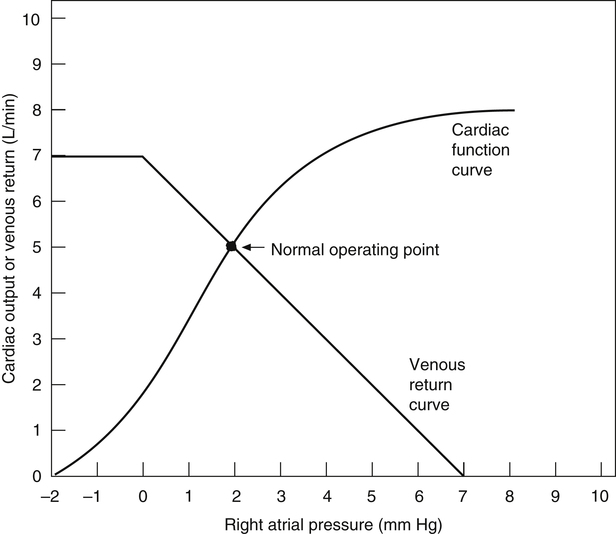
An increased venous return increases the end-diastolic or filling volume of the ventricles. The greater the end-diastolic volume, the more the ventricular muscle fibers are stretched. This load, or stretch, placed on myocardial fibers just before contraction is the heart’s preload. According to the Frank-Starling law, an increase in preload causes myocardial fibers to contract with greater force and eject a greater stroke volume (see Chapter 17). Within physiological limits, the ventricles pump all the blood they receive without allowing it to dam in the atria and veins. Figure 20-1 is a Frank-Starling curve, also known as a cardiac function curve.
Another mechanism related to muscle fiber stretch also influences cardiac output. When increased venous return stretches the right atrial wall, it stretches the sinoatrial node, increasing its impulse generation frequency by 10% to 20%.1 Myocardial fiber stretch increases cardiac output by increasing both contraction force and heart rate, although the Frank-Starling mechanism is the most important in this regard.
Contractility and Ejection Fraction
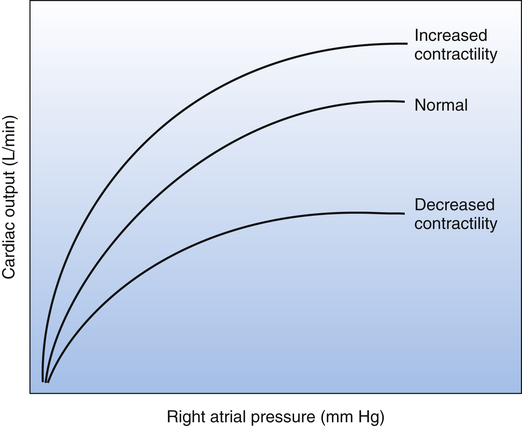
The force of myocardial muscle fiber contraction for a given preload and afterload is known as the heart’s contractility. In other words, the heart’s response to changes in preload while the afterload is constant is a measure of contractility. A heart with increased contractility produces a greater stroke volume for a given preload (filling pressure) than a heart with normal contractility. This means that the ventricle ejects a larger fraction of its end-diastolic volume as contractility increases—that is, the ejection fraction increases. Ejection fraction is thus a measure of ventricular contractility. The heart’s normal ejection fraction is approximately 60% of the end-diastolic volume under resting conditions; in strenuous exercise, it may increase to 90%.1
The concept of contractility is shown in the Frank-Starling curves in Figure 20-2. These curves are also known as cardiac function curves. The greater the heart’s contractility, the greater is its workload and oxygen demand. Factors influencing the heart’s contractility are called inotropic factors. Positive inotropic factors increase the heart’s contractility; negative inotropic factors decrease contractility.
Vascular Factors
Vascular factors affecting venous blood return are the most important factors in regulating cardiac output in the normal heart.1 Venous blood flow returning to the right atrium is equal to the sum of all venous blood flows from all parts of the peripheral circulation.
Long-term peripheral vascular resistance is a very important factor in determining venous return and cardiac output levels. The effect of chronically increased peripheral vascular resistance is to reduce the cardiac output level, whereas a chronic decrease in vascular resistance increases the cardiac output.1 In the long-term, cardiac output and peripheral vascular resistance change in opposite directions.
Blood volume is also an important vascular factor in determining cardiac output. For example, severe hemorrhage decreases the circulating volume to such a low level that there is not enough pressure to push blood back to the heart; the heart is underfilled, and cardiac output decreases. In the end, the major vascular factors that determine venous return and cardiac output are (1) right atrial pressure, which represents a force hindering venous blood return to the heart; (2) mean filling pressure of the systemic circulation, which is the force pushing blood back to the heart; and (3) vascular resistance to blood flow between the peripheral vessels and the right atrium.1
Venous Return Curves
As discussed earlier, the cardiovascular system consists of cardiac and vascular subdivisions. The Frank-Starling curve (see Figure 20-1) is relevant to the cardiac subdivision; it illustrates the relationship between cardiac output and right atrial pressure. The venous return curve (Figure 20-3) is relevant to the vascular subdivision; it illustrates the relationship between right atrial pressure and venous return. A positive feedback relationship exists between the cardiac and vascular subdivisions: In the cardiac subdivision, an increase in right atrial pressure causes an increase in cardiac output (Frank-Starling mechanism); in the vascular subdivision, an increase in cardiac output secondary to increased contractility causes a decrease in right atrial pressure, which enhances venous return.2 At any given point in time, the right atrial pressure is common to both cardiac and vascular subdivisions, simultaneously playing a different role in each.
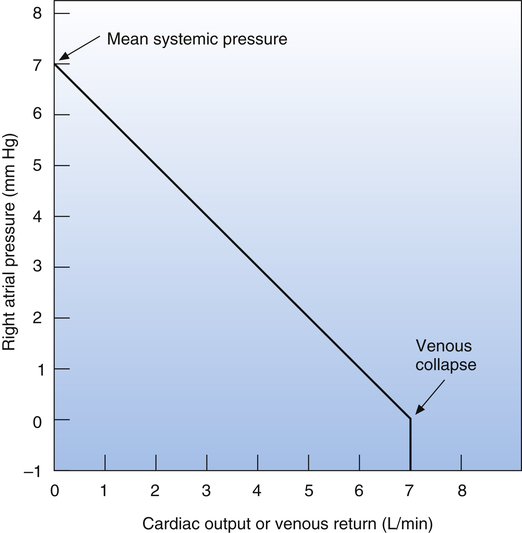
The venous return curve shows that if cardiac output were to suddenly fall to zero (as it would in cardiac arrest) and if all neural circulatory reflexes were abolished, right atrial pressure would increase to a maximum of about 7 mm Hg, reflecting the overall static equilibrium between venous and arterial pressures.1 This hypothetical vascular equilibrium pressure established under static, no-flow conditions is called the mean circulatory filling pressure. The vascular equilibrium pressure in this hypothetical situation is lower than the simple average of pressures in venous and arterial vessels because the veins are highly distensible and serve as a large reservoir in which blood pools.
The mean circulatory filling pressure is determined by two major factors: the blood volume and intravascular space, or the size of the vascular “container.” The intravascular space is determined mainly by vessel diameter, which is a factor of (1) the elastic recoil force of the vessels and (2) vessel smooth muscle tone, or the degree of vasoconstriction present.3 When blood is circulating normally, the average pressure at the venous end of the systemic capillaries is about equal to the theoretical mean circulatory filling pressure.3 The difference between this pressure and right atrial pressure is the pressure gradient that drives venous return.1 If the heart fails to pump all the blood it receives from the veins, blood dams up in the right atrium and increases its pressure, which decreases the pressure gradient that drives venous return. As a result, venous inflow of blood falls to match the failing heart’s reduced pumping capacity. On the other hand, if cardiac contractility increases and the heart pumps out more blood than it receives, right atrial pressure falls, increasing the pressure gradient that drives venous return.
If the heart pumps blood so vigorously that right atrial pressure falls below zero (see Figure 20-3), venous return and cardiac output stop rising. The reason for this phenomenon is that as the heart contracts more powerfully, it generates an increasingly greater subatmospheric pressure in the right atrium and the inferior vena cava, collapsing this great vein just before it enters the thoracic cavity; that is, the higher abdominal cavity pressure surrounding the vein caves in its walls just before it enters the chest. As a result, venous return and cardiac output cannot increase further.
Effect of Blood Volume and Arteriolar Resistance on Venous Return Curve
Figure 20-4 illustrates the effect of increased and decreased blood volume on the venous return curve. The mean circulatory filling pressure, hypothetically equal to intravascular pressure during circulatory standstill, depends only on vessel wall recoil (compliance) and blood volume. For a given vessel compliance, increased blood volume (hypervolemia) increases the mean circulatory filling pressure; decreased blood volume (hypovolemia) decreases mean circulatory filling pressure. Figure 20-4 illustrates this concept, showing mean circulatory filling pressures of 9 mm Hg for hypervolemia, 7 mm Hg for normovolemia, and 5 mm Hg for hypovolemia. In other words, the more the vascular space is filled, the “tighter” the vessels become; this increases the mean circulatory filling pressure and shifts the venous return curve up and to the right. Conversely, the less the vascular space is filled, the “looser” the system becomes, lowering the mean circulatory filling pressure and shifting the venous return curve down and to the left.
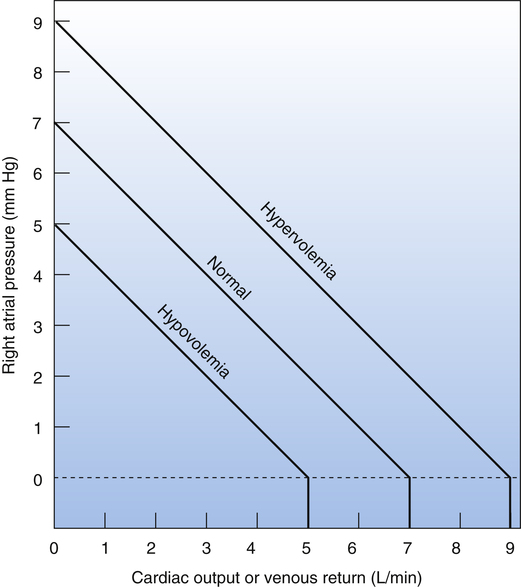
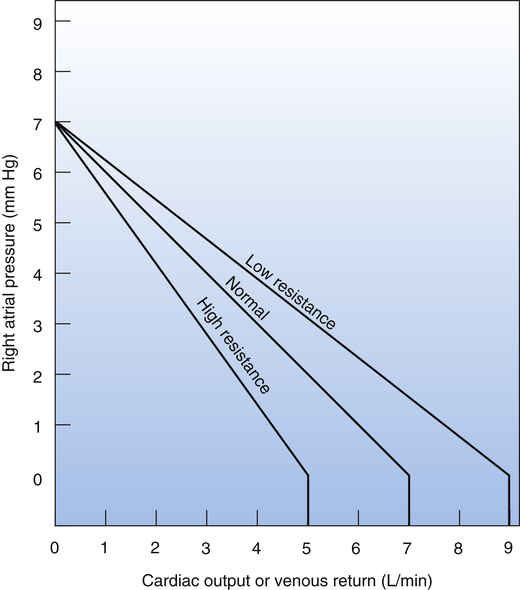
Figure 20-5 illustrates the effect of arteriolar resistance on the venous return curve. Because the arterioles contain only about 3% of the total blood volume, their constriction or dilation does not significantly affect mean circulatory filling pressure.4 Therefore, the venous return curves representing different arteriolar resistances in Figure 20-5 have different slopes but converge on the same mean circulatory filling pressure “hinge” point (7 mm Hg). (These curves assume that blood volume and vascular compliance remain constant.) Figure 20-5 shows that a decrease in arteriolar resistance allows more blood to flow through systemic capillaries, into the veins, and into the right atrium. This rotates the curve about its mean circulatory filling pressure hinge point (7 mm Hg) in an upward direction; the decrease in the curve’s slope denotes less resistance (higher cardiac output for a given right atrial pressure). Conversely, high arteriolar resistance decreases the amount of blood that can flow through systemic capillaries each minute and reduces blood return to the right atrium; this rotates the venous return curve around the same hinge point in a downward direction; the increased slope of the curve denotes greater resistance (lower cardiac output for a given right atrial pressure).
Coupling of the Heart and Vasculature: Guyton Diagram
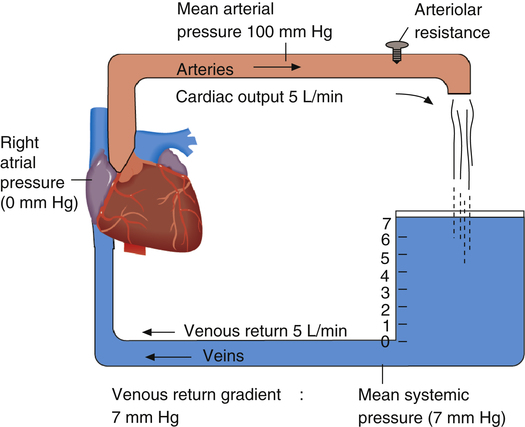
Figure 20-6 shows the coupling of the heart and systemic blood vessels. The blood pressure at the venous end of the systemic capillaries is represented by the 7-mm high blood column at the right of the figure. The pressure at the bottom of the blood column is the mean circulatory filling pressure (7 mm Hg). Right atrial pressure is 0 mm Hg, so a pressure gradient of 7 mm Hg exists between the venous end of the capillaries and the right atrium. This gradient supplies the force or “push” to move blood through the veins to the right atrium.1
Both venous return and cardiac output curves can be superimposed on the same graph, forming a Guyton diagram (Figure 20-7)2; this requires the axes of the venous return curve to be reversed (compare with Figure 20-3). The point at which the cardiac function and venous return curves intersect identifies the right atrial pressure common to both the cardiac and the vascular subdivisions of the cardiovascular system. This intersection is the cardiovascular system’s equilibrium or operating point, the point at which cardiac output and venous return are equal. The Guyton diagram in Figure 20-3 represents the normal circulation in which a right atrial pressure of about 2 mm Hg is associated with a cardiac output and venous return of about 5 L per minute.
Effect of Contractility Changes
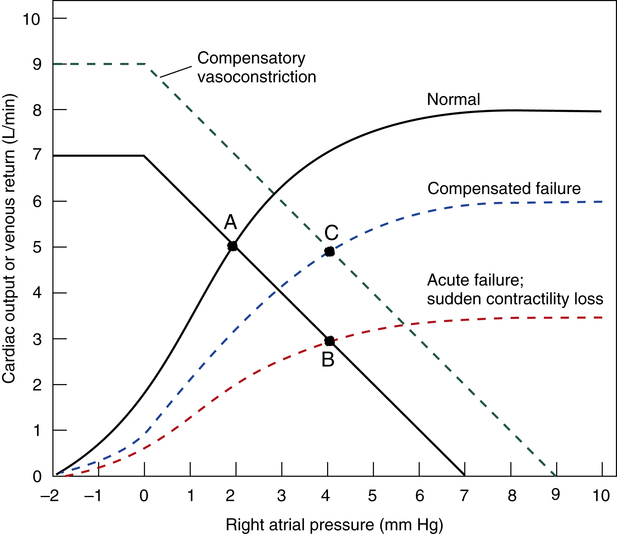
Figure 20-8 illustrates the effect of increased and decreased myocardial contractility on the cardiovascular system. Point A is the normal operating point. In a hypothetical situation in which only contractility increases (constant blood volume and vascular resistance), the cardiac function curve moves up and to the left, intersecting the venous return curve at point B. This point represents a new equilibrium in which the heart pumps more blood from the right atrium, decreasing right atrial pressure and increasing the gradient for venous return. Consequently, venous return increases to match the increased cardiac output. In the end, cardiac output and venous return are greater at a lower right atrial (preload) pressure, which is the hallmark of increased contractility.
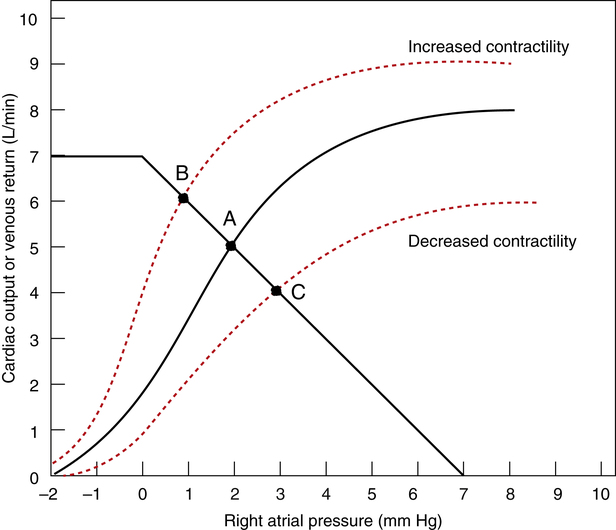
Conversely, if myocardial contractility suddenly decreases (assuming a constant blood volume and vascular resistance), cardiac output decreases. The cardiac function curve moves down and to the right, intersecting the venous return curve at point C in Figure 20-8. This point represents a new equilibrium in which the heart pumps less blood than normal from the right atrium, and right atrial pressure increases. The resulting decrease in the venous return pressure gradient is consistent with the decreased cardiac output. In this situation, cardiac output and venous return are lower at a higher right atrial pressure, which is a hallmark of decreased contractility (e.g., congestive heart failure). (The term “congestive” refers to the congestion or pooling of blood in the veins.)
Effects of Blood Volume Changes
An increased blood volume (as occurs with intravenous fluid infusion) increases vascular pressures throughout the system; mean circulatory filling pressure increases, causing the venous return curve to shift up and to the right, intersecting the cardiac function curve at point B (Figure 20-9). Cardiac output increases, moving from point A to point B in Figure 20-9. In this way, cardiac output increases to accommodate the increased venous return; however, this increase does not represent greater contractility because the position of the cardiac function curve stays constant in this example. As venous blood flow into the heart increases, the heart responds according to the Frank-Starling law by contracting with greater force, but its ejection fraction does not change.
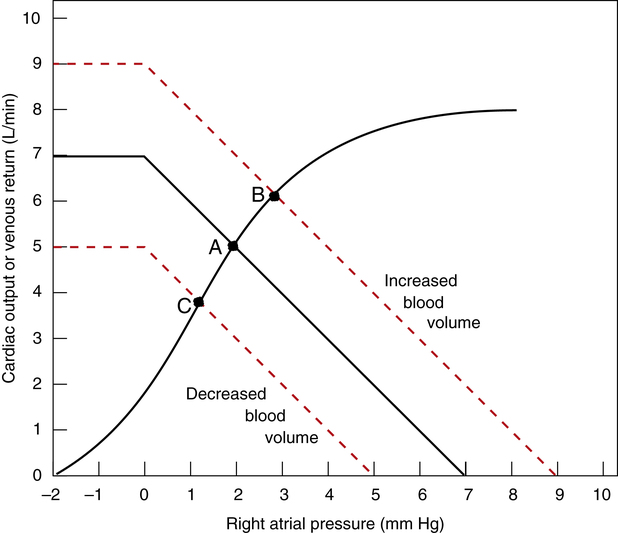
A sudden blood volume loss such as occurs with hemorrhage has the opposite effect. Venous pressures fall and myocardial fibers are less stretched; in accordance with the Frank-Starling law, cardiac output decreases. The venous return curve shifts down and to the left to a new equilibrium point (point C in Figure 20-9).
Effect of Peripheral Arteriolar Resistance Changes
An increased arteriolar resistance produces complex changes in the Guyton diagram because both cardiac and venous return curves shift simultaneously. To understand the general concept, it is helpful to consider the hypothetical effect of an increased arteriolar resistance alone, with the right atrial pressure and cardiac force of contraction remaining constant (Figure 20-10). Under such circumstances, an increased resistance would cause the venous return curve to rotate down and to the left, pivoting around its constant right atrial pressure hinge point (mean circulatory filling pressure) on the graph’s horizontal axis. At the same time, the cardiac function curve would shift down and to the right because at a constant right atrial pressure and force of contraction, the heart would pump less blood against a greater resistance or afterload. The right atrial pressure would stay constant in this hypothetical example because of proportional decreases in both cardiac output and venous return. The new equilibrium point B would be formed below the original point A.
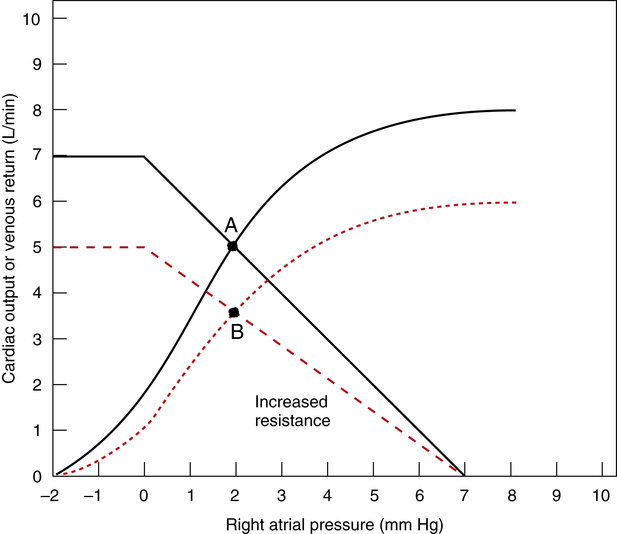
However, Figure 20-10 artificially separates the effects of vascular resistance from the effects of subsequent compensatory factors. It does not take into account the normal physiological response of the healthy heart to an increase in afterload. As explained previously, an increased afterload raises the heart’s end-systolic volume, increasing the preload; in response, the Frank-Starling mechanism increases the healthy heart’s contracting force and stroke volume. The resulting increase in arterial pressure overcomes the increased arteriolar resistance and maintains the cardiac output at a normal level. However, if the heart has poor contractility and is already overstretched, an increased vascular resistance may induce acute cardiac failure.
Normal Compensatory Response to Sudden Loss of Contractility
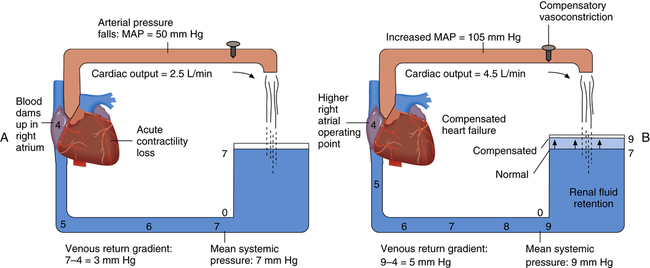
Acute myocardial infarction suddenly reduces the heart’s contractility and pumping ability (usually the left ventricle), and cardiac output acutely decreases. Momentarily, blood flows into the left ventricle at a higher rate than it is pumped out, causing blood to dam up in the left atrium, the pulmonary vasculature, and ultimately the right ventricle and atrium. Increased right atrial pressure is reflected throughout the systemic venous circulation. A new low-flow state develops in which cardiac output and venous return are again equal, with higher venous pressures and lower arterial pressures than normal. This situation, called acute uncompensated heart failure, is shown in Figure 20-11 (see point B).
The body’s immediate response is a massive sympathetic nervous discharge. Sympathetic stimulation is helpful in two ways: (1) it immediately increases the damaged heart’s contractility or inotropic state, and (2) it causes systemic arterial and venous vasoconstriction. Improved contractility shifts the cardiac function curve slightly up and to the left. At the same time, vasoconstriction “tightens” the blood vessels, shifting the venous return curve up and to the right. Over the long-term, blood volume increases because the kidney conserves water in response to the chronically low blood pressure. The combination of (1) improved contractility, (2) vasoconstriction, and (3) renal fluid retention creates a new compensated equilibrium point (see point C in Figure 20-11). This is known as compensated heart failure. Cardiac output is restored to normal values, but this requires higher left ventricular filling pressures than
normal. As a result, the pressures in the pulmonary vasculature, right heart, and systemic veins are higher than normal. In compensated heart failure, a higher right atrial pressure is required to achieve a cardiac output of 5 L per minute (see point C in Figure 20-11) than in the normal heart (see point A).
Figure 20-12, A, shows a sudden reduction in cardiac output to 2.5 L per minute with subsequent increases in right atrial and venous pressures (compare with Figure 20-6). Figure 20-12, A, corresponds with point B on the graph in Figure 20-11. Figure 20-12, B, illustrates an improved pumping ability caused by the inotropic influence of sympathetic stimulation and increased blood volume. This compensated state corresponds with point C in Figure 20-11.
Hemodynamic Measurements
Use of Pulmonary Artery Catheter
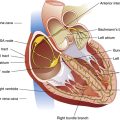
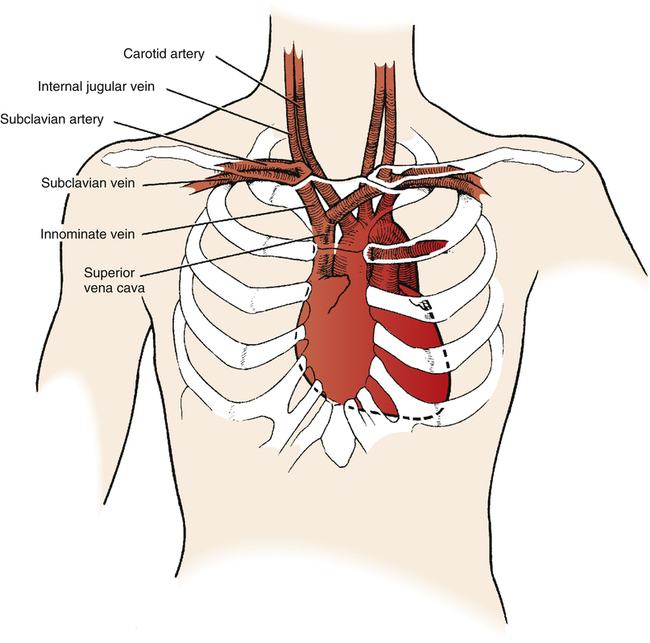
A pulmonary artery catheter, often referred to as a Swan-Ganz catheter, can be used to measure hemodynamic variables. (The mechanical characteristics and capabilities of a pulmonary artery catheter are discussed in Chapter 6.) Figure 20-13 illustrates a typical quadruple-lumen, balloon-tipped pulmonary artery catheter. It may be surgically inserted into the heart and pulmonary vessels via the internal jugular vein (Figure 20-14). This vein provides a direct path to the right atrium. Other potential insertion sites leading to the right atrium include the subclavian vein, the femoral vein in the groin, and the basilic or median cubital veins in the right arm.5 The process of surgically puncturing the skin to gain vascular access to insert the catheter is called percutaneous catheterization.
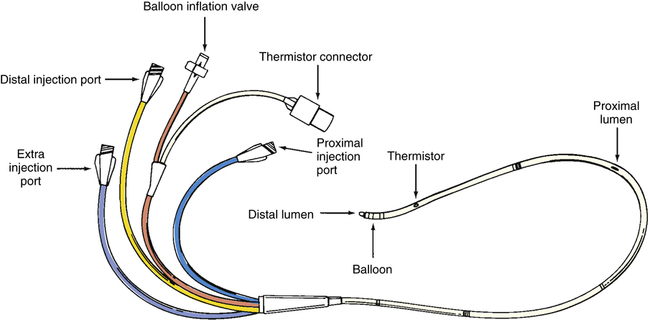
When the catheter is properly placed, the proximal port communicates with the right atrium through the proximal lumen (see Figure 20-13). The distal port communicates with a small branch of the pulmonary artery through the distal lumen at the catheter’s tip. On gaining vascular access, the catheter is introduced into the vein with the balloon deflated; at that time, a syringe is used to aspirate a small amount of blood from the catheter’s distal lumen, which is flushed gently back into the vein with a small amount of saline solution.5 This process ensures that the distal lumen is open and unobstructed. When the catheter tip enters the thoracic vein, the balloon is inflated to its recommended volume (about 1.5 mL); at this volume, the balloon protrudes slightly beyond the hard catheter tip, cushioning but not covering the distal opening. The balloon not only protects the delicate vascular endothelium and endocardium from injury, but it also allows blood flow to float the catheter tip through the heart to its proper position in the pulmonary artery.5
Figure 20-15 shows examples of different pressure waveforms recorded from the distal lumen of the catheter as it passes through the heart and pulmonary artery. Waveform shapes aid in catheter insertion because they give information about the location of the catheter tip. The pulmonary artery waveform in the third panel of Figure 20-15 is recorded from the distal lumen when the balloon is deflated. When the balloon is inflated, blocking blood flow, the PCWP waveform in the right panel is recorded. Proper catheter position is confirmed by inflating and deflating the balloon and noting abrupt changes from PCWP waveforms to pulmonary artery pressure waveforms.
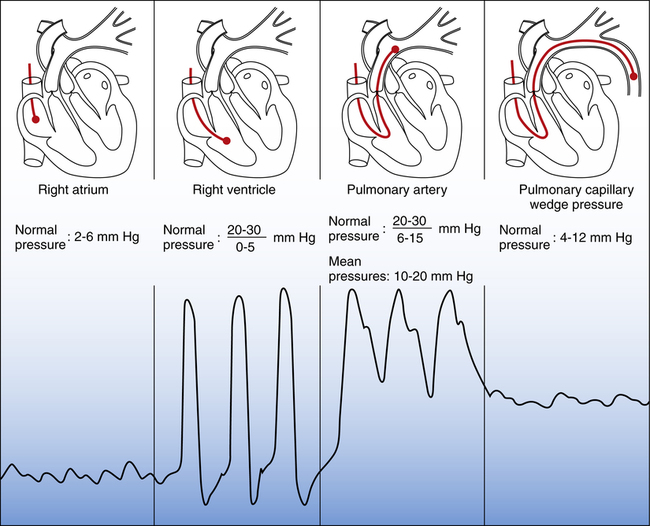
The pulmonary artery waveform in Figure 20-15 has a clear, sharp upstroke on the left, falling to a distinct notch in the downstroke on the right. This dicrotic notch marks the closure of the pulmonary semilunar valves as the heart enters the diastolic phase (see Chapter 17). A similar dicrotic notch appears in the aortic pressure waveform measured from a catheter placed in a systemic artery. In the systemic arterial catheter, often called an arterial line, the dicrotic notch marks closure of the aortic semilunar valves. The absence of a dicrotic notch recorded from either a pulmonary or a systemic artery catheter usually means the tubing system is overdamped. Damping prevents the tubing system from immediately transmitting small, abrupt changes in pressure to the transducer. For example, an air bubble in the tubing can cause overdamping.
Measured and Derived Hemodynamic Variables
Measured Variables
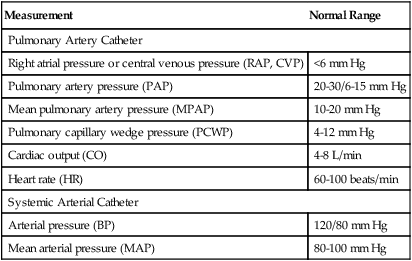
Cardiac output, pressures, and heart rate are directly measured from pulmonary and systemic arterial catheters. Directly measured variables are listed in Table 20-1. Cardiac output is directly measured with the pulmonary artery catheter using the thermodilution technique (see Chapter 6).
TABLE 20-1
Directly Measured Hemodynamic Variables
| Measurement | Normal Range |
| Pulmonary Artery Catheter | |
| Right atrial pressure or central venous pressure (RAP, CVP) | <6 mm Hg |
| Pulmonary artery pressure (PAP) | 20-30/6-15 mm Hg |
| Mean pulmonary artery pressure (MPAP) | 10-20 mm Hg |
| Pulmonary capillary wedge pressure (PCWP) | 4-12 mm Hg |
| Cardiac output (CO) | 4-8 L/min |
| Heart rate (HR) | 60-100 beats/min |
| Systemic Arterial Catheter | |
| Arterial pressure (BP) | 120/80 mm Hg |
| Mean arterial pressure (MAP) | 80-100 mm Hg |
The pulmonary artery pressure at the very end of diastole, pulmonary artery end-diastolic pressure (PAEDP), normally almost equalizes with the PCWP if the pulmonary vascular resistance (PVR) is normal (see Figure 20-15). For this reason, PAEDP is sometimes used in place of PCWP in the estimation of left ventricular filling pressure. However, when PVR is high, PAEDP is much higher than PCWP and does not accurately reflect left ventricular filling pressure.
Derived Variables
Other physiologically important information can be calculated from directly measured hemodynamic variables. Table 20-2 lists these calculated hemodynamic variables.
TABLE 20-2
Calculated Hemodynamic Variables
| Variable | Normal Range | Formula |
| Cardiac index (CI) | 2.5-4.0 L/min/m2 | CO/BSA |
| Stroke volume (SV) | 60-130 mL/beat | CO/HR |
| Stroke volume index (SVI) or stroke index (SI) | 30-50 mL/m2 | SV/BSA |
| Systemic vascular resistance (SVR) | 900-1400 dynes • sec • cm−5 | ([MAP − RAP]/CO) × 80 |
| Systemic vascular resistance index (SVRI) | 1700-2600 dynes • sec • cm−5 | ([MAP − RAP]/CI) × 80 |
| Pulmonary vascular resistance (PVR) | 100-250 dynes • sec • cm−5 | ([MPAP − PCWP]/CO) × 80 |
| Pulmonary vascular resistance index (PVRI) | 200-450 dynes • sec • cm−5 | ([MPAP − PCWP]/CI) × 80 |
| Left ventricular stroke work index (LVSWI) | 40-75 g-m/m2/beat | SI × (MAP − PCWP) × 0.0136 |
| Right ventricular stroke work index (RVSWI) | 4-8 g-m/m2/beat | SI × (MPAP − CVP) × 0.0136 |
The cardiac index (CI) is the cardiac output divided by the body surface area (BSA) in square meters. BSA is related to height and weight and is correlated with body mass (see the DuBois body surface area chart in Appendix IV). People of different sizes can be compared by indexing the cardiac output to BSA. For example, a basketball player who is 7 feet tall has a higher cardiac output than an average person who is 5 feet, 10 inches tall. Both individuals have similar CIs, which are obtained by dividing cardiac output by BSA. A CI less than 2.5 L/min/m2 indicates a generalized state of low blood flow and poor peripheral circulation, implying poor myocardial contractility or greatly reduced blood volume.6
The systemic circulation driving pressure is equal to the difference between MAP (the beginning point of the systemic circulation) and mean right atrial pressure (the end point of the systemic circulation). This difference divided by cardiac output yields SVR in mm Hg/L/min. Multiplying the SVR by 80 changes mm Hg/L/min to centimeter-gram-second (CGS) units of measure, commonly designated in the clinical setting as dynes • sec • cm−5 (see Table 20-2 and Chapter 6).
Left and right ventricular stroke work indices indicate left and right ventricular contractility and oxygen consumption. Stroke work index is a measure of how hard the ventricle must contract to move blood through the vascular system. In terms of classic physics, work is done when a force moves a mass a given distance (work = force × distance). In the heart, force is the average pressure the ventricle generates, and distance is the volume of blood ejected (stroke volume). The differences between the ventricles’ end-diastolic pressures and their corresponding MAPs are the average pressures the ventricles must generate to eject their stroke volumes during contraction. Clinical indicators of end-diastolic pressures for the right and left ventricles are the right atrial pressure and PCWP. The pressure that the left ventricle generates during contraction is the numerical difference between MAP and PCWP, and for the right ventricle, it is the difference between MPAP and the right atrial pressure. Multiplying both pressure differences by the stroke indices produces the stroke work index for the left and right ventricles. The multiplication of the stroke work index by 0.0136 converts the units to gram-meters/m2/beat, which is the standard unit used in medicine to express cardiac work (see Table 20-2).
If the left ventricle loses its contractility, it cannot perform much work because it cannot pump much blood; the left ventricular stroke work index decreases. At the same time, myocardial oxygen consumption decreases because the heart performs less work. Table 20-3 summarizes the clinical hemodynamic indicators of the heart’s preload, afterload, and contractility.
TABLE 20-3
Clinical Indicators of Preload, Afterload, and Contractility
| Cardiac Factor | Clinical Indicator | Influencing Factors |
| Preload | ||
| Left ventricle | PCWP | Blood volume, contractility, intrapleural pressure (positive pressure ventilation) |
| Right ventricle | RAP (CVP) | |
| Afterload∗ | ||
| Left ventricle | MAP, SVR, SVRI | Vessel diameter, blood volume and viscosity, contractility∗ |
| Right ventricle | MPAP, PVR, PVRI | |
| Contractility | ||
| Left ventricle | LVSWI, SV, SVI, CI | Functional muscle mass, electrolyte balance (K+, Ca++), sympathetic neural activity, acid-base balance |
| Right ventricle | RVSWI | |
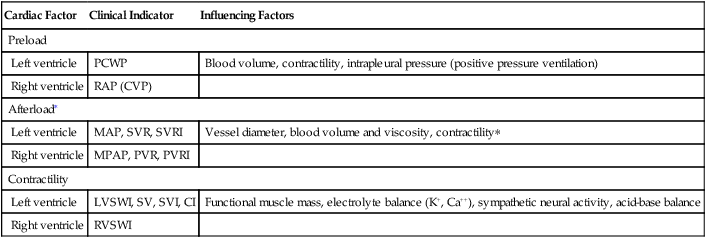
∗Decreased left ventricular contractility influences right ventricular afterload.
Significance of Pulmonary Capillary Wedge Pressure Measurement
Capillary Hydrostatic Pressure
When the PCWP increases to greater than 18 mm Hg, early clinical signs of pulmonary edema generally appear on the chest x-ray image. At a PCWP greater than 25 mm Hg, the chest x-ray film shows obvious evidence of pulmonary edema.6 The PCWP provides valuable information about the effects of intravenous fluid infusions in hemodynamically unstable patients.
Left Ventricular Preload
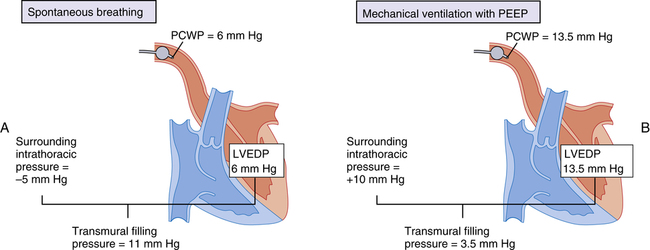
Clinical Focus 20-2 Interpretation of Pulmonary Capillary Wedge Pressure in the Presence of Mechanical Ventilation and Positive End Expiratory Pressure
The relationship between PCWP and left ventricular filling pressure is especially important in mechanically ventilated patients with PEEP. True left ventricular filling pressure is the pressure distending the ventricular wall—that is, the pressure inside the ventricle minus the pressure outside the ventricle. The pressure outside the ventricle is the surrounding intrathoracic pressure. Figure 20-16, A, represents normal, spontaneous breathing conditions when LVEDP is 6 mm Hg. The pulmonary artery catheter senses this pressure as PCWP of 6 mm Hg. The intrathoracic pressure is −5 mm Hg, producing a transmural (across the wall) filling pressure of 11 mm Hg. In Figure 20-16, B, mechanical ventilation and PEEP have increased mean intrathoracic pressure from −5 mm Hg to +10 mm Hg for a total increase of 15 mm Hg. About half of this pressure increase (7.5 mm Hg) is transmitted into the ventricle, increasing LVEDP from 6 mm Hg to 13.5 mm Hg. The pulmonary artery catheter measures PCWP of 13.5 mm Hg, an apparent increase in filling pressure. However, the transmural filling pressure is only 3.5 mm Hg, an actual decrease in filling pressure compared with spontaneous breathing. (The transmural filling pressure is obtained by subtracting the new intrathoracic pressure [10 mm Hg] from LVEDP [13.5 mm Hg].) In this case, increased PCWP inaccurately signaled an increase in left ventricular filling pressure. PCWP must be interpreted with caution when mechanical ventilation with PEEP is used. A clinical rule of thumb is to subtract about one half (with normal lung compliance) to one fourth (with low lung compliance) of PEEP from PCWP to estimate true filling pressure. Generally, this adjustment needs to be made only when PEEP is greater than 15 cm H2O.
Clinical Application of Hemodynamic Measurements
Use of Ventricular Function Curves
In the 1970s, Forrester et al.6 identified four distinct quadrants on the ventricular function graph that correlated with specific clinical signs in patients with myocardial infarctions. (This analysis also can be applied to hemodynamic conditions not associated with myocardial infarction.) Figure 20-17 identifies the four hemodynamic subsets. Forrester found that people with PCWP greater than 18 mm Hg had clinical signs of pulmonary edema and that people with CI less than 2.2 L/min/m2 had clinical signs of peripheral hypoperfusion.
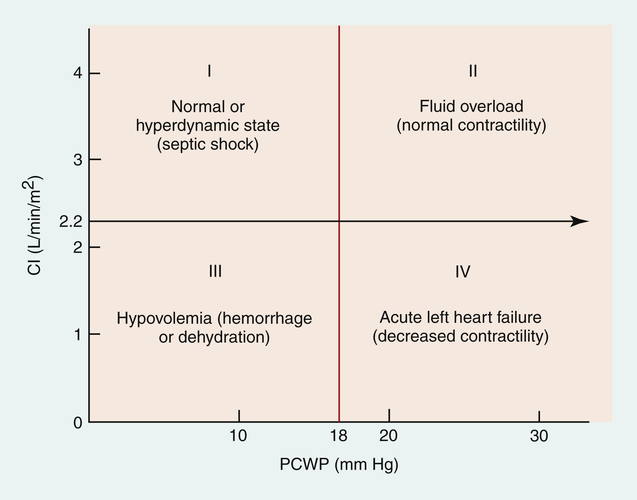
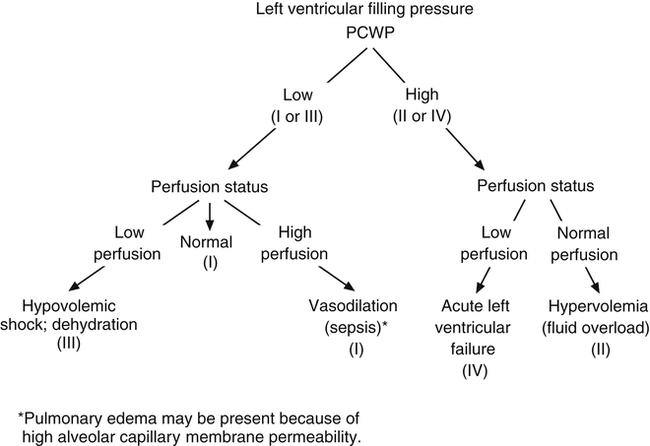
This analysis provides insight into a person’s hemodynamic condition. A PCWP of 5 mm Hg and CI of 1.5 L/min/m2 are consistent with a loss of blood volume, as is found with hemorrhage (see subset III in Figure 20-17). A PCWP of 25 mm Hg and CI of 1.5 L/min/m2 are consistent with left ventricular pumping failure (see subset IV in Figure 20-17). Hypervolemia, also called fluid overload, is characterized by high PCWP but increased peripheral perfusion (see subset II in Figure 20-17). Subset I is associated with normal pulmonary and peripheral perfusion status. An exception occurs in patients with septic shock, who often experience massive vasodilation. These patients may have abnormally high cardiac output even though preload (PCWP) is normal or low. These patients also fall into subset I; their hemodynamic status is characterized as hyperdynamic; cardiac output is abnormally high secondary to greatly reduced SVR. Although pulmonary capillary pressure is often normal, patients with septic shock may nevertheless have pulmonary edema because sepsis is associated with alveolar capillary membrane injury and high permeability. Figure 20-18 shows examples of conditions described by the four hemodynamic subsets.
Principles of Clinical Management
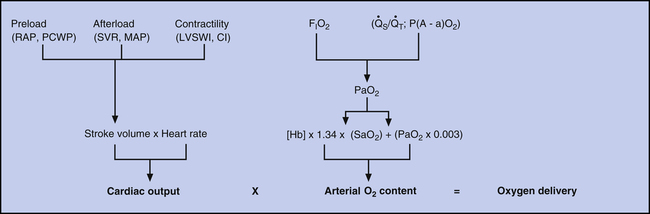
A major goal in clinical management of critically ill patients is maintaining adequate tissue oxygenation, which must be kept in mind when hemodynamic information is interpreted. Figure 20-19 illustrates hemodynamic and pulmonary factors that determine oxygen delivery to the tissues. Arterial oxygen content is determined by the lung’s ability to transfer oxygen into the blood and by the blood’s hemoglobin concentration. Cardiac output is determined by the heart rate and stroke volume. Stroke volume is determined by preload, afterload, and contractility.
Abnormal Preload
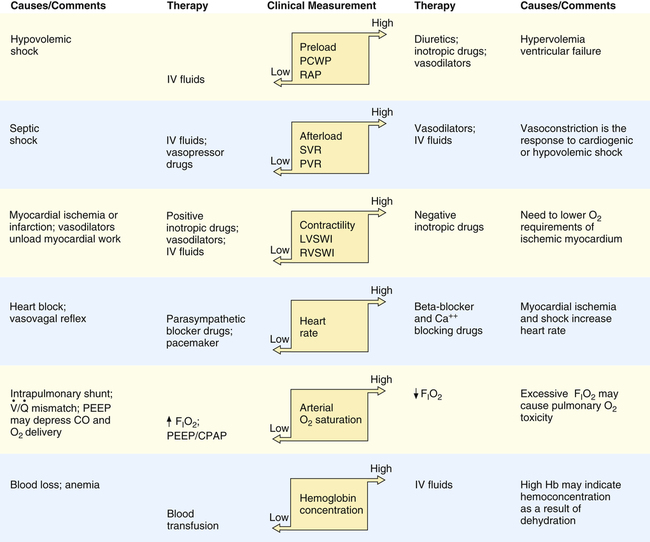
If PCWP is elevated, clinicians should investigate factors in the patient that cause high preload, such as hypervolemia and ventricular failure. High intrapleural pressure induced by mechanical ventilation also could be a cause of elevated PCWP, although this does not increase the preload. If hypervolemia is the cause, measures that reduce blood volume are needed, such as administration of diuretic drugs. Ventricular failure may be addressed by at least two different approaches: (1) administration of vasodilator drugs to reduce ventricular afterload and (2) administration of drugs that increase contractility (inotropic drugs). Both drugs improve pumping effectiveness and reduce preload. If high mechanical ventilation pressures are the problem, measures to reduce mean intrapleural pressures are taken. Similarly, when PCWP is low, especially if accompanied by a low cardiac output, intravenous fluids should be infused. Figure 20-20 illustrates these general principles of management.

Abnormal Afterload
Clinical Focus 20-3 Differentiating Myocardial Infarction from Pulmonary Embolus
Other vital signs are as follows:
Are these findings consistent with a myocardial infarction and acute left heart failure?
Both left ventricular failure and severe blood loss may decrease cardiac output and blood pressure; either condition can result in increased SVR.
In left ventricular failure, the increased afterload imposed by vasoconstriction increases myocardial work and oxygen demand, possibly worsening ventricular failure. Such circumstances call for vasodilator drugs to better balance the heart’s oxygen supply and demand.5,6 If the resistance to ejection is reduced, the percentage of ventricular volume ejected for a given contraction force increases without increasing oxygen demand. Although vasodilators decrease SVR, the subsequent increase in stroke volume and cardiac output tend to prevent a further fall in blood pressure. However, if blood pressure decreases after vasodilation, infusion of intravenous fluids may be necessary to maintain adequate preload and cardiac output.5 When SVR is reduced and fluids are infused, inotropic drugs can be administered cautiously to increase myocardial contractility if necessary. The benefits of drugs that increase contractility must be weighed against the increased work and oxygen requirement this places on the myocardium; it may be appropriate to use negative inotropic drugs to decrease contractility and myocardial oxygen demand.5 If increased SVR is caused by blood loss and hypovolemia, administration of intravenous fluids and possibly blood is indicated. Restoration of the blood volume eliminates compensatory vasoconstriction.
Massive sepsis-induced vasodilation (septic shock) presents a special problem because it may not respond to conventional vasoconstrictors. Overproduction of nitric oxide by the vascular endothelium is an important mechanism of vasodilation in septic shock.7 Nitric oxide synthase inhibitors (agents that inhibit nitric oxide production) have been investigated for their potential role in treating patients with septic shock, but studies have yielded controversial results.
Abnormal Contractility
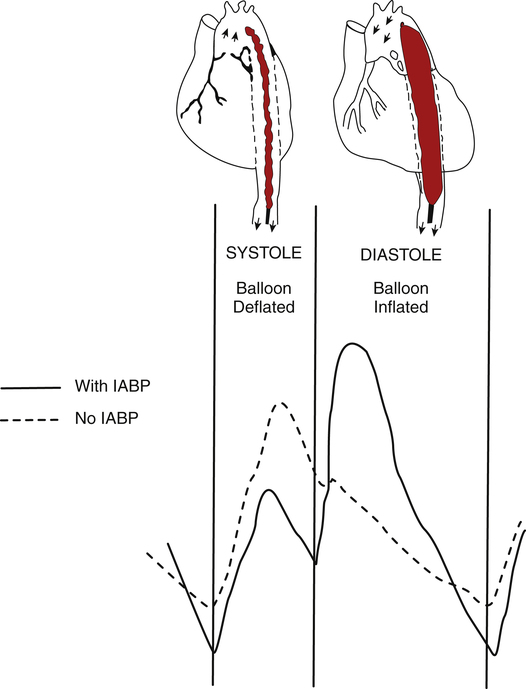
Myocardial infarction means functional heart muscle mass is reduced, which decreases contractility. The initial approach to this problem is generally intravenous fluid infusion if fluid overload and pulmonary edema are not present.8 In some failing hearts, PCWP may need to be maintained above normal levels to sustain an adequate cardiac output.5 On the other hand, if cardiogenic pulmonary edema is present, diuretics may be required to reduce fluid volume; diuretics are especially indicated in chronic heart failure in which compensatory renal fluid retention results in hypervolemia. After fluid volume has been optimized, afterload-reducing agents, or vasodilator drugs, are used to reduce myocardial work and oxygen requirements. Inotropic drugs may then be administered to increase contractility if intravascular fluid volume is adequate. The larger the myocardial infarction, the less effective are inotropic drugs because less functional myocardium is available to respond to the inotropic drug. A major concern in administration of inotropic drugs is that these agents may worsen myocardial ischemia by increasing myocardial work and oxygen demand.9 Afterload must be reduced and intravascular volume optimized before driving the heart with inotropic drugs. An increase in the ischemic heart’s contractility when preload is low may precipitate or further extend myocardial infarction.9,10 Inotropic drugs that also have peripheral vasodilator effects lessen this risk; these drugs include dobutamine (Dobutrex), amrinone (Inocor), and milrinone (Primacor). The intraaortic balloon pump (IABP) may be beneficial in reducing afterload in this situation (see Clinical Focus 20-5 and Figure 20-21).
Drugs that dissolve blood clots (fibrinolytic therapy) improve the survival of patients with acute coronary artery occlusion, especially if the drug is given within 2 hours of the occlusion.11 If given early enough, these drugs restore blood flow to the ischemic area of the heart before infarction can occur. Fibrinolytic intravenous drugs include tissue plasminogen activator (tPA) and streptokinase.
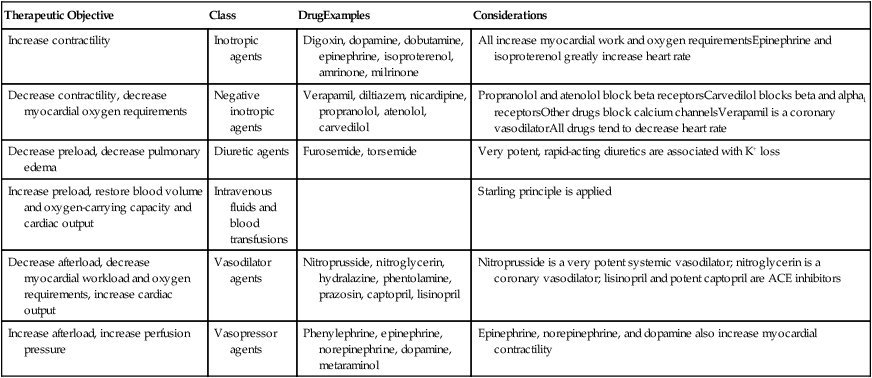
Other causes of decreased myocardial contractility include electrolyte (particularly potassium and calcium ions) and acid-base imbalances. Treatment involves infusing appropriate electrolytes and correcting acid-base disturbances. Oxygen administration is also essential to maximize myocardial oxygenation. Figure 20-20 provides the general principles of management based on hemodynamic information. Table 20-4 lists expected hemodynamic values in specific clinical conditions. Table 20-5 lists examples of drugs that alter hemodynamic values.
TABLE 20-4
Expected Hemodynamic Changes in Specific Clinical Conditions
| Condition | Evidence of Pulmonary Edema | PCWP | PAP | PVR | CO | SVR | MAP |
| Hypovolemic shock | No | Decreased | Variable | Normal | Decreased | Increased | Decreased |
| Septic shock | Often | Normal/decreased | Variable | Variable | Increased | Decreased | Decreased |
| Cardiogenic shock (left ventricular failure) | Yes | Increased | Increased | Normal | Decreased | Increased | Decreased |
| Pulmonary embolus | No | Normal | Increased | Increased | Variable | Normal | Normal |
| Acute respiratory distress syndrome | Yes | Normal/decreased | Variable | Variable | Variable | Variable | Variable |
| Dehydration | No | Decreased | Decreased | Variable | Decreased | Increased | Decreased |
| Mechanical ventilation with PEEP∗ | Dependent on accompanying condition | Increased | Normal/increased | Normal/increased | Normal/increased | Normal/increased | Normal/decreased |
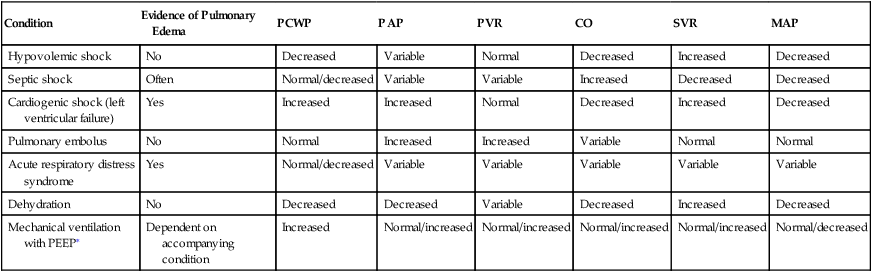
∗Effect of mechanical ventilation depends on left ventricular function and mean intrathoracic pressure.
TABLE 20-5
Hemodynamic Effects of Cardiovascular Drugs
| Therapeutic Objective | Class | DrugExamples | Considerations |
| Increase contractility | Inotropic agents | Digoxin, dopamine, dobutamine, epinephrine, isoproterenol, amrinone, milrinone | All increase myocardial work and oxygen requirementsEpinephrine and isoproterenol greatly increase heart rate |
| Decrease contractility, decrease myocardial oxygen requirements | Negative inotropic agents | Verapamil, diltiazem, nicardipine, propranolol, atenolol, carvedilol | Propranolol and atenolol block beta receptorsCarvedilol blocks beta and alpha1 receptorsOther drugs block calcium channelsVerapamil is a coronary vasodilatorAll drugs tend to decrease heart rate |
| Decrease preload, decrease pulmonary edema | Diuretic agents | Furosemide, torsemide | Very potent, rapid-acting diuretics are associated with K+ loss |
| Increase preload, restore blood volume and oxygen-carrying capacity and cardiac output | Intravenous fluids and blood transfusions | Starling principle is applied | |
| Decrease afterload, decrease myocardial workload and oxygen requirements, increase cardiac output | Vasodilator agents | Nitroprusside, nitroglycerin, hydralazine, phentolamine, prazosin, captopril, lisinopril | Nitroprusside is a very potent systemic vasodilator; nitroglycerin is a coronary vasodilator; lisinopril and potent captopril are ACE inhibitors |
| Increase afterload, increase perfusion pressure | Vasopressor agents | Phenylephrine, epinephrine, norepinephrine, dopamine, metaraminol | Epinephrine, norepinephrine, and dopamine also increase myocardial contractility |
Clinical Focus 20-6 Therapeutic Options for Abnormal Hemodynamic Conditions
Room air arterial blood gas values are as follows:
High PCWP: Left ventricular contractility loss, pump failure, pulmonary edema of cardiac origin
CI: 3.5 ÷ 1.75 m2 = 2.0 L/min/m2 (subset IV in Figure 20-17, consistent with acute left heart failure)
Stroke index: Stroke volume/BSA = (3500 mL/min ÷ 125) ÷ 1.75 m2 = 16 mL/m2
Left ventricular stroke work index: (83.3 − 23) × 16 × 0.0136 = 13.1 g-m/m2/beat
Low left ventricular stroke work index confirms decreased left ventricular contractility (see Table 20-2).
Oxygen delivery is as follows:
1. Decrease myocardial work and oxygen requirements, while improving cardiac output—you must decrease SVR (afterload) and therefore will administer vasodilators.
2. Increase myocardial contractility—after reducing afterload, you may administer inotropic drugs to increase cardiac output further without overworking the heart.
3. Decrease PCWP to allow resolution of pulmonary edema and improve oxygenation—therapy administered in the first two steps addresses this goal. Improved pumping effectiveness decreases left atrial and pulmonary vascular pressures.
What type of problem is this patient experiencing, and why does she have pulmonary edema?
The pulmonary edema is not caused by high pulmonary capillary pressures because PCWP is normal. Although CI is above normal, the patient has systemic hypotension; this is caused by low SVR (see Table 20-2 for normal values). Considering the history of her illness, you should suspect septic shock; the urinary tract infection has probably developed into a generalized septicemia, which explains the low SVR, high CI, and pulmonary edema. Bacterial endotoxins dilate the systemic vasculature, decreasing afterload and increasing cardiac output. These endotoxins also injure the alveolar capillary membrane, increasing its permeability. Even at normal capillary pressures, pulmonary edema is present; this edema may be called noncardiogenic edema or high permeability pulmonary edema. Treatment includes intravenous fluids to maintain blood pressure, antibiotics, and vasopressors.