Chapter 16 Computed tomography of the liver, biliary tract, and pancreas
Imaging Overview
Technologic advances have dramatically expanded the role of computed tomography (CT) in hepatobiliary and pancreatic imaging. New developments in CT technology, image display, and three-dimensional postprocessing have broadened the role of CT in patients with hepatobiliary and pancreatic disease. The role of imaging has extended beyond lesion detection to vascular mapping, assessment of tumor vascularity, and surgical planning (see Chapter 90A, Chapter 90B, Chapter 90C, Chapter 90D, Chapter 90E, Chapter 90F ). As technology continues to be refined, CT remains the main imaging modality for evaluating the liver and pancreas.
Technical Advances
Helical CT has undergone another major advance with the development of a new class of multidetector array scanners (MDCTs), which use a substantially greater percentage of the x-rays emitted from the tube cathode. This improves tube efficiency and permits even faster scanning. Multiple acquisitions through the liver may be obtained in a single breath hold to obtain images in the early and late arterial phases. Early arterial phase images are useful to identify variant vascular anatomy before hepatic arterial embolization, prior to placement of a hepatic arterial chemoinfusion pump, or before hepatic resection. Late arterial phase images are useful in the detection of hypervascular hepatic lesions. MDCT also allows thinner collimation (submillimeter), which improves resolution and increases detection of small hepatic lesions by 46% (Weg et al, 1998).
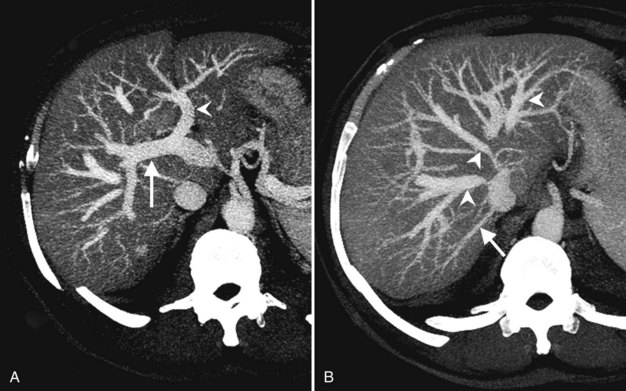
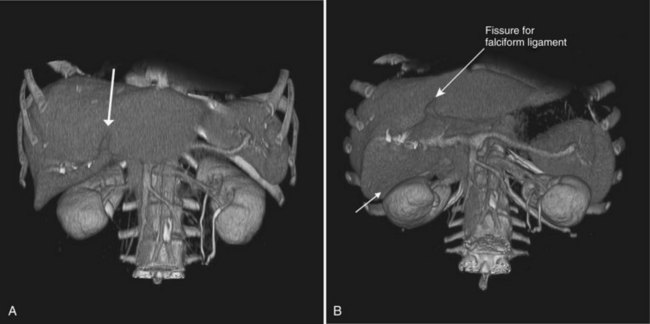
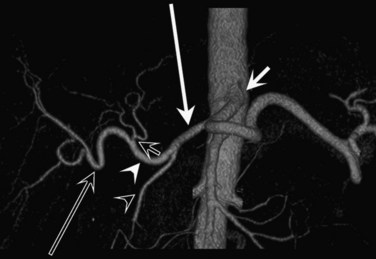
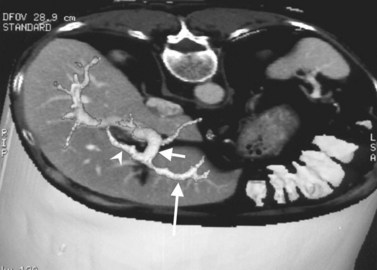
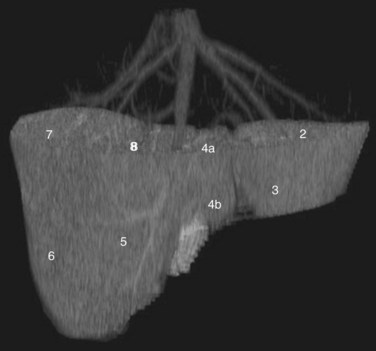
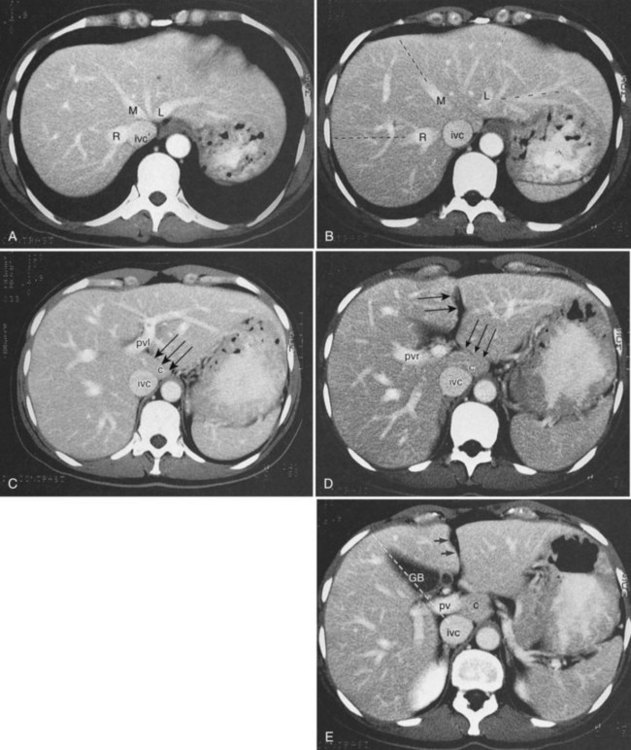
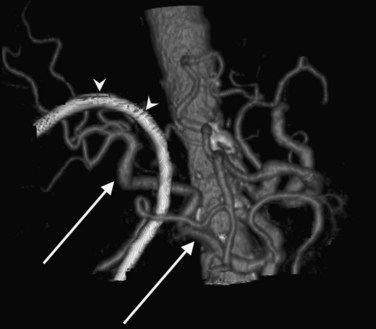
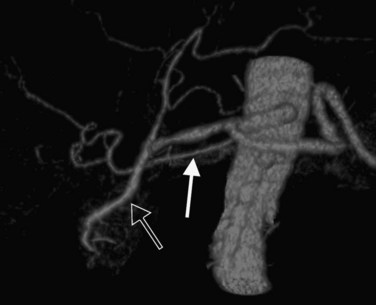
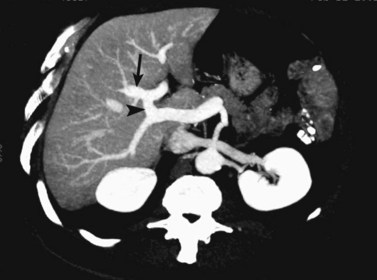
CT data are acquired in volumetric data sets that can be postprocessed on a three-dimensional workstation. The generation of 16-slice MDCT scanners acquires isotropic voxels that are essentially perfect cubes of information, resulting in three-dimensional models without image distortion. Several different types of postprocessing techniques are available (Salgado et al, 2003). Maximum intensity projection (MIP) images depict only the brightest structures within the volume of data (Johnson et al, 1996, 2003; Magnusson et al, 1991; Rubin, 2003; Salgado et al, 2003; Zeman et al, 1994). When focusing on the liver in the portal venous phase of contrast enhancement, MIP images produce a concise depiction of portal venous and hepatic venous anatomy (Fig. 16.1). Volume-rendered reconstructions provide a lifelike three-dimensional model of complex anatomy that can be rotated in any direction (Fig. 16.2; Johnson et al, 1996, 2003; Rubin, 2003; Zeman et al, 1994). This type of reformatting transforms the numerous axial images into an interactive three-dimensional model. Hepatic arterial anatomy can be displayed with a three-dimensional model composed of reconstructed axial images (Fig. 16.3). The relationship of tortuous vessels to the hepatic parenchyma and lobar anatomy can be depicted clearly (Fig. 16.4). It is also possible to view a rotating model that depicts the relationship of a mass to the adjacent vessels from any angle to help the surgeon conceptualize preoperatively what would be encountered at surgery (Fig. 16.5; see Chapter 90A, Chapter 90B, Chapter 90C, Chapter 90D, Chapter 90E, Chapter 90F, Chapter 92 ).
Role of Computed Tomography in Liver and Biliary Imaging
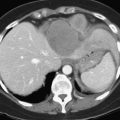
CT is particularly valuable in planning for hepatic resection. Using the contrast-enhanced portal and hepatic veins as anatomic landmarks, the radiologist can localize tumors into the specific hepatic segments (Fig. 16.6). The proximity of tumor to the major portal pedicles, hepatic veins, and inferior vena cava (IVC) is evident, and this information determines the extent of hepatic resection required to achieve clear surgical margins (Figs 16.7 and 16.8). CT can also help predict whether sufficient hepatic reserve will exist after hepatic resection (see Chapter 90A, Chapter 90B, Chapter 90C, Chapter 90D, Chapter 90E, Chapter 90F, Chapter 92 ). Hepatic atrophy (Fig. 16.9), resulting from biliary obstruction with or without portal venous occlusion, and compensatory hypertrophy can be identified on CT. Fatty infiltration and hepatic cirrhosis, processes that affect the remnant liver’s ability to regenerate, are apparent. CT angiography can identify the arterial supply to tumor and can delineate the extent of tumor involvement along the arteries.
An important additional role of CT angiography for evaluating patients with hepatobiliary malignancy is the delineation of variant arterial anatomy, which occurrs in more than half of the population (Michels, 1955). Visualization of the surgical field often can be limited in patients with hepatobiliary malignancy, especially with prior surgery, if the patient is obese, or when local inflammation is present, such as that accompanying a biliary stent. Preoperative knowledge of variant anatomy can assist in surgical planning (see Chapter 90, 92 ), facilitate surgical dissection, and help avoid iatrogenic injury (Winston et al, 2007). CT angiography is a noninvasive alternative to direct catheter angiography for preoperative planning before placement of an intraarterial chemoinfusion pump (Kapoor et al, 2003; see Chapter 86).
Technique
State-of-the-art CT evaluation of the liver for hepatic resection includes contrast-enhanced CT and CT angiography. The specific protocols vary with the specific tumor type being evaluated, but most hepatic neoplasms are low attenuation on contrast-enhanced CT and are evaluated best during the portal venous phase of imaging. Hypervascular neoplasms, such as hepatocellular carcinoma (HCC) and metastatic neuroendocrine tumors, are evaluated using a triphasic protocol including non–contrast-enhanced CT, hepatic arterial phase images, and portal venous phase images (Fig. 16.10). Oral contrast medium is administered routinely for CT, but water is substituted when CT angiography is performed. Routine hepatic parenchymal imaging generally is performed using 5-mm slices.
Non–Contrast-Enhanced Computed Tomography of the Liver
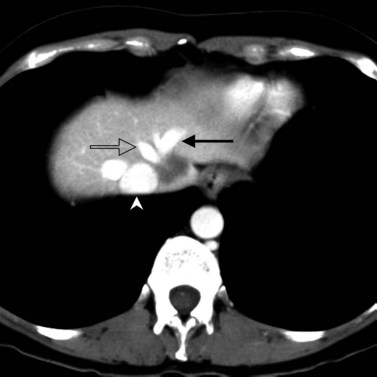
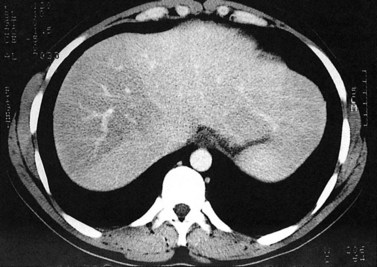
The attenuation value of the normal liver typically varies between 54 and 60 Hounsfield units (HU), which is approximately 8 HU greater than that of the spleen, owing to glycogen and iron stores in the liver. Increased density may be seen in hemochromatosis, glycogen storage disease, Wilson disease, β-thalassemia, sickle cell disease, and with certain drugs (amiodarone, cisplatin). A false appearance of increased hepatic density may occur in anemia, in which the decreased attenuation of the blood pool gives the impression of increased hepatic density relative to the intrahepatic vessels. Decreased hepatic density most frequently is related to fatty infiltration of the liver or occasionally secondary to hepatic edema. Noncontrast CT is useful for detecting diffuse abnormalities, such as hemochromatosis or fatty infiltration (Figs. 16.11 and 16.12), in which the attenuation of the liver is increased (hemochromatosis) or decreased (fatty infiltration). Both of these processes may be obscured by the administration of intravascular contrast medium. Hemorrhage or faint calcifications also are better visualized on unenhanced CT (Fig. 16.13).
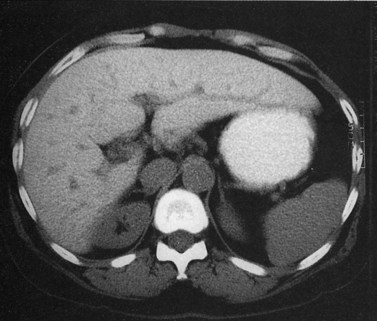
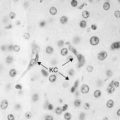
FIGURE 16.13 Unenhanced computed tomography reveals numerous calcifications in a patient with amyloid.
Hepatic neoplasms usually have a high water content, resulting in relative hypoattenuation compared with liver parenchyma. The portal veins and bile ducts also are of lower attenuation than liver parenchyma, and a vessel running vertically through a section may mimic a small tumor, leading to errors in diagnosis. On unenhanced studies, the attenuation difference between liver and tumor may be subtle and may require viewing at very narrow window widths to allow focal lesion detection, but much higher lesion-to-liver attenuation difference can be achieved by the administration of intravenous contrast medium (Tidebrant et al, 1990).
Contrast-Enhanced Computed Tomography of the Liver
The administration of an iodinated contrast agent serves many purposes in hepatic CT imaging, including improved lesion detection and characterization and better vascular mapping. Because a precise rate of injection is essential to image quality, a dedicated power injector is required. Different methods are commercially available to determine the time of maximal arterial enhancement for each patient, depending on factors such as cardiac function and state of hydration (Sica et al, 2000).
Lesion conspicuity is enhanced when there is maximal contrast between a lesion and the surrounding parenchyma. The liver receives 75% to 80% of its blood supply from the portal venous system and only 20% to 25% from the hepatic artery; however, the majority of liver tumors receive most of their blood supply from the hepatic arterial system (Honda et al, 1992). The noncirrhotic liver displays maximal contrast enhancement at approximately 70 seconds from the start of the intravenous administration of contrast medium. At this time, referred to as the portal venous phase of enhancement, maximal contrast between a liver lesion and the surrounding parenchyma is seen with clear delineation of the portal and hepatic veins. Routine evaluation of the liver should be performed using portal venous phase imaging.
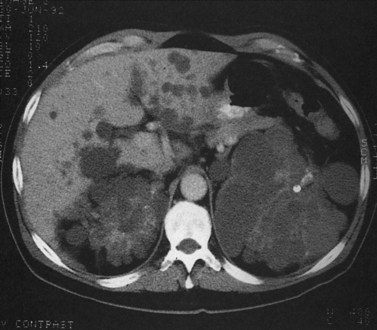
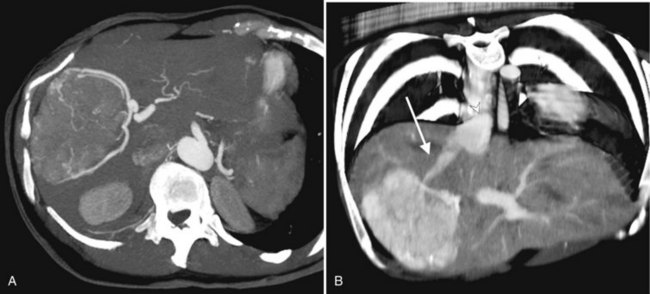
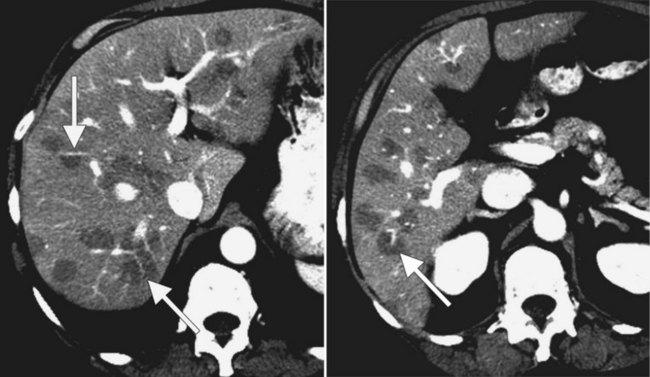
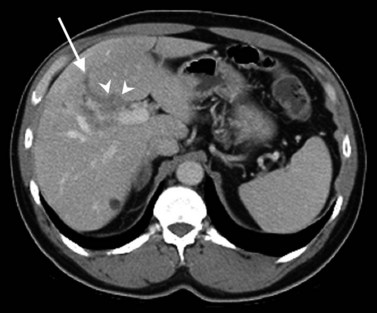
The pattern of contrast enhancement also is important for lesion characterization. Certain lesions, such as focal nodular hyperplasia (FNH) and hemangiomata (discussed in greater detail later in this chapter), have specific patterns of enhancement on arterial phase and portal venous phase images. Hypervascular malignant neoplasms, such as HCC and metastatic neuroendocrine carcinoma, display prominent contrast enhancement and increased lesion conspicuity on the arterial phase images, but these lesions may become isodense to the remaining liver and and may be invisible on the portal venous phase images (Fig. 16.14). When HCC or neuroendocrine mestastases are suspected, arterial phase images should be acquired in addition to the routine portal venous phase images.
Lesion Evaluation
In a patient with multiple hepatic lesions, each lesion should be evaluated independently, because benign and malignant lesions may coexist (Fig. 16.15). Mistaking an incidental benign lesion for a malignant mass has clear and potentially important implications in patient management, perhaps leading to unnecessary invasive procedures or resulting in a diagnosis of metastatic disease that alters treatment recommendations. When assessing lesion size for treatment response on serial CT scans, it is important to compare serial, unenhanced CT scans with unenhanced CT scans and to also compare contrast-enhanced scans with contrast-enhanced scans. Nazarian and colleagues (1999) showed that colorectal metastases appeared different in size on pre–contrast-enhanced and post–contrast-enhanced CT scans obtained as part of the same examination. On average, hepatic metastases from colorectal carcinoma appeared significantly smaller after contrast media administration (Nazarian et al, 1999).
Anatomy
Gross Morphology
Three scissurae interrupt the surface of the liver and help define its segmentation (see Chapter 1B). The interlobar fissure is an incomplete structure that defines the inferior separation between the right and the left liver; the scissura here is generally difficult to identify on axial CT, but its position may be estimated, because it is orientated in a vertical plane defined by the gallbladder fossa inferiorly (Fig. 16.16) and the middle hepatic vein superiorly. The gallbladder lies in the main interlobar scissura on the inferior surface of the liver. Three-dimensional reformatting of axial CT data provides a clear depiction of the interlobar scissura and its relationship to the hepatic segments (see Fig. 16.6).
Segmental Anatomy
The segmental anatomy of the liver is based on both the hepatic venous outflow and the inflow pedicles. A functional scheme that corresponds to the liver anatomy and is useful surgically has been described (Bismuth, 1982). The three main hepatic veins divide the liver into four sectors, each of which is independent in that it receives a separate portal venous and hepatic arterial supply and is drained by a separate bile duct. The middle hepatic vein divides the liver into a right and left liver. The right liver is divided into two sectors by the right hepatic vein, and the left liver is divided similarly by the left hepatic vein. Because axial CT readily shows the course of all three major hepatic veins on contrast-enhanced scans obtained near the diaphragm, the major hepatic sectors are easy to identify at this level. The inferior boundary between the anterior and posterior sectors of the right lobe has to be estimated by extrapolating the line of the right hepatic vein onto lower sections. An imaginary line drawn between the IVC and the gallbladder divides the right and left liver on caudal sections and corresponds to the line of the middle hepatic vein. Three-dimensional reformatting can assist in localization of the hepatic segments (see Fig. 16.6). The fissure for the ligamentum teres divides the medial and lateral segments of the left liver and corresponds to the line of the left hepatic vein. The anterior and posterior sectors of the right lobe are subdivided into inferior (V and VI) and superior (VIII and VII) segments. The right portal vein runs horizontally as it enters the right liver, and this level demarcates the anterior and posterior sectors.
Vascular Anatomy
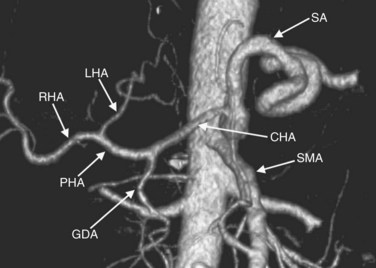
In classic arterial anatomy (see Chapter 1B), the celiac axis gives rise to the common hepatic artery, which bifurcates into the proper hepatic artery and the gastroduodenal artery (see Fig. 16.3). The proper hepatic artery divides into the right and left branches before entering the liver, but the point at which the proper hepatic artery gives rise to the left and right hepatic arteries varies. Although classic arterial anatomy is the most common pattern seen, variant hepatic and celiac arterial anatomy has been reported in 55% of patients based on initial cadaveric dissections by Michels (1955). Many of these variants have significance for preoperative planning and surgical management. Preoperative knowledge of variant anatomy can assist in selection of treatment options and in surgical planning, and it facilitates surgical dissection and may help avoid iatrogenic injury (Figs. 16.17 and 16.18).
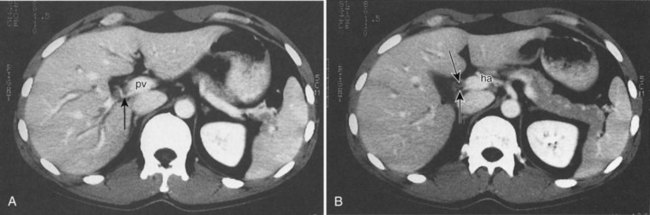
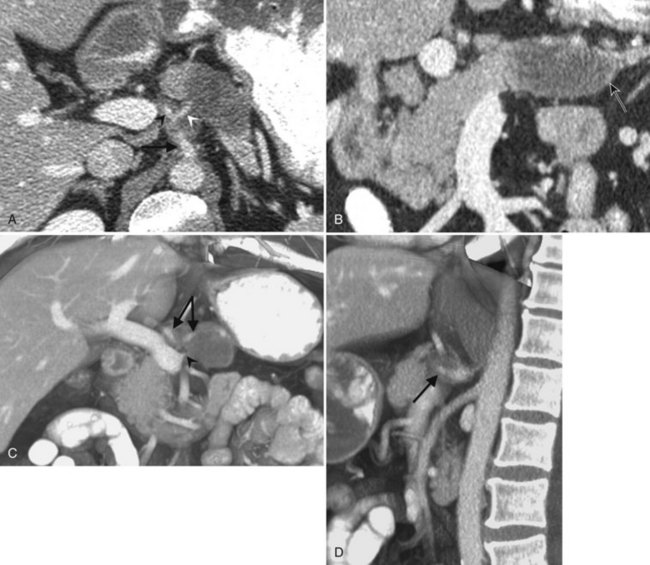
The portal vein originates at the junction of the splenic vein (SV) and superior mesenteric vein (SMV), immediately posterior to the neck of the pancreas. It courses toward the right and cephalad, as it enters the hepatoduodenal ligament. Within this ligament, the portal vein courses parallel to the proper hepatic artery, which lies on its anteromedial surface, and the common bile duct, which lies on its anterolateral surface. After entering the hepatic parenchyma, the portal vein branches to supply each portal sector (see Fig. 16.1A) and subsequently each segment. A spectrum of portal venous variants has been described, many of which have major implications for safe and efficacious hepatic resection and percutaneous hepatobiliary intervention. Covey and colleagues (2004) reported the presence of variant portal venous anatomy in 35% of a group of 200 patients studied. CT is ideally suited to display these variants, an awareness of which may help avoid iatrogenic injury (Fig. 16.19).
The hepatic veins course between the hepatic sectors and have a short extrahepatic course before joining the IVC (Blumgart et al, 2001). The right hepatic vein drains directly into the IVC, and the middle hepatic vein and left hepatic vein usually join before draining into the IVC. A variable number of retrohepatic veins drain from the posterior aspect of the liver into the IVC, and a large inferior right hepatic vein, referred to as an accessory right hepatic vein, may be present in some patients (see Fig. 16.1B).
Biliary Anatomy
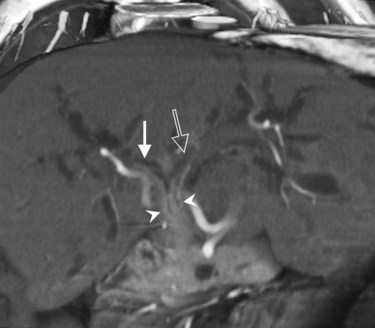
The intrahepatic biliary tree branches in a fashion nearly identical to the portal system (Fig. 16.20; see Chapter 1B). The left and right hepatic ducts form the common hepatic duct, near the lateral margin of the main portal vein, near its junction with the right portal vein. The common hepatic duct continues inferiorly toward the left and posteriorly, and it maintains its anterolateral position with respect to the portal vein throughout its course within the hepatoduodenal ligament. It becomes retroperitoneal at the level of the head of the pancreas and occupies a position on the posterolateral surface of the pancreas, until it joins the pancreatic duct immediately before entering the ampulla of Vater. The confluence of the right and left hepatic ducts is often seen lying anterior to the portal venous confluence.
Visualization of the intrahepatic bile ducts with CT originally was considered to be evidence of biliary obstruction; but with newer scanners and thin collimation, peripheral bile ducts measuring 1 to 3 mm may be seen in normal subjects (Liddell et al, 1990). The common duct, which measures 3 to 6 mm in cross-sectional diameter, is seen as a circular structure of near-water density posterolateral to the head of the pancreas on a postcontrast scan. The CT diagnosis of biliary obstruction is based on the demonstration of dilated intrahepatic or extrahepatic bile ducts. Dilated intrahepatic ducts appear on CT as linear branching or circular structures of near-water density that enlarge as they approach the junction of the left and right hepatic ducts in the porta hepatis. The extrahepatic bile duct is considered unequivocally dilated if it is 9 mm or more in diameter; less than 7 mm is considered normal. High-resolution images and reformatting techniques allow for depiction of the biliary tree on CT that was once impossible (Fig. 16.21).
Benign Tumors and Tumorlike Conditions of the Liver
Cyst (See Chapter 69A, Chapter 69B, Chapter 79A, Chapter 79B )
Hepatic cysts are common and occurr in 2% to 7% of the population (Horton et al, 1999). Hepatic cysts may be either congenital or acquired. Congenital cysts are more common and are thought to be caused by a malformation of a bile duct that has lost its communication with the remainder of the biliary tree. Lined by a single layer of cuboidal or columnar epithelium that secretes fluid, the cyst fills with serous fluid (Blumgart et al, 2001). The acquired type of hepatic cyst is usually secondary to inflammation, trauma, or parasitic disease. Hepatic cysts typically are discovered incidentally and have no malignant potential.
At CT, a hepatic cyst is round or ovoid and sharply defined with an imperceptible wall; it shows water attenuation and does not enhance after administration of an intravenous contrast agent. Although small cysts do not affect the adjacent hepatic parenchyma, very large cysts may result in lobar atrophy with contralateral compensatory hypertrophy (Blumgart et al, 2001).
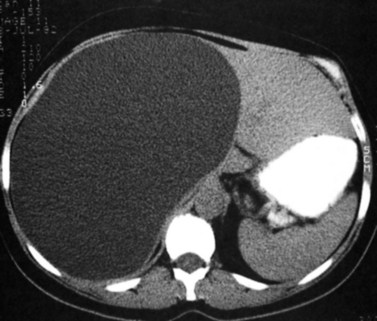
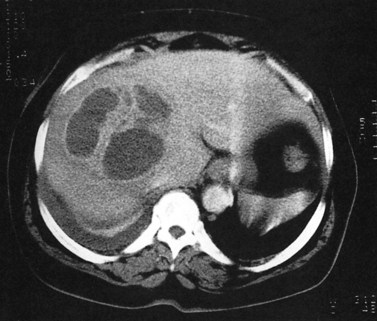
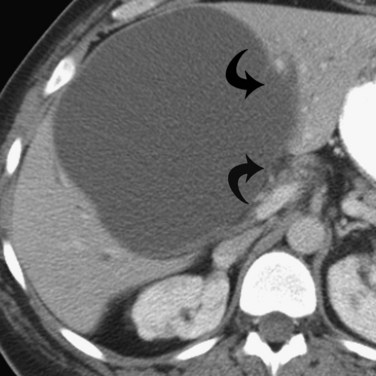
Multiple hepatic cysts may be associated with polycystic renal disease (Fig. 16.22) but may occur in the absence of renal cysts. Occasionally, patients may present with discomfort or biliary obstruction secondary to a large cyst (Fig. 16.23). In such cases, therapeutic intervention may be indicated.
Hemangioma
Hemangiomas (see Chapter 79A, Chapter 79B ) are the most benign solid tumors of the liver (Blumgart et al, 2001). The incidence of cavernous hemangiomata has been reported as 7% in an autopsy series (Karhunen, 1986). Cavernous hemangiomata may range in size from less than 1 cm to greater than 40 cm, referred to as giant hemangiomata (Blumgart et al, 2001). Hemangiomata usually are incidentally detected lesions seen in women (Horton et al, 1999).
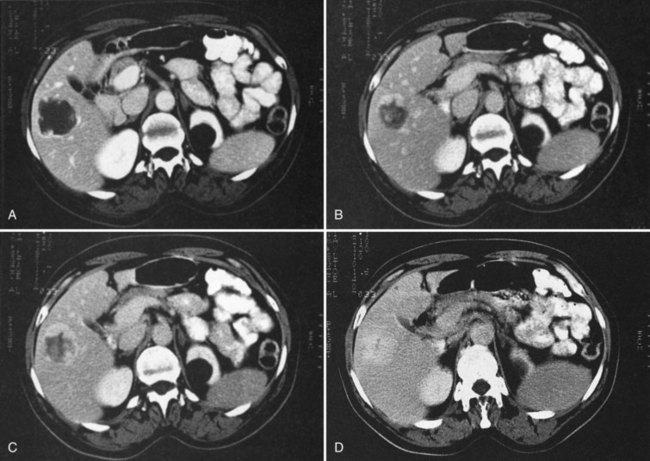
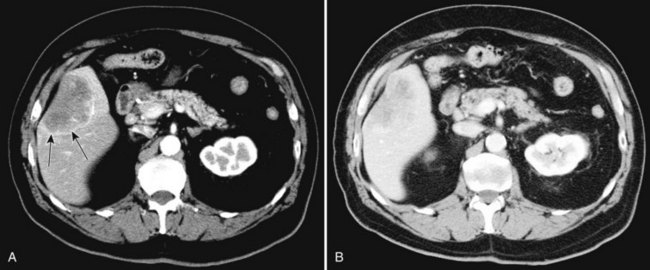
Hemangiomata are composed of endothelium-lined vascular spaces separated by fibrous septa, and they derive their blood supply from the hepatic artery (Horton et al, 1999). On unenhanced CT, a hemangioma has low attenuation compared with the adjacent hepatic parenchyma. After the intravenous administration of contrast material, peripheral globular enhancement is seen on the arterial phase images. The attenuation of the peripheral nodules equals that of the aorta (Quinn & Benjamin, 1992), and venous phase images reveal centripetal enhancement to the center of the lesion (Leslie et al, 1995; Nelson & Chezmar, 1990). Because the peripheral, nodular, clumplike enhancement is seen best on arterial phase images, it is important to acquire images during this phase (Fig. 16.24).
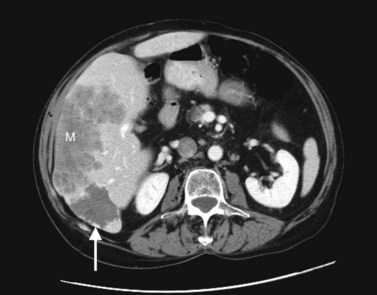
Giant hemangiomata (>6 to 10 cm; Bouras et al, 1996; Mitsudo et al, 1995; Ros et al, 1987) have a heterogeneous appearance with a low-attenuation central scar on unenhanced CT. The low attenuation is attributed to thrombosis, hyalinization, and fibrosis (Ros et al, 1987). The typical early, peripheral, nodular, clumplike enhancement is observed on the arterial phase images, but giant hemangiomata often do not completely fill in with contrast material on delayed images (Fig. 16.25; Vilgrain et al, 2000).
Most hemangiomata do not cause clinical symptoms. However, larger tumors are more likely to cause symptoms such as abdominal pain, increasing abdominal girth, early satiety, and nausea and vomiting (Blumgart et al, 2001). These symptoms are attributed to the rapid expansion of the tumor or thrombosis and infarction resulting in stretching or inflammation of the Glisson capsule (Blumgart et al, 2001). Large hemangiomata can lead to complications such as an inflammatory process manifested by low-grade fever, weight loss, abdominal pain, and elevated erythrocyte sedimentation rate (Takayasu et al, 1990). Other complications include Kasabach-Merritt syndrome, a coagulopathy with systemic fibrinolysis and thrombocytopenia (Maceyko & Camisa, 1991), intratumoral hemorrhage, spontaneous rupture resulting in hemoperitoneum (Vilgrain et al, 2000), and volvulus of a pedunculated hemangioma (Tran-Minh et al, 1991). Pain or secondary complications may necessitate surgical intervention. CT angiography can play an important role in delineating the arterial supply to these tumors, facilitating surgical enucleation or hepatic resection.
Focal Nodular Hyperplasia
FNH (see Chapter 79A, Chapter 79B ) is the second most common benign liver tumor, with a reported prevalence ranging from 0.9% (Nguyen et al, 1999) to 3% (Karhunen, 1986). FNH usually is incidentally detected when patients are scanned for other reasons (Carlson et al, 2000). With the increased use of CT and faster scan protocols, FNH is being detected more frequently (Carlson et al, 2000). FNH is more commonly seen in women, and it occurs in relatively young patients (Nguyen et al, 1999). At histopathologic analysis, classic FNH contains nodular hyperplastic parenchyma that is at least partially surrounded by fibrous septa and a central scar. The central scar contains fibrous connective tissue, cholangiolar proliferation with surrounding inflammatory infiltrates, and malformed vessels (Nguyen et al, 1999; Wanless et al, 1985).
On unenhanced CT, FNH has the same or slightly lower attenuation than the liver. When FNH has the same attenuation as the liver, the lesion may be invisible or may be detectable only because of the central, low-attenuation scar or mass effect on the adjacent structures (Carlson et al, 2000). The value of unenhanced images is to ensure the absence of intralesional hemorrhage, intratumoral fat, and calcifications, findings atypical of FNH (Carlson et al, 2000). During the early phases (arterial, early portal venous), the typical pattern of FNH is diffuse, immediate, homogeneous, hyperdense contrast enhancement. The prompt, diffuse arterial enhancement is due to the rich arterial supply. Rapid washout of contrast material is seen in the late portal venous phase and on delayed images, as lesions tend to become isodense to the liver on these views (Figs. 16.26 and 16.27; Carlson et al, 2000).
A central scar is thought to be present at histopathology in almost all cases of FNH, but on CT, scars are less frequently visualized, seen in approximately one third of patients (Shamsi et al, 1993; Welch et al, 1985). The central scar is usually hypodense to the liver on unenhanced and early contrast-enhanced images, and it displays gradual fill-in on the portal venous phase and delayed images owing to diffusion of contrast material into the myxomatous stroma.
Adenoma
Hepatic adenoma (see Chapter 79A, Chapter 79B ) is an uncommon benign neoplasm usually discovered in women. A causative link has been described between the use of oral contraceptives and the development of hepatic adenomas (Blumgart et al, 2001). Other risk factors for the development of this neoplasm are androgen-containing steroids (Soe et al, 1992) and type I glycogen storage disease (Labrune et al, 1997). Adenomas are usually solitary but may be multiple in 30% of patients (Foster & Berman, 1977). A distinct entity referred to as liver adenomatosis, a term coined in 1985, refers to multiple (>10) adenomas in a patient without other known risk factors (Flejou et al, 1985).
Adenomas contain large plates of hepatocytes separated by dilated sinusoids perfused solely by peripheral arterial feeding vessels (adenomas lack a portal venous supply) under arterial pressure. Adenomas have poor connective tissue support, and the combination of poor connective tissue support and arterial pressure predisposes to hemorrhage. Multiple and large adenomas are more prone to spontaneous hemorrhage (Leese et al, 1988). Intracellular and intercellular lipids manifest as macroscopic fat within the tumor (Ichikawa et al, 2000).
The imaging appearance of adenomas parallels the histopathologic appearance. Unenhanced CT may be valuable in detecting the presence of intralesional hemorrhage or fat. Calcifications have been reported in 10% of lesions (Grazioli et al, 2000, 2001). Adenomas tend to be isoattenuating relative to normal liver on unenhanced CT and on portal venous phase images. Small adenomas usually enhance homogeneously in the arterial phase and are hyperattenuating to the liver (Grazioli et al, 2001). Larger adenomas are more heterogeneous in appearance than smaller lesions (Grazioli et al, 2001), presumably because of the presence of acute or prior hemorrhage. Peripheral enhancement reflects the presence of large subcapsular feeding vessels, with a resultant centripetal pattern of enhancement.
Biliary Hamartoma
Bile duct hamartoma (see Chapter 79A, Chapter 79B ), also known as von Meyenburg complex, is a common benign tumor composed of disorganized bile ducts and ductules with a fibrocollagenous stroma (Horton et al, 1999). The tumors usually range from 1 to 15 mm, do not communicate with the biliary tree, and are scattered throughout the liver (Wei et al, 1997). Bile duct hamartomas may be single, although they are often multiple (Blumgart et al, 2001), and they have a nonspecific imaging appearance such that they may be mistaken for metastases or microabscesses (Eisenberg et al, 1986; Lev-Toaff et al, 1995; Sada & Ramakrishna, 1994).
Bile Duct Adenoma
Bile duct adenomas are usually incidentally detected, benign, asymptomatic lesions (Welch et al, 1985). Bile duct adenomas are usually solitary and subcapsular, ranging in size from 1 mm to 1 cm. On unenhanced CT, a bile duct adenoma appears as a well-defined hypoattenuating or isoattenuating mass. Usually, little or no enhancement is seen after contrast administration. There is no specific imaging finding, however, and definitive diagnosis can be made only at histologic analysis (Horton et al, 1999).
Inflammatory Conditions
Pyogenic Abscess
Recent surgery, biliary disease, diverticulitis, Crohn disease, and alcoholism all predispose to pyogenic hepatic abscess (see Chapter 66), commonly caused by Clostridium species and gram-negative bacteria such as Escherichia coli and Bacteroides, which enter the liver via the biliary tree or portal venous system (Mergo & Ros, 1997). Ascending cholangitis and portal phlebitis are the most common causes of pyogenic hepatic abscesses (Murphy et al, 1989).
As a result of the widespread use of broad-spectrum antibiotics, the clinical presentation and CT appearance vary widely (Halvorsen et al, 1984). Pyogenic hepatic abscesses may be classified as either microabscesses (<2 cm) or macroabscesses, larger confluent lesions. Microabscesses appear as small, well-defined, hypodense lesions on contrast-enhanced CT. They may be widely scattered or clustered with a tendency to coalesce (Jeffrey et al, 1988). Larger pyogenic abscesses range in appearance from unilocular cavities with smooth outer margins to highly complex and septated structures with internal debris and irregular contours. Most large pyogenic abscesses appear as a well-defined mass of low attenuation on unenhanced CT. The attenuation value of the abscess cavity depends on the age of the abscess; it becomes lower as the abscess matures. Gas bubbles may be seen if anaerobic bacteria are present, and the periphery and internal septa may enhance after contrast agent administration. Abscesses often have a thick wall, which enhances with contrast administration (Fig. 16.28). In addition, there may be hepatic enhancement peripheral to the enhancing wall, secondary to increased capillary permeability. This is referred to as the double-target sign (Mendez et al, 1994; Murphy et al, 1989).
Fungal Abscesses
Fungal hepatic abscesses generally are disseminated microabscesses that occur in immunosuppressed patients. The most common fungal organism implicated is Candida albicans. Other fungal infections that cause microabscesses include cryptococcus, histoplasmosis, and mucormycosis. With contrast-enhanced CT, hepatic microabscesses appear as small, hypodense lesions ranging from several millimeters to 1.5 cm in size. A bull’s-eye appearance may be identified, with a small, high-attenuation focus centrally surrounded by a low-attenuation zone. Authors have reported significant increase in the sensitivity and lesion conspicuity using arterial phase CT, compared with portal venous phase CT, when evaluating liver lesions in immunocompromised patients suspected to have hepatosplenic fungal infections (Metser et al, 2005).
Echinococcus
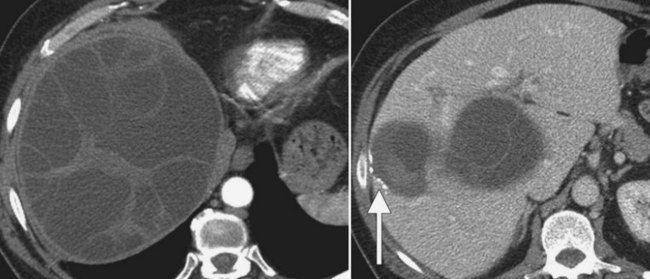
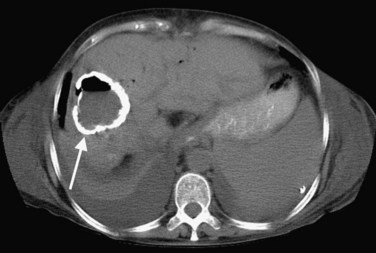
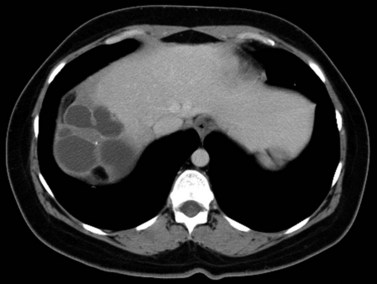
In endemic areas, involvement of the liver by hydatid disease is a common finding. Echinococcus granulosus (see Chapter 68) presents with a large solitary mass or multiple well-defined cystic lesions, which often contain internal “daughter” cysts (Fig. 16.29). Coarse calcifications of the wall are present in 50% of patients (Fig. 16.30), and daughter cysts are identified in approximately 75% (de Diego Choliz et al, 1982; Murphy et al, 1989). Communication between the cysts and the biliary tree is found in approximately 25% of patients (de Diego Choliz et al, 1982), and frank rupture of cyst contents into the bile ducts occurs in 5% to 10%, accompanied by clinical features of cholangitis. In contrast, Echinococcus alveolaris infection resembles an infiltrating hepatic tumor clinically and radiographically with its irregular margins and heterogeneous density (Didier et al, 1985).
Amebic Abscess (See Chapter 67)
The protozoan Entamoeba histolytica infects 10% of the world’s population. Hepatic abscess is the most common extraintestinal complication of amebiasis and occurs in approximately 8.5% of all patients with amebic infection (Ralls, 1998). On CT, amebic abscesses appear as well-defined masses of near-water attenuation with a thick enhancing rim. One or more internal septations may be present. A feature of amebic liver abscess that may aid in distinguishing it from other focal hepatic lesions is its tendency to extend beyond the surface of the liver (Radin et al, 1988). The CT findings are not specific, however, and serologic tests are necessary to confirm the diagnosis.
Diffuse Hepatocellular Diseases
Fatty Infiltration
Fatty infiltration (see Chapter 65), as seen in patients on chemotherapy or in patients with systemic disorders, such as diabetes mellitus, cystic fibrosis, or malnourishment, results in a decrease in hepatic density. Mild degrees of fatty change may be subtle, unless liver density is compared carefully with the density of the spleen. The liver is normally 6 to 12 HU higher in attenuation than the spleen, and reversal of this relationship is the earliest CT indication of fatty infiltration. With more advanced changes, the hepatic parenchyma becomes less dense than the intrahepatic vessels. In most instances, fatty infiltration is diffuse and uniform (see Fig. 16.12), but a nonuniform, focal distribution also can occur and occasionally may mimic a mass (Fig. 16.31). Fatty infiltration should be suspected if blood vessels can be seen passing through the focal area in a normal pattern (Fig. 16.32).
An awareness of the common locations of focal fatty infiltration and focal fatty sparing is important, so as not to mistake these for tumor. Common locations for focal fatty infiltration include segment IV adjacent to the falciform ligament (Ohashi et al, 1995; Paulson et al, 1993) and around the gallbladder (Yoshimitsu et al, 1997). A common location for focal fatty sparing is in the posterior aspect of segment IV (Matsui et al, 1995; White et al, 1987) or along the gallbladder fossa. It has been suggested that areas of focal fatty sparing are due to aberrant venous drainage to the liver, because these areas do not receive portal venous flow from the main portal trunk (Gabata et al, 1997; Marchal et al, 1986; Matsui et al, 1995).
It has been shown that focal fatty sparing in a fatty infiltrated liver may occur secondary to a mass. This occurrence is presumably due to regionally decreased portal blood flow caused by compression of the adjacent portal venous branch distal to a mass. This fatty sparing can appear as wedge shaped, peripheral, segmental, or lobar, depending on the site of the portal venous compression (Grossholz et al, 1998).
Assessment for fatty infiltration is better performed with unenhanced CT than with contrast-enhanced CT, because factors such as the rate of contrast injection and timing of measurements significantly influence the optimal liver-to-spleen ratio threshold for diagnosing fatty liver. The required ratios are protocol specific, which limits the clinical usefulness of such measurements (Jacobs et al, 1998; Johnston et al, 1998). If it is unclear based on the CT findings whether an area of focal low attenuation represents a mass, magnetic resonance imaging (MRI) using opposed-phase gradient echo images may make a definitive diagnosis.
Cirrhosis (See Chapter 70A, Chapter 70B )
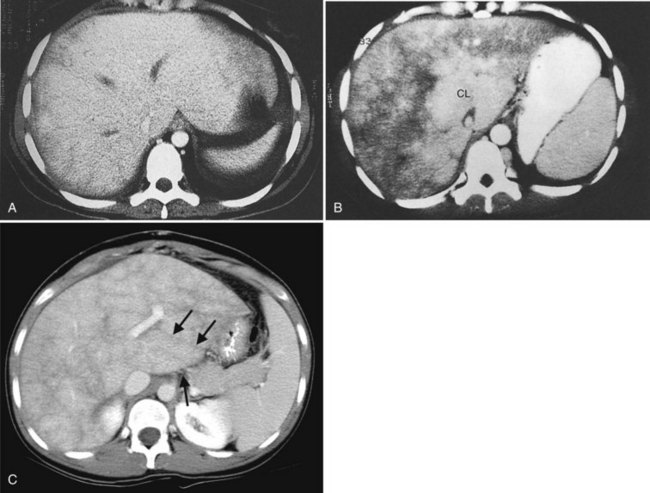
CT is capable of showing morphologic changes associated with advanced hepatic cirrhosis. Typical CT features are a nodular hepatic outline (in macronodular cirrhosis) caused by regenerative nodules of variable size, bands or regions of confluent fibrosis, relative atrophy of the right hepatic and quadrate lobes, and hypertrophy of the left lateral segment and caudate lobe (Fig. 16.33; Torres et al, 1986). Measurement of the transverse dimension of the caudate lobe compared with the adjacent right lobe provides an index of right hepatic lobe shrinkage and a relatively specific morphologic measurement of hepatic cirrhosis (Harbin et al, 1980). A caudate/right lobe ratio greater than 0.65, using the bifurcation of the main portal vein to divide the lobes provides 96% confidence in the diagnosis of cirrhosis. An MRI study suggested that using the right portal vein to set the lateral boundary of the caudate lobe when assessing the caudate/right lobe ratio was more accurate for diagnosing cirrhosis than using the main portal vein (Awaya et al, 2002). Evidence of coexistent portal hypertension is found with ascites, splenomegaly, and portal-systemic varices. MDCT combined with three-dimensional reformatting can help determine the extent of portosystemic collateral vessels, such as the left gastric vein, short gastric vein, esophageal and paraesophageal varices, splenorenal and gastrorenal shunts, and paraumbilical and abdominal wall veins (Kang et al, 2002).
Budd-Chiari Syndrome
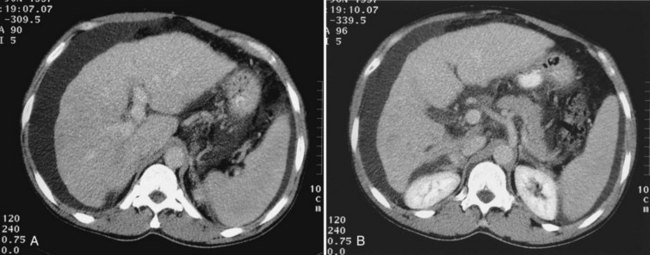
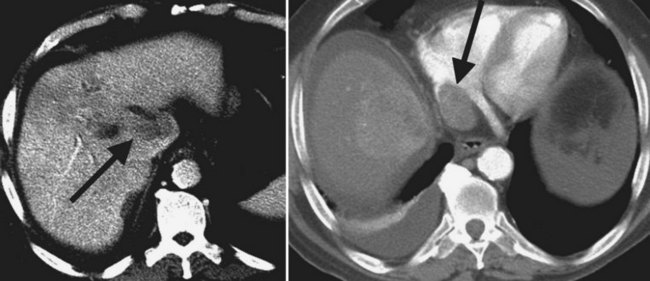
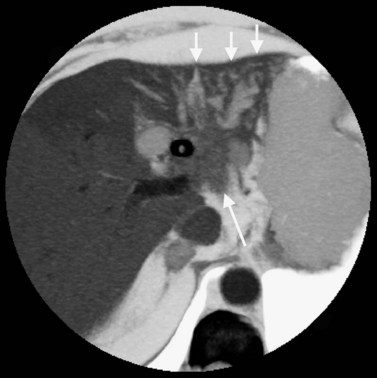
Budd-Chiari syndrome (see Chapter 77) is caused by chronic hepatic venous congestion secondary to obstruction to hepatic venous outflow. The CT appearance is characterized by hepatomegaly and ascites; the hepatic veins are either obliterated and not seen, or they contain thrombus (Fig. 16.34). Precontrast scans show decreased attenuation of hepatic parenchyma because of congestion; postcontrast scans show normal enhancement of the caudate lobe, which is hypertrophied in chronic cases, and patchy enhancement of the remainder of the liver (Vogelzang et al, 1987). Concomitant portal vein thrombosis is present in 20% of patients with Budd-Chiari syndrome. A similar CT appearance of the liver, with patchy enhancement, is seen in patients with congestive heart failure; in contrast to patients with true Budd-Chiari syndrome, these patients have patent and enlarged hepatic veins (Moulton et al, 1988).
Malignant Lesions of the Liver
Hepatocellular Carcinoma
HCC (see Chapter 80) is the most common primary hepatic malignancy worldwide, with the highest incidence in Asia, Southeast Asia, and sub-Saharan Africa. Although less common in the West, the incidence of HCC in the United States has been increasing (Arakawa et al, 1986). The most significant risk factors include cirrhosis and hepatitis B and C viruses. Approximately 70% of HCCs develop in cirrhotic livers (Blumgart et al, 2001), and detection of HCC in the cirrhotic liver poses a great diagnostic challenge, because the hepatic parenchyma is distorted by nodular regeneration and fibrosis. In addition, there are alterations in arterial and portal venous blood flow. These changes can obscure malignant lesions and conversely can simulate disease (Baron & Peterson, 2001).
Regenerative nodules within the cirrhotic liver, especially large nodules (8 to 10 mm), are readily identifiable at CT, because they distort the hepatic contour. When these nodules contain iron, referred to as siderotic nodules, they have high attenuation on unenhanced CT. These nodules typically do not enhance during the arterial phase, and this is an important characteristic that differentiates regenerating nodules from dysplastic nodules and HCC. Regenerative nodules enhance homogeneously during the portal venous phase to the same degree that surrounding fibrotic tissue does and thus are not visible as distinct from the adjacent parenchyma (Baron & Peterson, 2001).
Dysplastic nodules contain cellular atypia and are precursors to frank HCC in some cases. Dysplastic nodules may contain nontriadal arterial flow pathologically, which distinguishes them from regenerative nodules. Dysplastic nodules typically do not display vivid arterial enhancement on CT but occasionally do enhance in this phase and may mimic HCC (Baron & Peterson, 2001).
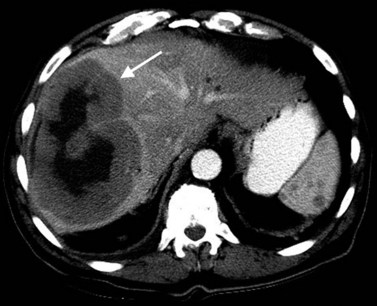
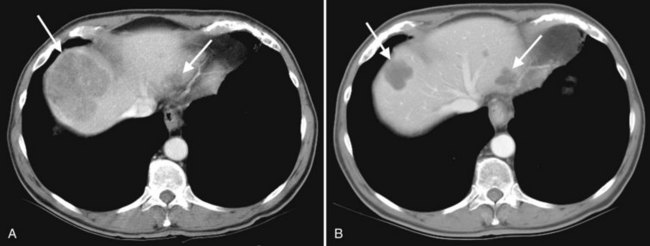
The appearance of HCC on CT varies. Most small HCC nodules enhance on arterial phase images and display a washout of contrast material during the portal venous phase (Fig. 16.35). A few are hypovascular and are best seen in portal venous phase or equilibrium phase imaging. Larger lesions (>5 cm) tend to be heterogeneous with a mosaic pattern of enhancement (Stevens et al, 1996); they may be surrounded by a tumor capsule and may contain necrosis and fatty metamorphosis. Tumor can invade the portal or hepatic veins directly (Freeny et al, 1992), with enhancing tumor thrombus evident on CT (Figs. 16.36 and 16.37). Tumor extension into the bile duct, resulting in biliary obstruction, also can be seen on CT.
Distortion of the liver related to the underlying cirrhosis can lead to abnormalities at CT that may be misinterpreted as HCC. A false-positive diagnosis of HCC was made on CT in 8% of 1329 patients with cirrhosis who were referred for hepatic transplantation in an experienced liver transplant center (Brancatelli et al, 2003). Benign lesions mistaken for HCC include focal confluent fibrosis, transient hepatic attenuation difference, flash-filling hemangiomata, peliosis, and benign regenerative nodules showing dysplastic change.
HCC may be predominantly intrahepatic or pedunculated, with a large exophytic component “hanging” off the liver (see Fig. 16.36A). This finding is evident on cross-sectional imaging and has implications for surgical resectability (Vauthey et al, 1995). Approximately 5% of HCCs are seen with spontaneous rupture and hemoperitoneum (Blumgart et al, 2001).
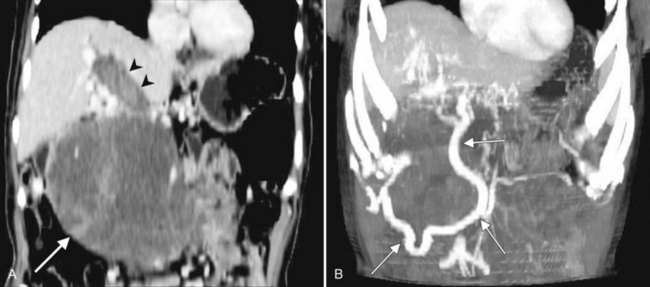
The appearance of HCC differs in cirrhotic and noncirrhotic livers. HCC in a cirrhotic liver commonly appears as multifocal small lesions, whereas HCC in a noncirrhotic liver is more typically a large, hypervascular solitary or dominant mass with small satellite nodules and central necrosis (Fig. 16.38; Brancatelli et al, 2002; Winston et al, 1999b). The pathogenesis of HCC differs in these two patient groups. HCC may arise de novo in an otherwise normal liver, whereas a multistep sequence of carcinogenesis has been described in patients with cirrhosis (Okuda et al, 1982). It has been shown that venous invasion by tumor is more common in cirrhotic patients than in patients without underlying liver disease (Smalley et al, 1988). Patients with minimal or no cirrhosis have a better prognosis after resection than patients with cirrhosis (Fong et al, 1999).
Fibrolamellar Hepatocellular Carcinoma
Fibrolamellar HCC is a malignant hepatocellular tumor with distinct clinical, pathologic, and radiologic differences from HCC. Fibrolamellar carcinoma typically manifests as a large hepatic mass in adolescents or young adults with no evidence of cirrhosis, and it accounts for 1% to 9% of all HCCs (Berman et al, 1980; Craig et al, 1980; Goodman et al, 1985; Pinna et al, 1985). There are no known risk factors for the development of this lesion. The main diagnostic challenge is to distinguish it from FNH, a benign lesion occurring in the same age group.
On unenhanced CT scans, fibrolamellar carcinoma usually appears as a hypoattenuating, solitary mass with well-defined lobular margins (McLarney et al, 1999) and a central scar. Calcification, a finding used to help differentiate this lesion from FNH, has been reported in 35% to 55% of tumors (Brandt et al, 1988; Friedman et al, 1985; Soyer et al, 1991). During the arterial and portal phases of enhancement, the nonscar portion of the tumor enhances heterogeneously (McLarney et al, 1999). This heterogeneous enhancement is also an important imaging finding used to differentiate fibrolamellar HCC from FNH, which should display homogeneous arterial enhancement around a central scar. On delayed images, increasing homogeneity of the mass and occasional scar enhancement may simulate the appearance of FNH, underscoring the need to scan the liver during the arterial and portal venous phases. Although fibrolamellar HCC does not typically have a true capsule, the liver surrounding the mass may be compressed and may form a pseudocapsule (McLarney et al, 1999). Associated findings of vascular invasion, lymphadenopathy, or peritoneal implants strongly suggest fibrolamellar HCC.
Angiosarcoma
Risk factors for angiosarcoma of the liver include hemochromatosis, radiotherapy, and exposure to compounds such as polyvinyl chloride (PVC), arsenic, or Thorotrast. Angiosarcoma is a vascular hepatic neoplasm that appears as an infiltrating, brightly enhancing mass on CT (Silverman et al, 1983). High-attenuation thorium deposition may be seen in a patchy distribution in the liver, perihepatic lymph nodes, and spleen. Histologic “cavernous” angiosarcoma may enhance in a way similar to that of hemangioma, with the tumor becoming wholly or partly isodense with liver on delayed scanning (Itai & Teraoka, 1989; White et al, 1993).
Hepatic Lymphoma
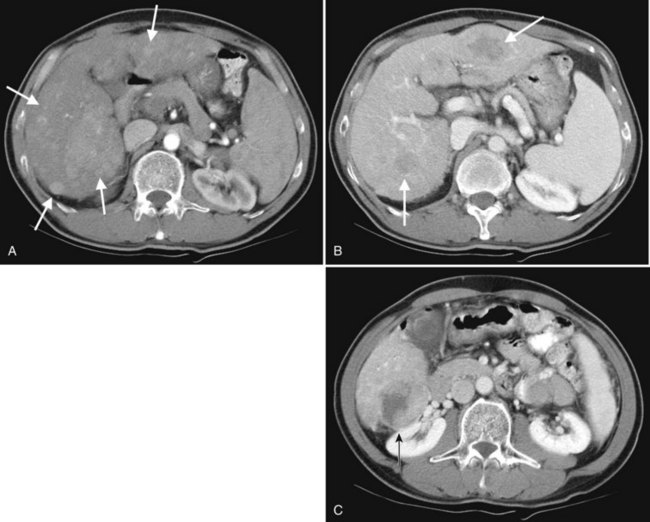
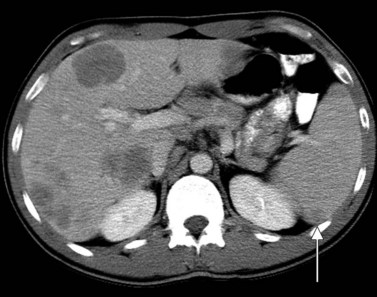
Primary lymphoma of the liver is rare, but the liver is a common secondary site of lymphomatous involvement in patients with Hodgkin disease and non-Hodgkin lymphoma. At autopsy, hepatic involvement is seen in 50% of patients with non-Hodgkin lymphoma and in 60% of patients with Hodgkin disease. Approximately 6% to 20% of patients with Hodgkin disease have hepatic involvement at presentation (Castellino, 1982; Fishman et al, 1991; Sandrasegaran et al, 1994). Liver involvement usually is associated with lymph node disease and almost invariably is associated with splenic disease. The more extensive the splenic involvement, the greater the likelihood of hepatic involvement (Figs. 16.39 and 16.40).
Hepatic Metastases (See Chapter 81A, Chapter 81B, Chapter 81C )
The liver provides a fertile soil for metastases, not only because of its dual blood supply from systemic and portal systems, but also because of humoral factors that promote cell growth. The liver is second only to regional lymph nodes as a site of metastatic disease. The CT appearance of metastases varies and depends on the size and vascularity of the tumor, the degree of necrosis, and the CT technique used (see Technique section). Borders may be sharp, poorly defined, or nodular; the shape may be round, ovoid, or irregular. Attenuation is usually lower than that of surrounding hepatic parenchyma on unenhanced CT. Intravenous contrast enhancement increases the sensitivity of lesion detection.
Scanning during the appropriate phase of enhancement (arterial, portal, delayed) increases detection even further (see Technique section). Peripheral ring enhancement occurs in metastases, but this is usually not appreciated in hypovascular metastases, which have low attenuation compared with surrounding, intensely enhancing hepatic parenchyma during portal phase scanning. Hypervascular metastases may be obscured during the portal phase and are most clearly visualized during the arterial phase (see Fig. 16.14). Metastases from mucinous carcinomas tend to contain punctate or amorphous calcification. Cystic metastases can be distinguished from benign simple cysts, because the former often contain mural nodules, fluid-fluid levels, or septations. Differentiation of multiple hepatic metastases from multifocal HCC may be difficult, but metastases rarely protrude prominently from the liver surface, a feature that is commonly seen with HCC.
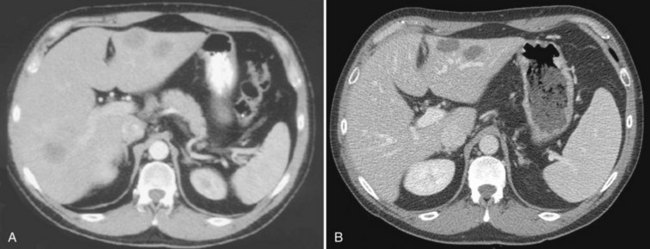
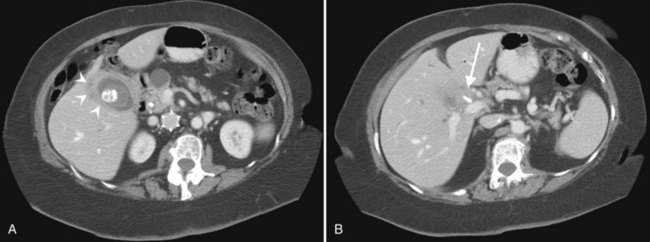
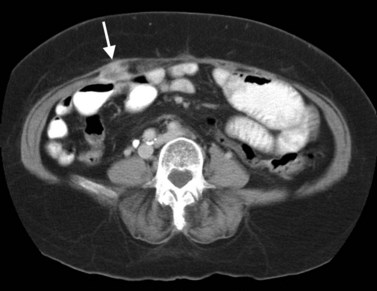
The appearance of metastases may change in response to treatment. Lesions may appear of lower attenuation as they undergo necrosis (Figs. 16.41 and 16.42). Hepatic metastases from gastrointestinal stromal tumors (GISTs) that respond to imatinib mesylate become near cystic on contrast-enhanced CT. These metastases may resemble cyts, but they display a slightly higher HU (Chen et al, 2002). Therefore when evaluating the liver at CT in a patient with a history of GIST, it is very important to know whether the patient has undergone treatment; comparison with pretreatment images becomes essential. Metastases may result in focal biliary ductal dilation secondary to compression or invasion of the adjacent bile duct (Fig. 16.43).
Biliary System
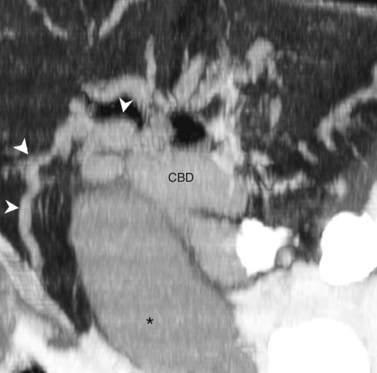
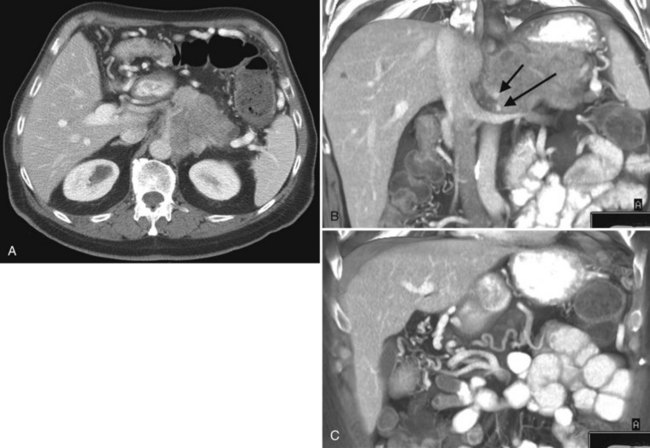
Advances in technology have expanded the role of CT in evaluating the biliary tree. The ability to obtain high-resolution, thin-slice images in a single breath hold and the ability to view these images in cine mode are ideal for tracing the dilated bile ducts to the point of obstruction. Delineation of variant biliary anatomy is possible if the biliary tree is dilated (Fig. 16.44). Additionally, the relationship of arteries to the bile ducts can be identified, which is valuable information for surgical planning (Fig. 16.45; see Chapter 90A, Chapter 90B, Chapter 90C, Chapter 90D, Chapter 90E, Chapter 90F ).
Cholecystitis (See Chapter 31)
CT should not be used as a screening technique for the detection of acute cholecystitis, but occasionally, patients with cholecystitis who display a confusing clinical picture may undergo CT examination before the precise nature of the disease is clear. Gallbladder distension, wall thickening, and gallstones are often present in acute cholecystitis, but these are nonspecific signs that occur in most patients with chronic cholecystitis. The presence of ill-defined pericholecystic lucency within the hepatic parenchyma adjacent to the gallbladder suggests gallbladder inflammation (Fig. 16.46). Intramural edema within the gallbladder wall may be seen in acute cholecystitis and is a useful sign in an appropriate clinical setting, but it also can be seen in patients with ascites or hypoalbuminemia. The attenuation of the gallbladder bile is usually increased, and extremely high attenuation is seen in patients with hemorrhagic cholecystitis, a rare complication.
Although many of the CT findings in uncomplicated acute cholecystitis are nonspecific, CT is valuable when complications such as pericholecystic abscess, emphysematous cholecystitis, or gallbladder perforation are present, and CT can identify patients in need of emergency surgery. CT findings most specific for acute gangrenous cholecystitis are gas in the gallbladder wall or lumen, intraluminal membranes, irregular gallbladder wall enhancement, and pericholecystic abscess (Bennett et al, 2002).
Mirizzi Syndrome
Mirizzi syndrome is an uncommon condition in which the common hepatic duct is obstructed because of stones impacted in or extruded from a Hartmann pouch or cystic duct. Cholecystobiliary and cholecystoenteric fistulae are common complications. It is clinically important to recognize the diagnosis before surgery, because failure to appreciate the extraluminal obstructing process results in unrewarding exploration of the common duct and persistent obstruction. The typical CT features of Mirizzi syndrome are dilation of the biliary system above the level of the neck of the gallbladder with a normal system below. CT reveals a gallstone impacted in a cystic duct or gallbladder neck, and the stone usually appears eccentrically located relative to the bile duct. An irregular cavity with surrounding edema and inflammation may be seen adjacent to the gallbladder neck (Fig. 16.47). Because not all of the findings may be present on CT, direct cholangiography or MRI cholangiopancreatography can be obtained to document the nature of the obstruction and the presence or absence of a biliary fistula.
Choledocholithiasis (See Chapters 35 to 37)
The insensitivity of sonography in detecting choledocholithiasis has been well documented, with a reported detection rate of 18% to 22%, whereas CT has a detection rate of 76% (Baron, 1987). Meticulous attention must be paid to technique, and when a change in duct caliber is detected, thin collimation scans should be performed through the transition area to detect the calculus. The only reliable indicator of choledocholithiasis is the presence of dense intraluminal calcification, or a target sign, which is due to a halo of bile surrounding the higher density stone. Calcified stones lying within an obstructed duct present no challenge to the radiologist. Most errors in diagnosis are due to cholesterol stones, which may blend imperceptibly with the surrounding bile. Errors of diagnosis also occur when choledocholithiasis occurs without ductal dilation, which occurs in about one third of patients with choledocholithiasis.
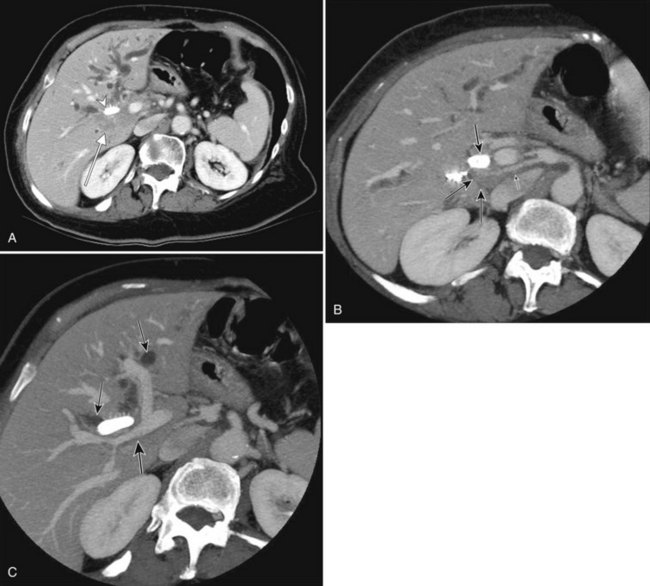
Intrahepatic calculi (see Chapter 39) are rare in Western countries but most frequently occur in association with iatrogenic bile duct strictures (Fig. 16.48). CT is of little value when stones are small and noncalcified and bile duct dilation is minimal or absent. Intrahepatic choledocholithiasis may give a bizarre appearance, owing to segmental or subsegmental biliary radicles filled with calculi. In Asian patients with recurrent pyogenic cholangitis, who subsequently form bile pigment stones, the debris filling the biliary system generally has higher attenuation than normal bile. Marked bile duct dilation is present, and often the larger intrahepatic ducts are dilated without side-branch dilation. Eccentric and diffuse extrahepatic bile duct wall thickening is usually seen (Schulte et al, 1990).
Gallbladder Carcinoma
Gallbladder carcinoma (see Chapter 49) is the sixth most common gastrointestinal malignancy in the United States. Risk factors include female gender, age, postmenopausal status, and cigarette smoking (Khan et al, 1999). Gallstones are present in 74% to 92% of patients with gallbladder carcinoma and represent another well-established risk factor (Lowenfels et al, 1985; Nagorney & McPherson, 1988). Porcelain gallbladder, a term used to describe calcification within the gallbladder wall, places a patient at increased risk for gallbladder carcinoma. Older studies suggested that 10% to 25% of patients with a porcelain gallbladder develop gallbladder carcinoma (Berk et al, 1973), but more recent reports indicate that the risk may be lower and related to the type of calcification (lower risk with complete calcification of the entire wall compared with selective calcification; Stephen & Berger, 2001; Kim et al, 2009). Most patients with gallbladder carcinoma are diagnosed with advanced disease. Early-stage gallbladder carcinoma typically is detected incidentally because of inflammation related to coexistent cholelithiasis or cholecystitis. In 1% of patients undergoing cholecystectomy for cholelithiasis, gallbladder carcinoma is discovered incidentally (Wanebo & Vezeridis, 1993).
The CT imaging appearances of gallbladder carcinoma include a mass replacing the gallbladder (seen in 40% to 65% of patients), focal or diffuse gallbladder wall thickening (seen in 20% to 30%; Fig. 16.49), and an intraluminal polypoid mass (seen in 15% to 25%; Fig. 16.50) (Franquet et al, 1991; Lane et al, 1989; Yeh, 1979; Yum & Fink, 1980). Additional imaging findings associated with gallbladder carcinoma reflect the pattern of disease spread. The most common mode by which gallbladder carcinoma spreads is direct invasion into the adjacent organs. Direct tumor invasion is enhanced by the thin gallbladder wall, which contains only a single muscle layer. The perimuscular connective tissue of the gallbladder is continuous with the interlobular connective tissue of the liver, facilitating the direct spread of tumor into the hepatic parenchyma (Henson et al, 1992). The liver is the organ most frequently invaded, followed by the colon, duodenum, and pancreas (Sons et al, 1985).
The gallbladder lies in the intersegmental plane between segments IVb and V (see Fig. 16.6), and tumors of the gallbladder fundus may invade directly into these segments at an early stage (Blumgart et al, 2001). Air may be seen within the gallbladder lumen if tumor results in a fistula to the transverse colon or duodenum. Tumors involving the infundibulum or cystic duct may invade directly and obstruct the common bile duct or portal vein, precluding surgical resection (Blumgart et al, 2001). Associated biliary dilation resuting from infiltrative tumor along the cystic duct to the extrahepatic bile duct, lymphadenopathy compressing the bile duct, or intraductal spread of tumor is apparent on CT (Levy et al, 2001). Tumor growth through the gallbladder wall away from the liver results in peritoneal carcinomatosis.
Laparoscopic cholecystectomy has become increasingly accepted as a treatment for symptomatic uncomplicated cholelithiasis (Southern Surgeon’s Club, 1991), and approximately 15% to 30% of gallbladder carcinomas are detected incidentally at microscopic review of cholecystectomy specimens (Clair et al, 1993). A serious potential complication of laparoscopic cholecystectomy is the inadvertent dissemination of unsuspected gallbladder carcinoma (Winston et al, 1999a). Wibbenmeyer and colleagues (1995) reported that gallbladder carcinoma recurs more rapidly after laparoscopic cholecystectomy than after open cholecystectomy. Tumor can recur in the laparoscopic port tracks, even if surgical resection of the port sites is performed at subsequent hepatic resection for attempted cure. Recurrent tumor may appear as a mass along the anterior abdominal wall with extension into the subjacent omental fat (Fig. 16.51; Winston et al, 1999a). These observations underscore the need to correctly identify findings suggestive of gallbladder carcinoma on preoperative imaging when elective laparoscopic cholecystectomy is planned.
Cholangiocarcinoma
Cholangiocarcinoma (see Chapter 50A, Chapter 50B, Chapter 50C, Chapter 50D ) is an adenocarcinoma that arises from bile duct epithelium. Conditions that place patients at increased risk for developing cholangiocarcinoma include clonorchiasis, hepatolithiasis, choledochal cyst, Caroli disease, hepatitis C viral infection, and primary sclerosing cholangitis (Sherlock & Dooley, 1997). Cholangiocarcinoma usually is classified as either intrahepatic or extrahepatic, and intrahepatic cholangiocarcinoma is classified further as either hilar or peripheral in location; these three types of cholangiocarcinoma—peripheral, hilar, and extrahepatic—are often regarded as distinct clinical and radiologic entities (Han et al, 2002), although this classification scheme is controversial. The Liver Cancer Study Group of Japan (1997) categorized intrahepatic cholangiocarcinoma into three types based on the macroscopic appearance: mass forming, periductal infiltrating, and intraductal.
The hepatic hilus is the most common location of cholangiocarcinoma, occurring in 40% to 60% of patients (Burke et al, 1998; Nagorney et al, 1993; Nakeeb et al, 1996). Tumors involving the distal bile duct account for 20% to 30% of all cholangiocarcinomas, and approximately 10% of cholangiocarcinomas arise peripherally within the intrahepatic biliary tree (Berdah et al, 1996; Chu et al, 1997; Harrison et al, 1998).
Hilar Cholangiocarcinoma.
Cholangiocarcinoma can arise anywhere in the biliary tree, but tumors involving the biliary confluence, termed hilar cholangiocarcinoma, are the most common; these are further broken down into infiltrating, exophytic, and polypoid types. Infiltrating hilar cholangiocarcinoma is the most common type, accounting for more than 70% of cases (Fig. 16.52); such tumors usually are seen as focal thickening of the duct wall with obliteration of the lumen (Han et al, 2002). Exophytic cholangiocarcinoma appears as a mass showing peripheral rim enhancement; its appearance is similar to peripheral cholangiocarcinoma. The polypoid type of hilar cholangiocarcinoma appears as an intraductal soft-tissue mass that expands the duct lumen; this type of tumor may be mulifocal within the biliary tree, and it involves the intrahepatic and extrahepatic bile ducts (Han et al, 2002).
Generally, long-term survival is possible only with an en bloc resection of the liver and the extrahepatic biliary ducts (Jarnagin & Winston, 2005). Jarnagin and colleagues (2001) proposed a staging system for hilar cholangiocarcinoma that predicts resectability, likelihood of metastatic disease, and survival. Preoperative imaging should focus on addressing factors that determine resectability. Four crucial components of resectability are 1) level and extent of tumor within the biliary tree, 2) vascular invasion, 3) hepatic lobar atrophy, and 4) distant metastatic disease.
High-resolution MDCT in combination with interactive image viewing in cine mode using PACS has enhanced the radiologist’s ability to address these issues (see Fig. 16.52). It is possible to trace the individual dilated bile ducts to determine the point or points of obstruction (Fig. 16.53). Zandrino and colleagues (2002) reported that multislice CT performed without a cholangiographic contrast agent correctly identified the cause of biliary obstruction in 31 (86%) of 36 patients.
One feature of cholangiocarcinoma is subepithelial spread of tumor along the duct wall and periductal tissues, and significant tumor may extend beneath an intact epithelial lining. For this reason, radiologic studies may underestimate the full extent of tumor. This possibility emphasizes the need for frozen section analysis of duct margins (see Fig. 16.52; Jarnagin & Winston, 2005).
Tumor extent along the hepatic arteries can be identified with CT angiography. Lobar atrophy, also apparent on CT, is an important finding in patients with cholangiocarcinoma. Atrophy is a major factor in the proposed clinical T-stage criteria, and it affects resectability. Although long-standing obstruction of the ipsilateral bile duct may cause moderate atrophy, associated portal venous obstruction causes rapid and severe atrophy of the affected lobe (Fig. 16.54; Jarnagin & Winston, 2005). Atrophy also is important to recognize at imaging when biliary decompression is planned. Drainage of an atrophic lobe does not relieve jaundice and is not indicated, unless it is done as treatment for biliary sepsis (Jarnagin & Winston, 2005).
Peripheral Cholangiocarcinoma.
The most common type of intrahepatic cholangiocarcinoma is mass-forming peripheral cholangiocarcinoma. On contrast-enhanced CT, peripheral cholangiocarcinoma appears as a low-attenuation mass with peripheral rim enhancement (Fig. 16.55), and it is associated with focal dilation of the intrahepatic bile ducts around the mass. Contrast enhancement of the mass is often seen on the delayed images (Keogan et al, 1997; Lacomis et al, 1997; Valls et al, 2000). This delayed enhancement is likely due to the increased stromal fibrosis seen within these tumors (Valls et al, 2000).
Extrahepatic Cholangiocarcinoma.
Infiltrating cholangiocarcinoma is the most common type of cholangiocarcinoma involving the extrahepatic bile duct. It usually appears as a mass or thickening of the bile duct wall at the site of biliary obstruction. The radiologic and pathologic features are identical to those of hilar cholangiocarcinoma, and the assessment and treatment of distal bile duct cancers is similar to that of pancreatic head carcinoma (Blumgart et al, 2001).
The intraductal polypoid or papillary variant of cholangiocarcinoma accounts for approximately 10% of all cholangiocarcinomas. The most common location for this type is the distal bile duct (Baer et al, 1990). As opposed to the infiltrative cholangiocarcinoma that narrows the duct lumen, papillary tumors are intraductal masses that expand the bile duct lumen. Papillary tumors have minute, frondlike projections that may be fixed to or detached from the bile duct wall. On CT, enhancement of the mass depends on whether or not the tumor is fixed or detached to the duct wall, and there may be segmental asymmetric thickening of the bile duct wall with enhancement. Tumors are friable and slough easily, which may result in intermittent or partial biliary obstruction (Lim et al, 2003). Some papillary tumors produce a profuse amount of mucus, resulting in severe biliary dilation (Lim et al, 2004). Recognition of a papillary cholangiocarcinoma is important, because these tumors are more likely resectable and carry a more favorable prognosis than other types (Pitt et al, 1995).
Biliary Cystadenoma and Cystadenocarcinoma
Biliary cystadenomas (see Chapter 48) are uncommon benign cystic lesions that occur predominantly in middle-aged women between 42 and 55 years (Ishak et al, 1977). Although benign, these lesions may recur after excision and have the potential to develop into biliary cystadenocarcinomas. Cystadenomas are most often intrahepatic (83%), but they may also occur within the extrahepatic bile ducts (13%) or gallbladder (0.02%) (Devaney et al, 1994).
CT shows cystadenomas to be multiloculated cystic lesions with internal septations; only rarely are they unilocular (Fig. 16.56). Calcifications may be present within the wall of the cyst or within the septa, and septa may enhance with intravenous contrast media (Fig. 16.57). The attenuation of the cyst fluid depends on the content of the fluid, which may be hemorrhagic, mucinous, proteinaceous, or bilious (Buetow et al, 1995). Tumor nodules and papillary projections extending into the cyst typically enhance with intravenous contrast medium. No specific imaging feature permits reliable differentiation of biliary cystadenoma from biliary cystadenocarcinoma (Buetow et al, 1995a).
Computed Tomography of the Pancreas
Historical Review
Evaluation of the pancreas was revolutionized by the advent of helical CT scanning, which enabled rapid evaluation of the pancreas during different phases of contrast injection (Ferrucci, 1999; Ishiguchi et al, 2001; Mertz et al, 2000; Van Hoe & Baert, 1997). Newer MDCT scanners have improved pancreatic imaging further by allowing extremely rapid data acquisition, retrospective change in slice thickness and location, and three-dimensional image review in multiple projections (Ferrucci, 1999; Horton & Fishman, 2000; Ishiguchi et al, 2001; Johnson et al, 2003; Mertz et al, 2000; Rubin, 2003; Van Hoe & Baert, 1997).
Computed Tomography Scan Protocols for the Pancreas
Initial scan protocols for evaluation of the pancreas recommended four phases for the preoperative evaluation of the pancreas: The noncontrast phase permits evaluation of pancreatic calcifications and allows localization of the precise levels for imaging on the postcontrast study. The next two phases are combined early and late arterial phases, obtained within a single breath hold; the early arterial phase permits evaluation of pancreatic vasculature without interference from venous opacification. The late arterial phase is of greatest benefit to distinguish pancreatic neoplasms from adjacent normal pancreatic tissue by maximizing differences in contrast enhancement. It also is useful to evaluate hypervascular liver metastases as seen in patients with neuroendocrine tumors of the pancreas. The fourth phase is the routine portal venous phase, which is best to evaluate for hypovascular liver metastases (Cantisani et al, 2003; Takeshita et al, 2002) in patients with adenocarcinoma. More recent reports (Fletcher et al, 2003) have shown no need for the early angiographic phase of imaging of the pancreas, because the pancreatic and hepatic arterial anatomy and pancreatic parenchyma are well evaluated on the late arterial phase of imaging. This practice further shortens the scan time and reduces the radiation dose to the patient.
An exciting new development in multidetector CT is the promise of dual-energy CT, a technique that scans the patient at both 80 kvp and 140 kvp simultaneously. Because of the different interactions of soft tissue, bone, and intravenous contrast material, it is possible to eliminate the noncontrast images and obtain a “virtual” noncontrast image. This is done by scanning the patient by injecting contrast and using the differential interactions with the two different scanning energies to digitally subtract the intravenous contrast. It is also possible to eliminate bone with this technique. This technology is still in early development, but it holds great promise for imaging multiple anatomic areas of the body, including hypervascular tumors of the liver and pancreas (Graser et al, 2009; Marin et al, 2009), with the expectation of reducing radiation dose.
For CT angiography of the pancreas, the patient should be fasting to ensure that the stomach and proximal bowel are empty; before the examination, the patient should drink approximately 750 to 1000 mL of water. CT angiography requires the substitution of water for dilute radiopaque oral contrast medium (Lawler & Fishman, 2002; Soriano et al, 2004; Takeshita et al, 2002) to isolate the enhanced vessels from the gastrointestinal tract. Enhanced vessels have CT densities similar to contrast-filled bowel. Water within the lumen of the bowel facilitates identification of vascular anatomy, allows evaluation for possible invasion into adjacent bowel, and facilitates analysis on the three-dimensional workstation.
Noncontrast images are acquired initially to localize the pancreas accurately before intravenous contrast administration and to evaluate for the presence of calcifications. Injection of intravenous contrast medium is done at a high flow rate of 4 to 5 mL/s, with scanning beginning during the late arterial phase; this permits evaluation of the peripancreatic vasculature and maximizes contrast differences between tumor and normal pancreatic tissue. Different methods exist to initiate scanning at the time of maximal arterial enhancement, which may vary from patient to patient. A small timing bolus (Kalra et al, 2004) may be used to determine the appropriate time delay, or CT scanning may be triggered automatically when a vascular structure reaches a predefined density. Other authors use a standard delay for imaging all patients, a potential pitfall in patients with cardiac disease.
Anatomy of the Pancreas
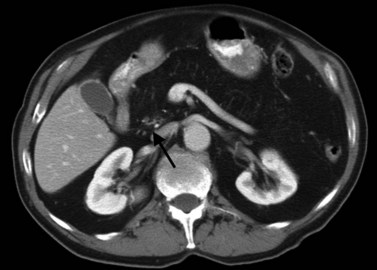
The normal pancreas (see Chapter 1A, Chapter 1B ) is well imaged on routine CT of the abdomen. It is a retroperitoneal structure bounded anteriorly by the stomach and posteriorly and inferiorly by the third portion of the duodenum, and it lies medial to the C-loop of the duodenum and medial to the spleen. Crucial to the evaluation of the pancreas and possible tumor resection is its relationship to vessels. The body and tail of the pancreas lie immediately anterior to the splenic vein, and the neck, head, and uncinate process of the pancreas are in close relationship to the superior mesenteric artery (SMA) and vein and lie just caudal to the celiac axis. The normal pancreas has a fat plane completely surrounding the SMA, whereas no fat plane lies between the SMV and the pancreatic head (Fig. 16.58).
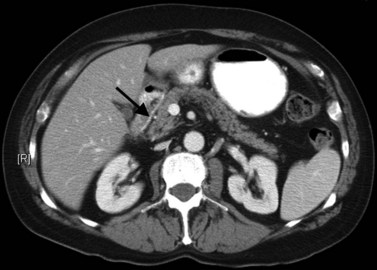
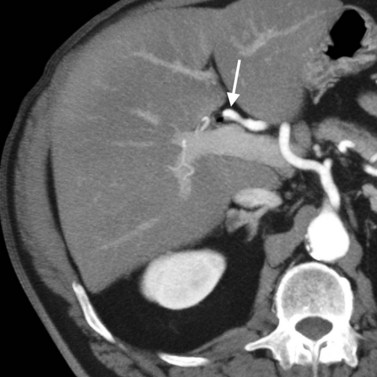
FIGURE 16.58 Normal pancreas. Note the gastroduodenal artery along the anterior margin of the pancreas (arrow).
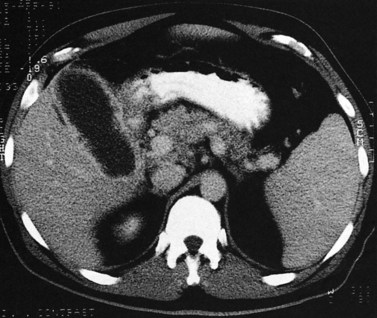
Patients may sometimes be seen with fatty infiltration of a portion of the pancreas or involving the gland diffusely (Fig. 16.59). In such instances, the gland is best identified by identification of surrounding vascular structures and bowel. Severe fatty infiltration permits visualization of fine vascular detail within the pancreas, but a potential pitfall is that a small island of residual normal pancreatic parenchyma may be confused with an intrapancreatic mass.
Vascular anatomy is depicted in exquisite detail on CT angiography (Ibukuro, 2001; Ibukuro et al, 1995; Yamada et al, 2000; Ferrari et al, 2007; Horiguchi et al, 2008). In addition to assessment of the celiac and superior mesenteric arteries and vein and their major branches, smaller vessels are routinely visualized and assessed, including the gastroduodenal artery, pancreaticoduodenal vessels, and pancreatic branches (Fig. 16.60). MDCT permits even more exquisite evaluation of these small vessels and better three-dimensional evaluation of the data (Fishman & Horton, 2001; Fishman et al, 2000; House et al, 2004; Johnson et al, 2003; Takeshita et al, 2002).
Tumors of the Pancreas
Pancreatic Adenocarcinoma
Pancreatic adenocarcinoma (see Chapter 58A) is the fourth most common cause of death from malignancy (Kim et al, 2004a) and is often discovered at an advanced and inoperable stage. Operative mortality and morbidity rates of 2.8% and 40%, respectively (Wagner et al, 2004), underscore the need for preoperative evaluation to select the subgroup of patients who may be candidates for curative resection.
A recent report describes a new scoring system for tumor invasion that looks at both the length and degree of circumferential encasement of the peripancreatic arteries and veins to determine resectability, using data obtained from 16-slice scanners (Klauss et al, 2008). This score evaluates the length of tumor contact and circumferential extent of tumor involving the SMV, splenic vein, portal vein, aorta, celiac trunk, hepatic artery, splenic artery, and SMA. Veins were also assessed for contour deformations. The authors of this study reported sensitivity and specificity of 89% and 99% for vascular invasion and a sensitivity of 94% and specificity of 89% for the evaluation of resectability.
Pancreatic ducts represent only 4% of the pancreatic tissue but are the source of 90% of pancreatic malignancies (Cubilla & Fitzgerald, 1975; Morohoshi et al, 1983). Adenocarcinoma is the most common form of pancreatic cancer, and it occurs in later life. The clinical presentation depends on the location within the gland; cancers within the pancreatic tail are clinically silent and may not show up until metastasis is widespread, but cancers within the pancreatic head or periampullary region tend to show up earlier, with biliary obstruction a common sign in 50% of patients.
Pancreatic adenocarcinoma appears as a low-attenuation mass, often deforming the contour of the pancreas with secondary signs depending on the tumor location (Figs. 16.61 and 16.62). A mass in the pancreatic head is more commonly associated with biliary or pancreatic ductal dilation. The pancreas proximal to the obstruction is often atrophic, a secondary and often early indication of the tumor site.
Knowledge of vascular involvement or encasement is crucial to preoperative evaluation of the pancreas, because involvement of the superior mesenteric artery or vein, common hepatic artery, or celiac axis generally precludes operative resection for cure. Involvement of the main portal vein is not a contraindication to surgery, because a portion of the main portal vein may be resected and reanastomosed proximal to the jejunal branches (Chae et al, 2003; Lygidakis et al, 2004; Nakao et al, 2004; Yoshimi et al, 2003). Kitagawa and colleagues (2008) reviewed patterns of spread of adenocarcinoma of the pancreatic head and found specific patterns, depending upon the origin of the cancer from the dorsal or ventral pancreatic anlagen on an embryologic basis. Tumors confined to the ventral pancreas had metastases along the SMA and peripancreatic nodes, whereas tumors that arose from the dorsal pancreas domain metastasized to the common hepatic artery, hepatoduodenal ligament, and the peripancreatic nodes. Tumors that extended into both domains metastasized widely.
Early findings of pancreatic cancer may be extremely subtle and difficult to detect. In a study at the Mayo Clinic in Rochester, Minnesota, 62 scans obtained before the histologic diagnosis of pancreatic cancer in 28 patients were retrospectively reviewed by two radiologists. Half of the scans obtained before diagnosis showed findings that were interpreted as definite or suspicious for pancreatic carcinoma 2 to 6 months and 6 to 18 months before diagnosis (Gangi et al, 2004). Pancreatic duct dilation and cutoff were early findings. A limitation of this study is that it was a retrospective review of scans obtained between August 1994 and June 2001. Current techniques of thin-section, high-resolution scanning during optimal pancreatic enhancement should improve detection of small lesions. More commonly, pancreatic cancer is detected at an advanced stage, associated with arterial vascular encasement or invasion, venous involvement, peripancreatic adenopathy, hepatic metastases, or ascites (Figs. 16.63 and 16.64). Local arterial encasement or venous occlusion or both preclude resection for attempted cure. Centers with a high volume of pancreatic surgery do a partial resection of the portal vein and primary reanastomosis, but this mandates a cuff of remaining normal portal vein proximal to the first jejunal branch (Chae et al, 2003; Yoshimi et al, 2003). Three-dimensional workstations permit visualization of vascular involvement in coronal and sagittal planes and permit three-dimensional reconstructions using maximum intensity projections or volume rendering (Prokesch, 2003; Tamm & Charnsangavej, 2001; Tamm et al, 2001). Curved multiplanar reformatted images can offer a superb display of pancreatic anatomy and demonstration of adjacent vascular encasement (Vargas et al, 2004, Gong et al, 2004).
Neuroendocrine Cancer of the Pancreas
Neuroendocrine cancer of the pancreas arises predominantly from the islets of Langerhans and may arise in a sporadic fashion or in patients with multiple endocrine neoplasia type I (MEN-I). Pancreatic neuroendocrine tumors generally have a much more favorable prognosis than pancreatic adenocarcinoma. Presentation is diverse and often depends on the presence of hormonal activity and its associated symptoms (Kulke, 2003). Hormonally active tumors may present earlier and are generally smaller than non–hormonally active tumors.
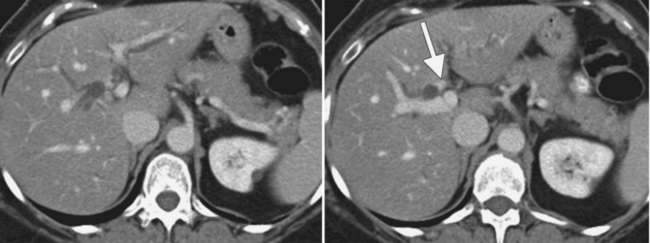
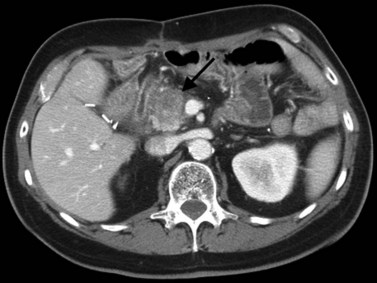
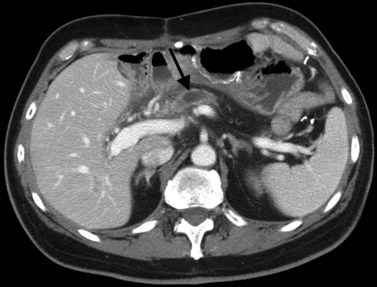
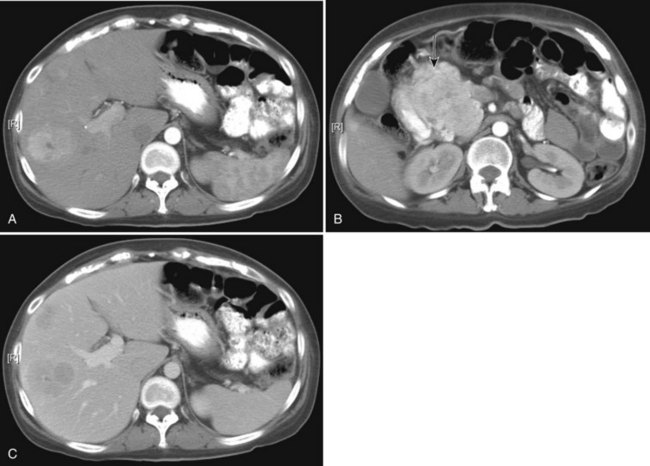
The CT and MR appearances of endocrine tumors of the pancreas according to the World Health Organization (WHO) classification was reviewed recently (Rha et al, 2007). Masses are often hypervascular on imaging and may be associated with liver or nodal metastases or both (Fig. 16.65). Careful attention to detail is required, particularly for imaging of the hormonally active tumors, which may be small hypervascular masses that often require dedicated thin-section pancreatic protocols for initial detection (Gouya et al, 2003). Arterial phase imaging is necessary to detect masses that otherwise may be isodense on the portal venous phase of imaging (Fig. 16.66). Insulinomas are the most common type of functioning islet cell tumor of the pancreas and are generally extremely hypervascular. Routine follow-up of these patients is best assessed with triphasic scans of the liver to detect masses that may become isodense on portal phase imaging.
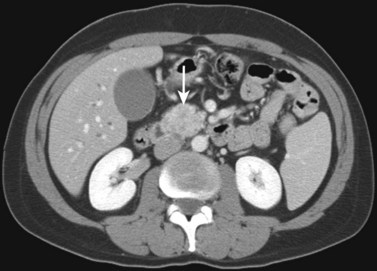
FIGURE 16.65 Pancreatic neuroendocrine cancer/hypervascular mass (arrow) on the portal venous phase.
In a retrospective review of 50 patients with neuroendocrine cancer (Chu et al, 2002), median survival was 40 months, with overall 1-, 2-, and 5-year survival rates of 84%, 69%, and 36%, respectively. Long-term survival of these patients was related to surgical resection of the primary tumor, absence of liver metastases, metachronous liver metastases, and aggressive treatment of liver metastases using surgery, intrahepatic chemotherapy, or chemoembolization. A German review of 254 patients with neuroendocrine tumors showed 29% to be of pancreatic origin. The 5-year survival from the time of initial diagnosis for this subgroup of patients with pancreatic tumors was 43%. A smaller sized primary tumor (<2 cm) and histologic grading as low-grade malignant were associated with a longer survival (Pape et al, 2004).
Cystic Pancreatic Neoplasms
Cystic pancreatic neoplasms (see Chapter 57) represent a spectrum of disease that includes both benign and malignant entities. Distinguishing benign neoplasms from pancreatic pseudocysts can be difficult, and serial imaging may be necessary to evaluate for stability (Allen et al, 2003; Visser et al, 2004). Included in this group of neoplasms are serous cystadenomas, lymphoepithelial cysts and cystic neuroendocrine tumors, and pseudocysts. Mucinous cystic neoplasms have malignant potential and may present a challenge to distinguish from other benign pancreatic cysts.
Intraductal Papillary Mucinous Neoplasm.
Intraductal papillary mucinous neoplasm (IPMN) of the pancreas is a spectrum of disease, ranging from benign to malignant and characterized overall by improved survival compared with pancreatic adenocarcinoma. There is a greater male/female predominance, with a reported 57% of patients male in the Johns Hopkins experience (Sohn et al, 2004) and a 2.2 : 1 male/female predominance in a reported Japanese experience (Kimura et al, 1996). The tumor is classified into that of main pancreatic duct, branch duct, or mixed involvement (Bassi et al, 2000; Nagasaka & Nakashima, 2001; Nakamura et al, 2002; Tanaka, 2004; Tan et al, 2009; Ogawa et al, 2008; Freeman, 2008). A review of surgical experience of 136 IPMNs from Johns Hopkins (Sohn et al, 2004) found 62% to be benign, and the remaining 38% had IPMNs with associated invasive cancers. The most common presenting symptoms are abdominal pain, weight loss, and nausea and vomiting; patients with invasive IPMNs also may be seen with jaundice.
IPMNs may occur in any portion of the gland. Branch-type neoplasms are most commonly benign, whereas the main duct and mixed types are frequently malignant (Tanaka, 2004; Tan et al, 2009). Multiplanar reformatted images may prove invaluable in the discrimination of branch-type IPMN from main-duct type (Takada et al, 2005). They are cystically dilated ducts that connect to the remainder of the ductal system, lined by flat or papillary mucinous or oncocytic epithelium with or without a component of invasive adenocarcinoma, and they are recognized as identifiable cystic structures of at least 1 cm radiographically or at surgery (Fig. 16.67). Careful attention to radiographic technique, including thin-section imaging with rapid injection of intravenous contrast medium, is crucial to detect these often small masses. Appropriate timing of scanning with the administration of contrast medium is designed to scan the pancreas during the pancreatogram phase, when pancreatic parenchyma is maximally enhanced, which maximizes contrast differences between the cystic mass and the enhanced pancreas. Location of the mass within the pancreatic head (Fig. 16.68) may compress the common bile duct with resulting dilation of the intrahepatic bile ducts. Invasive adenocarcinoma may be found at pathologic examination and has been reported to correlate most closely with the presence of mural nodules and pancreatic duct dilation of 7 mm or greater (Sugiyama et al, 2003; Kawamoto et al, 2005; Fig. 16.69). D’Onofrio and colleagues (2009) reported a case of an 8-mm undifferentiated pancreatic adenocarcinoma that had a desmoplastic reaction on an adjacent pancreatic duct, which was dilated and mimicked an IPMN. Intraductal papillary mucinous tumors have a high reported incidence of associated extrapancreatic synchronous and metachronous malignancies of 23.6% to 32%, especially colorectal carcinoma (Sugiyama & Atomi, 1999), and a high incidence of associated pancreatic malignancies (Yamaguchi et al, 2002).
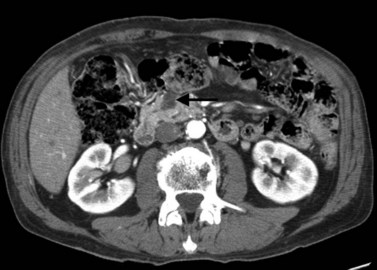
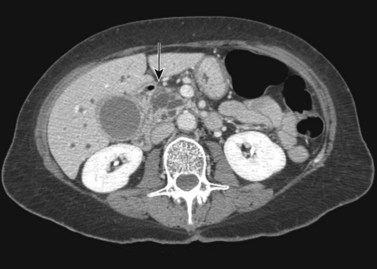
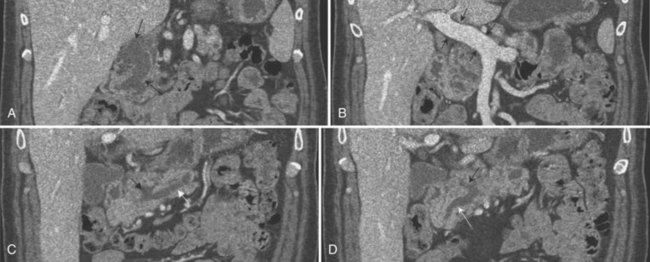
Serous Cystadenomas.
Often discovered incidentally on abdominal CT scans performed for other indications, pancreatic serous cystadenomas are slow-growing tumors with a 2 : 1 female/male predominance. These tumors present at a mean age of 63 years versus 54 years for mucinous cystadenomas/carcinomas. Symptoms include vague abdominal pain or back pain. Other symptoms—including nausea, weight loss, and vomiting—are less common. Initially, these tumors were called microcystic adenomas, a term that has fallen into disfavor because of reported macrocystic tumors (Anderson & Scheiman, 2002).
Serous cystadenomas generally are surrounded by a fibrous capsule and contain numerous tiny cysts, which are sometimes so small that the cystic nature is difficult to appreciate, because it is below the limits of CT resolution. In these instances, ultrasound or MRI may reveal the cystic nature more clearly. Cyst sizes may vary from 1 mm to 2 cm, but occasionally cysts several centimeters in size may be encountered; differentiation from mucinous cystic neoplasms may therefore be difficult (Warshaw et al, 1990; Visser et al, 2008; Chaudhari et al, 2007; Kim et al, 2006). A central stellate scar, when present, is helpful to make the diagnosis. MRI may be useful to visualize the cystic nature when CT findings are equivocal (Allen et al, 2003; Sahani et al, 2002; Visser et al, 2004). Because of their slow-growing nature and vague symptoms in only 50% of patients, these masses may be quite large at the time of discovery (Figs. 16.70 and 16.71).
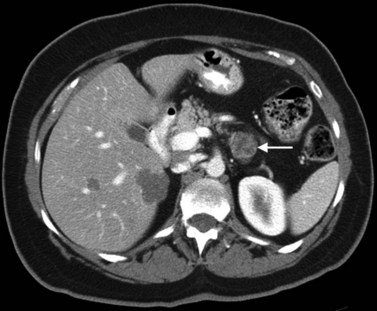
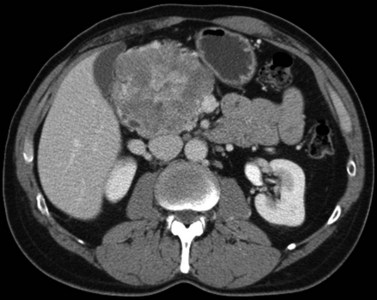
Mucinous Cystic Neoplasms.
Mucinous cystic adenomas of the pancreas often present a mixed picture pathologically, including benign mucin-producing epithelium, dysplasia, carcinoma in situ, and tissue invasion. No imaging criteria permit differentiation of benign from malignant tumors, and all mucinous cystic tumors should be considered malignant or premalignant and should be excised completely (Sarr et al, 2000; Visser et al, 2004; Wilentz et al, 2000).
Mucinous cystic adenomas are found more frequently in women (9 : 1 predominance) and are frequently within the body and tail of the pancreas. In a series of 52 female patients with pathologically proven mucinous cystic tumors (Procacci et al, 2001), the most highly associated features of malignancy were a thick wall (>2 mm), septations, and calcification in the wall or within septations (Fig. 16.72).
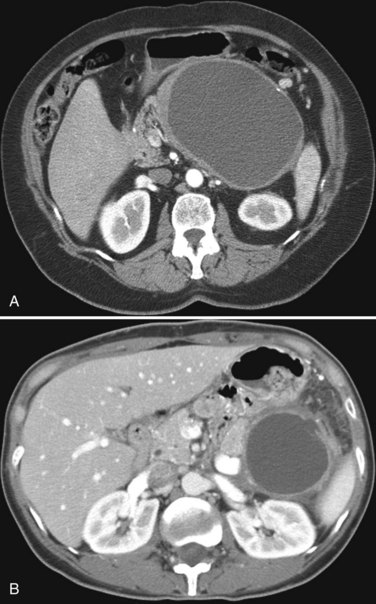
Other Cystic Pancreatic Masses.
Cystic masses may also be secondary to degeneration of previously solid masses. Neuroendocrine cancers may become necrotic and present with cystic degeneration (Fig. 16.73). Mucinous tumors may invade adjacent structures and present as cystic masses (Fig. 16.74).
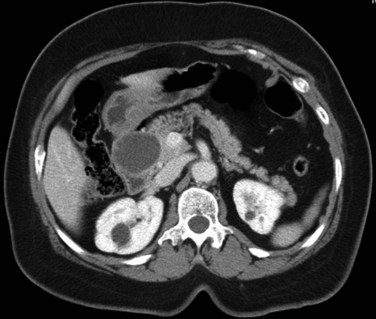
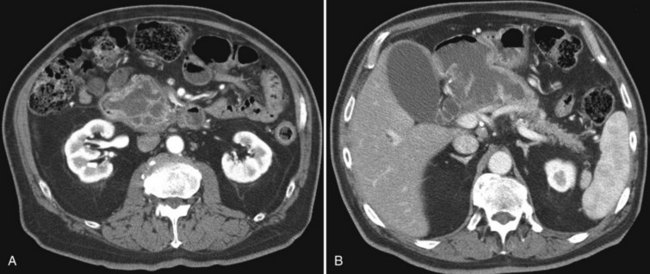
Metastatic Disease to the Pancreas (See Chapter 60)
A pathology review (Adsay et al, 2004) of surgical and autopsy cases showed the most common primary malignancies metastatic to the pancreas were lung carcinomas, gastrointestinal carcinomas, and lymphomas. These are usually found in patients with widely disseminated disease. As at other sites in the body, pancreatic lymphoma tends not to occlude vessels but to encase them. This is a major distinguishing feature useful for diagnosis (Fig. 16.75). Detection of metastatic disease to the pancreas requires a high index of suspicion, because primary pancreatic carcinomas of ductal origin are far more common. When clinical suspicion is present, the study can be tailored to optimize the likelihood of detection. In a patient with renal carcinoma, hypervascular metastases to the pancreas may be detected on routine scanning or triphasic examination (Fig. 16.76).
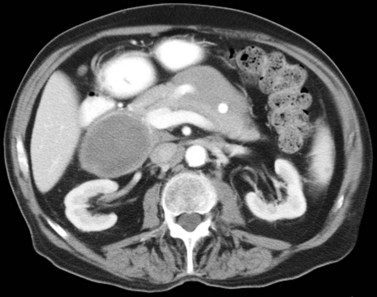
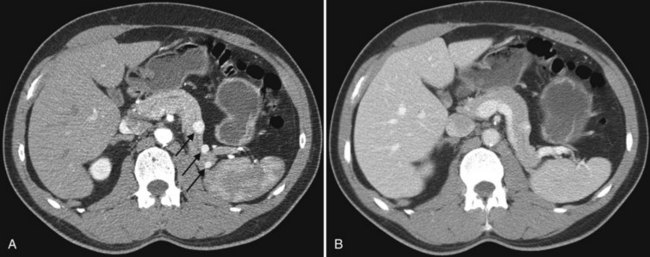
Solid and Papillary Epithelial Neoplasm of the Pancreas
Solid and papillary epithelial neoplasm (SPEN) of the pancreas is a rare tumor with a low malignant potential (Madan et al, 2004). SPEN has a reported incidence of 0.13% to 2.7% of all pancreatic malignancies and is most commonly encountered in the first three decades of life (Crawford, 1998; Cubilla & Fitzgerald, 1980; Lam et al, 1999), although the reported age range is 8 to 72 years with a mean age of 27 years. Female/male predominance is 9.5 : 1 (Mao et al, 1995), and these tumors are more common in nonwhites. Patients with malignant SPEN are often older and more often male (Lam et al, 1999). In a review of patients with pathologically proven SPENs, presenting complaints included abdominal pain, palpable mass, dyspepsia with bloating, and early satiety (Buetow et al, 1996; Yoon et al, 2001). Typically, laboratory findings are normal, with no elevation of tumor markers or serum amylase.
On CT, these tumors may have varied findings. They are often large and may have internal hemorrhage or cystic degeneration. Calcification is common (Fig. 16.77), but internal septations are not characteristic for this tumor (Buetow et al, 1996; West & Brady-West, 2000). Although this tumor is of low malignant potential, patients should be followed, because late metastases can occur.
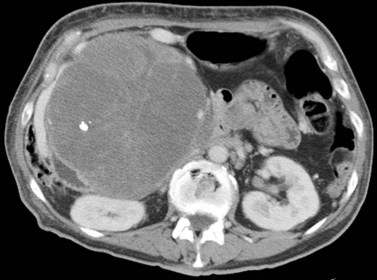
Acinar Cell Carcinoma of the Pancreas
Acinar cell carcinoma is predominantly a tumor of the elderly man, with peak incidence in the 60s and many more men affected than women. Accounting for approximately 1% of all pancreatic tumors, acinar cell carcinoma of the pancreas is defined as a carcinoma of the exocrine pancreas exhibiting pancreatic enzyme production by the neoplastic cells (Cubilla & Fitzgerald, 1975; Morohoshi et al, 1983). They have a characteristic microscopic appearance of a relatively circumscribed periphery and minimal desmoplastic stroma within the tumor, with cells arranged in nests and cords. The tumor is most common in the head, neck, and uncinate process of the pancreas but may arise in any portion of the gland (Holen et al, 2002; Klimstra et al, 1992). Initial symptoms include abdominal pain or fullness, postprandial vomiting, and jaundice. Some patients may be asymptomatic, and the mass may be detected incidentally. Serum tumor markers may be normal, or there may be mild elevation of serum α-fetoprotein, carcinoembryonic antigen (CEA), and CA19-9.
CT features include a well-defined tumor with a thin, enhancing capsule and central necrosis, which may contain areas of internal calcification (Fig. 16.78). Such calcification may be a useful feature in distinguishing this entity, because only 2% of ductal adenocarcinomas and 22% of nonfunctioning islet cell tumors contain calcification (Buetow et al, 1995b; Eelkema et al, 1984). In a more recent series (Chiou et al, 2004), tumor diameters ranged from 3.3 to 18 cm, with an overall mean size of 7.2 cm. Most of these tumors were hypodense with respect to normal pancreatic parenchyma, although some showed hypervascular enhancement on the early arterial phase, some of which persisted into the portal venous phase.
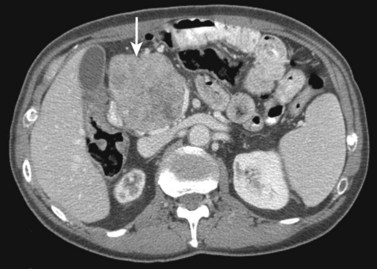
Inflammatory Diseases of the Pancreas
Pancreatitis (See Chapter 54, Chapter 55A, Chapter 55B )
The most common cystic mass of the pancreas is not a malignancy but rather a complication of acute or chronic pancreatitis. Fluid collections occur in approximately 50% of patients with moderate to severe pancreatitis. Of these, approximately 50% resolve spontaneously within 6 weeks (Baron & Morgan, 1997; Byrne et al, 2002), and 10% to 15% may progress to pseudocyst formation after developing a capsule. Pseudocyst formation is more common in patients with chronic pancreatitis and may occur in 20% to 40% of these patients.
Common causes of pancreatitis include alcohol, gallstones, idiopathic hypertriglyceridemia, drugs, pancreas divisum, trauma, and endoscopic retrograde cholangiopancreatography (Baron & Morgan, 1997). Clinical presentation includes nausea, vomiting, and epigastric pain. Serum amylase, frequently used to monitor pancreatitis, may be normal in acute pancreatitis and elevated in nonpancreatitic conditions. Elevation of the serum lipase may support the diagnosis of acute pancreatitis.
Mild acute pancreatitis may appear on CT scan as enlargement of the pancreas with loss of definition of the borders of the pancreas. Depending on the part of the pancreas involved, there may be thickening of the right or left anterior pararenal fascia or diffuse thickening of adjacent fascial planes (Figs. 16.79 and 16.80). Acute fluid collections associated with pancreatitis are enzyme-rich collections, which lack a defined wall.
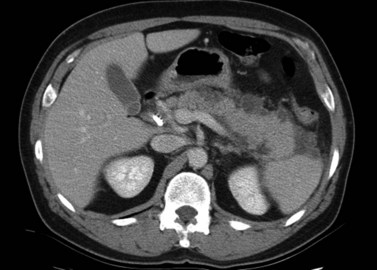
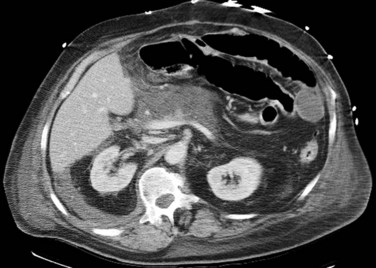
Pancreatic fluid collections may present as an acute fluid collection interspersed with pancreatic parenchyma without a defined wall. The fluid collection may be well circumscribed, or it may infiltrate throughout the pancreas and retroperitoneum; this may dissect retroperitoneal planes and resolve spontaneously 50% of the time. An acute pseudocyst is defined as a collection of pancreatic juice confined by a nonepithelialized wall of granulation tissue that occurs as a result of acute pancreatitis (Baron & Morgan, 1997) and requires at least 4 weeks to form (Fig. 16.81). It is characterized by the presence of a well-defined wall and may contain internal septations.
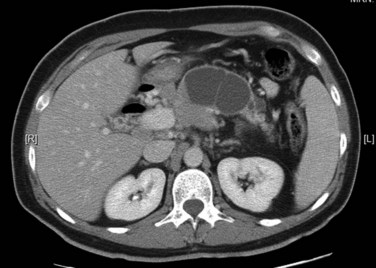
Lymphoplasmacytic Pancreatitis
Lymphoplasmacytic pancreatitis, also known as autoimmune pancreatitis (Kawaguchi et al, 1991; Kim KP et al, 2004; Yoshida et al, 1995), was first described as a “primary inflammatory sclerosis of the pancreas” (Sarles et al, 1961). It is characterized by a mixed inflammatory infiltrate centered around pancreatic ducts and ductules, combined with obliterative phlebitis (Hardacre et al, 2003). The clinical presentation can be identical to that of pancreatic adenocarcinoma, with abdominal pain, jaundice, weight loss, and elevated levels of CEA or CA19-9. Elevation of pancreatic enzymes is not a prominent feature of this entity, with mild elevation in serum amylase or lipase levels most commonly reported. Elevated levels of IgG and hypergammaglobulinemia are reported in 37% to 76% of patients with autoimmune pancreatitis (Kim et al, 2004b). Patients may also present with fluctuating obstructive jaundice without pain (Kamisawa et al, 2007).
Imaging features of this disease include diffuse or focal enlargement of the pancreas without pancreatic calcification or peripancreatic inflammation, often with nonvisualization of the pancreatic duct and associated with a low-attenuation rim around the pancreas (Fig. 16.82). Imaging also may show thickening of the wall of the common bile duct and gallbladder wall (Kawamoto et al, 2004; Takahashi et al, 2008), which pathologically is due to diffuse lymphoplasmacytic infiltration and fibrosis (Kloppel et al, 2003). Distinguishing lymphoplasmacytic pancreatitis from adenocarcinoma is important, because lymphoplasmacytic pancreatitis responds to oral steroid administration. Distinguishing focal lymphoplasmacytic pancreatitis with localized stenosis of the main pancreatic duct and associated pancreatic duct dilation from pancreatic carcinoma is often not possible, however, and the diagnosis is made only at laparotomy. A multifocal form of autoimmune pancreatitis has also been reported (Kajiwara et al, 2008).
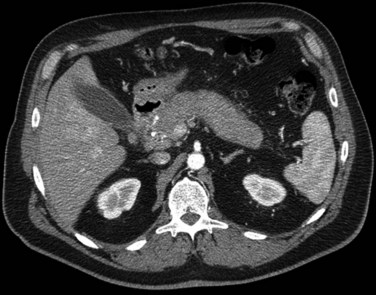
Groove Pancreatitis
Groove pancreatitis affects the groove between the pancreatic head, duodenum, and the common bile duct and was first described by Becker and named by Stolte and colleagues (Becker, 1973; Stolte et al, 1982). This can be extremely difficult to distinguish from groove pancreatic carcinoma, as patients are seen initially with abdominal pain and vomiting secondary to duodenal stenosis. This represents chronic pancreatitis that occurs with a platelike mass between the head of the pancreas and the duodenum, and it may cause intrahepatic and extrahepatic biliary duct dilation. Duodenal stenosis may be associated with wall thickening and cystlike lesions in the duodenal wall or in the groove area (Gabata et al, 2003; Lauffer et al, 1999; Triantopoulou et al, 2009; Fig. 16.83). Pancreatic duct dilation is much less common than bile duct dilation, and distinguishing groove pancreatitis from groove pancreatic carcinoma is done from a biopsy.
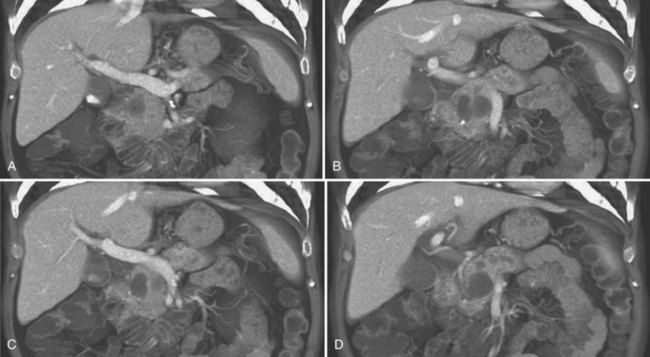
Other Nonneoplastic Pancreatic Masses: Ectopic Splenic Tissue
An unusual masslike entity that may be encountered in the pancreas is ectopic splenic tissue (Fig. 16.84). Autopsy studies have shown that 10% of patients have accessory spleens, and of these, nearly 20% are found in or near the tail of the pancreas (Halpert & Alden, 1964; Halpert & Gyorkey, 1959; Lauffer et al, 1999). This accessory spleen enhances in tandem with the spleen, but prospective diagnosis of this entity is difficult. A Japanese report described identical enhancement of the intrapancreatic splenic tissue and the major spleen, although this was a study using CT angiography and not peripheral venous access (Miyayama et al, 2003). Differentiating ectopic splenic tissue from other hypervascular masses, particularly neuroendocrine cancer, is difficult.
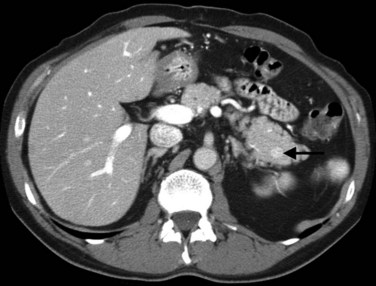
— 1991: A prospective analysis of 1518 laparoscopic cholecystectomies. The Southern Surgeons Club.
Adsay NV, et al. Secondary tumors of the pancreas: an analysis of a surgical and autopsy database and review of the literature. Virchows Arch. 2004;444(6):527-535.
Allen PJ, et al. Cystic lesions of the pancreas: selection criteria for operative and nonoperative management in 209 patients. J Gastrointest Surg. 2003;7(8):970-977.
Anderson MA, Scheiman JM. Nonmucinous cystic pancreatic neoplasms. Gastrointest Endosc Clin N Am. 2002;12(4):769-779.
Arakawa M, et al. Emergence of malignant lesions within an adenomatous hyperplastic nodule in a cirrhotic liver: observations in five cases. Gastroenterology. 1986;91:198-208.
Awaya M, et al. Cirrhosis: modified caudate–right lobe ratio. Radiology. 2002;224:769-774.
Baer HU, et al. Management of the Mirizzi syndrome and the surgical implications of cholecystocholedochal fistula. Br J Surg. 1990;77(7):743-745.
Baron RL. Common bile duct stones: reassessment of criteria for CT diagnosis. Radiology. 1987;162(2):419-424.
Baron RL, Peterson MS. From the RSNA refresher courses: screening the cirrhotic liver for hepatocellular carcinoma with CT and MR imaging: opportunities and pitfalls. Radiographics. 2001;21(Suppl):S117-S132.
Baron TH, Morgan DE. The diagnosis and management of fluid collections associated with pancreatitis. Am J Med. 1997;102(6):555-563.
Bassi C, et al. Intraductal papillary mucinous tumors of the pancreas. Verona University Pancreatic Team. Int J Pancreatol. 2000;27(3):181-193.
Becker V. Proceedings: fundamental morphological aspects of acute and chronic pancreatitis (author’s transl). Langenbecks Arch Chir. 1973;334:317-322.
Bennett G, et al. CT findings in acute gangrenous cholecystitis. Am J Roentgenol. 2002;178:275-281.
Berdah S, et al. A western surgical experience of peripheral cholangiocarcinoma. Br J Surg. 1996;83:1517-1521.
Berk R, et al. Carcinoma in the porcelain gallbladder. Radiology. 1973;106:29-31.
Berman M, et al. Hepatocellular carcinoma: polygonal cell type with fibrous stroma—an atypical variant with a favorable prognosis. Cancer. 1980;46:1448-1455.
Bismuth H. Surgical anatomy and anatomical surgery of the liver. World J Surg. 1982;6:3-9.
Blumgart LH. Hepatobiliary Cancer: Atlas of Clinical Oncology. Hamilton, Ontario, BC: Decker; 2001.
Bouras T, et al. Imaging of symptomatic giant hemangioma. J Radiol. 1996;77:1145-1148.
Brancatelli G, et al. Helical CT screening for hepatocellular carcinoma in patients with cirrhosis: frequency and causes of false-positive interpretation. Am J Roentgenol. 2003;180(4):1007-1014.
Brancatelli G, et al. Hepatocellular carcinoma in noncirrhotic liver: CT, clinical, and pathologic findings in 39 U.S. residents. Radiology. 2002;222(1):89-94.
Brandt DJ, et al. Imaging of fibrolamellar hepatocellular carcinoma. AJR Am J Roentgenol. 1988;151(2):295-299.
Buetow PC, et al. Biliary cystadenoma and cystadenocarcinoma: clinical–imaging–pathologic correlations with emphasis on the importance of ovarian stroma. Radiology. 1995;196(3):805-810.
Buetow PC, et al. Islet cell tumors of the pancreas: pathologic imaging correlation among size, necrosis and cysts, calcification, malignant behavior, and functional status. AJR Am J Roentgenol. 1995;165:1175-1179.
Buetow PC, et al. Solid and papillary epithelial neoplasm of the pancreas: imaging–pathologic correlation on 56 cases. Radiology. 1996;199(3):707-711.
Burke EC, et al. Hilar cholangiocarcinoma: patterns of spread, the importance of hepatic resection for curative operation, and a presurgical clinical staging system. Ann Surg. 1998;228(3):385-394.
Byrne MF, et al. Pancreatic pseudocysts. Curr Treat Options Gastroenterol. 2002;5(5):331-338.
Cantisani V, et al. MR imaging features of solid pseudopapillary tumor of the pancreas in adult and pediatric patients. AJR Am J Roentgenol. 2003;181(2):395-401.
Carlson SK, et al. CT of focal nodular hyperplasia of the liver. AJR Am J Roentgenol. 2000;174(3):705-712.
Castellino RA. Imaging techniques for staging abdominal Hodgkin’s disease. Cancer Treat Rep. 1982;66(4):697-700.
Chae YS, et al. Preoperative chemoradiation and pancreaticoduodenectomy with portal vein resection for localized advanced pancreatic cancer. Yonsei Med J. 2003;44(3):551-556.
Chaudhari VV, et al. Pancreatic cystic lesions: discrimination accuracy based on clinical data and high-resolution CT features. J Comput Assist Tomogr. 2007;31(6):860-867.
Chen MY, et al. Cystic changes in hepatic metastases from gastrointestinal stromal tumors (GISTS) treated with Gleevec (imatinib mesylate). AJR Am J Roentgenol. 2002;179:1059-1062.
Chiou YY, et al. Acinar cell carcinoma of the pancreas: clinical and computed tomography manifestations. J Comput Assist Tomogr. 2004;28(2):180-186.
Chu KM, et al. Intrahepatic cholangiocarcinoma. World J Surg. 1997;21(3):301-305. discussion 305-306
Chu QD, et al. Predictive factors associated with long-term survival in patients with neuroendocrine tumors of the pancreas. Ann Surg Oncol. 2002;9(9):855-862.
Clair DG, et al. Rapid development of umbilical metastases after laparoscopic cholecystectomy for unsuspected gallbladder carcinoma. Surgery. 1993;113(3):355-358.
Covey AM, et al. Incidence, patterns, and clinical relevance of variant portal vein anatomy. AJR Am J Roentgenol. 2004;183(4):1055-1064.
Craig J, et al. Fibrolamellar carcinoma of the liver: a tumor of adolescents and young adults with distinctive clinicopathologic features. Cancer. 1980;46:372-379.
Crawford BE2nd. Solid and papillary epithelial neoplasm of the pancreas, diagnosis by cytology. South Med J. 1998;91(10):973-977.
Cubilla AL, Fitzgerald PJ. Morphological patterns of primary nonendocrine human pancreas carcinoma. Cancer Res. 1975;35(8):2234-2248.
Cubilla AL, et al. Cancer (non-endocrine) of the pancreas: a suggested classification. Monogr Pathol. 1980;21:82-110.
de Diego Choliz J, et al. Computed tomography in hepatic echinococcosis. AJR Am J Roentgenol. 1982;139(4):699-702.
Devaney K, et al. Hepatobiliary cystadenoma and cystadenocarcinoma: a light microscopic and immunohistochemical study of 70 patients. Am J Surg Pathol. 1994;18(11):1078-1091.
Didier D, et al. Hepatic alveolar echinococcosis: correlative US and CT study. Radiology. 1985;154(1):179-186.
D’Onofrio M, et al. Small undifferentiated pancreatic adenocarcinoma which mimics IPMN at imaging. JOP. 2009;4:406-408.
Eelkema EA, et al. CT features of nonfunctioning islet cell carcinoma. AJR Am J Roentgenol. 1984;143(5):943-948.
Eisenberg D, et al. CT and sonography of multiple bile-duct hamartomas simulating malignant liver disease (case report). AJR Am J Roentgenol. 1986;147(2):279-280.
Zandrino F. Multislice CT cholangiography without biliary contrast agent: technique and initial clinical results in the assessment of patients with biliary obstruction. Eur Radiol. 2002;12:1155-1161.
Ferrari R, et al. Anatomical variations of the coeliac trunk and the mesenteric arteries evaluated with 64-row CT angiography. Radiol Med. 2007;112(7):988-998.
Ferrucci JT. Biliopancreatic malignancy current diagnostic possibilities: an overview. Ann Oncol. 1999;10(Suppl 4):143-144.
Fishman EK, Horton KM. Imaging pancreatic cancer: the role of multidetector CT with three-dimensional CT angiography. Pancreatology. 2001;1(6):610-624.
Fishman EK, et al. CT of lymphoma: spectrum of disease. Radiographics. 1991;11(4):647-669.
Fishman EK, et al. Multidetector CT angiography in the evaluation of pancreatic carcinoma: preliminary observations. J Comput Assist Tomogr. 2000;24(6):849-853.
Flejou JF, et al. Liver adenomatosis: an entity distinct from liver adenoma? Gastroenterology. 1985;89(5):1132-1138.
Fletcher JG, et al. Pancreatic malignancy: value of arterial, pancreatic, and hepatic phase imaging with multi-detector row CT. Radiology. 2003;229(1):81-90.
Fong Y, et al. An analysis of 412 cases of hepatocellular carcinoma at a Western center. Ann Surg. 1999;229:790-800.
Foster JH, Berman MM. Solid liver tumors. Major Probl Clin Surg. 1977;22:1-342.
Franquet T, et al. Primary gallbladder carcinoma: imaging findings in 50 patients with pathologic correlation. Gastrointest Radiol. 1991;16(2):143-148.
Freeman HJ. Intraductal papillary mucinous neoplasms and other pancreatic cystic lesions. World J Gastroenterol. 2008;14(19):2977-2979.
Freeny PC, et al. Hepatocellular carcinoma: reduced frequency of typical findings with dynamic contrast-enhanced CT in a non-Asian population. Radiology. 1992;182(1):143-148.
Friedman AC, et al. Fibrolamellar hepatocellular carcinoma. Radiology. 1985;157(3):583-587.
Gabata T, et al. Aberrant gastric venous drainage in a focal spared area of segment IV in fatty liver: demonstration with color Doppler sonography. Radiology. 1997;203(2):461-463.
Gabata T, et al. Groove pancreatic carcinomas: radiological and pathological findings. Eur Radiol. 2003;13(7):1679-1684.
Gangi S, et al. Time interval between abnormalities seen on CT and the clinical diagnosis of pancreatic cancer: retrospective review of CT scans obtained before diagnosis. AJR Am J Roentgenol. 2004;182:897-903.
Gong JS, Xu JM. Role of curved planar reformations using multidetector spiral CT in diagnosis of pancreatic and peripancreatic diseases. World J Gastroenterol. 2004;10(13):1943-1947.
Goodman ZD, et al. Combined hepatocellular-cholangiocarcinoma: a histologic and immunohistochemical study. Cancer. 1985;55(1):124-135.
Gouya H, et al. CT, endoscopic sonography, and a combined protocol for preoperative evaluation of pancreatic insulinomas. AJR Am J Roentgenol. 2003;181(4):987-992.
Graser A, et al. Dual energy CT: preliminary observations and potential clinical applications in the abdomen. Eur Radiol. 2009;19(1):13-23.
Grazioli L, et al. Liver adenomatosis: clinical, histopathologic, and imaging findings in 15 patients. Radiology. 2000;216(2):395-402.
Grazioli L, et al. Hepatic adenomas: imaging and pathologic findings. Radiographics. 2001;21(4):877-892. discussion 892-894
Grossholz M, et al. Focal sparing in the fatty liver as a sign of an adjacent space-occupying lesion. Am J Roentgenol. 1998;171(5):1391-1395.
Halpert B, Alden ZA. Spleen in or at the tail of the pancreas: a survey of 2700 additional necropsies. Arch Pathol. 1964;77:651-654.
Halpert B, Gyorky F. Lesions observed in accessory spleens of 311 patients. Am J Clin Pathol. 1959;32(2):165-168.
Halvorsen RA, et al. The variable CT appearance of hepatic abscesses. AJR Am J Roentgenol. 1984;142(5):941-946.
Han JK, et al. Cholangiocarcinoma: pictorial essay of CT and cholangiographic findings. Radiographics. 2002;22(1):173-187.
Harbin WP, et al. Diagnosis of cirrhosis based on regional changes in hepatic morphology: a radiological and pathological analysis. Radiology. 1980;135(2):273-283.
Hardacre JM, et al. Results of pancreaticoduodenectomy for lymphoplasmacytic sclerosing pancreatitis. Ann Surg. 2003;237(6):853-858. discussion 858-859
Harrison LE, et al. Surgical treatment of 32 patients with peripheral intrahepatic cholangiocarcinoma. Br J Surg. 1998;85(8):1068-1070.
Henson DE, et al. Carcinoma of the gallbladder: histologic types, stage of disease, grade, and survival rates. Cancer. 1992;70(6):1493-1497.
Holen KD, et al. Clinical characteristics and outcomes from an institutional series of acinar cell carcinoma of the pancreas and related tumors. J Clin Oncol. 2002;20(24):4673-4678.
Honda H, et al. Differential diagnosis of hepatic tumors (hepatoma, hemangioma, and metastasis) with CT: value of two-phase incremental imaging. AJR Am J Roentgenol. 1992;159(4):735-740.
Horiguchi A, et al. Multislice CT study of pancreatic head arterial dominance. J Hepatobiliary Pancreat Surg. 2008;15(3):322-326.
Horton KM, Fishman EK. 3D CT angiography of the celiac and superior mesenteric arteries with multidetector CT data sets: preliminary observations. Abdom Imaging. 2000;25(5):523-525.
Horton KM, et al. CT and MR imaging of benign hepatic and biliary tumors. Radiographics. 1999;19(2):431-451.
House MG, et al. Predicting resectability of periampullary cancer with three-dimensional computed tomography. J Gastrointest Surg. 2004;8(3):280-288.
Ibukuro K. Vascular anatomy of the pancreas and clinical applications. Int J Gastrointest Cancer. 2001;30(1-2):87-104.
Ibukuro K, et al. Helical CT angiography with multiplanar reformation: techniques and clinical applications. Radiographics. 1995;15(3):671-682.
Ichikawa T, et al. Hepatocellular adenoma: multiphasic CT and histopathologic findings in 25 patients. Radiology. 2000;214(3):861-868.
Ishak KG, et al. Biliary cystadenoma and cystadenocarcinoma: report of 14 cases and review of the literature. Cancer. 1977;39(1):322-338.
Ishiguchi T, et al. CT and MR imaging of pancreatic cancer. Hepatogastroenterology. 2001;48(40):923-927.
Itai Y, Teraoka T. Angiosarcoma of the liver mimicking cavernous hemangioma on dynamic CT. J Comput Assist Tomogr. 1989;13(5):910-912.
Jacobs JE, et al. Diagnostic criteria for fatty infiltration of the liver on contrast-enhanced helical CT. AJR Am J Roentgenol. 1998;171(3):659-664.
Jarnagin W, Winston C. Hilar cholangiocarcinoma: diagnosis and staging. HPB (Oxford). 2005;7(4):244-251.
Jarnagin WR, et al. Staging, resectability, and outcome in 225 patients with hilar cholangiocarcinoma. Ann Surg. 2001;234(4):507-517. discussion 517-519
Jeffrey RBJr, et al. CT of small pyogenic hepatic abscesses: the cluster sign. AJR Am J Roentgenol. 1988;151(3):487-489.
Johnson PT, et al. CT angiography with volume rendering: advantages and applications in splanchnic vascular imaging. Radiology. 1996;200(2):564-568.
Johnson PT, et al. Multidetector-row computed tomography with three-dimensional volume rendering of pancreatic cancer: a complete preoperative staging tool using computed tomography angiography and volume-rendered cholangiopancreatography. J Comput Assist Tomogr. 2003;27(3):347-353.
Johnston RJ, et al. Diagnosis of fatty infiltration of the liver on contrast enhanced CT: limitations of liver-minus-spleen attenuation difference measurements. Abdom Imaging. 1998;23(4):409-415.
Kajiwara M, et al. Autoimmune pancreatitis with multifocal lesions. J Hepatobiliary Pancreat Surg. 2008;15(4):449-452.
Kalra MK, et al. Sixteen-detector row CT of abdomen and pelvis: study for optimization of Z-axis modulation technique performed in 153 patients. Radiology. 2004;233(1):241-249.
Kamisawa T, et al. Clinical management of autoimmune pancreatitis. Adv Med Sci. 2007;52:61-65.
Kang HK, et al. Three-dimensional multi-detector row CT portal venography in the evaluation of portosystemic collateral vessels in liver cirrhosis. Radiographics. 2002;22(5):1053-1061.
Kapoor V, et al. Multidetector CT arteriography with volumetric three-dimensional rendering to evaluate patients with metastatic colorectal disease for placement of a floxuridine infusion pump. AJR Am J Roentgenol. 2003;181(2):455-463.
Karhunen PJ. Benign hepatic tumours and tumour-like conditions in men. J Clin Pathol. 1986;39(2):183-188.
Kawaguchi K, et al. Lymphoplasmacytic sclerosing pancreatitis with cholangitis: a variant of primary sclerosing cholangitis extensively involving pancreas. Hum Pathol. 1991;22(4):387-395.
Kawamoto S, et al. Lymphoplasmacytic sclerosing pancreatitis with obstructive jaundice: CT and pathology features. AJR Am J Roentgenol. 2004;183(4):915-921.
Kawamoto S, et al. Intraductal papillary mucinous neoplasm of the pancreas: can benign lesions be differentiated from malignant lesions with multidetector CT? Radiographics. 2005;25(6):1451-1468.
Keogan MT, et al. Contrast-enhanced CT of intrahepatic and hilar cholangiocarcinoma: delay time for optimal imaging. AJR Am J Roentgenol. 1997;169(6):1493-1499.
Khan ZR, et al. Risk factors for biliary tract cancers. Am J Gastroenterol. 1999;94(1):149-152.
Kim DJ, et al. Validation of the Harvard Cancer Risk Index: a prediction tool for individual cancer risk. J Clin Epidemiol. 2004;57(4):332-340.
Kim JH, et al. Should we perform surgical management in all patients with suspected porcelain gallbladder? Hepatogastroenterology. 2009;56(93):943-945.
Kim KP, et al. Autoimmune chronic pancreatitis. Am J Gastroenterol. 2004;99(8):1605-1616.
Kim SY, et al. Macrocystic neoplasms of the pancreas: CT differentiation of serous oligocystic adenoma from mucinous cystadenoma and intraductal papillary mucinous tumor. AJR Am J Roentgenol. 2006;187(5):1192-1198.
Kimura W, et al. Duct-ectatic type of mucin-producing tumor of the pancreas: new concept of pancreatic neoplasia. Hepatogastroenterology. 1996;43:692-709.
Kitagawa H, et al. Carcinomas of the ventral and dorsal pancreas exhibit different patterns of lymphatic spread. Front Biosci. 2008;13:2728-2735.
Klauss M, et al. A new invasion score for determining the resectability of pancreatic carcinomas with contrast-enhanced multidetector computed tomography. Pancreatology. 2008;8(2):204-210.
Klimstra DS, et al. Acinar cell carcinoma of the pancreas: a clinicopathologic study of 28 cases. Am J Surg Pathol. 1992;16(9):815-837.
Kloppel G, et al. Autoimmune pancreatitis: pathological, clinical, and immunological features. Pancreas. 2003;27(1):14-19.
Kulke MH. Neuroendocrine tumours: clinical presentation and management of localized disease. Cancer Treat Rev. 2003;29(5):363-370.
Labrune P, et al. Hepatocellular adenomas in glycogen storage disease type I and III: a series of 43 patients and review of the literature. J Pediatr Gastroenterol Nutr. 1997;24(3):276-279.
Lacomis JM, et al. Cholangiocarcinoma: delayed CT contrast enhancement patterns. Radiology. 1997;203(1):98-104.
Lam KY, et al. Pancreatic solid cystic papillary tumor: clinicopathologic features in eight patients from Hong Kong and review of the literature. World J Surg. 1999;23(10):1045-1050.
Lane J, et al. Primary carcinoma of the gallbladder: a pictorial essay. Radiographics. 1989;9(2):209-228.
Lauffer JM, et al. Intrapancreatic accessory spleen: a rare cause of a pancreatic mass. Int J Pancreatol. 1999;25(1):65-68.
Lawler LP, Fishman EK. Three-dimensional CT angiography with multidetector CT data: study optimization, protocol design, and clinical applications in the abdomen. Crit Rev Comput Tomogr. 2002;43(2):77-141.
Leese T, et al. Liver cell adenomas: a 12-year surgical experience from a specialist hepato-biliary unit. Ann Surg. 1988;208(5):558-564.
Leslie DF, et al. Single-pass CT of hepatic tumors: value of globular enhancement in distinguishing hemangiomas from hypervascular metastases. AJR Am J Roentgenol. 1995;165(6):1403-1406.
Lev-Toaff AS, et al. The radiologic and pathologic spectrum of biliary hamartomas. AJR Am J Roentgenol. 1995;165(2):309-313.
Levy AD, et al. Gallbladder carcinoma: radiologic–pathologic correlation. Radiographics. 2001;21(2):295-314. questionnaire, 549-555
Liddell RM, et al. Normal intrahepatic bile ducts: CT depiction. Radiology. 1990;176(3):633-635.
Lim J, et al. Papillary neoplasms of the bile duct that mimic biliary stone disease. Radiographics. 2003;23:447-455.
Lim JH, et al. Intraductal papillary mucinous tumor of the bile ducts. Radiographics. 2004;24(1):53-66. discussion 67
Liver Cancer Study Group of Japan. Classification of Primary Liver Cancer. Tokyo: Kanehara; 1997. pp 6-8
Lowenfels AB, et al. Gallstones and risk of gallbladder cancer. J Natl Cancer Inst. 1985;75(1):77-80.
Lygidakis NJ, et al. Mono-bloc total spleno-pancreaticoduodenectomy for pancreatic head carcinoma with portal-mesenteric venous invasion: a prospective randomized study. Hepatogastroenterology. 2004;51(56):427-433.
Maceyko RF, Camisa C. Kasabach-Merritt syndrome. Pediatr Dermatol. 1991;8(2):133-136.
Madan AK, et al. Solid and papillary epithelial neoplasm of the pancreas. J Surg Oncol. 2004;85(4):193-198.
Magnusson M, et al. Evaluation of methods for shaded surface display of CT volumes. Comput Med Imaging Graph. 1991;15(4):247-256.
Mao C, et al. Papillary cystic and solid tumors of the pancreas: a pancreatic embryonic tumor? Studies of three cases and cumulative review of the world’s literature. Surgery. 1995;118(5):821-828.
Marchal G, et al. “Skip areas” in hepatic steatosis: a sonographic-angiographic study. Gastrointest Radiol. 1986;11(2):151-157.
Marin D, et al. Hypervascular liver tumors: low tube voltage, high tube current multidetector CT during late hepatic arterial phase for detections: initial clinical experience. Radiology. 2009;251(3):771-779.
Matsui O, et al. Focal sparing of segment IV in fatty livers shown by sonography and CT: correlation with aberrant gastric venous drainage. AJR Am J Roentgenol. 1995;164:1137-1140.
McLarney JK, et al. Fibrolamellar carcinoma of the liver: radiologic–pathologic correlation. Radiographics. 1999;19(2):453-471.
Mendez RJ, et al. Hepatic abscesses: MR imaging findings. Radiology. 1994;190(2):431-436.
Mergo PJ, Ros PR. MR imaging of inflammatory disease of the liver. Magn Reson Imaging Clin N Am. 1997;5(2):367-376.
Mertz HR, et al. EUS, PET, and CT scanning for evaluation of pancreatic adenocarcinoma. Gastrointest Endosc. 2000;52(3):367-371.
Metser U, et al. Fungal liver infection in immunocompromised patients: depiction with multiphasic contrast-enhanced helical CT. Radiology. 2005;235(1):97-105.
Michels N. Blood Supply and Anatomy of the Upper Abdominal Organs with a Descriptive Atlas. Philadelphia: Lippincott; 1955. p 581
Mitsudo K, et al. Nonenhanced hepatic cavernous hemangioma with multiple calcifications: CT and pathologic correlation. Abdom Imaging. 1995;20(5):459-461.
Miyayama S, et al. Intrapancreatic accessory spleen: evaluation by CT arteriography. Abdom Imaging. 2003;28(6):862-865.
Morohoshi T, et al. Exocrine pancreatic tumours and their histological classification: a study based on 167 autopsy and 97 surgical cases. Histopathology. 1983;7(5):645-661.
Moulton JS, et al. Passive hepatic congestion in heart failure: CT abnormalities. AJR Am J Roentgenol. 1988;151(5):939-942.
Murphy BJ, et al. The CT appearance of cystic masses of the liver. Radiographics. 1989;9(2):307-322.
Nagasaka T, Nakashima N. Problems in histological diagnosis of intraductal papillary-mucinous tumor (IPMT). Hepatogastroenterology. 2001;48(40):972-976.
Nagorney DM, McPherson GA. Carcinoma of the gallbladder and extrahepatic bile ducts. Semin Oncol. 1988;15(2):106-115.
Nagorney DM, et al. Outcomes after curative resections of cholangiocarcinoma. Arch Surg. 1993;128(8):871-877. discussion 877-879
Nakamura A. New classification of pancreatic intraductal papillary-mucinous tumour by mucin expression: its relationship with potential for malignancy. J Pathol. 2002;197(2):201-210.
Nakao A, et al. Extended radical resection versus standard resection for pancreatic cancer: the rationale for extended radical resection. Pancreas. 2004;28(3):289-292.
Nakeeb A, et al. Cholangiocarcinoma: a spectrum of intrahepatic, perihilar, and distal tumors. Ann Surg. 1996;224(4):463-473. discussion 473-475
Nazarian L, et al. Size of colorectal liver metastases at abdominal CT: comparison of precontrast and postcontrast studies. Radiology. 1999;213:825-830.
Nelson RC, Chezmar JL. Diagnostic approach to hepatic hemangiomas. Radiology. 1990;176(1):11-13.
Nguyen BN, et al. Focal nodular hyperplasia of the liver: a comprehensive pathologic study of 305 lesions and recognition of new histologic forms. Am J Surg Pathol. 1999;23(12):1441-1454.
Ogawa H, et al. Intraductal papillary mucinous neoplasm of the pancreas: assessment of the likelihood of invasiveness with multisection CT. Radiology. 2008;248(3):876-886.
Ohashi I, et al. Hepatic pseudolesion in the left lobe around the falciform ligament at helical CT. Radiology. 1995;196:245-249.
Okuda K, et al. Hepatocellular carcinoma arising in noncirrhotic and highly cirrhotic livers: a comparative study of histopathology and frequency of hepatitis B markers. Cancer. 1982;49(3):450-455.
Pape UF, et al. Survival and clinical outcome of patients with neuroendocrine tumors of the gastroenteropancreatic tract in a German referral center. Ann N Y Acad Sci. 2004;1014:222-233.
Paulson EK, et al. Focal fatty infiltration: a cause of nontumorous defects in the left hepatic lobe during CT arterial portography. J Comput Assist Tomogr. 1993;17(4):590-595.
Pinna AD, et al. Treatment of fibrolamellar hepatoma with subtotal hepatectomy or transplantation. Hepatology. 1997;26(4):877-883.
Pitt HA, et al. Malignancies of the biliary tree. Curr Probl Surg. 1995;32(1):1-90.
Procacci C, et al. CT features of malignant mucinous cystic tumors of the pancreas. Eur Radiol. 2001;11(9):1626-1630.
Prokesch RW, et al. Multidetector CT of pancreatic adenocarcinoma: diagnostic advances and therapeutic relevance. Eur Radiol. 2003;13(9):2147-2154.
Quinn SF, Benjamin GG. Hepatic cavernous hemangiomas: simple diagnostic sign with dynamic bolus CT. Radiology. 1992;182(2):545-548.
Radin DR, et al. CT of amebic liver abscess. AJR Am J Roentgenol. 1988;150(6):1297-1301.
Ralls PW. Focal inflammatory disease of the liver. Radiol Clin North Am. 1998;36(2):377-389.
Rha SE, et al. CT and MR imaging findings of endocrine tumor of the pancreas according to WHO classification. Eur J Radiol. 2007;62(3):371-377.
Ros PR, et al. Hemangioma of the liver: heterogeneous appearance on T2-weighted images. AJR Am J Roentgenol. 1987;149(6):1167-1170.
Rubin GD. 3-D imaging with MDCT. Eur J Radiol. 2003;45(Suppl 1):S37-S41.
Sada PN, Ramakrishna B. Computed tomography of von Meyenburg complex simulating micro-abscesses. Australas Radiol. 1994;38(3):225-226.
Sahani D, et al. Cystic pancreatic neoplasms evaluation by CT and magnetic resonance cholangiopancreatography. Gastrointest Endosc Clin N Am. 2002;12(4):657-672.
Salgado R, et al. CT angiography: basic principles and post-processing applications. JBR-BTR. 2003;86(6):336-340.
Sandrasegaran K, et al. Staging of lymphoma in adults. Clin Radiol. 1994;49(3):149-161.
Sarles H, et al. Chronic inflammatory sclerosis of the pancreas: an autonomous pancreatic disease? Am J Dig Dis. 1961;6:688-698.
Sarr M, et al. Clinical and pathologic correlation of 84 mucinous cystic neoplasms of the pancreas: can one reliably differentiate benign from malignant (or premalignant) neoplasms? Ann Surg. 2000;231:205-212.
Schulte SJ, et al. CT of the extrahepatic bile ducts: wall thickness and contrast enhancement in normal and abnormal ducts. AJR Am J Roentgenol. 1990;154(1):79-85.
Shamsi K, et al. Focal nodular hyperplasia of the liver: radiologic findings. Abdom Imaging. 1993;18(1):32-38.
Sherlock S, Dooley J. Disease of the Liver and Biliary System, 10th ed. London: Blackwell; 1997. pp 642-649
Sica GT, et al. CT and MR imaging of hepatic metastases. AJR Am J Roentgenol. 2000;174(3):691-698.
Silverman PM, et al. CT appearance of abdominal Thorotrast deposition and Thorotrast-induced angiosarcoma of the liver. J Comput Assist Tomogr. 1983;7(4):655-658.
Smalley SR, et al. Hepatoma in the noncirrhotic liver. Cancer. 1988;62(7):1414-1424.
Soe K. Liver pathology associated with the use of anabolic-androgenic steroids. Liver. 1992;12:73-79.
Sohn TA, et al. Intraductal papillary mucinous neoplasms of the pancreas: an updated experience. Ann Surg. 2004;239(6):788-797. discussion 797-799
Sons HU, et al. Carcinoma of the gallbladder: autopsy findings in 287 cases and review of the literature. J Surg Oncol. 1985;28(3):199-206.
Soriano A, et al. Preoperative staging and tumor resectability assessment of pancreatic cancer: prospective study comparing endoscopic ultrasonography, helical computed tomography, magnetic resonance imaging, and angiography. Am J Gastroenterol. 2004;99(3):492-501.
Soyer P, et al. CT of fibrolamellar hepatocellular carcinoma. J Comput Assist Tomogr. 1991;15(4):533-538.
Stephen AE, Berger DL. Carcinoma in the porcelain gallbladder: a relationship revisited. Surgery. 2001;129(6):699-703.
Stevens WR, et al. Mosaic pattern of hepatocellular carcinoma: histologic basis for a characteristic CT appearance. J Comput Assist Tomogr. 1996;20(3):337-342.
Stolte M, et al. A special form of segmental pancreatitis: “groove pancreatitis. Hepatogastroenterology. 1982;29(5):198-208.
Sugiyama M, Atomi Y. Extrapancreatic neoplasms occur with unusual frequency in patients with intraductal papillary mucinous tumors of the pancreas. Am J Gastroenterol. 1999;94(2):470-473.
Sugiyama M, et al. Predictive factors for malignancy in intraductal papillary-mucinous tumours of the pancreas. Br J Surg. 2003;90(10):1244-1249.
Takada A, et al. Branch duct-type intraductal papillary mucinous tumor: diagnostic value of multiplanar reformatted images in multislice CT. Eur Radiol. 2005;15(9):1888-1897.
Takahashi N, et al. Dual-phase CT of autoimmune pancreatitis: a multireader study. AJR Am J Roentgenol. 2008;190(2):280-286.
Takayasu K, et al. Computed tomography of a rapidly growing hepatic hemangioma. J Comput Assist Tomogr. 1990;14(1):143-145.
Takeshita K, et al. Multidetector row helical CT of the pancreas: value of three-dimensional images, two-dimensional reformations, and contrast-enhanced multiphasic imaging. J Hepatobiliary Pancreat Surg. 2002;9(5):576-582.
Tamm E, Charnsangavej C. Pancreatic cancer: current concepts in imaging for diagnosis and staging. Cancer J. 2001;7(4):298-311.
Tamm E, et al. Advanced 3-D imaging for the evaluation of pancreatic cancer with multidetector CT. Int J Gastrointest Cancer. 2001;30(1-2):65-71.
Tan L, et al. Imaging features of intraductal papillary mucinous neoplasms of the pancreas in multi-detector row computed tomography. World J Gastroenterol. 2009;15(32):4037-4043.
Tanaka M. Intraductal papillary mucinous neoplasm of the pancreas: diagnosis and treatment. Pancreas. 2004;28(3):282-288.
Tidebrant G, et al. Comparison of non-enhanced, bolus-enhanced, and delayed scanning techniques in computed tomography of hepatic tumours. Acta Radiol. 1990;31(2):161-166.
Torres WE, et al. Computed tomography of hepatic morphologic changes in cirrhosis of the liver. J Comput Assist Tomogr. 1986;10(1):47-50.
Tran-Minh VA, et al. Volvulus of a pedunculated hemangioma of the liver. AJR Am J Roentgenol. 1991;156(4):866-867.
Triantopoulou C, et al. Groove pancreatitis: a diagnostic challenge. Eur Radiol. 2009;19(7):1736-1743.
Valls C, et al. Intrahepatic peripheral cholangiocarcinoma: CT evaluation. Abdom Imaging. 2000;25(5):490-496.
Van Hoe L, Baert AL. Pancreatic carcinoma: applications for helical computed tomography. Endoscopy. 1997;29(6):539-660.
Vargas R, et al. MDCT in pancreatic adenocarcinoma: prediction of vascular invasion and resectability using a multiphasic technique with curved planar reformations. Am J Roentgenol. 2004;182(2):419-425.
Vauthey JN, et al. Factors affecting long-term outcome after hepatic resection for hepatocellular carcinoma. Am J Surg. 1995;169(1):28-34. discussion 35
Vilgrain V, et al. Imaging of atypical hemangiomas of the liver with pathologic correlation. Radiographics. 2000;20(2):379-397.
Visser BC, et al. Diagnostic imaging of cystic pancreatic neoplasms. Surg Oncol. 2004;13(1):27-39.
Visser BC, et al. Diagnostic evaluation of cystic pancreatic lesions. HPB (Oxford). 2008;10(1):53-69.
Vogelzang RL, et al. Budd–Chiari syndrome: CT observations. Radiology. 1987;163(2):329-333.
Wagner M, et al. Curative resection is the single most important factor determining outcome in patients with pancreatic adenocarcinoma. Br J Surg. 2004;91:586-594.
Wanebo HJ, Vezeridis MP. Carcinoma of the gallbladder. J Surg Oncol Suppl. 1993;3:134-139.
Wanless IR, et al. On the pathogenesis of focal nodular hyperplasia of the liver. Hepatology. 1985;5(6):1194-1200.
Warshaw AL, et al. Cystic tumors of the pancreas. New clinical, radiologic, and pathologic observations in 67 patients. Ann Surg. 1990;212(4):432-443. discussion 444-445
Weg N, et al. Liver lesions: improved detection with dual-detector-array CT and routine 2.5 mm thin collimation. Radiology. 1998;209(2):417-426.
Wei SC, et al. Bile duct hamartomas: a report of two cases. J Clin Gastroenterol. 1997;25(4):608-611.
Welch TJ, et al. Focal nodular hyperplasia and hepatic adenoma: comparison of angiography, CT, US, and scintigraphy. Radiology. 1985;156(3):593-595.
West W, Brady-West D. Solid and papillary epithelial neoplasm: ultrasound and CT features of an unusual pancreatic tumour. Clin Radiol. 2000;48:321-325.
White EM, et al. Focal periportal sparing in hepatic fatty infiltration: a cause of hepatic pseudomass on US. Radiology. 1987;162(1 Pt 1):57-59.
White PG, et al. The computed tomographic appearances of angiosarcoma of the liver. Clin Radiol. 1993;48(5):321-325.
Wibbenmeyer L, et al. Laparoscopic cholecystectomy can disseminate in situ carcinoma of the gallbladder. J Am Coll Surg. 1995;181:504-510.
Wilentz RE, et al. Mucinous cystic neoplasms of the pancreas. Semin Diagn Pathol. 2000;17(1):31-42.
Winston C, et al. CT angiography for delineation of celiac and SMA arterial variants in patients undergoing hepatobiliary and pancreatic surgery. Am J Roentgenol. 2007;189(1):W13-W19.
Winston CB, et al. Recurrent gallbladder carcinoma along laparoscopic cholecystectomy port tracks: CT demonstration. Radiology. 1999;212(2):439-444.
Winston CB, et al. Hepatocellular carcinoma: MR imaging findings in cirrhotic livers and noncirrhotic livers. Radiology. 1999;210(1):75-79.
Yamada Y, et al. CT assessment of the inferior peripancreatic veins: clinical significance. Am J Roentgenol. 2000;174(3):677-684.
Yamaguchi K, et al. Intraductal papillary-mucinous tumor of the pancreas concomitant with ductal carcinoma of the pancreas. Pancreatology. 2002;2(5):484-490.
Yeh HC. Ultrasonography and computed tomography of carcinoma of the gallbladder. Radiology. 1979;133(1):167-173.
Yoon DY, et al. Solid and papillary epithelial neoplasms of the pancreas: aggressive resection for cure. Am Surg. 2001;67(12):1195-1199.
Yoshida K, et al. Chronic pancreatitis caused by an autoimmune abnormality: proposal of the concept of autoimmune pancreatitis. Dig Dis Sci. 1995;40(7):1561-1568.
Yoshimi F, et al. Reconstruction of the portal vein and the splenic vein in pancreaticoduodenectomy for pancreatic cancer. Hepatogastroenterology. 2003;50(51):856-860.
Yoshimitsu K, et al. Anatomy and clinical importance of cholecystic venous drainage: helical CT observations during injection of contrast medium into the cholecystic artery. Am J Roentgenol. 1997;169:505-510.
Yum HY, Fink AH. Sonographic findings in primary carcinoma of the gallbladder. Radiology. 1980;134(3):693-696.
Zandrino F, et al. Multislice CT cholangiography without biliary contrast agent: technique and initial clinical results in the assessment of patients with biliary obstruction. Eur Radiol. 2002;12(5):1155-1161.
Zeman RK, et al. Three-dimensional models of the abdominal vasculature based on helical CT: usefulness in patients with pancreatic neoplasms. AJR Am J Roentgenol. 1994;162(6):1425-1429.