[level-membership-for-pulmolory-and-respiratory-category]
3 Computed Tomography of Diffuse Lung Diseases and Solitary Pulmonary Nodules
Foundations
Living with X-Rays and Working with Computed Tomography
X-Rays and Computed Tomography
Radiology is the science of studying anatomy and pathology using x-rays—electromagnetic waves (like visible light, only with a much shorter wavelength) capable of penetrating the tissues. In computed tomography (CT), the widely recognized imaging standard of reference for assessment of most pulmonary abnormalities, a collimated fan beam of radiation is generated by an x-ray tube inside a gantry (Fig. 3-1).
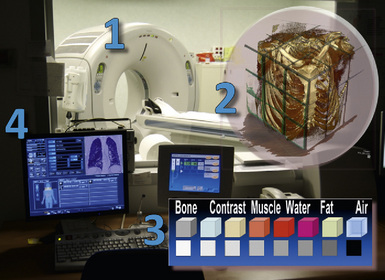
The beam is quite homogeneous when entering the body (ingoing radiation) but, point by point, inhomogeneous when exiting (outgoing radiation) because of different attenuations produced by the tissues. The attenuation highly depends on the characteristics of the tissue, calcium being at the highest and air at the lowest end of a scale with soft tissue densities (e.g., organs, muscles, blood vessels, interstitium) and fat in between (see Fig. 3-1).
Always point by point, the outgoing radiation activates a matrix of tiny sensible elements (detectors) during a continuous spiral movement of the tube-detectors system around the body (scan), and the information acquired is stored in a computer. At the end of the process, the system contains a digital three-dimensional map of single unitary elements (voxels) composing the scanned volume (see Fig. 3-1).
Computed Tomography, Spiral Computed Tomography, and High-Resolution Computed Tomography
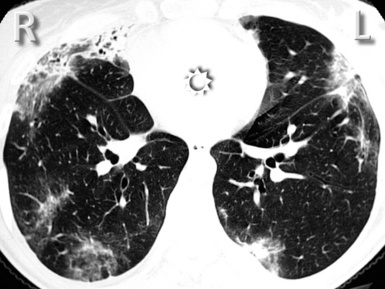
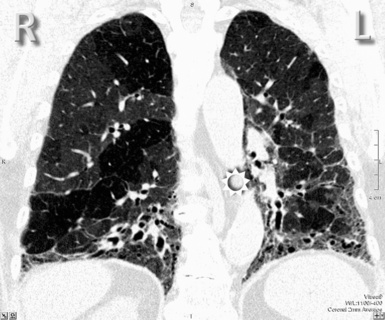
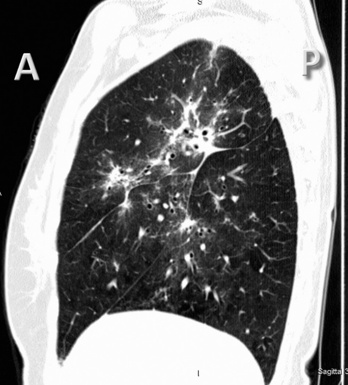
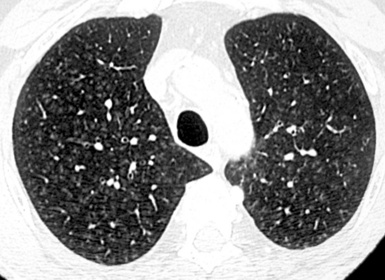
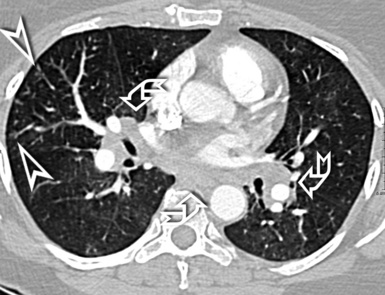
For viewing, CT is able to return the values of a two-dimensional matrix of voxels on a monitor over a scale of grays (gray-scale), where the brightest (white) spots represent the elements with higher attenuation and the darkest (black) the ones of lower attenuation. Although spiral CT is able to show images of equal quality along planes in any direction, the axial (transverse), frontal (coronal), and sagittal (lateral) views are used more commonly (Figs. 3-2 to 3-4). For each view, a stack of images may be seen in sequence simply by browsing at the workstation through the volumetric data set; at the end of the diagnostic process, the entire volume is investigated from multiple points of view.
With a diffuse lung disease (DLD), the high-resolution option is used. An actual collimation of 0.5 to 2 mm and a high spatial frequency reconstruction algorithm (edge enhancing) generate the final images.1 The narrow collimation reduces the voxel size, thereby minimizing the averaging of densities (attenuations) inside them, and this allows the rendering of subtle anatomical details (down to 0.1–0.2 mm in the most favorable conditions1). A limit is the noise of the image because of the reduced radiation penetrating such small voxels. However, at the pulmonary level, the difference of attenuation (contrast) between lung structures and air is high; thus, the signal is high, and the final signal-to-noise ratio remains adequate for diagnostic purposes.
Terminology
In general, the structures that attenuate more are whiter (thus, more opaque or dense or also hyperdense) than the structures that attenuate less (thus, more transparent or lucent or also hyperlucent). Therefore, the concept of density/opacity/attenuation of an element is a relative one, and for the object of interest it should be expressed in comparison with a reference structure, usually the surrounding background. The mediastinal vessels, for example, are denser than the fat in which they are embedded, but in turn this fat is denser than the tracheal lumen containing air (Fig. 3-5).
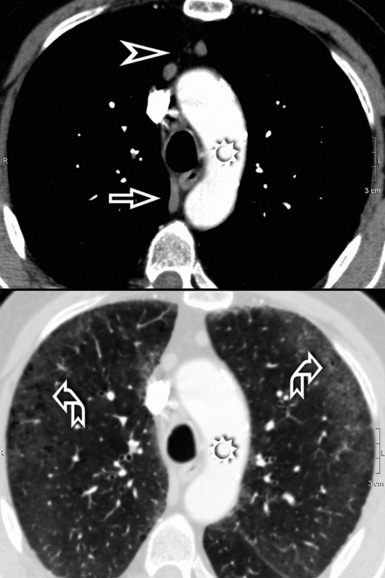
If a special iodinated substance (contrast medium) is injected intravenously before the examination, the visibility of the tissues is enhanced (contrast enhancement) because iodine is a powerful absorber of radiation (see Fig. 3-5). A contrast medium is used rarely in the studies performed for a suspected DLD but frequently when a mass or a vascular condition is under investigation.
The body structures are best observed on monitors or films where the brightness/contrast is optimized to bring out the details of the image. However, human eye limitations do not allow a real-time appreciation of these details over the entire dynamic range of chest attenuations. Fortunately, all pertinent data are available to the machine, and the operator needs only to press a button to switch, through a dedicated processing referred to as windowing and leveling, from a mediastinal window (where the details in the lung are squeezed down to the absolute blackness) to a lung window (where the soft tissues are leveled out but the lung structures stand out with maximal detail) (see Fig. 3-5).
Lung Anatomy
Arteries, Veins, and Bronchi
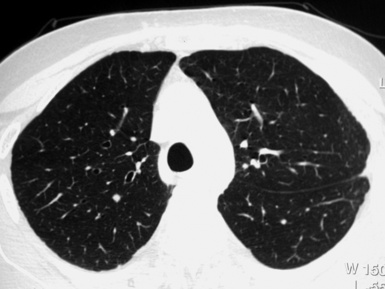
When examined using a lung window, the lungs appear as overall grayish structures delineated by the mediastinum and thoracic cage. Their shape depends on how they are cut by the plane of the section (see Figs. 3-2 to 3-4). The homogeneously whitish elements standing out over this background are blood vessels, which appear roundish or linear depending on the plane of section. Their size should be appropriate to their position within the lung (central versus peripheral) (Fig. 3-6). Each artery is joined by a companion airway, characterized longitudinally as a pair of tapering whitish lines separated by air, which branch regularly (“railway track” appearance). The airways appear as white rings when cut transversally (see Fig. 3-6). Actually, the visibility of bronchial structures within an aerated parenchyma is far below the visibility of companion vessels because of the mostly air-containing nature of the former. Consequently, when looking at a normal lung, the general feeling is of a predominance of blood vessels with only sporadic visibility of bronchioles within the outer third of the lungs.
The outer wall of the arteries and both the outer and inner surface of the bronchial walls should present a sharply defined interface with the surrounding parenchyma (Fig. 3-7). As a rule, bronchial walls in corresponding regions of both lungs should be similar in thickness. Moreover, coupled bronchi and arteries should present roughly the same diameter, and this in turn depends on their position (central or peripheral).1 The arteries tend to divide dichotomously, whereas the veins often present a monopodial branching with several smaller branches flowing into a main collection drain. Arteries and veins also have a different course that becomes almost perpendicular at the level of the vein entrance into the mediastinum and right heart (see Fig. 3-7).
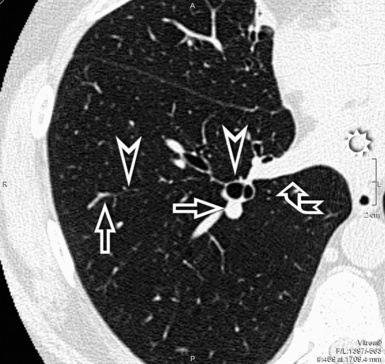
Mediastinal and thoracic pleura are invisible when normal. However, they can appear as subtle tiny linear opacities at the fissural level, where two layers fuse radiologically (see Fig. 3-7). When normal, lymphatics are not visible at any level, their size being inadequate to be perceptible radiologically.
Secondary Lobule
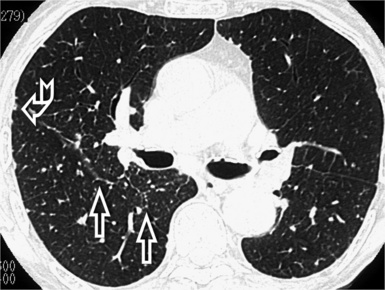
At the periphery of the lung, after 28 generations of arteries and 23 generations of bronchi,2 arteries and bronchi become so small that they become invisible. As a consequence, the far peripheral pulmonary parenchyma should have no visible vessels, and the same and even more is true for the bronchi (see Figs. 3-6 and 3-7). Thus, the appreciation of vessels immediately below the pleural surface should point at an abnormality. However, exceptions are possible in the most dependent areas (Fig. 3-8), where the hydrostatic pressure is higher and the vessels larger.
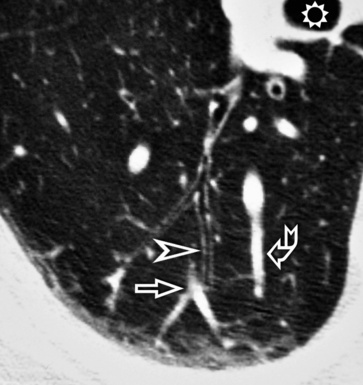
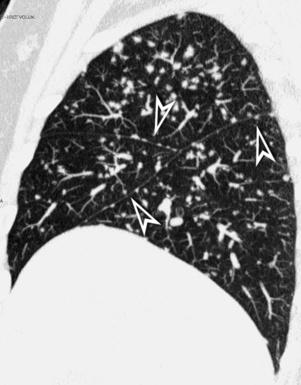
The centrilobular bronchioles, in particular, should not be visible, and also, when normal, the interstitial framework at the lobular level should not be appreciable per se. Consequently, when an intralobular network of white lines and/or the walls of bronchioles become visible, this means that they are thickened and hence abnormal. In general, under normal circumstances, the lobular architecture is discernible only here and there when fragments of centrilobular arteries and perilobular veins are identified; this is more frequent in the dependent portions of the lung (see Fig. 3-8).
Special Techniques
Increasing Visibility
Multiplanar Reformation
The high-resolution computed tomography (HRCT) technique has existed since the end of the 1970s, but it was the development of the spiral multislice scanning machines in the early years of the 21st century that allowed the generation of consistent high-quality images in every spatial plane in nearly every patient (MPR). The first and most popular way to render the data is called averaged because, pixel by pixel, the images show the average attenuation of the tissues across the plane of section. The natural high contrast of lung tissue and thin collimation of the x-ray beam, coupled with a high frequency algorithm of reconstruction, guarantee sharp details of anatomical and pathologic elements down to well less than 1 mm in size (see Fig. 3-8).
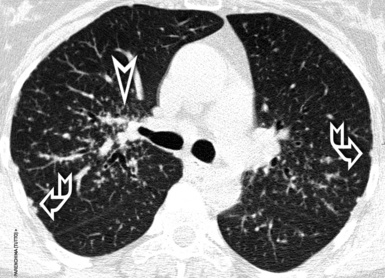
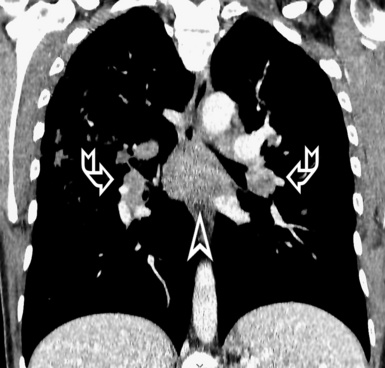
Pathology that occurs in the central or peripheral regions of the lung is best studied in axial images (see Fig. 3-2). Diseases that show upper or lower lung prevalence benefit from visualization in coronal view (see Fig. 3-3). Finally, disorders that prevail in the parahilar regions or in the costophrenic angles are best depicted in the sagittal view (see Fig. 3-4). With the volumetric approach, the planes may be varied according to the needs of the operator and targeted on the suspected disease (Box 3-1).
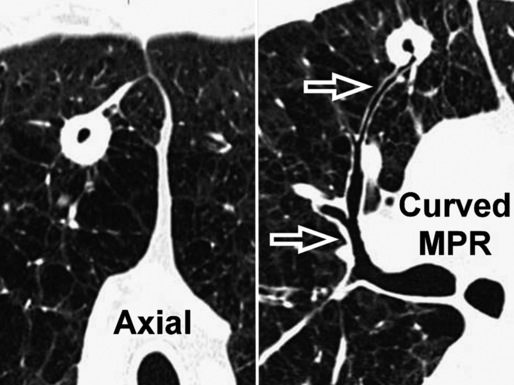
Curved Multiplanar Reformation
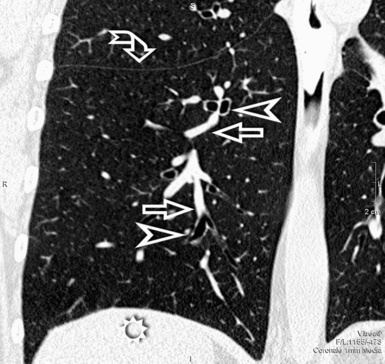
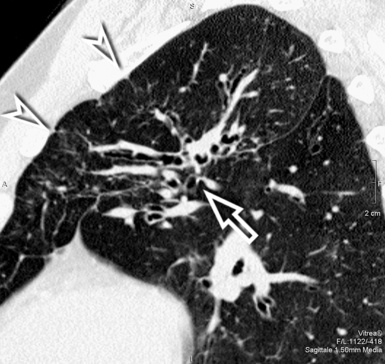
Having the entire volume available and working digitally makes it possible to reconstruct objects traveling in and out of a two-dimensional plane along curved reformatted images (curved MPR). This allows a structure to be traced and displayed as if it lay along a single plane. For example, an intuitive visualization of the entire course of a bronchus from a cavitated lesion to its origin can be achieved by displaying it along a manually or automatically generated centerline of the bronchial lumen (Fig. 3-9). The curved reformatted images are not real, but they are effective and easy to generate and therefore suitable for practical purposes (e.g., “virtual” bronchoscopy).
Increasing Ambience
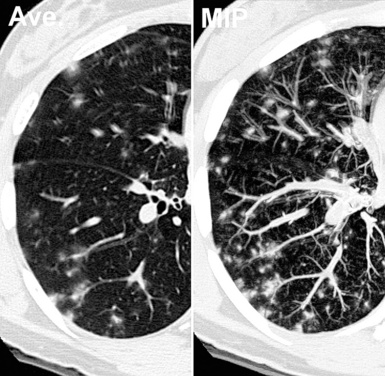
Maximum Intensity Projection
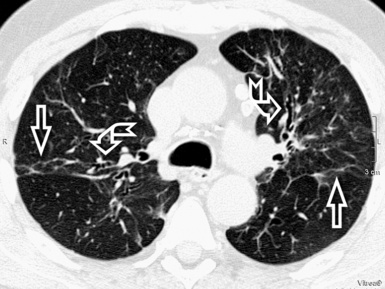
The maximum intensity projection (MIP) technique renders only the voxels with higher attenuation in a thick slice (0.5–2 cm). The technique is suitable to render tridimensionally the vascular tree standing against a black background; moreover, with MIP, it is possible to obtain a comprehensive representation of the position of various lesions inside the lobular framework3 (Fig. 3-10). In selected cases, MIP images are useful for distinguishing between vessels and nodules and, when nodules are present, to assess their profusion.
Minimum Intensity Projection
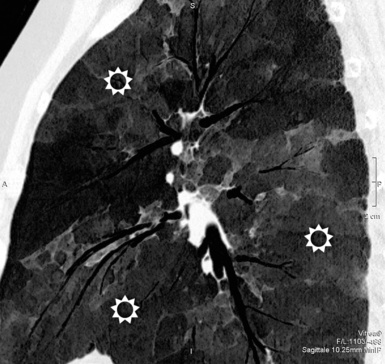
The minimum intensity projection (minIP) technique renders only the voxels with lower attenuation in a thick slice (0.5–2 cm). This technique is useful for improving the visualization of hyperlucent elements (bronchi, emphysema, bullae, honeycombing) and some opacities, allowing a more precise study of their attributes and distribution. The minIP technique is also ideal for investigating bronchial caliper and course, particularly within areas of increased density (Fig. 3-11).
Volume Rendering
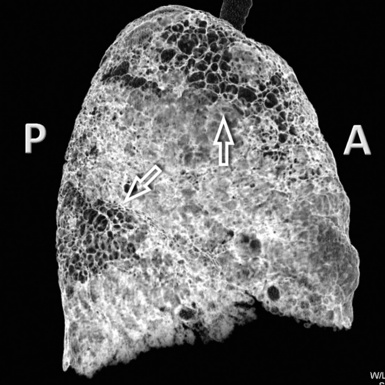
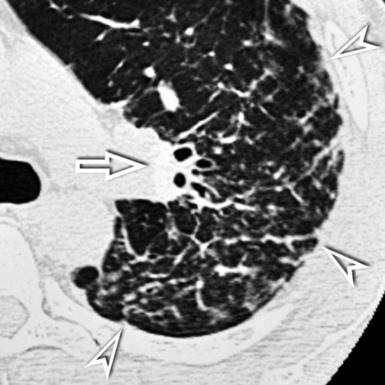
Volume rendering (VR) techniques may be also used in the assessment of DLD. When implemented, the machine renders only the structures within a specific range of attenuations and contained within a chosen volume. Volume rendering may be useful for studying a volume of lung in three dimensions from within or for inspecting its surface from outside (external volume rendering) (Fig. 3-12). This is particularly useful for concisely looking at the pulmonary surface and its abnormalities and for helping to make medical decisions (e.g., determining the site of a surgical biopsy).
Prone and Expiratory Computed Tomography
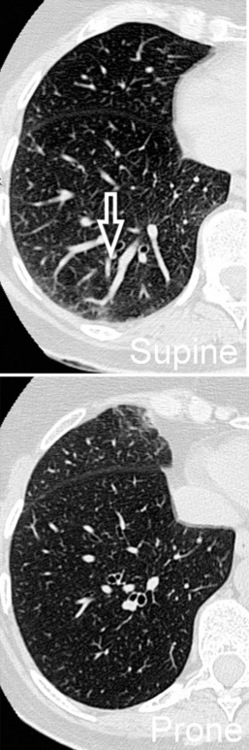
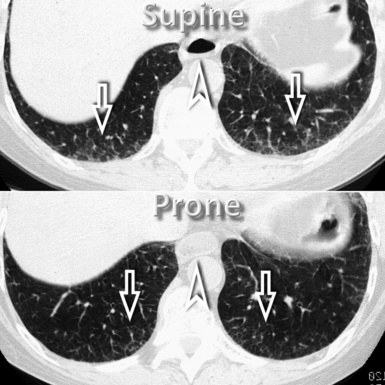
However, in supine patients, some whiter atelectatic lung is frequently seen in the most dependent posterior areas (see Fig. 3-8), where it may simulate pathology or, alternatively, hide it. These normal densities disappear with prone positioning (Fig. 3-13), and indeed some experts suggest the routine use of prone scans when diseases under consideration characteristically involve posterior lung (e.g., asbestosis).4
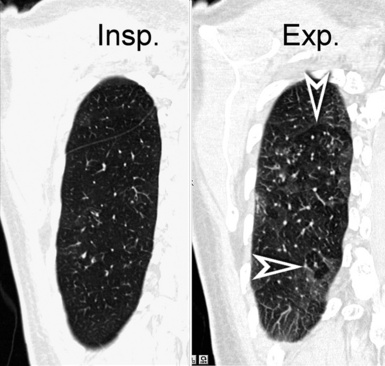
In normal subjects, an expiratory scan shows a uniform reduction in size of the lungs together with a homogeneous increase of their density, due to the reduced amount of air within the alveoli. When an arterial obstructive or a bronchial stenotic disease is present, variable portions of lung become darker than normal because of the reduced blood supply caused directly by hampered vascular filling or indirectly caused by hypoxemic vasoconstriction. However, in the expiratory CT, the hyperlucent areas due to vascular obstruction physiologically increase their density, whereas in the case of bronchial stenosis they do not because the air does not exit from the alveoli (air trapping) (Fig. 3-14). When arterial obstructive or bronchial stenotic diseases are suspected, supplementary expiratory scans should then be added to complete the investigative process.
Diffuse Lung Diseases
Patterns
There are some limitations when thinking in terms of patterns. First, the same disease may present with different radiologic patterns. This may result from its variable pathologic expression in a given patient (e.g., pulmonary manifestations of progressive systemic sclerosis may show histologic usual interstitial pneumonia [UIP], nonspecific interstitial pneumonia [NSIP], organizing pneumonia [OP], and even diffuse alveolar damage patterns), from its temporal phase (e.g., a hypersensitivity pneumonitis may present in the acute, subacute, or chronic stage) or from its natural progression (e.g., an NSIP may proceed from a minimal changes pattern to end-stage lung disease). Second, the same pattern may be present in several diseases (a classical model being the systemic collagen vascular diseases [CVDs]), and also this is not unexpected because the lung has a limited number of reactions to different insults. These caveats are not an absolute limit to the diagnostic approach using patterns, but they underscore the necessity of a tight integration of imaging with clinical presentation and pathology in arriving at a meaningful diagnosis for the patient, as widely recognized in the literature.5
Septal Pattern
Definition
A septal pattern is present when a thickening of the perilobular interstitium is appreciable, making the lobular boundaries evident. The bronchovascular bundle is also usually thickened, producing changes both at the central parahilar level and in the centrilobular core (Fig. 3-15). The final effect is of that of a regular network of white lines with increased evidence of the perilobular interstitial architecture but without retraction or remodeling of pulmonary structures. For this reason, the septal pattern is also called regular linear pattern or linear pattern with preserved architecture.
High-Resolution Computed Tomography Signs
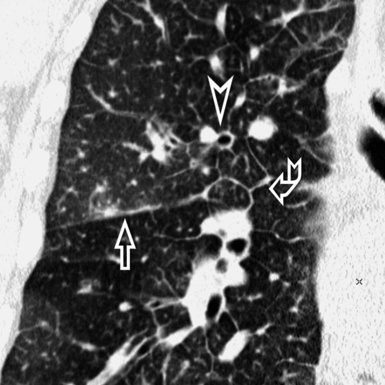
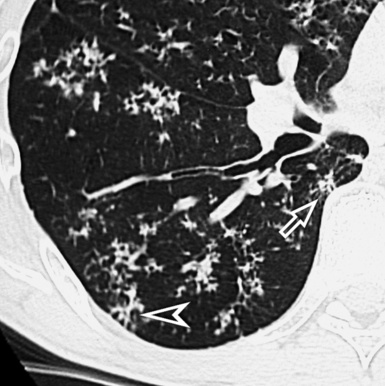
A network of white lines due to thickened septal, peribronchovascular, and subpleural interstitium is the trademark of this pattern. The thickened interlobular septa appear as white lines 1 to 2 cm in length outlining the polygonal boundaries of secondary lobules (interlobular or perilobular reticulation) (Fig. 3-16). Normally, these septa are not recognizable, so their presence points to an abnormality. A few lines inside the lobule may be also visible.2,6
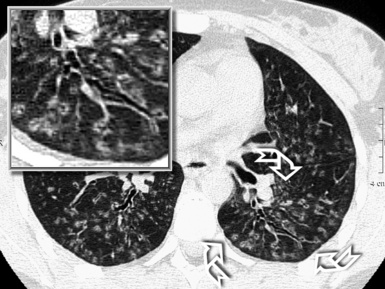
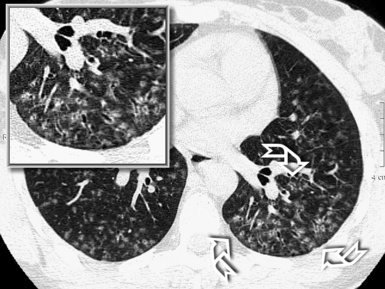
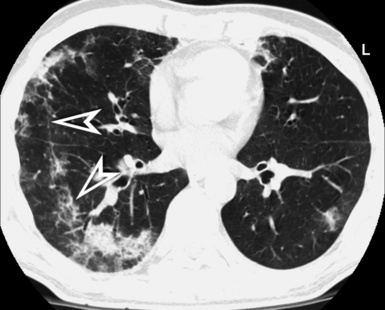
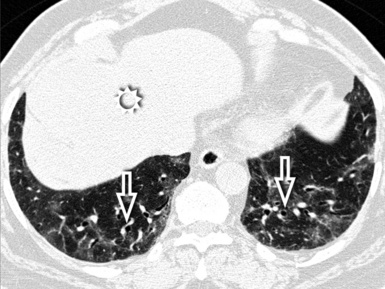
Centrilobular peribronchovascular thickening becomes manifest as a cuffing of the core structures of the lobule. The bronchiole, usually invisible under normal conditions, becomes evident as a white ring adjacent to a white dot of similar size (the centrilobular arteriole). It is enlarged compared with those identifiable in adjacent portions of pulmonary parenchyma (Fig. 3-17).
The thickened peribronchovascular bundle at a more central level is also perceived as arteries of increased size, compared with similar portions of pulmonary parenchyma, and as thickening of bronchial walls (Fig. 3-18). As a rule, vessel size and bronchial wall thickness in corresponding regions of one or both lungs should be similar, and a comparative evaluation of different lung regions is helpful and makes the recognition of the abnormalities easier.2
The subpleural interstitial thickening should be evaluated at the edges of the lung as a white enveloping line simulating thickened pleura. This sign is often easier to identify at the fissural level, where two layers of subpleural interstitium coexist7 (Fig. 3-19).
Pleural effusion may be an additional finding in some septal disorders. It can be small and may be seen along the costovertebral angles or fissures (Fig. 3-20), where large, significant compressive effects on the adjacent parenchyma may be present.
Subset Smooth
The anatomy of the three interstitial compartments (perilobular, peribronchovascular, and subpleural) is thickened more-or-less regularly with smooth profiles. The polygonal outlines of the lobules are visible without focal abnormalities. Their shape is variable, depending on the CT plane (Fig. 3-21).
Inside the lobules, enlarged arteries and bronchioles with thickened walls are often visible. Smoothly thickened fissures are recognizable (Fig. 3-22), in particular with multiplanar reconstructions.8 Coexisting patches of faint opacities are possible, due to partial alveolar filling (ground glass opacity [GGO]). However, these patches should not overshadow the septal aspects; otherwise, an alveolar pattern should be considered.
Diseases in the Septal Pattern, subset Smooth, are listed in Box 3-2.
Interstitial Hydrostatic Pulmonary Edema
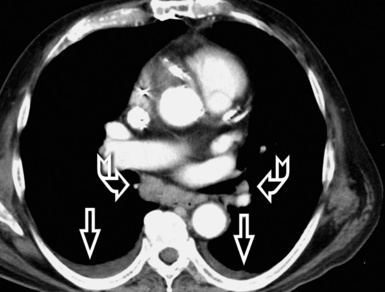
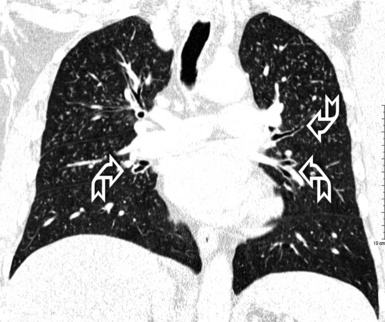
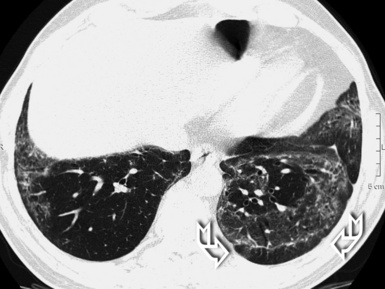
The septal lines of pulmonary edema are usually associated with smooth subpleural and peribronchovascular interstitial thickening (peribronchial cuffing). Patchy lobular GGO often coexists, due to minimal alveolar edema9 (Fig. 3-23). There is a tendency for the hydrostatic edema to show a symmetrical basal and posterior distribution (in supine patients) (Fig. 3-24), but patchy nongravitational distributions are not impossible.10
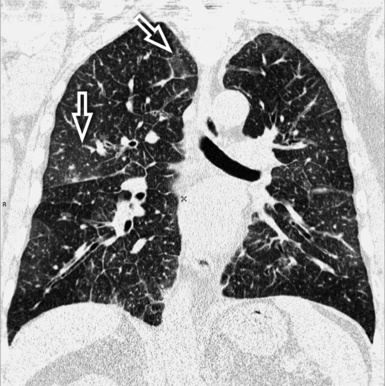
Figure 3-23 This coronal view shows bilateral smooth perilobular, peribronchovascular, and subpleural thickening in a patient with hydrostatic pulmonary edema (Fig. 3-22 is a close-up of this image). Areas of faint GGO are also present (arrows).
Heart enlargement and bilateral pleural effusion are common findings in cardiogenic pulmonary edema (see Fig. 3-24), and in a number of patients also a pericardial effusion may coexist. When the flow of the lymph to the systemic veins decreases, an enlargement of mediastinal lymph nodes due to fluid stagnation may occur11 (Fig. 3-25).
Lymphangitic Carcinomatosis
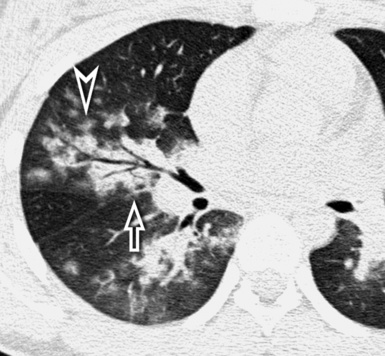
Lymphangitic carcinomatosis may present with a fully smooth subset12 (Fig. 3-26), but not infrequently nodular irregularities (beaded appearance of septa and fissures) and random micronodules in areas of thickening occur. Nodules result from focal growth of cells within the lymphatics and local extensions into the parenchyma.6,13 Subpleural thickening, when present, may also be smooth or nodular. Pleural effusion is unilateral in 50% of cases.
The lesions of lymphangitic carcinomatosis are typically patchy, often unilateral, and not gravity-dependent12 (Fig. 3-27). Hilar lymphadenopathy is visible in 50% of patients. Enlarged mediastinal lymph nodes can be also seen in a number of cases (25% to 50%).13 Dedicated CT window settings may demonstrate metastatic lesions elsewhere (Fig. 3-28).
Veno-occlusive Disease
The presentation of veno-occlusive disease is similar to that of hydrostatic pulmonary edema. Smooth septal lines, bronchial cuffing, and patches of GGO related to alveolar wall thickening and pulmonary edema are apparent14,15 (Fig. 3-29).
The lesions present a geographical appearance with variable localization. They are always bilateral and may have a gravitational preference15 (Fig. 3-30).
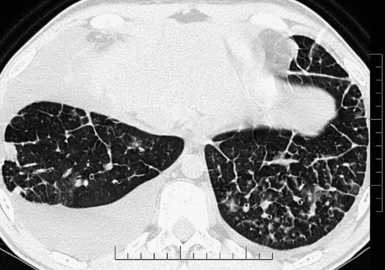
Figure 3-30 An axial scan of the same patient as in Figure 3-29 confirms the gravitational distribution of the lesions.
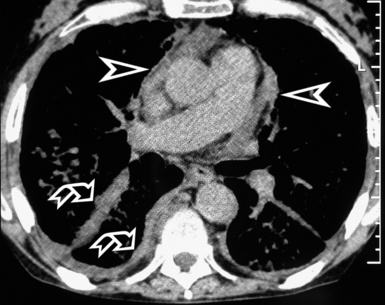
A key radiologic sign is a coexisting enlargement of the central pulmonary arteries compatible with arterial pulmonary hypertension16 (Fig. 3-31). The right side of the heart also may be dilated without evidence of left atrial or ventricular enlargement. In addition, pericardial or pleural effusion and enlargement of the mediastinal lymph nodes may be visible.14
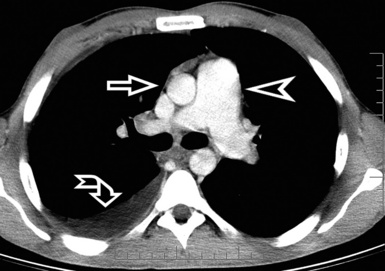
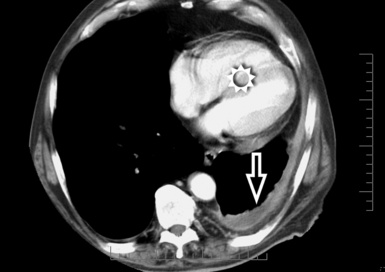
Figure 3-31 A contrast-enhanced axial scan (mediastinal window) of the same patient as in Figure 3-29 reveals a dilated central pulmonary artery (arrowhead) and a right pleural effusion (curved arrow). Compare the size of the main pulmonary artery with the diameter of the ascending aorta (arrow): they should be the same in a normal individual.
Erdheim-Chester Disease
Erdheim-Chester disease is a non–Langerhans cell systemic histiocytosis that produces smooth septal and subpleural interstitial thickening, with more-or-less regular contours (Fig. 3-32). Multifocal areas of ground glass attenuation, small centrilobular nodular opacities, and pleural effusion may be also present.17,18
The septal lesions of Erdheim-Chester disease involve both lungs diffusely (Fig. 3-33), but in some cases they may predominate in the upper or lower lobes.18 In addition, the pleura and the mediastinal structures may be involved (Fig. 3-34). The superior vena cava, along with the pulmonary trunk and main arteries, may be “coated” by anomalous tissue, and in case of severe involvement, a reduction of the vascular lumen is also possible. The cardiac involvement may be endocardial or myocardial (not visible with HRCT) or pericardial, the latter being the most frequent and best visible on images, thanks to the contrast provided by the adjacent pericardial fat19 (see Fig. 3-34).
Subset Nodular
The interstitial compartments are thickened in nodular form, testifying to the existence of locally growing cells or extracellular deposits within the interstitial boundaries20 (Fig. 3-35). Being interstitial, these nodules are dense with well-defined margins2 (Fig. 3-36), embedded as they are inside thickened interlobular septa and interstitial lines with an overall beaded appearance.21
Lymphoid interstitial pneumonia is a multifaceted disease that may present with different patterns, including septal. However, it tends to show more often nodules along lymphatic routes, so it has been placed in the Nodular Pattern, subset Lymphatic. Diseases in the Septal Pattern, subset Nodular, are listed in Box 3-3.
Diffuse Interstitial Amyloidosis
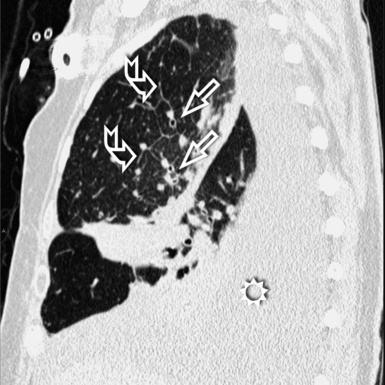
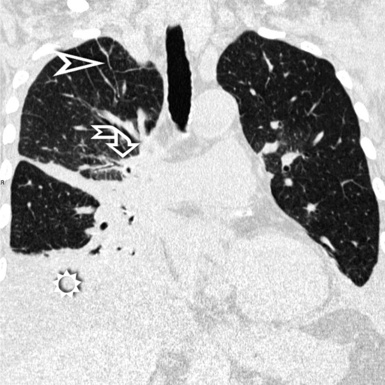
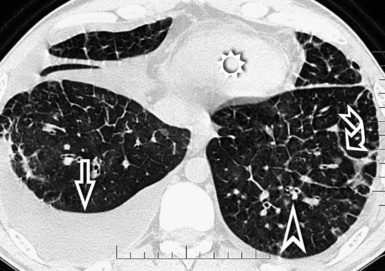
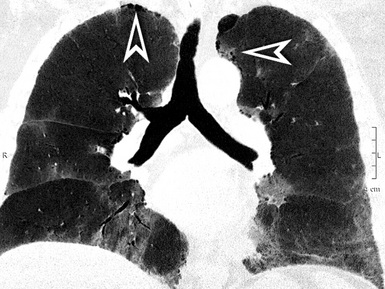
The diffuse interstitial form of amyloidosis is characterized by smooth or nodular septal, peribronchovascular, and subpleural thickening, frequently (50%) associated with well-defined subpleural nodules that are often calcified (Fig. 3-37).22,23 The lesions of diffuse pulmonary amyloidosis show a basal and peripheral prevalence24 (Fig. 3-38).
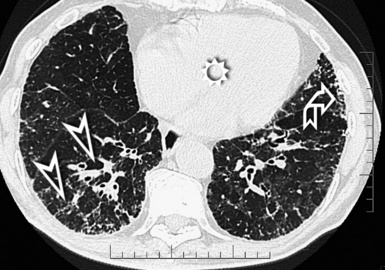
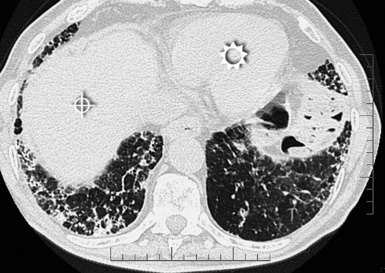
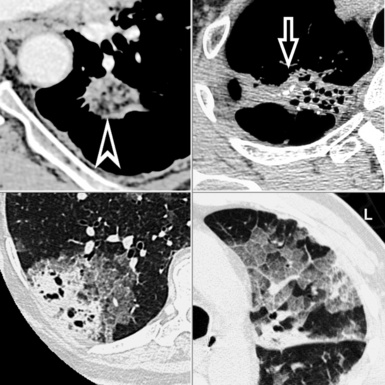
Figure 3-38 This is a more basal scan from the same patient as in Figure 3-37. Bull’s-eye, liver; sun, heart.
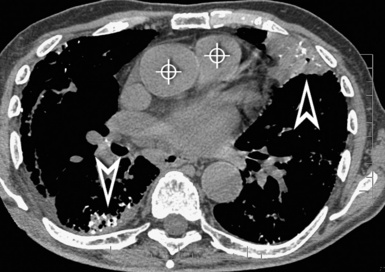
The key to the diagnosis is the existence of subpleural, confluent, calcified consolidations (Fig. 3-39). Associated findings are lymph node enlargement and unilateral or bilateral pleural effusions.25 Tracheobronchial involvement may be also present, with thickening of the tracheal and bronchial walls due to deposition of amyloid.
Fibrotic Pattern
Definition
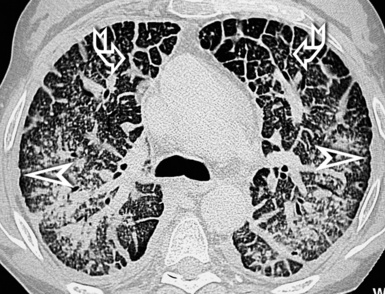
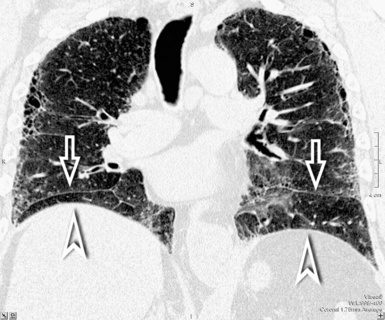
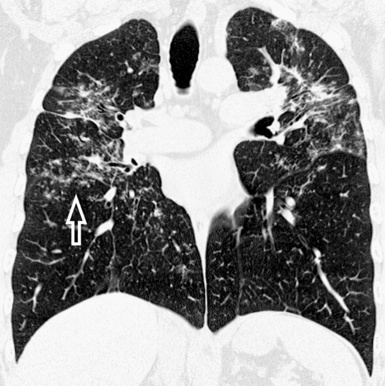
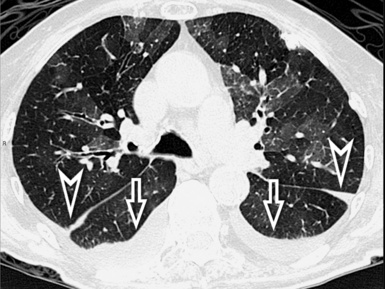
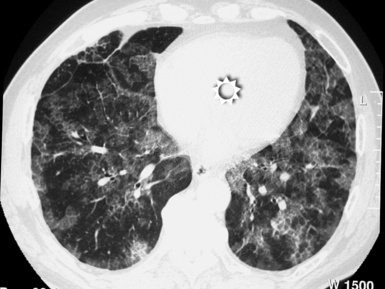
A fibrotic pattern is present when signs of retraction and remodeling of thoracic structures are recognizable at the lobular level and/or in correspondence of larger portions of lung (Fig. 3-40).
High-Resolution Computed Tomography Signs
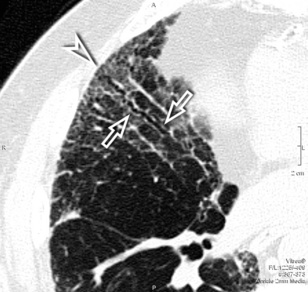
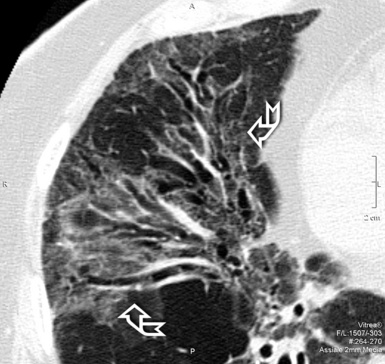
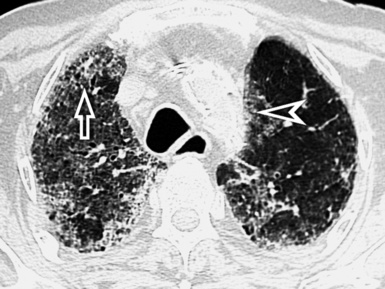
Irregular linear opacities (irregular reticulation) are criss-crossing, not uniform, wavering, white lines that appear as though they were traced by an unsteady hand on the lung background (Fig. 3-41). Sporadically, one could imagine that one or more of these lines represent remnants of interlobular septa (interlobular reticulation), but the visibility of interlobular septa is not the rule. On the contrary, the distortion due to fibrosis tends to reduce the recognition of the lobular architecture.2 Most of these lines criss-cross spaces of lobular size, so they are also called intralobular reticulation (see Fig. 3-41).
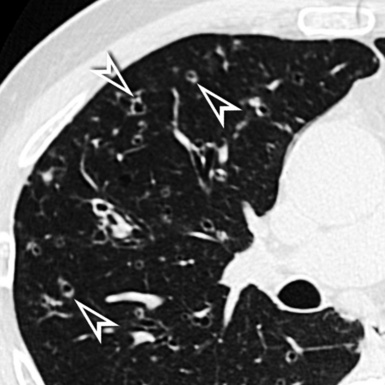
The vessels may appear enlarged with shaggy margins (interface sign), and the bronchi are irregularly ectatic with thickened walls and a winding or corkscrew appearance (Fig. 3-42). In the periphery of the lung, the bronchioles may be also ectatic (so visible) with the same appearance (traction bronchiectasis and bronchiolectasis) (see Fig. 3-41). Finally, parenchymal bands are long lines representing thickened connected septa marginating several lobules but also focal scarring or linear atelectasis.2
As a whole, the described lesions may vary in size and aspect, from a more-or-less coarse obvious pattern to a subtle hazy opacification of the lung referred to as fibrotic GGO that is only minimally inhomogeneous. In the latter case, ectatic bronchioles inside the GGO and superimposing irregular reticulation (indicating fibrosis) are the discriminant features26 (see Fig. 3-42).
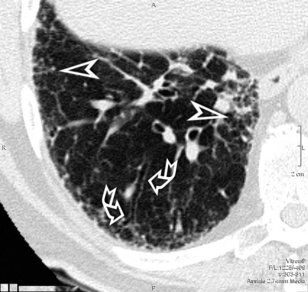
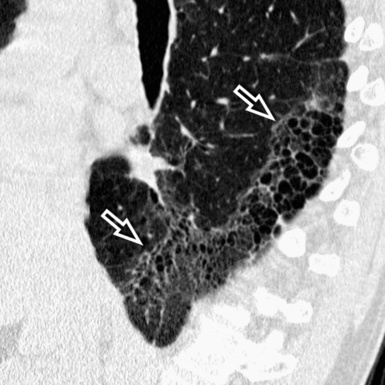
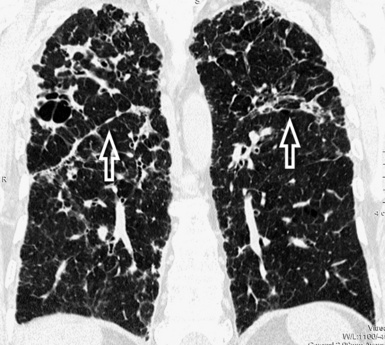
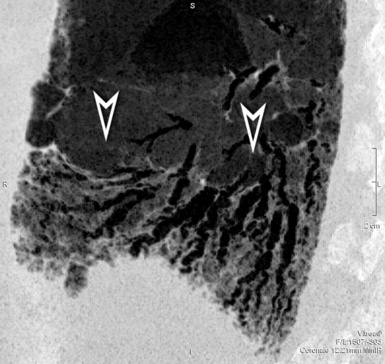
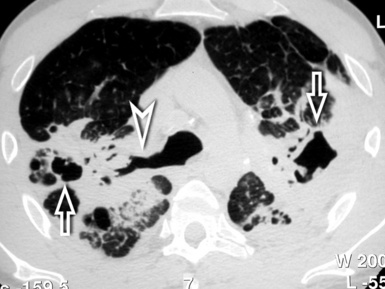
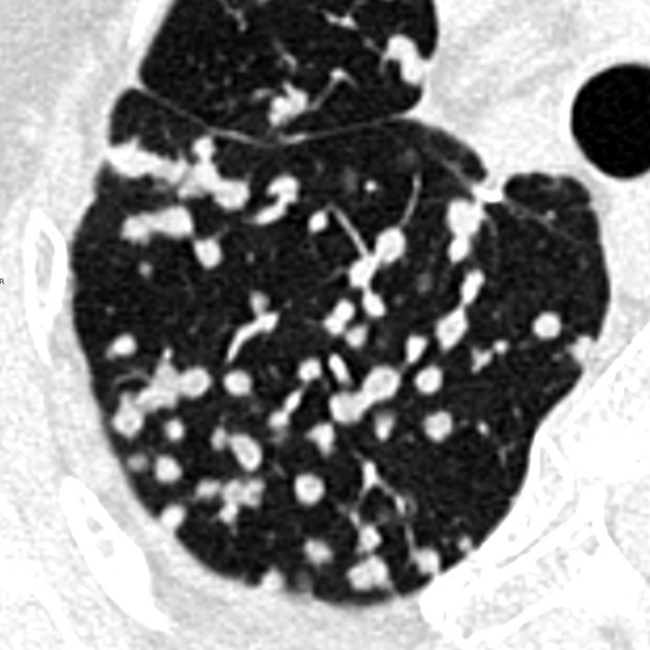
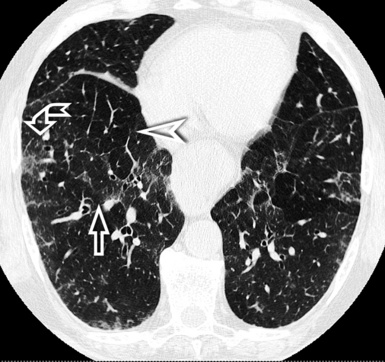
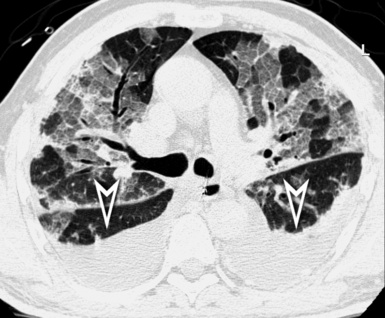
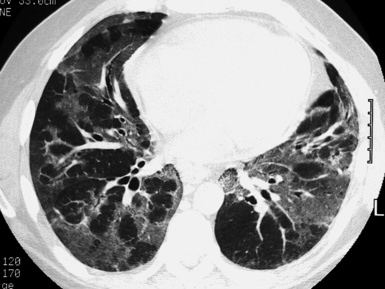
A peculiar feature of destructive fibrosis is honeycombing. In honeycombing, small hyperlucent areas of variable size (from 2 mm to 1 cm) and shape separated by well-defined thick walls are crowded in an area where the lung architecture is lost27 (Fig. 3-43). They should be distinguished (not easy and not always possible, especially in the early cases) from also roundish or elongated, windingly linear, transparencies corresponding to ectatic bronchioles (called microscopic honeycombing by Nishimura28).
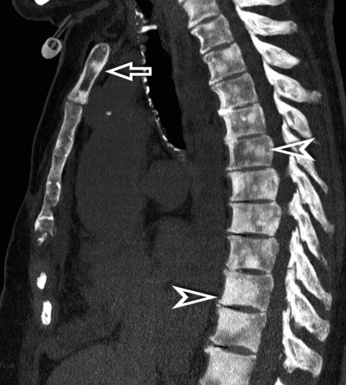
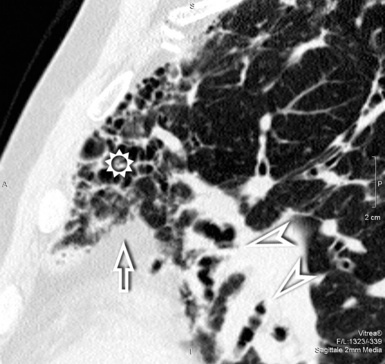
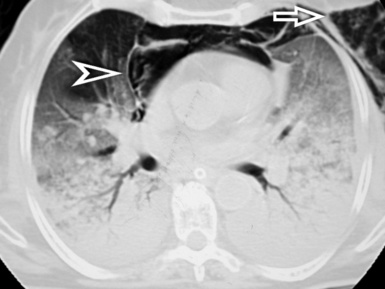
Signs of retraction and remodeling give further, at times striking, evidence of the existence of a fibrotic disorder. At the pulmonary interface, a pleural line with shaggy margins and connections with parenchymal irregular lines (interface signs) may be evident (Fig. 3-44). A thickening of the subpleural interstitium may also be obvious, as well as an increased thickness of extrapleural/mediastinal fat, the latter compensating for the shrinking lung (see Fig. 3-44). A shaggy thickening may be also observed at the interface of the visceral pleura, which becomes angulated and displaced.
When fibrosis advances, one or more lobes and even the entire lung may become reduced in size. The signs associated with this are angulation and displacement of fissures, crowding of vessels and bronchi, and mediastinal and diaphragmatic attraction toward the affected lung (Fig. 3-45).
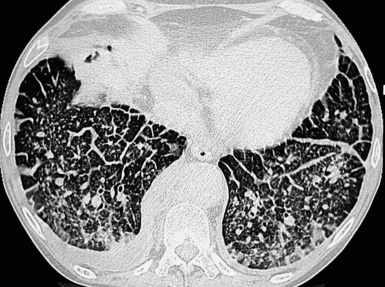
Subset Usual Interstitial Pneumonia
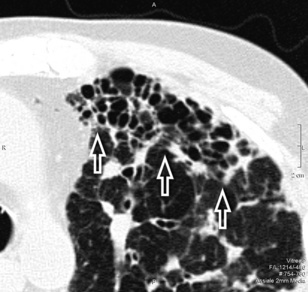
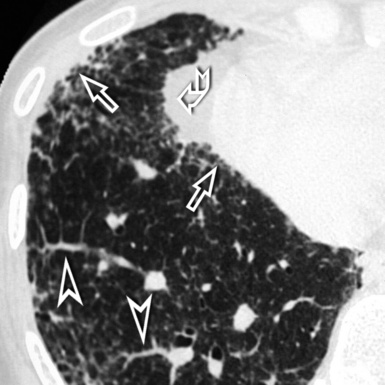
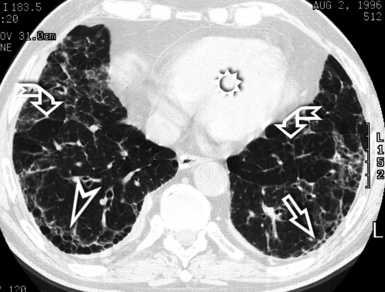
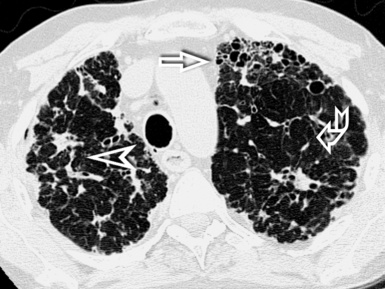
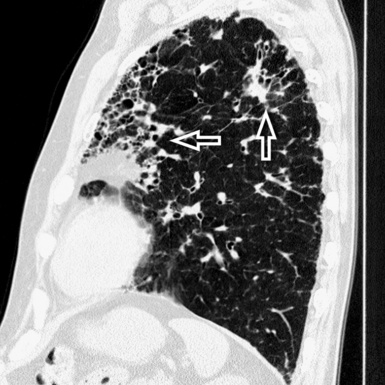
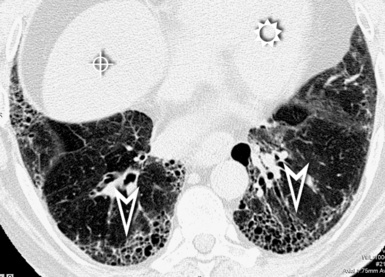
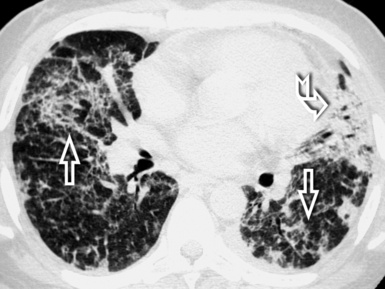
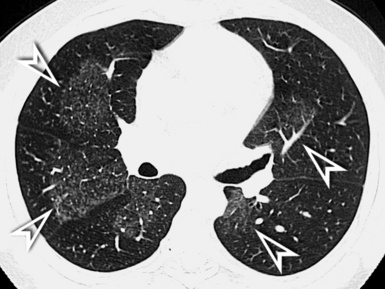
The UIP subset is defined by the presence of patchy areas of irregular reticulation and gross honeycombing with prominent signs of architectural distortion (Fig. 3-46). Traction bronchiectasis and microscopic honeycombing in connection with the pathologic areas are also characteristic.28 Some GGO is possible but less extensive than the reticulation.29 Signs of retraction and remodeling of vessels, fissures, lobes, and pulmonary boundaries are common, especially in advanced cases (Fig. 3-47).
The UIP subset may be seen both in idiopathic pulmonary fibrosis (IPF) and, with identical aspects, in several CVDs or, more rarely, chronic drug toxicity. Aspects of UIP are present also in individuals who develop an acute clinical course (acute exacerbation or acceleration of IPF), where the histologic findings show superimposed features of acute lung injury; in these cases, the radiologic presentation is usually dominated by the alveolar densities of acute lung injury and it is consequently discussed under the Alveolar Pattern, subset Acute. Diseases in the Fibrotic Pattern, subset UIP, are listed in Box 3-4.
Asbestosis
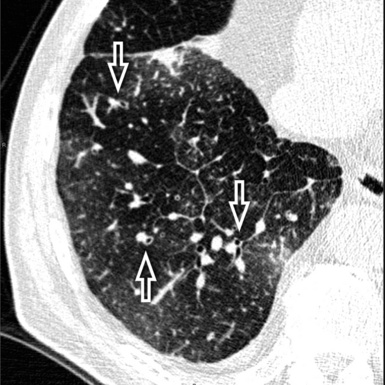
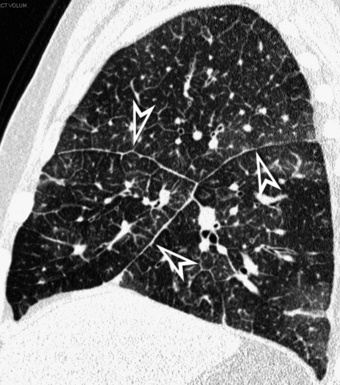
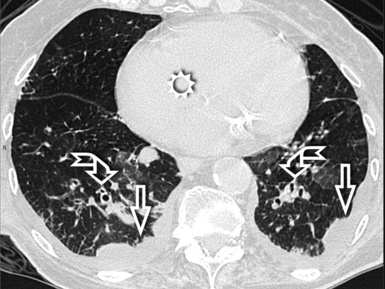
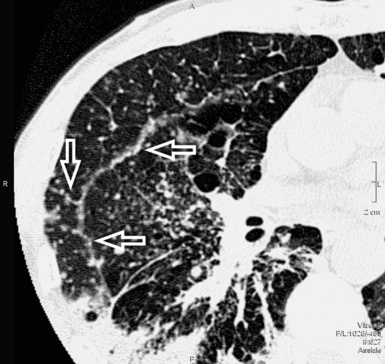
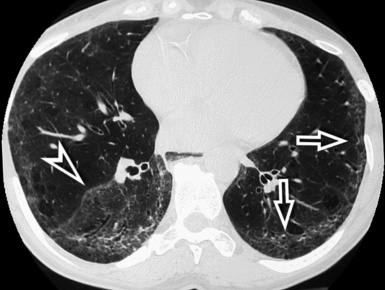
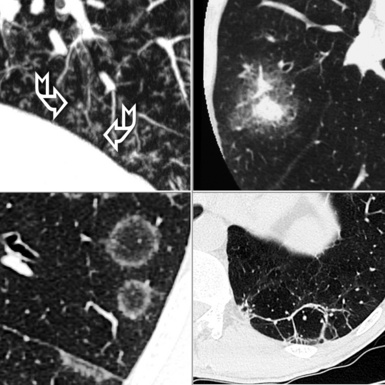
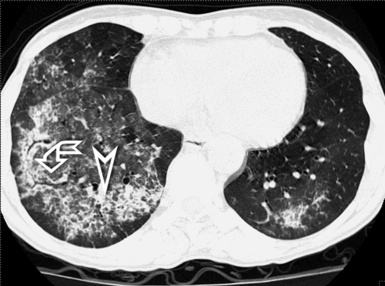
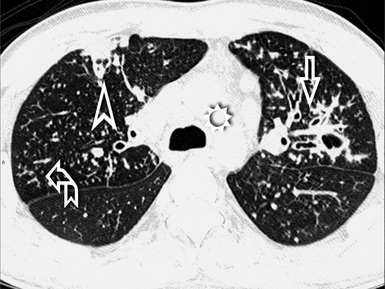
The early lesions of this disease are a combination of centrilobular dotlike and branching30 opacities, which are often arranged in clusters or connected in form of subpleural curvilinear lines31 (Fig. 3-48). These nodular opacities correspond to peribronchiolar nodular fibrosis responsible also for hyperlucent areas (mosaic perfusion) of lobular size from air trapping.31 The subsequent evolution may lead to an irregular interlobular and intralobular reticulation with bronchiectasis, architectural distortion, and honeycombing.32
The lesions are predominantly or exclusively located in the subpleural lobules of the posterior regions of the lower lobes in the early phases of disease,30 but they may become more extensive as the disease progresses (Fig. 3-49).
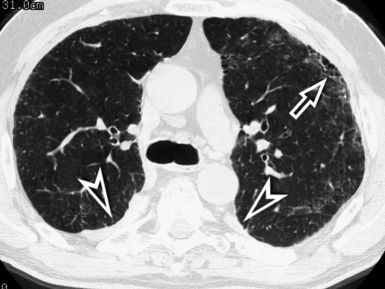
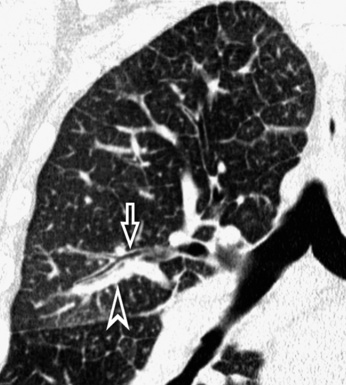
Figure 3-49 Axial scan at the carinal level in the same patient as in Figure 3-48. At this transversal level, the fibrotic involvement of the lung is only initial, and the honeycomb changes are confined in restricted areas (arrow). Bilaterally, there are pleural plaques of typical aspect (arrowheads).
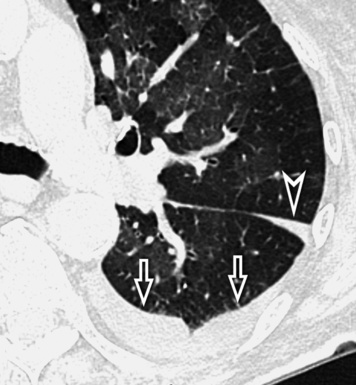
Diffuse parietal pleural thickening and pleural plaques with or without calcifications (Fig.3-50; see also Figs. 3-48 and 3-49) are considered typical of the asbestos-related disease, but not all patients with asbestosis show pleural abnormalities.2 Parenchymal bands are also characteristic of this disease (see Fig. 3-50) and may reflect thickening of interlobular septa, fibrosis along bronchovascular sheaths, coarse scars, or areas of atelectasis adjacent to pleural plaques or visceral pleural thickening.32,33
Chronic Hypersensitivity Pneumonitis
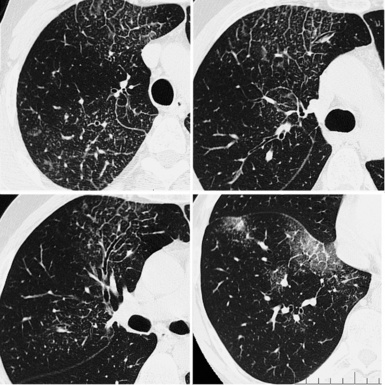
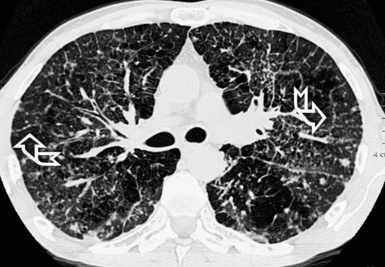
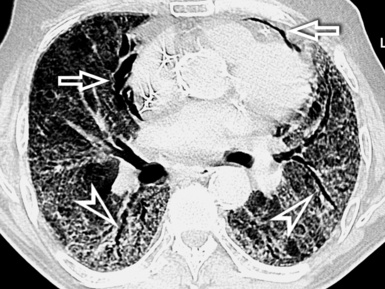
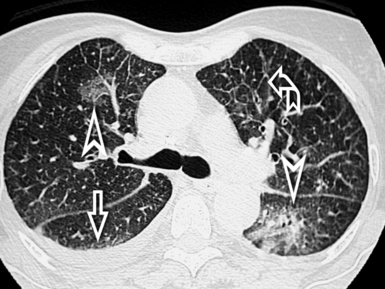
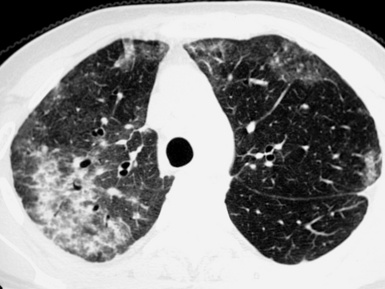
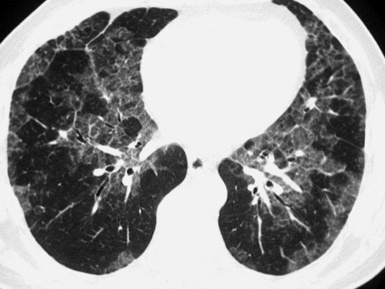
Fibrotic GGO and irregular reticulation with traction bronchiectasis and bronchiolectasis are the most common features of hypersensitivity pneumonitis, but honeycombing is also a frequent finding. Characteristically, the fibrotic lesions may be associated to a mixture of lobular areas with decreased attenuation, centrilobular nodules, and cysts inside the GGO34 (Fig. 3-51).
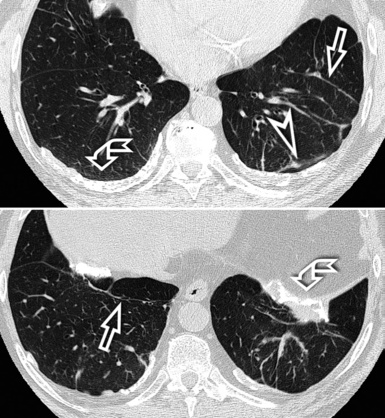
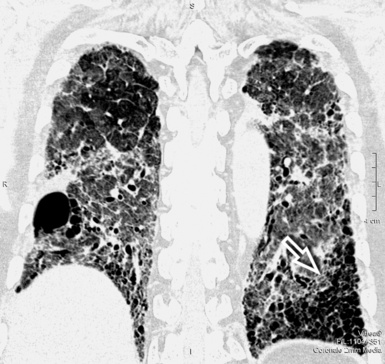
Both reticulation and honeycombing may prevail in the periphery of the lung and may show upper lung predominance (Fig. 3-52). However, a random distribution is also common. Lower lobe predominance is uncommon.34
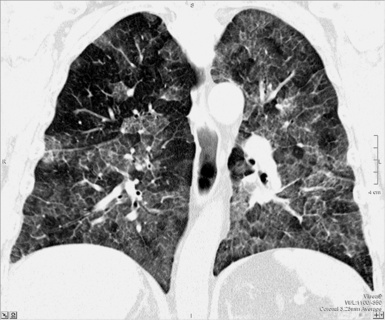
Accompanying signs of retraction on the pleural surfaces and on the mediastinal profiles are generic consequences of the underlying fibrosis. Some volume loss may occur, particularly in the upper lungs35 (Fig. 3-53).
Idiopathic Usual Interstitial Pneumonia (Clinical Idiopathic Pulmonary Fibrosis)
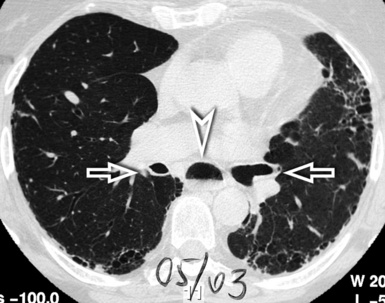
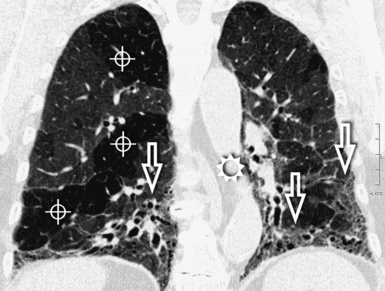
Patchy areas of dense irregular reticulation and macro,31 as well as micro28 honeycombing alternating with normal lung (morphologic heterogeneity), are the most specific feature. Some focal areas of only slightly increased attenuation (due to uneven fibrosis) interspersed with relatively normal alveoli may coexist.28 Rugged pleural surfaces (due to the tendency for fibrosis to occur in the periphery of the secondary lobule) are very frequent.28 Characteristically, the patches of fibrosis are intermingled and sharply marginated with areas of normal parenchyma36 (Fig. 3-54).
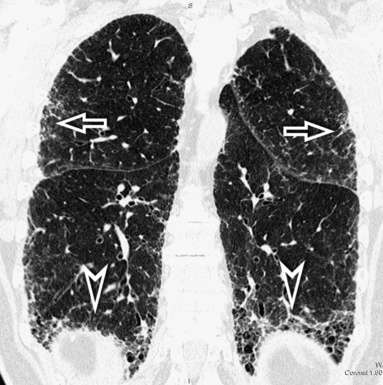
The disease is typically subpleural,29,37 with some extension to the inner lung in connection with thickened vessels and ectatic bronchi.28 The longitudinal distribution of the lesions is interesting. Although the more complex lesions with traction bronchiectasis and honeycombing show middle and lower predominance,34 a contemporary irregular reticulation is frequently seen in the upper peripheral lung38 (Fig. 3-55). Especially in advanced fibrosis, the lung becomes smaller and the indirect signs of retraction and remodeling striking.
Focal emphysematous hyperlucencies in the upper zones of the lung28 but also inside the basal lesions are possible,39 and these may create diagnostic problems of differential diagnosis with honeycombing.40 A mild enlargement of mediastinal lymph nodes is present in approximately 70% of cases.41 Occasionally, small nodular foci of calcification25 or a disseminated dendriform pulmonary ossification42 may be found. Associated solitary pulmonary opacities from lung cancer are possible,43 as much as in all fibrotic disorders.
Some CVDs44 and, more rarely, drug reactions45 may present with aspects indistinguishable from the idiopathic UIP. Consequently, the suspicion of the underlying disorder may be formulated only on clinical grounds, but occasionally specific signs of the original disease are also seen radiologically46–48 (Fig. 3-56).
Subset Fibrotic Nonspecific Interstitial Pneumonia
The NSIP pattern is defined by the presence of homogeneous areas of GGO associated with irregular reticulation49 (Fig. 3-57). The percentage of each likely depends on the proportions of inflammation and fibrosis within the lung, and some authors have even attempted to identify definite subgroups based on the extent of reticulation and traction bronchiectasis.50 Traction bronchiectasis is characteristic (Fig. 3-58). Honeycombing, on the contrary, should be absent or minimal.51
The NSIP subset may be seen both in idiopathic NSIP and in several CVD and drug reactions, but NSIP aspects also may be present in patients with acute exacerbation of NSIP (accelerated NSIP) where the histologic findings show superimposed features of acute lung injury. In latter cases, the radiologic presentation is dominated by the alveolar densities of acute lung injury, and this is consequently discussed in the Alveolar Pattern, subset Acute. Diseases in the Fibrotic Pattern, subset Fibrotic NSIP, are listed in Box 3-5.
Box 3-5 Diseases Presenting with Fibrotic Pattern, Subset Fibrotic Nonspecific Interstitial Pneumonia
Idiopathic Fibrotic Nonspecific Interstitial Pneumonia
Characteristic features of disease include reticular/GGO opacities with homogeneous aspect in affected areas. Inside the lesions, traction bronchiectasis and bronchiolectasis are common, and their extent has been shown to be a reliable indicator of fibrosis50 (Fig. 3-59). Dense consolidations, on the contrary, are uncommon, and their presence should raise the suspicion of another disease (such as OP, chronic eosinophilic pneumonia, or bronchioloalveolar carcinoma) or, in the appropriate clinical setting, of an acute exacerbation (see Alveolar Pattern, subsets Acute and Chronic).49 Honeycombing, if present, is mild and otherwise should raise the suspicion of UIP51; however, it has been reported that, over time, a number of NSIP originally presenting with NSIP pattern progress to UIP pattern.52
The disease is bilateral and symmetric,49 involving mainly the lower lungs in more than 90% of the cases51 (Fig. 3-60), otherwise equally distributed. On the contrary, primarily upper lobe lesions are very rare.49 Axially, the pattern is diffuse in more than 50% of the cases or predominantly peripheral subpleural, but in a number of cases (20% to 43% according to some authors27,51) the immediate subpleural regions are relatively spared.
Volume loss, mostly of the lower lobes, is fairly common,51 usually in conjunction with other indirect signs of fibrosis. Lymphadenopathy is possible at the mediastinal level,49 usually mild and involving not more than two nodal stations.41
Several CVDs41 and adverse reactions to therapeutic drugs53,54 may present with aspects indistinguishable from the idiopathic NSIP. Consequently, the suspicion of the underlying disorder should be formulated on clinical grounds. Occasionally, specific signs of the original disease are visible radiologically46–49 (Fig. 3-61).
Subset Tug-of-War
Tug-of-war subset is defined by the presence of irregular linear opacities stretching between the mediastinum and the thoracic boundaries, bridging over variably involved bronchi, fissures, and more generally anatomical structures and even pathologic elements found on their way (Fig. 3-62). The mediastinal profiles are variably stretched outward and the thoracic pleural profiles inward, hence the proposal for the name of this fibrotic subset (Fig. 3-63). Diseases in the Fibrotic Pattern, subset Tug-of-War, are listed in Box 3-6.
Sarcoidosis
Fibrosis may present early in the history of the disease, when nodular elements are fairly well visible. Irregularities of the margin of the nodules, distortion of fissures, bronchial irregularities, traction bronchiectasis, and more-or-less coarse linear opacities corresponding to the fibrotic component of the disease.55 The elements of the bronchovascular bundle become crowded and show a zigzagging course with angulations55,56 (Fig. 3-64). Progressive fibrosis leads to central conglomeration of parahilar bronchi embedded in a dense agglomerate of tissue radiating from the center to the periphery.56 Honeycombing and cystic abnormalities may be also seen, but rarely the honeycombing involves mainly the lower lung zones, mimicking UIP/IPF.57
The disease shows parahilar predominance between the central and the peripheral middle and upper lung, with patchy accentuation of parenchymal distortion and severity of the lesions55,58 (Fig. 3-65).
Mediastinal lymphadenopathy frequently coexists, often calcified. CT findings suggestive of pulmonary hypertension are possible in the late disease.2 Cavitation of conglomerated masses may be seen in patients with necrotizing sarcoid granulomatosis, the entity first described by Liebow characterized by sarcoid-like granulomas and vasculitis associated with variable degrees of necrosis56 (Fig. 3-66).
Subset Bronchocentric Fibrosis
Focal fibrosis from constrictive bronchiolitis is concentrated on the bronchioli and too subtle to be appreciated radiologically. However, indirect signs of bronchial narrowing are visible, namely a patchy dark lung (Fig. 3-67). This condition is subsequently discussed in the Dark Lung Pattern.
Pulmonary Langerhans cell histiocytosis, also a prominently centrilobular fibrotic process, on the contrary is well visible in form of thick walls around enlarged airways (Fig. 3-68) that assume early a cystic aspect.59 Consequently, its insertion in the cystic pattern has been considered more suitable. Diseases in the Fibrotic Pattern, subset Bronchocentric Fibrosis, are listed in Box 3-7.
Airway-Centered Interstitial Fibrosis
The main findings of airway-centered interstitial fibrosis are peribronchovascular interstitial thickening with traction bronchiectasis, thickened airway walls, and surrounding dense tissue with irregular margins (Fig. 3-69). Bronchiolectasis and honeycombing may also occur in a limited number of cases. GGO, poorly defined centrilobular micronodules, and lobular air trapping with the mosaic attenuation of the dark lung pattern are lacking.59
The lesions show a central rather than a peripheral distribution. They consistently show scarring around the airways60 (Fig. 3-70).
Nodular Pattern
Definition
A nodular pattern is defined by the presence of multiple roundish opacities ranging in diameter from 2 to 10 mm (Fig. 3-71).
High-Resolution Computed Tomography Signs
On HRCT, lung nodules appear as white, roundish lesions with variable morphology and lobular distribution, depending on the route of arrival and on the modality of spread.2,7,61
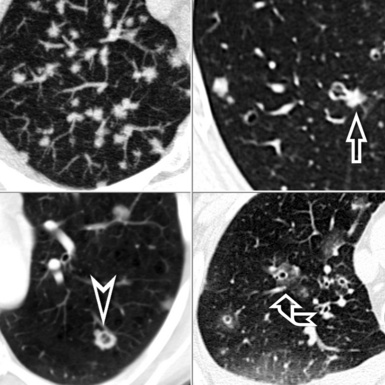
Nodules that have low-density and ill-defined margins (nodular GGO) have a characteristic soft aspect, like snowflakes (Fig. 3-72). Sometimes they are very tiny and difficult to recognize.20 They are commonly seen in patients with disease that primarily affects centrilobular bronchioles and the immediate area around them. The low-density CT aspect is due to minimal thickening of the peribronchiolar interstitium or partial filling of the peribronchiolar alveoli.2 Both conditions are below the CT spatial resolution, and thus the common final effect is a focal low-density lesion. The ill-defined margins are due to progressive reduction of interstitial or alveolar involvement extending away from the centrilobular area to the periphery. These types of nodules may coalesce, resulting in the appearance of extensive GGO.
Nodules with high-density and well-defined margins are commonly seen in patients with diseases primarily affecting the interstitium and growing spherically in it surrounded by aerated parenchyma.2,61 They present a solid aspect like opaque beads and obscure the edges of vessels or other structures that they touch (Fig. 3-73). They may have regular or lobulated contours, the latter aspect secondary to asymmetrical growth. The nodules may coalesce with development of larger opacities or pseudoplaques along the costal or fissural margins.62
On occasion, the nodules may have shaggy profiles, especially in diseases with a fibrotic component (Fig. 3-74). The existence of small black areas inside these high-density nodules may be due to necrosis (see Fig. 3-74) or traction bronchiolectasis. The presence of faint increased lung attenuation around the nodules (halo sign) is most often an expression of hemorrhage (see Fig. 3-74) or of inflammatory infiltrates from any origin.62,65 Regarding the lobular distribution, this is the result of the route of arrival and of their modality of spread, both underlying their distinction in subsets.
Subsets
The inhaled diseases show nodules close to the bronchiole in the center of lobules (see subset Centrilobular). The diseases that grow along the lymphatics are more present in the periphery of the lobules and in particular along the fissures (see subset Lymphatic). The lesions that spread hematogenously are visible everywhere, so they may be seen in the core but also in the periphery (see subset Random), sometimes in connection with blood vessels.61,64
Subset Centrilobular
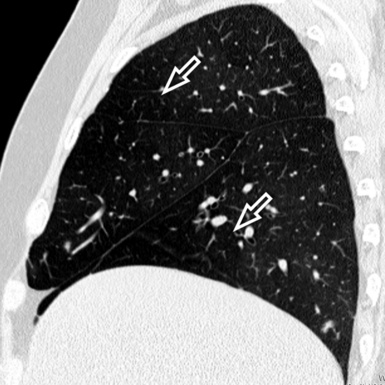
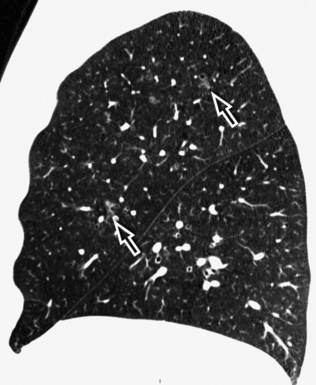
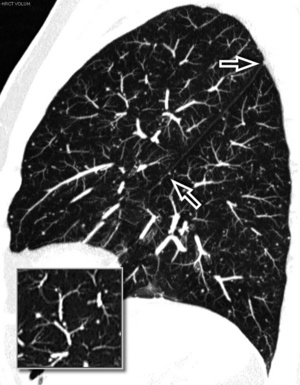
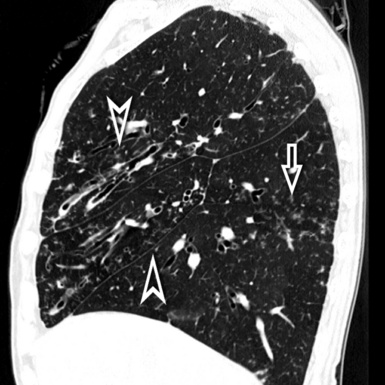
On CT images, one can assume a centrilobular distribution of nodules when they stop at a certain distance from the pleural surfaces (“avid of pleura”).7,64 This feature is well demonstrated on the sagittal MIP images with the visibility of thin black lines of normal lung along the fissures (Fig. 3-75).
In the early stage, Langerhans cell histiocytosis is characterized by the presence of centrilobular nodules that, however, become cysts early.65 Consequently, the inclusion of this disease in the cystic pattern has been considered more suitable. Diseases in the Nodular Pattern, subset Centrilobular, are listed in Box 3-8.
Follicular Bronchiolitis
The basic features of follicular bronchiolitis consist of bilateral well-defined or ill-defined small centrilobular nodules (Fig. 3-76). In some patients, the centrilobular opacities may present a branching appearance reflecting the morphology of the small airways involved, thereby with aspects mimicking an aspect called tree-in-bud66–68 (see Fig. 3-76).
The lesions are bilateral and diffuse (Fig. 3-77), sometimes with a predominant involvement of the lower zones.66
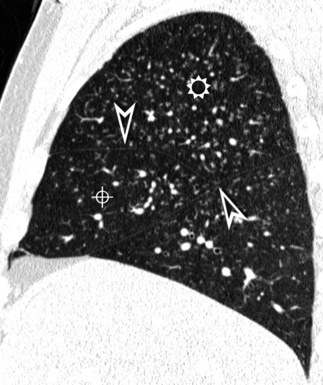
Figure 3-77 Sagittal view of the same patient as in Figure 3-76. This computed tomography plane highlights the visibility of the fissures (arrowheads) that are not involved by the nodules. This view also shows the craniocaudal distribution of the lesions that prevail in the right upper (sun) and middle (bull’s-eye) lobes.
Patchy areas of GGO are present in 75% of patients, and mild bronchial wall thickening often exists68 (Fig. 3-78). Rare subpleural nodules also may be present (20%), and thin-walled cysts may occur due to “check-valve” obstruction of small bronchioles by lymphoid tissue.69,70
Subacute Hypersensitivity Pneumonitis
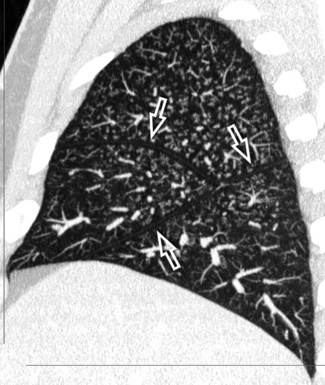
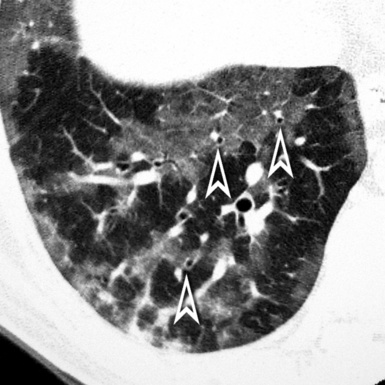
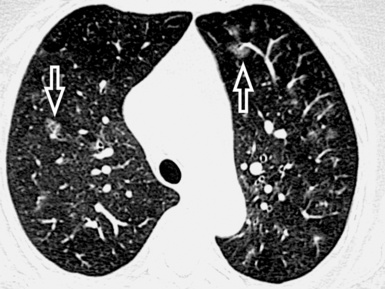
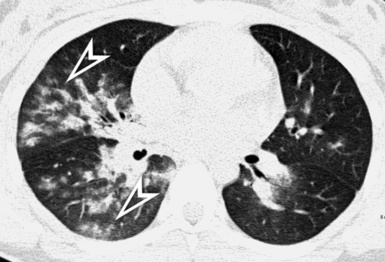
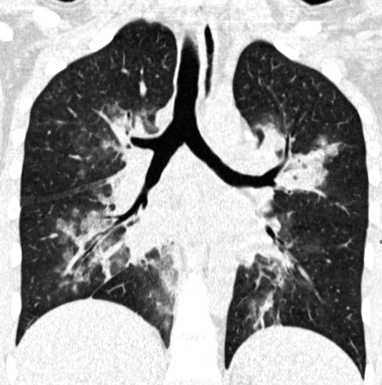
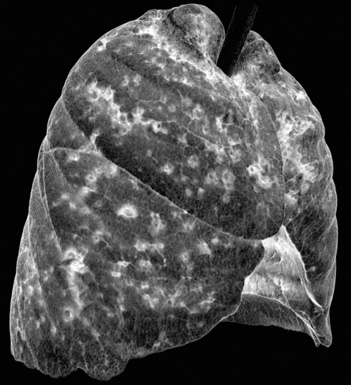
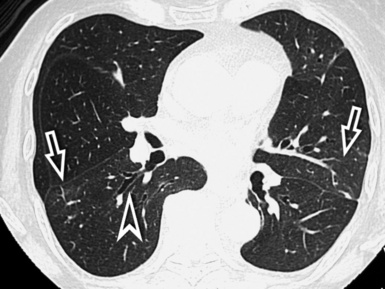
The hypersensitivity pneumonitis pattern is defined by the presence of numerous centrilobular nodules with low-density and ill-defined margins (nodular GGO), usually less than 5 mm in diameter (Fig. 3-79).35 The key to the diagnosis is the coexistence of sporadic lobular areas of air trapping appearing as patches of black lung (see Fig. 3-79). These regions of lobular air trapping are caused by concomitant bronchiolar inflammation and obstruction.71
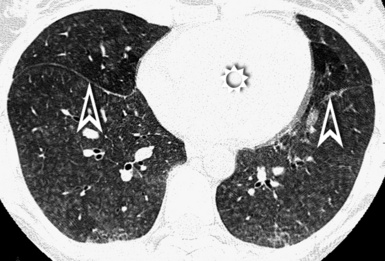
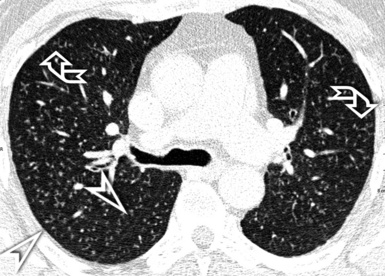
The lesions are uniformly distributed, with possible middle-lower predominance35,71 (Fig. 3-80).
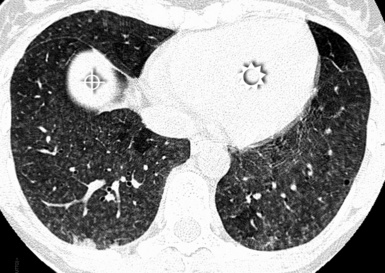
Figure 3-80 This axial scan of the same patient as in Figure 3-79, but at a lower level, confirms a high prevalence of lesions in the basal lung. The heart is indicated by the sun, the hepatic dome by the bull’s-eye.
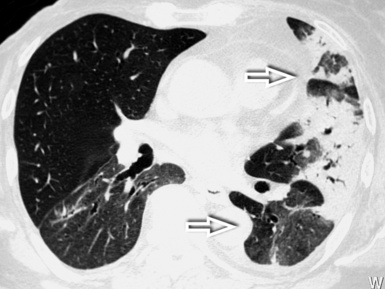
Areas of GGO often coexist. These are usually bilateral and symmetric, but sometimes they can be patchy. Another significant diagnostic finding is the combination of patchy GGO, normal lung, and dark lung from air trapping. This mixture of densities gives the lung a distinctive appearance that has been nicknamed “head cheese” because of its resemblance to the variegated cross-sectional appearance of sausage made from parts of the head of a hog72 (Fig. 3-81).
Bronchiolar wall thickening may also occur, and lung cysts have been found occasionally. The latter are probably caused by partial obstruction of bronchioles (“check-valve” mechanism).71 Mediastinal lymph node enlargement has been described in approximately 30% of patients. In patients with an insidious onset of disease, focal areas of consolidation may be occasionally present, presumably representing OP or superimposed unrelated processes such as aspiration injury or infectious pneumonia.
Respiratory Bronchiolitis–Interstitial Lung Disease
The typical presentation of respiratory bronchiolitis–interstitial lung disease (RB-ILD) is that of centrilobular nodularity (Fig. 3-82), often in combination with areas of GGO and moderate centrilobular emphysema. The nodules present low-density and ill-defined margins (nodular GGO) and may be tiny and difficult to recognize73,74 (see Fig. 3-82). Centrilobular nodules reflect accumulation of macrophages and inflammation in and around the respiratory bronchioles.
The nodules have an even uniform distribution in the axial plane, and they predominate in the upper lobes76 (Fig. 3-83). The areas of GGO involve the lung zones diffusely with a patchy distribution; this sign is thought to reflect the macrophage accumulation in the alveoli and alveolar ducts.75
Another common finding in RB-ILD is central and peripheral bronchial wall thickening caused by airway inflammation (90%) (Fig. 3-84). Areas of hypoattenuation are noted in 38% of patients and are most likely related to air trapping.75,77 Sometimes signs of other smoking-related interstitial lung diseases may coexist (i.e., desquamative interstitial pneumonitis, pulmonary Langerhans cell histiocytosis, smoking-related pulmonary fibrosis), creating mixed patterns.76
Subset Lymphatic
Lymphatic nodules commonly occur along lymphatic routes. They tend to be concentrated and more visible along the costal margins and/or the fissures (“avid of pleura”)7 (Fig. 3-85). They are also visible in the perilobular interstitium, as much as along vessels and bronchi.61,64
In the interstitial form of amyloidosis, the abnormalities may occur as distinct subpleural nodules, but nodular septal thickening and confluent subpleural consolidative opacities are more commonly observed (see Septal Pattern, subset Nodular). Diseases in the Nodular Pattern, subset Lymphatic, are listed in Box 3-9.
Sarcoidosis
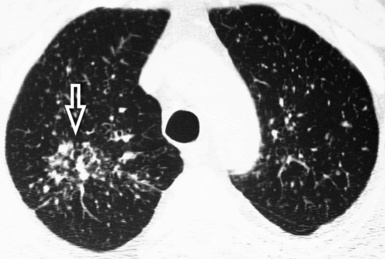
The most characteristic abnormality in patients with sarcoidosis is the presence of small, high-density nodules with well-defined margins, sometimes with shaggy profiles (see Fig. 3-74). The nodules are distributed along the costal margins and the fissures, but they are also concentrated along the bronchovascular sheath56,78 (Fig. 3-86). They may coalesce to form large nodules or pseudoplaques along the pleural margins62 (see Fig. 3-86).
The distribution of the lesions is patchy, with a parahilar predominance (see Fig. 3-86). A predilection for the upper-dorsal lung zones is often present56,78 (Fig. 3-87).
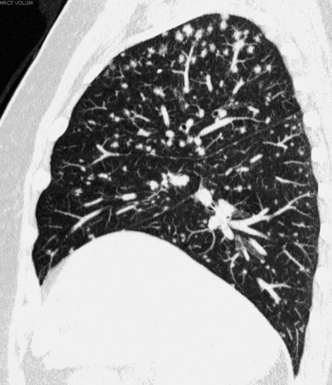
Figure 3-87 Sagittal view of a patient with sarcoidosis. A middle-upper predominance of the nodules is evident.
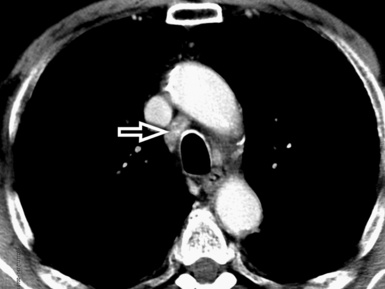
Lymphadenopathy is the most common finding in sarcoidosis, and typically it is hilar, bilateral, and symmetrical. In addition, mediastinal lymph node enlargement is often present, especially in the right paratracheal and subcarinal node groups (Fig. 3-88). Lymph node calcifications are visible in 25% to 50% of cases, and these may be amorphous, punctate, dense, or eggshell and suggest chronic disease.78
Occasionally, the confluence of several interstitial granulomas may result in large, irregular, masslike nodules without or with air bronchogram, resembling air-space consolidations. Small satellite nodules may be present at the periphery of these opacities, an occurrence referred to as the “galaxy sign,” given its resemblance to collections of stars.79 In some cases, on the contrary, the nodules can be so small that they are not distinctly visible, but their attenuation produces patchy areas of finely granular increased opacity (granular GGO). Finally, granulomas situated in the small airways can cause lobular air trapping.80
Lymphoid Interstitial Pneumonia
Lymphoid interstitial pneumonia is a multifaceted disease that may present with different patterns depending at least in part on the underlying disease. In patients with acquired immunodeficiency syndrome (AIDS), HRCT most often shows nodular aspects along lymphatic routes. The well-defined nodules range from 1 to 3 mm (Fig. 3-89). This pattern may be associated with thickening of the bronchovascular bundles, mild interlobular septal thickening, and tiny ill-defined centrilobular nodules.81
The lesions involve mainly the lower lung zones82 (Fig. 3-90).
Figure 3-90 Same patient as in Figure 3-89. The axial scan at a lower level shows some prevalence of the nodules in the lower lung.
In Sjögren syndrome, lymphoid interstitial pneumonia is typically associated with round or oval thin-walled cysts of variable size (Fig. 3-91). They may be seen in up to 80% of patients and are typically few in number, and they measure less than 3 cm in diameter. They presumably result from air trapping due to peribronchiolar lymphoid infiltration.83,84
Other possible findings include bilateral areas of ground glass attenuation and poorly defined centrilobular nodules, most often in congenital immunodeficiency syndromes. Lymphadenopathy is variably associated with lymphoid interstitial pneumonia, according to different series (0% to 68%).81,83,85
Silicosis and Coal Worker’s Pneumoconiosis
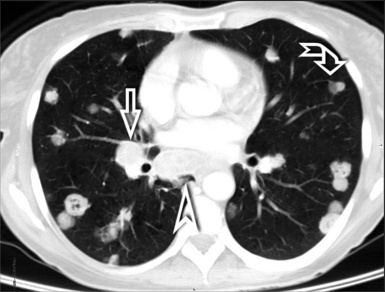
The characteristic feature of silicosis and coal worker’s pneumoconiosis (CWP) is the presence of multiple nodules with a lymphatic distribution. Usually the nodules predominate in the subpleural regions, but they are also observed in the centrilobular regions (Fig. 3-92). The high-density nodules often have well-defined margins, sometimes with calcification. Subpleural nodules have a rounded or triangular configuration, and if they are confluent, they may resemble pleural plaques (pseudoplaques)86 (see Fig. 3-92).
The lesions of pneumoconiosis mainly involve the upper and posterior lung zones. Bilateral and symmetrical distributions may be observed, although a right-sided predominance is common86,87 (Fig. 3-93).
Hilar and mediastinal lymph node enlargement may precede the appearance of parenchymal nodular lesions. Calcification of lymph nodes is common (Fig. 3-94) and may occur at the periphery of the node, producing an “eggshell” appearance. This so-called “eggshell calcification pattern” is highly suggestive of silicosis.87
The appearance of large parenchymal opacities or hyperdense areas greater than 1 cm in diameter indicates the presence of complicated silicosis/CWP (progressive massive fibrosis). These masses are often bilateral, symmetrical, and calcified, and they can demonstrate cavitations.88
Subset Random
Random nodules are visible everywhere and also touching the pleural surfaces but without a consistent relationship with them (“indifferent to the pleura”) (Fig. 3-95). At times, they can be seen in contact with the extremities of the vascular structures from which they seem to originate (“feeding vessel” sign)7,64 (see Fig. 3-95). Diseases in the Nodular Pattern, subset Random, are listed in Box 3-10.
Hematogenous Metastases
The nodules, usually dense and well defined, tend to appear evenly distributed. Individual nodules may have “feeding vessels” consistent with their hematogenous origin (Fig. 3-96). Nodules with poorly defined margins can be identified in 16% to 30% of cases; these may reflect lepidic growth of tumor.64,89 Nodules may also be cavitated and/or surrounded by a “halo” of ground glass attenuation, which is typical of hemorrhage.89,90
A basilar predominance is typically noted due to preferential blood flow to the lung bases. When limited in number, metastatic nodules may be seen primarily in the lung periphery. In patients who have innumerable metastases, a uniform distribution throughout the lung is common89 (Fig. 3-97).
Macronodules, carcinomatous lymphangitis, and enlarged lymph nodes also may be present (Fig 3-98; see also Fig. 3-96). Occasionally, intravascular tumor emboli may result in nodular or beaded enlargement of the peripheral pulmonary arteries with a tree-in-bud appearance91 (see Fig. 3-98).
Miliary Tuberculosis
Numerous dense 1- to 3-mm nodules that are uniform in size, either sharply or poorly defined, are characteristic of this disease (Fig. 3-99). The nodules may be observed in the subpleural regions or along the fissures, but the general impression is of a random distribution. At times, a relationship may be observed with the most peripheral vessels.92,93 Macronodules resulting from the fusion of several granulomas are sometimes seen. GGOs are common in these patients and may represent areas of edema or multiple microgranulomas.94,95 The nodules are distributed uniformly throughout the lungs without cephalocaudal or central-to-peripheral preference92 (Fig. 3-100).
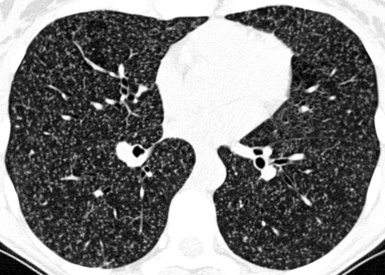
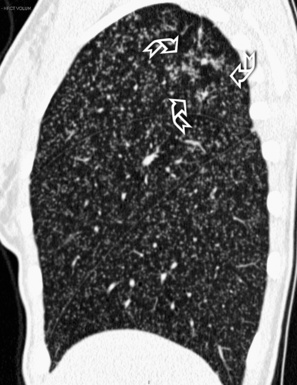
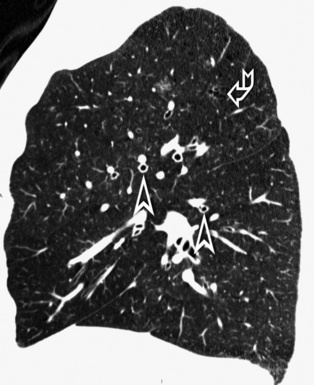
Figure 3-100 Sagittal view of the same patient as in Figure 3-99. The tiny nodules are scattered quite uniformly all through the lungs. In the upper lobe, there are also signs of bronchogenic spread of the disease with a tree-in-bud pattern (curved arrows).
Associated findings that may suggest the diagnosis are present in up to 30% of affected persons and include consolidation, cavitation, and signs of bronchogenic spread of the disease with tree-in-bud pattern (see Fig. 3-100) and lymphadenopathy.92 Necrotic lymph nodes may be observed in 70% of seropositive patients and in 20% of seronegative patients.93 Diffuse or localized GGO is sometimes seen, and it may herald acute respiratory distress syndrome.94,95 Changes from previous tuberculosis are seen in 50% of the patients and provide an aid in the differential diagnosis. Such changes often occur in the upper lobes as fibrotic bands with traction bronchiectasis, apical calcified nodules, and areas of oligemia due to previous bronchiolitis obliterans95,96 (Fig. 3-101).
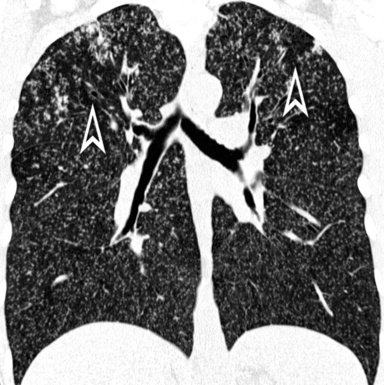
Figure 3-101 Coronal view of the same patient as in Figure 3-99. Patchy areas of oligemic dark lung (arrowheads) are present in the upper lung fields.
Fungal infection may produce diffuse interstitial lung disease characterized by small nodules with random distribution like miliary tuberculosis.97 Also in this type of infection, signs of bronchiolar spreading with bronchioles filled with infected material are often present and result in a tree-in-bud appearance.98 All these aspects are most commonly seen in immunocompromised patients.99 The presence of cavitation inside the nodules and large nodules with a halo sign are both suggestive of fungal infection. The nodules may be associated with areas of air-space consolidation.62,100
Alveolar Pattern
Definition
An alveolar pattern is present when more-or-less broad portions of lung become more opaque than normal, due to a partial or complete filling of alveoli (Fig. 3-102). The pulmonary architecture is overall preserved, and if signs of interstitial involvement are present, they are not prevalent. Alveolar filling may be due to fluid, cells, or other material that in most cases, radiology is not able to discriminate. Nevertheless, size and aspect of the opacities, their distribution within the lung, and a number of ancillary signs provide useful diagnostic clues in several conditions.
High-Resolution Computed Tomography Signs
The main signs of an alveolar disorder are GGO and consolidation. GGO appears as hazy increase of lung attenuation with preservation of the bronchial and vascular margins20,26 (Fig. 3-103). GGO may be caused by partial filling of air spaces, interstitial thickening, partial collapse of alveoli, increased capillary blood volume, or a combination of these, the common factor being the partial displacement of air.20 The lobular elements and, more in general, the pulmonary architecture are not distorted (see Fig. 3-103). Consolidation appears as an intense increase in pulmonary attenuation that obscures the margins of vessels and airway walls.8,20 Consolidation is due to a complete filling of alveoli by any material (exudate, cells or other product of disease cause a same radiologic aspect), the common factor being the full displacement of air from alveoli.20 However, if air persists in the lumen of the bronchi, they remain visible inside the opacity (air bronchogram) (Fig. 3-104). An area of consolidation may contain hypodensities or hyperdensities, reflecting the presence of differently attenuating substances such as fat, metals, calcium, or air (Fig. 3-105). GGO and consolidation may coexist in the same patient, creating mixed densities aspects (see Fig. 3-102A).
Crazy paving is a smooth, fairly regular network of white lines superimposed on a background of GGO, resembling shaped paving stones20,101 (see Fig. 3-105). These white lines may represent thickened intralobular/interlobular interstitium but also purely alveolar deposition of material within the air spaces at the borders of unit structures such as acini or secondary lobules.102,103
Tree-in-bud is the name given to centrilobular dense branching linear structures originating from a single stalk and often ending in a nodular form (thus, resembling a budding tree)20,98 (Fig. 3-106). The “tree” reflects the existence of luminal dilatation, bronchiolar wall thickening, and impaction104 for a spectrum of endobronchiolar and peribronchiolar diseases,20 the most common being infectious disorders.98,105 The “buds” are micronodular opacities due to concomitant nearby filling of airway lumina106 or infiltration of the centrilobular interstitium. Rarely, a tree-in-bud aspect may represent an intravascular pulmonary tumor embolism107,108 (see Hematogenous Metastases in Nodular Pattern, subset Random).
A halo sign occurs when a central area of consolidation is surrounded by a halo of GGO attenuation63,109–111 (see Fig. 3-106). This sign suggests that a disease might be pathologically active with hemorrhage, inflammation, or tumor spread at its periphery.109,112
A reversed halo sign occurs when, on the contrary, a ring or crescent of dense consolidation surrounds a core of GGO (see Fig. 3-106). This often corresponds to patches of alveolar/septal inflammation and cellular debris surrounded by a rim of denser OP.113,114
A perilobular pattern occurs when poorly defined bandlike opacities with an arcade-like or polygonal appearance border the interlobular septa. They have greater thickness and are less sharply defined than true interlobular thickening encountered in the septal pattern (see Fig. 3-106). Indeed, these opacities are due to accumulation of organizing exudate in the perilobular alveoli even without septal thickening.115,116
Subset Acute
An alveolar pattern is acute when the onset of respiratory symptoms dates back to days or a few weeks (1–14 days, according to Schwarz and King117).
The opacities are more often bilateral and diffuse, and they may change in appearance quite rapidly. With the exception of the presence of an underlying fibrotic disease, signs of distortion or remodeling of the pulmonary structures are not evident, at least in the early phases of disease (Fig. 3-107).
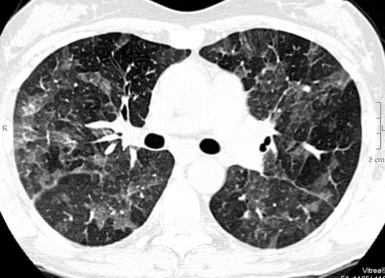
Figure 3-107 Diffuse, bilateral ground glass opacities are often the modality of presentation of the acute alveolar disorders.
Airborne diseases can be responsible for signs of bronchial wall involvement, peribronchial consolidations, poorly defined air-space nodules of acinar aspect (4–10 mm) (Fig. 3-108), and even lobular hyperinflation as a consequence of the reduction in caliper of the bronchiolar lumen. Diseases in the Alveolar Pattern, subset Acute, are listed in Box 3-11.
Acute Interstitial Pneumonia/Acute Respiratory Distress Syndrome
Areas of GGO (100%) and patchy air-space consolidation (92%)118 with air bronchogram119 are the main findings in patients with both acute respiratory distress syndrome and acute interstitial pneumonia120 (Fig. 3-109). Interlobular septal thickening (89%) and intralobular reticulation (78%)118 with aspects of crazy paving,102,103 thickening of the bronchovascular bundle (86%), and nodular (86%) opacities118 are also very frequent. Similar findings with variants have been described in acute eosinophilic pneumonia121–123 and acute reactions to therapeutic45,53,54,124,125 and illicit126 drugs.
The distribution of the lesions is variable, a specific predominance either in the craniocaudal or axial directions being possible in single cases.118 During the progression of disease, the extent of GGO tends to increase, and more homogeneous, gravity-dependent consolidative opacities appear118,120 (Fig. 3-110).
Moving from the acute and subacute to the chronic fibrotic phase, a distortion of the interstitial and bronchovascular markings is frequent (Fig. 3-111), and beyond the first week or two, a dramatic increase of subpleural cysts and bullae also occurs.127 On the contrary, if signs of retraction and remodeling are evident in the early phases of disease, an acute exacerbation (acceleration) of a fibrosing disorder should be suspected (see Acceleration of Fibrosing Diseases). Late radiologic features of both acute interstitial pneumonia/acute respiratory distress syndrome are a piling up of findings from original disease, atelectasis, inflammation, and side effects of mechanical ventilation.
Acceleration (Acute Exacerbation) of Fibrosing Diseases
The radiologic presentation of accelerated fibrosing diseases (also called acute exacerbation) is a coexistence of more-or-less extensive GGO with or without consolidation and signs of the underlying disorder (Fig. 3-112). In patients with UIP, irregular reticulation with patchy areas of honeycombing128,129 is visible. In contrast, in patients with NSIP, irregular reticulation and bronchiectasis, as well as increasing of previous GGO, are present.130
The distribution of the alveolar densities may be multifocal, diffuse (Fig. 3-113) (and when multifocal it tends to evolve rapidly to the diffuse form), or peripheral. In a series of accelerated UIP, multifocal and diffuse disease corresponded to pathologic diffuse alveolar damage, whereas peripheral disease is mainly correlated with OP and numerous fibroblastic foci.131
The possibility of an acute exacerbation (Fig. 3-114) has been described for idiopathic UIP (clinical IPF), idiopathic NSIP, and both UIP and NSIP associated with connective tissue disorders.131,132 The specific aspect of the two leading subsets has been described in detail in Fibrotic Pattern.
Diffuse Alveolar Hemorrhage
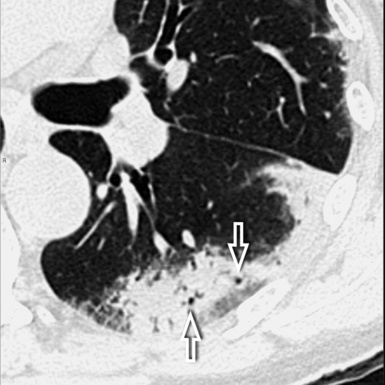
Whatever the underlying cause (e.g., vasculitides, drug reactions, coagulopathies), limited free blood within the lobular boundaries gives origin to ill-defined centrilobular nodules. Larger amounts of fluid flooding the alveoli cause more-or-less extended opacities, ranging in intensity from vague GGO (Fig. 3-115) to intense consolidation.133
The distribution of the lesions is variable and depends on both the anatomical location and the mechanism by which the hemorrhage occurs. Extended areas of opacification may be patchy or uniform, tend to spare lung apices, and often show parahilar predominance134 (Fig. 3-116).
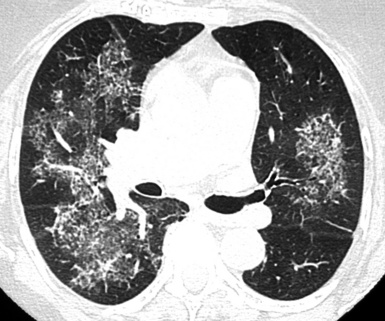
Figure 3-116 The alveolar opacities in this patient with alveolar hemorrhage show neat parahilar predominance.
Within days of an acute episode, the interlobular thickening due to hemosiderin-laden macrophages accumulating in the interstitium may give a crazy paving aspect to the opacities (Fig. 3-117). After repeated episodes, a persistent irregular reticular pattern with traction bronchiectasis, sometimes even with honeycombing, may be seen.133
Hydrostatic Pulmonary Edema
GGOs accompanied by visible interlobular septa and thickened peribronchovascular bundle are the most common findings10,135 (Fig. 3-118). Frank parenchymal consolidations may coexist, but they are more typical of advanced cases. Usually, they are not investigated with CT (frank alveolar edema is simply diagnosed with radiography). The specific aspects of the interstitial involvement in pulmonary edema are described in detail in Septal Pattern, subset Smooth.
The opacities are diffuse or patchy and bilateral if no reasons for unilaterality exist (e.g., patient’s lateral decubitus, fibrosing mediastinitis).135 The lesions often show gravitational or parahilar predominance related to pressure dynamics9 (Fig. 3-119). However, in these early phases of edema, the gravitational predominance may be subtle, and in selected cases even an upper lobe distribution of lesions may occur.10 A characteristically asymmetrical involvement of right middle and upper lobes is the rule in case of myocardial infarction, papillary muscle rupture, and mitral valve insufficiency.10
Unilateral or bilateral pleural effusion and thickening of the interlobar fissures are common in hydrostatic pulmonary edema10 (Fig. 3-120). In addition, mediastinal lymphadenopathy is not rare at all in patients with left-sided heart failure.11
Infectious Diseases
A mixture of lobular or diffuse GGO/consolidation, centrilobular ill-defined nodules, and thickened interlobular septa may be seen, with a prevalence depending on the specific disease and its severity. The lesions reflect the variable extent of underlying histopathologic features: bronchial and bronchiolar participation, interstitial and alveolar inflammatory cell infiltration, intra-alveolar hemorrhage, and diffuse alveolar damage134,136 (Fig. 3-121).
More than 60% of patients with Mycoplasma pneumoniae pneumonia have lower zone predominance, whereas 50% of patients with fungi have upper zone predominance of the lesions.137 In influenza pneumonia, the opacities may show a preference for perivascular (Fig. 3-122) and subpleural areas.136 Pneumocystis presents a striking upper lobe predominance of GGO.138
Nodules are frequent in patients with fungal (65%), viral (77%), and M. pneumoniae pneumonia (89%), and they are much less common in patients with bacterial pneumonia (17%).139 In varicella-zoster virus pneumonia, well-defined and ill-defined nodules of 1 to 10 mm diameter are diffusely scattered throughout the lungs (Fig. 3-123); coalescence of nodules and patches of GGO are also possible.136 In immunocompromised subjects, especially HIV patients, the presence of extensive, diffuse, bilateral GGO is suggestive (although not specific) for Pneumocystis jiroveci pneumonia;139,140 it becomes very typical if cystic lesions are contemporarily present.137 On the contrary, nodules are absent.139
Subset Chronic
An alveolar pattern is chronic when the onset of respiratory symptoms dates back from months to years from the time of diagnosis.117
The lesions may be bilateral but also unilateral (Fig. 3-124), and with a few exceptions they tend to clear up slowly over time (unless they worsen and proceed to fibrosis). Often arranged in patches of conspicuous size, they entertain tight relationships with the large airways, but a participation of the small airways in the lobular area is also possible. The variety of chronic lung disorders may produce more multifaceted aspects than the acute forms (Fig. 3-125). However, within the range of the alveolar signs, it is often possible to identify prevalent aspects useful for narrowing the diagnostic possibilities: pure GGO, mixed densities, and crazy paving and tree-in-bud signs; these will be declared at the beginning of each disease presentation.
Some diseases tend to develop alveolar opacities but show prevalent aspects that make preferable their inclusion in another pattern. These are hypersensitivity pneumonitis and RB-ILD, described in the Nodular Pattern, subset Centrilobular, and the fibrosing disorders showing as GGO, discussed in the Fibrotic Pattern. Diseases in the Alveolar Pattern, subset Chronic, are listed in Box 3-12.
Bronchioloalveolar Carcinoma
The diffuse form of bronchioloalveolar carcinoma is a mixed densities disease. Patchy areas of GGO/consolidation and/or multifocal macronodular lesions with a halo sign are the most common presentations.141–143 A skeletal, stretched, air bronchogram is frequently seen inside the opacities144 (Fig. 3-126). Crazy paving aspects and collections of air within consolidations (known as cystic bronchioloalveolar carcinoma) (see Fig. 3-105) are also possible.143,145 When nodules are present at the lobular level, they assume the aspect of centrilobular ill-defined opacities or, rarely, a tree-in-bud appearance.141
Central or peripheral, a quite characteristic aspect is that of a more dense consolidation (possibly, the origin of the neoplasm), with GGO nearby. There are scattered patches of GGO and/or consolidation with a halo sign elsewhere, ipsilaterally and/or contralaterally143 (Fig. 3-127). Bulging of fissures is possible in the presence of dense lobar consolidation144 (Fig. 3-128), and pleural effusion and mediastinal lymph node enlargement are also possible.143
Chronic Eosinophilic Pneumonia
Chronic eosinophilic pneumonia is a mixed densities disease. In the early phases, bilateral homogenous air-space consolidations are the most frequent modality of presentation (65%). However, GGO may also be the predominant pattern (35%), and septal lines often coexist (72%)146 (Fig. 3-129). In the later stages, GGO, nodules, some reticulation and, after weeks, linear bandlike opacities parallel to the pleural surface can be seen.122 The opacities are quite characteristically arranged in the periphery of the upper lung zones in 50% of the cases,122 with a less frequent “hinging on the bronchi” appearance compared with OP lesions (Fig. 3-130).
In drug-induced eosinophilic pneumonia, areas of ground glass attenuation, air-space consolidation, nodules, and interlobular septal thickening are common.123,147 The clinical response to corticosteroids is usually excellent and, typically, accompanied by rapid clearing of the opacities117 (Fig. 3-131). Pleural effusion is possible in 10% of cases.122
Desquamative Interstitial Pneumonia
Desquamative interstitial pneumonia is a GGO disease. Quite extensive areas of pure GGO are indeed the dominant finding148,149 (Fig. 3-132). Centrilobular nodules are uncommon,149 and consolidative and reticular opacities are also uncommon.148
The lesions start typically in the lower lungs and peripherally149,150 (Fig. 3-133).
Emphysema (Fig. 3-134; see also Fig. 3-133) has been reported in about 50% of patients with desquamative interstitial pneumonia.151 In late disease, signs of fibrosis may superimposed, with interstitial irregular lines, interface signs, and cystic hyperlucencies inside the GGO149,152 (see Fig. 3-134).
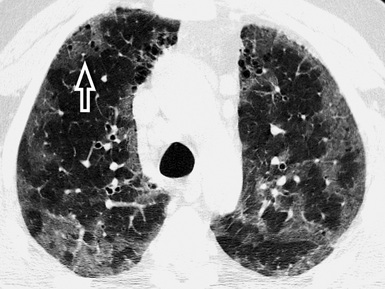
Figure 3-134 This is the same patient as in Figure 3-132, but after several years of a disease poorly managed. Now there are several patches of GGO in the upper lungs (this is an axial view at the level of the aortic arch). Some paraseptal emphysema is appreciable in the anterior paramediastinal area, but also tiny hyperlucencies inside the GGO are visible (arrow).
Infectious and Inflammatory Diseases
These are mixed densities and tree-in-bud entities. Single or multiple areas of consolidation/GGO alert to the existence of an alveolar disorder.67 Signs of bronchial and bronchiolar involvement (bronchiectasis and bronchial wall thickening, bronchiolectasis with tree-in-bud or centrilobular nodules) often coexist and at times are the dominant pattern.66,67,70 In areas of bronchiolar involvement, expiratory air trapping is frequently evident.67,70 Cavitated opacities should raise the possibility of mycobacterial disease, and a surrounding (but also at a distance) tree-in-bud pattern should raise the suspicion of an aerogenous spread of disease (Fig. 3-135).
Bronchiolitis of infectious origin often has a patchy distribution, whereas noninfectious, inflammatory bronchiolitis tends to have a more uniform, bilaterally symmetrical involvement. Diffuse panbronchiolitis, in particular, presents with centrilobular nodules, tree-in-bud pattern, bronchiectasis, and bronchiolectasis with a dominant symmetrical lower lobe distribution.67 If signs of bronchial involvement (including bronchiectasis) and/or alveolar opacities are found predominantly in the right middle lobe and lingula, an infection from nontuberculous mycobacteria (“Lady Windermere” syndrome) should be suspected153–155 (Fig. 3-136).
Unresolving consolidative opacities with low CT attenuation values (or frankly fatty densities) point to the possibility of an exogenous lipoid pneumonia156,157 (see Fig. 3-105). In chronic mycobacterial infections, signs of retraction at the segmental or lobar level may be seen155 (Fig. 3-137).
Mucosa-Associated Lymphoid Tissue Lymphoma
Mucosa-associated lymphoid tissue lymphoma (MALToma) is a mixed densities disease. Air-space consolidations with air bronchogram, from unifocal or multifocal lesions to pneumonic-like opacities of lobar size, are the most common findings158–160 (Fig. 3-138). In the surrounding area, spreading of disease along lymphatic routes may be responsible for a GGO with septal lines, some bronchial thickening, and micronodules with lymphatic distribution.158,161,162 Centrilobular nodules are also possible.159
The disease may be unilateral or bilateral, seemingly with no vertical or horizontal zonal predominance.158 The infiltration along bronchovascular bundles may result in focal lesions typically centered on the bronchi159,162 (Fig. 3-139).
The lesions show a temporally indolent nature160 and do not present a tendency to cavitation.162 Significant hilar and mediastinal lymphadenopathies or pleural effusion are not a characteristic feature of the disease159,162 (Fig. 3-140).
Cellular Nonspecific Interstitial Pneumonia
Cellular NSIP is a GGO disease. The opacities involve the lungs more-or-less extensively and are homogeneous. Significant reticulation, traction bronchiectasis, or other signs of architectural distortion should be minimal or absent49,163 (Fig. 3-141), and honeycombing is typically absent.164
The disease is bilateral and symmetrical,163 involving mainly the lower lung in more than 90% of cases51 (else equally distributed). The opacities may show some tendency to distribute along the bronchovascular bundles.50 Axially, the disease is diffuse in more than half of the cases or predominantly peripheral and subpleural. However, in a number of cases (20% to 43%), the extreme subpleural lung is relatively spared27,51 (Fig. 3-142).
Several CVDs44 and chronic drug reactions165 may present with aspects indistinguishable from idiopathic NSIP. Consequently, a search for a nonidiopathic underlying disorder should be always undertaken clinically, although occasionally other signs of the original disease are visible radiologically46,49 (Fig. 3-143).
Organizing Pneumonia
OP is a mixed densities disease. The classic presentation (60% to 80% of cases27) of the cryptogenic OP but also of other OP reactions (e.g., from pulmonary infection, connective tissue disease, drug toxicity) is characterized by unilateral or bilateral areas of patchy consolidation in which an air bronchogram is often recognizable166 (see Fig. 3-124). Areas of GGO attenuation (60%) with septal lines (40%) may coexist.27,146 Several variants of the classic presentation have been described for this protean disease, including multiple nodules (Fig. 3-144) that may cavitate; solitary focal lesions that may resemble a lung cancer; and a peripheral distribution of disease in the context of the secondary lobule, thereby mimicking a linear septal pattern (see Fig. 3-106). All are detailed in the excellent review by Oikonomou.166
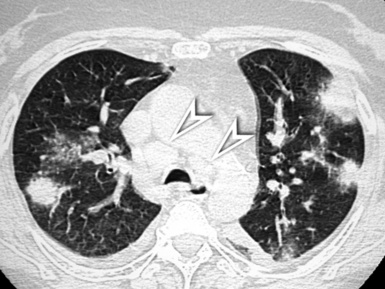
Figure 3-144 Organizing pneumonia presenting in nodular form. Note also the presence of mediastinal enlarged lymph nodes, especially in the paratracheal area (arrowheads). This is not the most typical aspect of this protean disease. The most frequent, mixed densities presentation is illustrated in Figure 3-124.
The consolidative lesions are often (60% to 80%) peripheral and/or centered on bronchial branches,27 with the latter being a striking feature in a number of cases (17%)167 (Fig. 3-145). Cryptogenic OP often involves the lower lung zones to a greater degree than the upper ones.27 When focal, the lesions are often located in the upper lobes and they may be cavitary, thus creating problems of differential diagnosis with lung cancer.168
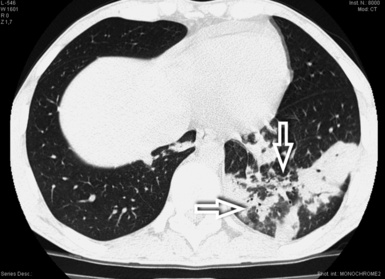
Figure 3-145 The consolidations of OP are often centered on the bronchial elements, as in the case shown (arrows).
The opacities of OP vary in size from a few centimeters to an entire lobe.168 Most patients respond to corticosteroid therapy (Fig. 3-146) or, in cases due to drug toxicity, to cessation of therapy. On occasion, the lesions may disappear spontaneously, only to reappear elsewhere (migrating disease).169
Pulmonary Alveolar Proteinosis
Pulmonary alveolar proteinosis is a GGO disease with crazy paving. The typical presentation of the disease (100% of cases) is dominated radiologically by crazy paving,103 often in the form of sharply marginated areas with a geographical distribution170 (Fig. 3-147). The extension of the pulmonary abnormalities is often impressive in comparison with the mild respiratory conditions of the patient. This clinicoradiologic discrepancy is considered quite typical of this disease.171
The areas of crazy paving are more often bilateral and symmetrical, sparing apices and costophrenic angles. Some central predominance has been suggested, but extensive or multifocal asymmetrical distributions without zonal preference are possible171 (Fig. 3-148).
The natural course of disease is an evolution of the opacities over a period of months or years171 (Fig. 3-149). Pleural effusion and cardiomegaly are absent.171
Cystic Pattern
Definition
A cystic pattern is present when multiple roundish, well-defined air-containing spaces (black holes) are variably scattered throughout the lung parenchyma (Fig. 3-150). These “holes in the lung” may be due to dilatation of the bronchial structures, abnormal distension of alveolar spaces, focal destruction of lung parenchyma, or even to cavitation of solid lesions.172,173
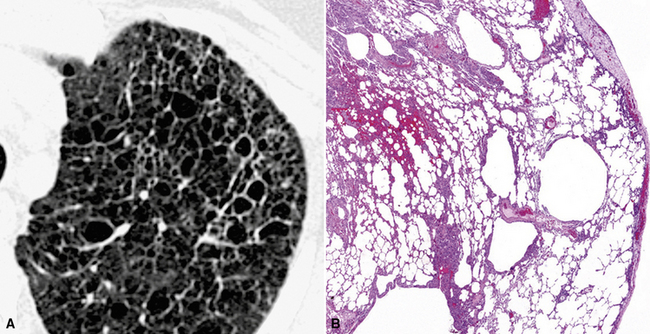
High-Resolution Computed Tomography Signs
The cysts appear as multiple “black holes” that may differ by morphologic features (walls, shape, and contents) and distribution. When present, the walls of the cysts appear as white encircling lines (Fig. 3-151) of a thickness depending on the constituent elements (e.g., cells, fibrosis) and on the phase of disease.152 Cysts without walls are usually the result of local destruction of lung parenchyma8 (Fig. 3-152; see also Fig. 3-151).
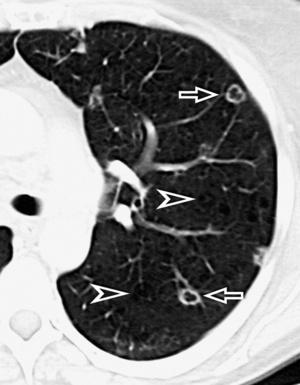
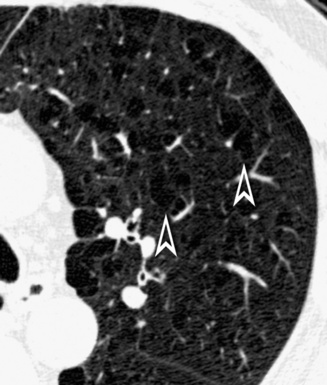
The shape of the cysts depends on the mechanism of their formation, on their relationships with each other, and on the concomitance of traction phenomena in the surrounding parenchyma.2 Cysts with regular shape, for example, are usually secondary to “check-valve” mechanisms with localized hyperinflation occurring in the context of a normal parenchyma (Fig. 3-153). Cysts with bizarre shape, in contrast, are often due to fusion of several single lesions and even incorporation of ectatic thick-walled bronchi for the presence of fibrotic phenomena with multifocal distortion2,8 (Fig. 3-154).
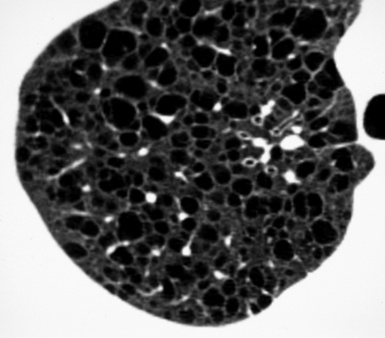
Figure 3-153 Cysts of a disease (LAM) surrounded by normal parenchyma. The lesions are roundish, homogeneously scattered throughout the lung, more or less regularly interspersed with vascular structures of adequate size, and their wall presents uniform thickness. Compare with Figure 3-154.
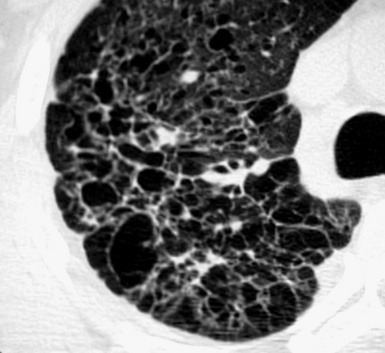
Figure 3-154 Cysts of a disease (PLCH) characterized by the phenomena of fibrosis with distortion and remodeling. The lesions are of variable size and shape, and their walls have an irregular thickness. It is difficult to recognize any normal lung parenchyma in between them. Compare with Figure 3-153.
The content of the cysts should be black because, by definition, it is pure air; however, when the cysts are due to destruction or necrosis of lung parenchyma, some remnants may persist within the blackness. For example, some cystic spaces may contain a small nodular opacity representing the centrilobular artery174 (see Fig. 3-152), and others may contain solid material due to their neoplastic nature or to a fungus ball growing inside their lumen. When infected, the cysts may contain air-fluid levels (Fig. 3-155).
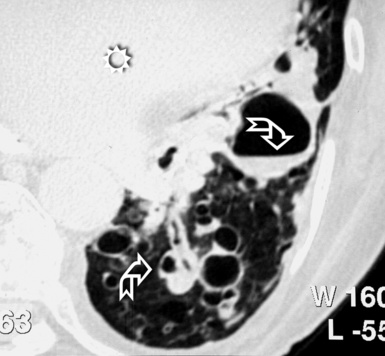
Finally, the distribution of the cysts within the lungs varies with the underlying disease, and this element is often useful in the diagnosis. In this regard, the usage of multiplanar reconstructions is particularly useful because it supplies a panoramic comprehensive assessment of the regional distribution of the lesions along different axes, and the use of the minIP technique reveals itself to be helpful for quantifying them.3
Honeycombing, the more distinguishing feature of some fibrosing diseases (IPF, CVD, chronic hypersensitivity pneumonitis, asbestosis, chronic drug toxicity), is also made of well-defined, pure air spaces separated by dense, thick, walls, but here the cysts are only an aspect of an entire fibrotic environment dominating the scene; consequently, honeycombing is discussed in the Fibrotic Pattern, subset Usual Interstitial Pneumonia. Disease in the Cystic Pattern are listed in Box 3-13.
Centrilobular Emphysema
In the early stage of disease, the cysts appear as tiny roundish black holes with invisible walls, and they are surrounded by normal lung parenchyma (Fig. 3-156). The lesions are homogeneously lucent. However, sometimes a central nodular or branching opacity representing the centrilobular artery is seen, and this finding may be helpful for distinguishing emphysema from other diffuse cystic diseases.175 When emphysema enlarges and involves the entire secondary lobule, remnants of vessels and septa may simulate the appearance of thin walls, usually incomplete.2
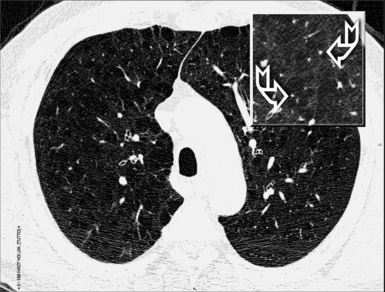
Typically, in centrilobular emphysema, the lesions involve predominantly the upper lobes and the superior segment of both lower lobes175 (Fig. 3-157). The distribution of the cysts in the affected regions is diffuse or patchy, and often the single lesions appear grouped in the centrilobular area and around the centrilobular artery (see Fig. 3-156). With more severe disease, the areas of destruction become confluent. CT documents a peripheral pruning of pulmonary vessels that are decreased in number, size, and arborization, closely mimicking the appearance of the panlobular emphysema176 (see Fig. 3-157).
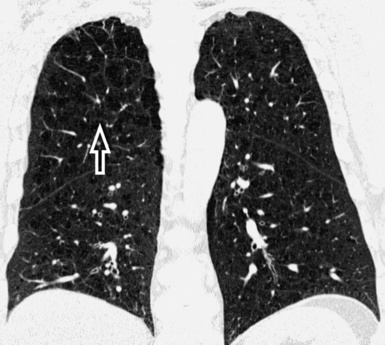
Paraseptal emphysema and bullae, bronchial and tracheal abnormalities, infections, pneumothorax, and pulmonary arterial hypertension are possible associated findings175,177,178 (Fig. 3-158). The pulmonary volume is increased due to overinflation.
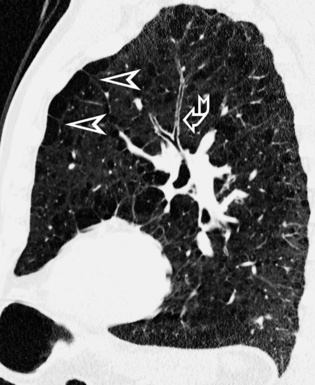
Langerhans Cell Histiocytosis
Thin-walled and thick-walled cysts with bizarre shapes (e.g., bilobed, cloverleaf) are typically seen in the late phase of disease. The presence of a distinct wall allows their differentiation from areas of emphysema, which can be also seen in some patients.76 The lesions, usually less than 10 mm in diameter, are due to coalescence of single cysts, ectatic bronchi, and surrounding paracicatricial emphysema179,180 (Fig. 3-159). Signs of architectural distortion may be seen in the intervening lung parenchyma.59
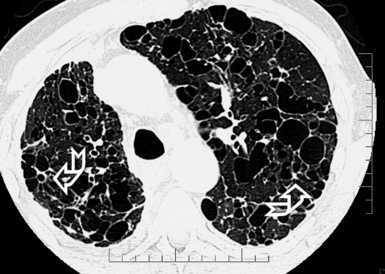
The distribution of the cysts may be diffuse or patchy in the axial plane, whereas in the craniocaudal directions they present a mid and upper lung zone predominance with relative sparing of the lung bases180 (Fig. 3-160).
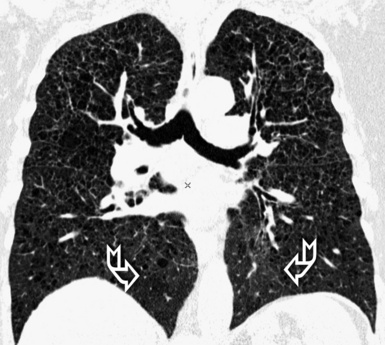
In the advanced stages of disease, the cystic pattern is the only abnormality visible in CT but in the early and intermediate stages, more or less numerous centrilobular dense, often cavitated nodules with shaggy margins are present (Fig. 3-161). In some patients, a progression from cavitated nodules to cystic lesions has been observed.180 Recurrent or bilateral pneumothorax occurs in up to 25% of patients over the course of their disease.181 Signs of other smoking-related interstitial lung diseases (respiratory bronchiolitis, emphysema) may coexist, creating mixed patterns.77
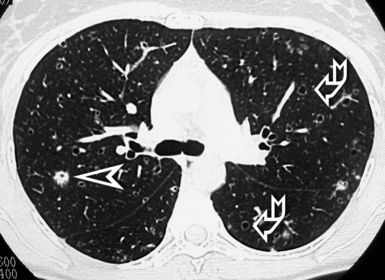
Laryngotracheobronchial Papillomatosis
Laryngotracheobronchial papillomatosis is a viral infection that usually affects the upper airways but that may rarely spread along the airways disseminating to the lung parenchyma. The most common CT findings are intratracheal polypoid lesions, resulting in focal or diffuse narrowing of the trachea and pulmonary multilobulated nodules, many of which are cavitated182 (Fig. 3-162). The cavitated lesions may have thin or thick walls with irregularly nodular inner walls. Air-fluid levels inside the cysts are not uncommon, and they are secondary to infection.
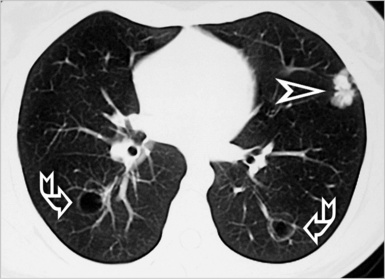
Some reports emphasize the possibility of a predominant lower lobe distribution, but the involvement of the upper lobes is not uncommon183 (Fig. 3-163).
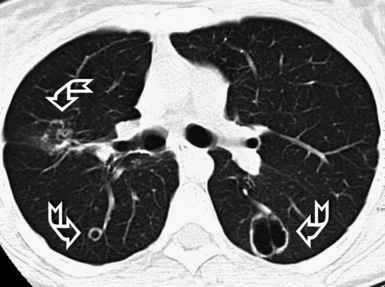
Figure 3-163 Axial scan of the same patient as in Figure 3-162, but at a higher level (carina). Multiple cystic lesions are documented also (curved arrows); the one to the left is bilobed.
At the central airways level, CT shows multiple small nodules projecting into the airway lumen (Fig. 3-164) or a diffuse nodular thickening of the airway walls. Findings related to the airways obstruction are infections, atelectasis, air-trapping phenomena, and bronchiectasis.182 There is also a risk of malignant transformation of the pulmonary lesions.184
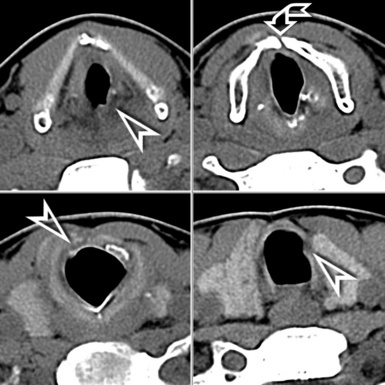
Lymphangioleiomyomatosis
The cysts of lymphangioleiomyomatosis are multiple, round, and relatively uniform in size and shape, and they have homogenously thin walls185 (Fig. 3-165). Typically, the size of the cysts ranges from 0.5 to 2 cm in diameter and tends to increase with the progression of the disease. In patients with mild disease, 25% to 80% of the lung parenchyma are replaced by cysts, characteristically surrounded by normal lung186 (see Fig. 3-165).
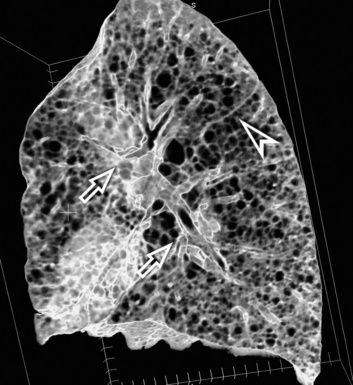
The cysts are uniformly and symmetrically distributed throughout the lungs, equally affecting the upper-lower and the central-peripheral lung parenchyma185,187 (Fig. 3-166).
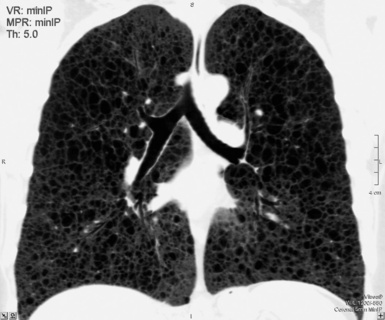
Figure 3-166 Minimum intensity projection (minIP) in a coronal view of the same patient as in Figure 3-165. The minIP technique enhances the visibility of the lesions that are scattered quite uniformly all through the lungs.
In patients with advanced disease, the parenchyma are completely replaced by cysts, and the pulmonary volume is increased (Fig. 3-167). Possible areas of GGO may result from edema or hemorrhage; pulmonary hemorrhage occurs in 8% to 14% of women with lymphangioleiomyomatosis.187 The incidence of pneumothorax in lymphangioleiomyomatosis is high (40%) due to the thin wall of the cysts and their proximity with the pleural surface. Pleural effusion may also be seen, and other associated abnormalities, including mediastinal or retrocrural lymph node enlargement (40%) just as often.185,186
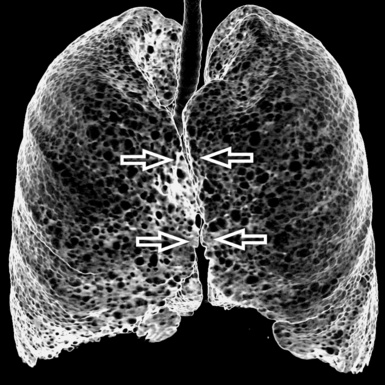
Cystic Metastases
Although rare (4%), pulmonary metastases may present with a cystic pattern. Most of the lesions are roundish, of variable size, and often have irregularly thickened walls with septations (Fig. 3-168).90 However, thin-walled cysts with smooth walls may be also observed, particularly after chemotherapy.188 On the contrary, metastases from angiosarcoma may have an external halo of ground glass attenuation (30%) and an internal air-fluid level, both due to hemorrhage.188,189
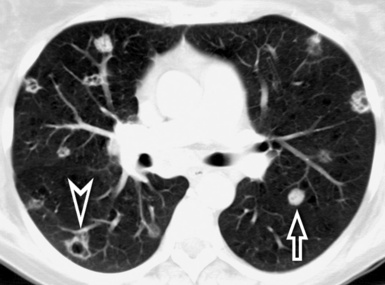
The lesions occur in a random distribution, often showing a “feeding vessel” sign (Fig. 3-169). Most pulmonary metastases are located in the basal and peripheral zones.90
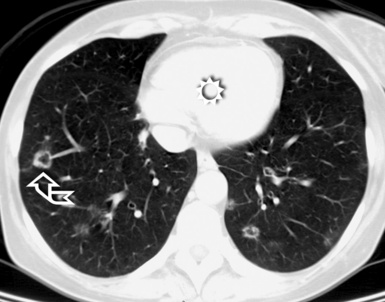
Figure 3-169 Axial scan of the same patient as in Figure 3-168, but at a lower level. The heart is indicated by the symbol of the sun (sun). One of the cystic metastases to the right (curved arrow) seems connected to an artery (“feeding vessel” sign).
Hemothorax and pneumomediastinum are rare associated conditions.189 An uncommon complication is the occurrence of a pneumothorax due to ruptured subpleural cavities into the pleural space. Enlarged hilar and mediastinal lymph nodes may be also present (Fig. 3-170).
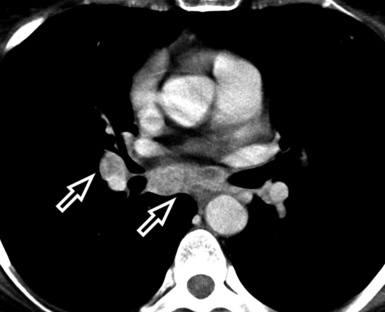
Birt-Hogg-Dubé Syndrome
Birt-Hogg-Dubé syndrome190 is a rare, inheritable, multisystem disorder (autosomal dominant) characterized by skin lesions, renal tumors, and multifocal pulmonary cysts. Radiologically, multiple thin-walled cysts round to oval in shape, ranging widely in size (a few millimeters to several centimeters) have been reported191,192 (Fig. 3-171). The cysts are not numerous; in a paper on 12 patients, the mean extent score was 13% of the whole lung.193
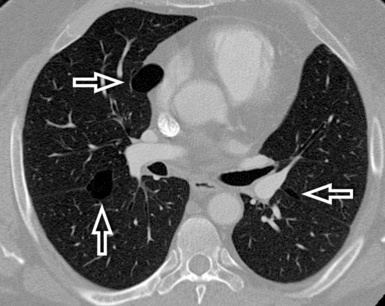
The cysts are variably distributed but tend to predominate in the middle and lower lung191; characteristically, they are located along the pleural margins in 40% of patients193 (Fig. 3-172). Cysts abutting or including the proximal portion of the lower pulmonary arteries and veins have been also described.193
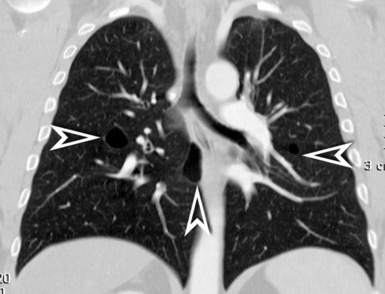
Figure 3-172 Frontal view of the same patient as in Figure 3-171. The scan nicely shows the relationship of the cysts with the pleural boundaries. The contact with them is indicated by the arrowheads.
(Courtesy of Angelo Carloni, MD, Terni, Italy.)
The lung looks normal in between the cysts (Fig. 3-173). Birt-Hogg-Dubé syndrome can be associated with recurrent spontaneous pneumothoraces.194
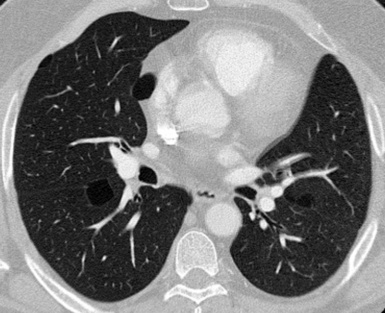
Dark Lung Pattern
Definition
A dark lung pattern is present when variable portions of lung parenchyma present a reduced attenuation to the x-rays, then are darker than normal (Fig. 3-174). In a lung image, the peak of gray of the background is determined by the relative amount of air and non-air components per volume unit: the more air (i.e., from obstructive emphysema) and/or the less “non-air” (i.e., from hampered vascular filling or from hypoxic vasoconstriction) components, the darker the background.2
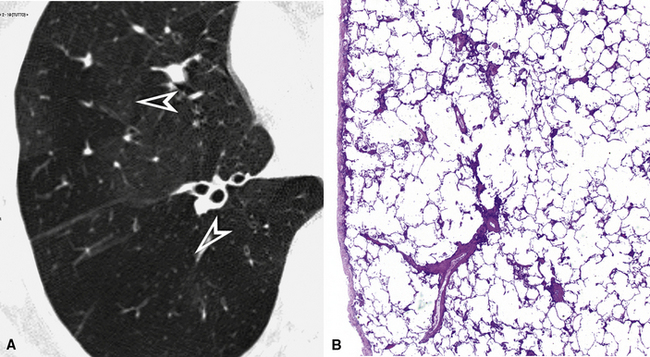
High-Resolution Computed Tomography Signs
Patchy or diffuse, the dark lung appears more black than normal and is associated with a simplification of the vascular tree (see Fig. 3-174A); when patchy, the aspect is also called mosaic perfusion (Fig. 3-175).
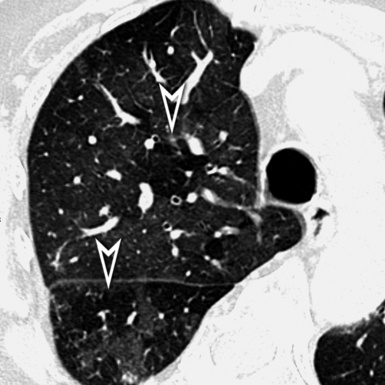
The extent of the dark areas varies, from a lobular size to an entire lung, depending on the severity of the disease.195 In patients with mosaic perfusion secondary to airway diseases, hyperlucent areas of lobular size are common, usually with well-defined margins (see Fig. 3-175). In patients with vascular diseases, on the contrary, the areas of low attenuation are often larger and poorly defined.2
The vessels inside the areas of decreased attenuation are smaller and less numerous than the companion vessels in the unaffected regions where, by contrast, they may be enlarged (see Fig. 3-175). The appearance of heterogeneous lung attenuation may be simulated by areas of GGO interspersed with patches of normal lung; however, in the latter case, the size of the vessels within different areas should be equal. Vessels and bronchi within the involved regions do not show distortion unless some pulmonary derangement exists.7,196
The differentiation between vascular or bronchial origin of a dark lung is achieved by repeating a number of CT expiratory scans. Normally, in an expiratory scan, the overall density of the lung increases homogenously. In the dark lung of vascular origin, a homogeneous increase in density occurs everywhere so that the contrast between areas of different attenuation is maintained. On the contrary, when the dark lung is due to airway stenosis, the contrast increases (air trapping)197 (Fig. 3-176).
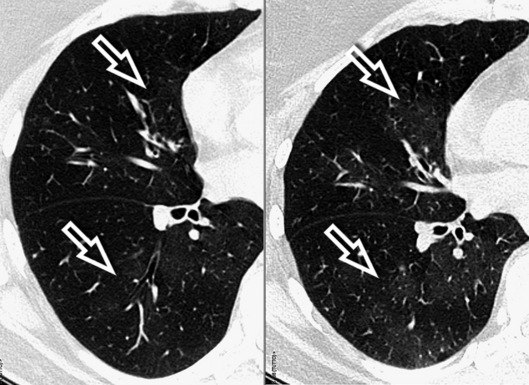
Some patients with dark lung pattern show smooth thickening of bronchial walls (Fig. 3-177) and occasionally central and peripheral cylindrical or cystic bronchiectasis. Rarely, centrilobular branching linear densities and centrilobular nodules may be also be apparent.197 Diseases in the Dark Lung Pattern are listed in Box 3-14.
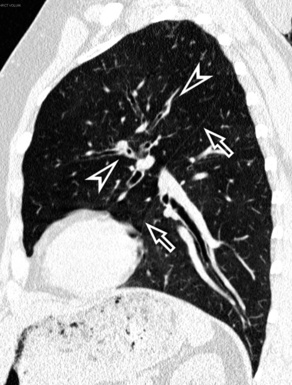
Chronic Pulmonary Thromboembolism
The most characteristic feature of chronic pulmonary thromboembolism is a mosaic perfusion that does not accentuate with expiratory scans (there is no air trapping). The low attenuation areas may be due both to hypoperfusion distal to occluded vessels and to peripheral vasculopathy. The areas of increased attenuation have been related to redistribution of blood flow toward the remaining patent vascular bed,198 and indeed, in these areas, the vessels are larger and often tortuous (Fig. 3-178). Scars from prior pulmonary infarctions are often found in the lower lobes, and pleural thickening from previous pleural effusion is not uncommon.199
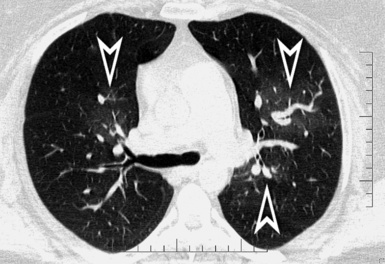
The areas of low attenuation are usually wide (larger than lobules) with ill-defined margins198 (Fig. 3-179).
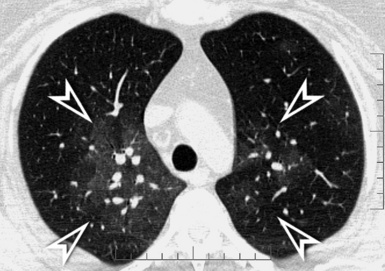
The direct signs of chronic thromboembolism are often visible at the level of the central vessels; these include partial arterial obstruction with mural thrombi (Fig. 3-180), intraluminal bands and webs, calcifications within chronic thrombi, and signs of pulmonary arterial hypertension (dilatation of the central pulmonary arteries secondary to the obstructed vascular lung bed, right ventricular enlargement and hypertrophy, tortuous arteries at the pulmonary level198) (see Fig. 3-178). In some cases, a collateral systemic blood supply may be evident with abnormal dilatation and tortuosity of the bronchial, phrenic, intercostal and internal mammary arteries. Such systemic perfusion of the peripheral pulmonary arterial bed may account for the presence of focal areas of ground glass attenuation within the lung.200 Patients with severe pulmonary hypertension may also show a mild pericardial thickening or a small pericardial effusion.
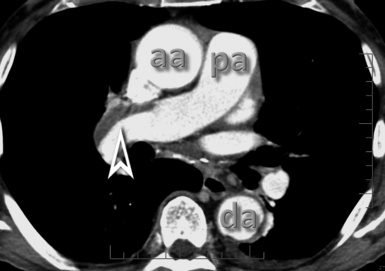
Diffuse Idiopathic Pulmonary Neuroendocrine Cell Hyperplasia
The narrowing of the bronchiolar lumen due to the neuroendocrine cellular hyperplasia and fibrosis201 is not directly visible with HRCT, but it can show up indirectly as mosaic perfusion (Fig. 3-181) with air trapping.202 Small, well-defined, randomly distributed nodules less than 5 mm in diameter may be also identified in the CT images, especially when obtained with multislice volumetric equipment. The nodules correspond to the neuroendocrine “tumorlets” present histologically (see Fig. 3-181).203
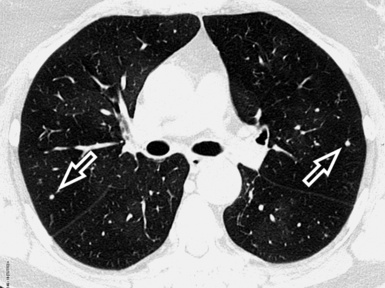
Usually, both hyperlucent dark lung and nodules are randomly distributed throughout both lungs. However, at times, the coronal MIP images may show a prevalence of the nodules in the lower zones203,204 (Fig. 3-182).
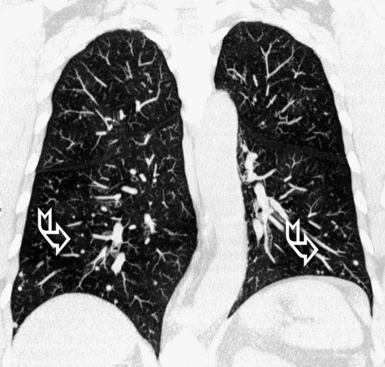
Figure 3-182 Maximum intensity projection (MIP) in a coronal view of the same patient as in Figure 3-181. The MIP technique highlights the visibility of the small nodules that are more numerous at the basal level, in the area indicated by the curved arrows.
Round lesions of more than 5 mm in diameter may suggest the existence of carcinoid tumors (grade 1 neuroendocrine carcinomas) (Fig. 3-183). Some patients may also show bronchial wall thickening and cylindrical bronchiectasis.204
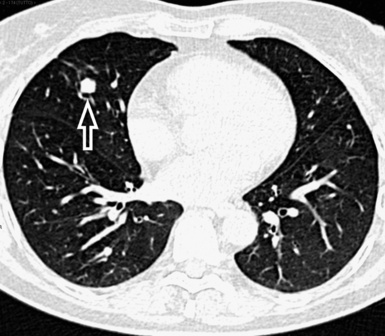
Constrictive Bronchiolitis (Bronchiolitis Obliterans)
The blood vessels in the low attenuation areas are smaller and less numerous than vessels in the areas of relatively high attenuation67,69 (Fig. 3-184). The dark lung often presents sharply defined margins and lobular or segmental extension. Air trapping on expiratory scans appears as an accentuated contrast between differently attenuating areas and may be helpful for the early detection and confirmation of the bronchial origin of the oligemia, particularly after lung transplantation.197
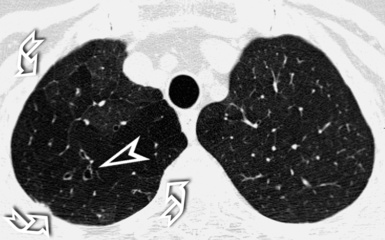
The disease is diffuse and bilateral, with more common and extensive involvement of the lower lobes68 (Fig. 3-185). Some patients with constrictive bronchiolitis show also central and peripheral cylindrical bronchiectasis (Fig. 3-186). The cause of the bronchiectasis associated with bronchiolitis obliterans remains unclear, but it seems most likely due to concomitant injury of the large airways.205,206 Rarely, centrilobular nodules or branching linear densities can also be observed.205
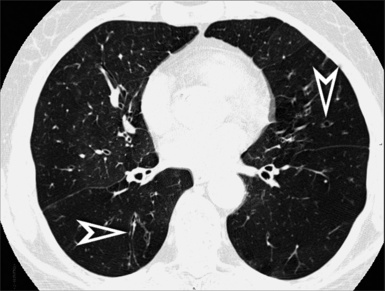
Figure 3-185 Axial scan of the same patient as in Figure 3-184, but at a lower level. Extensive geographic areas of low attenuation are present (in particular to the left), interspersed with less frequent areas of relatively increased opacity. Evidence of mild bronchiectasis is present in the right lower lobe and in the lingula (arrowheads).
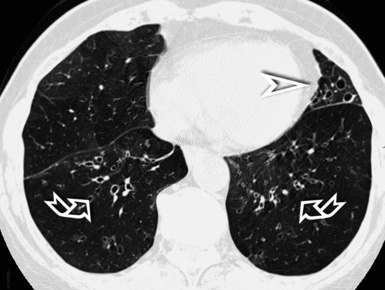
Panlobular Emphysema
Panlobular emphysema is characterized anatomically by a uniform destruction of the pulmonary lobule, and it appears radiologically as extensive areas of dark lung associated with a diffuse “simplification” of the pulmonary architecture (Fig. 3-187). The vessels appear reduced in number and size, at times as if they were stretched and rigid inside the darkness.8 This is the pattern of emphysema seen in patients with alpha-1-antiprotease deficiency,175 and it may be indistinguishable from the appearance of severe constrictive bronchiolitis.20
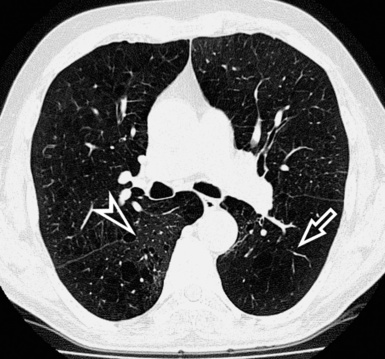
Panlobular emphysema is generalized within the lungs, but it can be more severe in the lower lobes175 (Fig. 3-188).
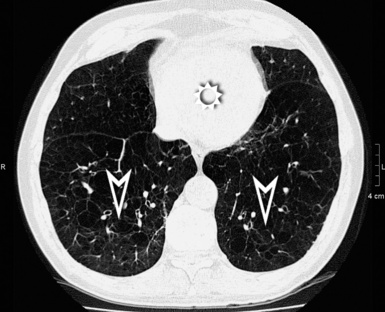
Figure 3-188 Axial scan of the same patient as in Figure 3-187 at the axial level of the heart (sun). The hyperlucent transformation of the lung is more extended and more severe at this basal level, where there is only little relatively normal surviving parenchyma posteriorly (arrowheads).
In approximately 40% of patients with alpha-1-antiprotease deficiency, bronchiectasis is present due to destruction of the elastic lamina207 (Fig. 3-189). Associated paraseptal emphysema and bullae are relatively uncommon.
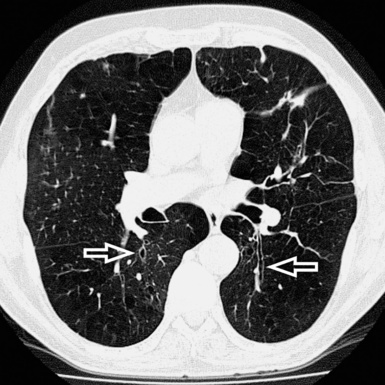
Swyer-James (MacLeod Syndrome)
Swyer-James syndrome is a peculiar postinfectious constrictive bronchiolitis that affects the lung asymmetrically208 (Fig. 3-190). Consequently, the CT hallmark of this syndrome is a dark pattern that can be unilateral and even limited to one lobe. An associated decreased vascularity in the affected areas and air trapping during expiration are the rule.68
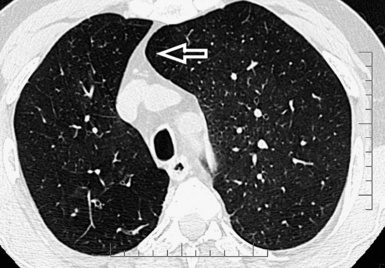
For decades, based on chest radiographs, authorities have believed that the damage had to be unilateral, but the advent of CT has made it increasingly clear that bilateral involvement is a rule rather than an exception.208 However, a predominant involvement of one lung and even of one lobe is very frequent209 (Fig. 3-191).
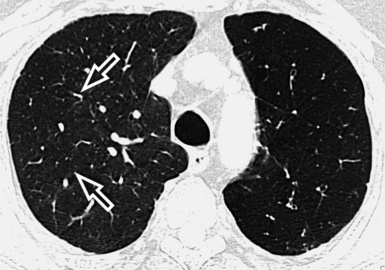
Ectatic bronchi with thickened walls are often present, sometimes severely209 (Fig. 3-192).
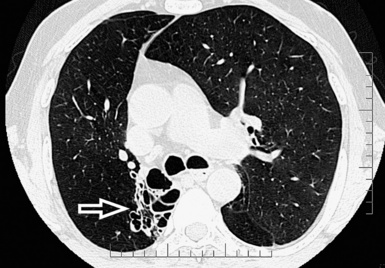
Imaging of the Solitary Pulmonary Nodule
Rationale for the Diagnostic Approach
Most of the elements summarized in the subsequent text and references have been derived from the excellent review of Truong and colleagues.210 The interested reader is encouraged to refer to the original paper for further details.
Static Elements
Risk Factors
A given patient’s likelihood of having a pulmonary malignancy increases with older age; current or past smoking habits; extrathoracic cancer more than 5 years before nodule detection211; exposure to asbestos, uranium, or radon; occurrence of symptoms210 (in particular hemoptysis212); and a family history of lung cancer.213 These risk factors do not enter in the radiologic evaluation of the nodule per se, but they represent key elements to match with the radiologic data in the final diagnostic algorithm. The differential diagnosis of SPNs is presented in Box 3-15.
Morphologic Aspects
The risk of malignancy is increased when the nodule has ill-defined margins and lobulated or spiculated contours. In particular, spiculation with the so-called sunburst aspect (corona radiata) has a 90% predictive value of malignancy214 (Fig. 3-193). Unfortunately, this does not mean that a well-marginated SPN with regular contours cannot be malignant, and on the contrary one of five malignancies has these characteristics.212 Also, size correlates with malignancy. An incidentally discovered SPN with a diameter less than 4 mm has a less than 1% chance of being a primary lung cancer, but if the diameter is in the 8-mm range, the probability is approximately 10% to 20%.215–217
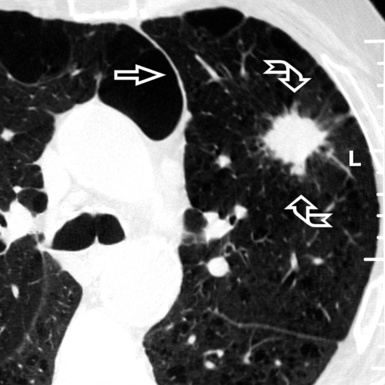
Computed Tomography Densitometry
Fat densities inside the nodule (Fig. 3-194) are typical of hamartoma (50%),218 but metastases from liposarcoma and renal carcinoma also may have fatty components.219 Central, laminated, or popcorn calcifications inside the nodule are usually benign, but lung metastases from chondrosarcoma or osteosarcoma may present similar aspects.90
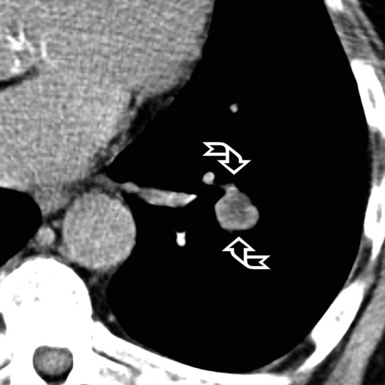
An SPN may be uniformly dense (solid) or contain ground glass components (subsolid). For solid nodules, the chance of malignancy is 7%, but for subsolid nodules, this percentage rises to 34%.220 However, when the density is mixed (solid + GGO), this percentage rises to 63%, whereas for pure GGO lesions (Fig. 3-195) the rate of malignancy is “only” 18%. In a large series, 20% of the lesions detected during a CT screening program represented subsolid densities.220 A halo of GGO around a nodule (halo sign) may be due to hemorrhage, inflammation, or tumoral infiltration. This sign is not specific, and it may be found also in benign conditions (e.g., nodular OP).210
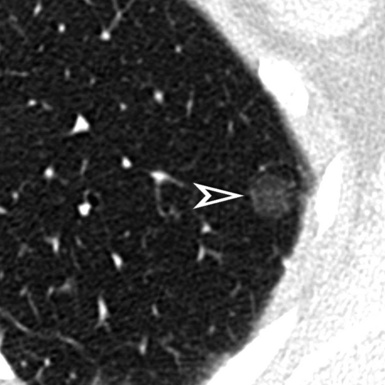
Cavitation and Air Bronchogram
Cavitation may be benign or malignant; however, cavitation of malignant lesions tends to have more irregular and thicker walls than benign ones.221 It has been reported that 95% of cavitary lesions with wall thickness greater than 15 mm are malignant.222 Up to 15% of primary lung malignancies, in particular squamous cell carcinomas, cavitate.210
An air bronchogram is not present in the solid lesions, but it is possible inside the nodules of GGO (Fig. 3-196). It may also be seen in bronchioloalveolar carcinoma and pulmonary lymphoma, as well as in some benign lesions.
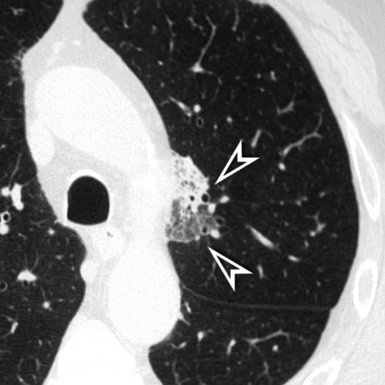
Dynamic Elements
Doubling Time
The doubling time is the time taken by a lesion to double its volume. The basic assumption is that, except for the infectious and inflammatory lesions, the faster the growth, the greater the chance a nodule is malignant. Indeed, the doubling time of a solid malignant nodule is in the range of 1 to 13 months, whereas that of a benign lesion tends to be shorter or longer.210 The subsolid lesions, on the contrary, are another story. Approximately 20% of well-differentiated adenocarcinomas have a doubling time greater than 2 years,223 and some bronchioloalveolar carcinomas may show a doubling time even greater than 3.5 years.224
In summary, the old adage that “a nodule should be considered benign if unvaried after two years” is still acceptable now,210,225,226 but it is suitable only for solid lesions. Note that the recommendations of the literature refer to the volume of a nodule. However, more often in practice, the measures are done on two-dimensional images using diameter so the volume should be corrected accordingly (to double its volume, a nodule should increase its diameter by about 25%).227
The timing of the follow-up of a nodule incidentally discovered on CT depends on the priori probability of malignancy (risk factors), size, and density. The appropriate timing has been recently recommended in detail in a statement from the Fleischner Society.228
Computed Tomography Contrast Enhancement
The radiologic density of a nodule increases after administration of contrast medium; this is called contrast enhancement, and it depends on the lesion’s vascularity. From the diagnostic point of view, the assumption is that the greater the contrast enhancement, the greater the probability of a nodule’s being malignant. In fact, malignancies have contrast enhancements of 20 HU or more and benign lesions less than 15 HU. Again, these data are suitable only for relatively homogeneous solid nodules measuring between 5 mm and 3 cm in diameter, where the negative predictive value for malignancy of a contrast enhancement less than 15 HU is 96%.229
Positron Emission Tomography Metabolism
Typically, the metabolism of glucose is increased in malignancies, and this peculiarity is exploited with a technique of nuclear medicine known as PET (Fig. 3-197). For lung nodules, an SUVmax cutoff of FDG of 2.5 is used as the discriminating level between benign and malignant.230 Unfortunately, PET is most efficient only for solid lesions with a diameter greater than 10 mm, where the sensitivity and specificity of the technique for detection of malignancy are about 90%.231 On the contrary, a well-differentiated adenocarcinoma that shows a GGO appearance in CT is (falsely) negative in nine of ten cases, and a benign nodule that shows a GGO appearance in CT is (falsely) positive in four of five cases.232
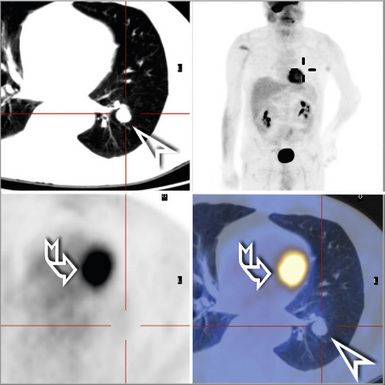
Figure 3-197 Same patient as in Figure 3-194. Here a computed tomography image is shown together with the results of a PET examination where the nodule (arrowhead) does not appear to concentrate the fluoro-2-deoxy-D-glucose. The cardiac uptake is indicated by a curved arrow.
The SUV has to be considered in connection with the pretest likelihood of malignancy. For example, a negative PET reduces the likelihood of malignancy to 1% in an individual with a pretest likelihood of 20% but only to 14% in one with a pretest likelihood of 80%.210
1 Naidich D.P., Muller N.L., Krinsky G.A., et al. Computed Tomography and Magnetic Resonance of the Thorax, 4th ed. Philadelphia: Lippincott Williams & Wilkins, 2007.
2 Webb W.R., Müller N.L., Naidich D.P. High-Resolution CT of the Lung, 4th ed. Philadelphia: Wolters Kluwer Health/Lippincott Williams & Wilkins, 2009.
3 Beigelman-Aubry C., Hill C., Guibal A., et al. Multi-detector row CT and postprocessing techniques in the assessment of diffuse lung disease. Radiographics. 2005;25(6):1639-1652.
4 Aberle D.R., Gamsu G., Ray C.S., et al. Asbestos-related pleural and parenchymal fibrosis: detection with high-resolution CT. Radiology. 1988;166(3):729-734.
5 Flaherty K.R., King T.E.Jr, Raghu G., et al. Idiopathic interstitial pneumonia: what is the effect of a multidisciplinary approach to diagnosis? Am J Respir Crit Care Med. 2004;170(8):904-910. [Epub July 15, 2004]
6 Webb W.R. Thin-section CT of the secondary pulmonary lobule: anatomy and the image–the 2004 Fleischner lecture. Radiology. 2006;239(2):322-338.
7 Maffessanti M., Dalpiaz G. Diffuse Lung Diseases: Clinical Features, Pathology, HRCT. New York: Springer, 2006.
8 Gotway M.B., Reddy G.P., Webb W.R., et al. High-resolution CT of the lung: patterns of disease and differential diagnoses. Radiol Clin North Am. 2005;43:513-542.
9 Gluecker T., Capasso P., Schnyder P., et al. Clinical and radiologic features of pulmonary edema. Radiographics. 1999;19(6):1507-1531.
10 Storto M.L., Kee S.T., Golden J.A., et al. Hydrostatic pulmonary edema: high-resolution CT findings. AJR Am J Roentgenol. 1995;165(4):817-820.
11 Chabbert V., Canevet G., Baixas C., et al. Mediastinal lymphadenopathy in congestive heart failure: a sequential CT evaluation with clinical and echocardiographic correlations. Eur Radiol. 2004;14(5):881-889.
12 Munk P.L., Müller N.L., Miller R.R., et al. Pulmonary lymphangitic carcinomatosis: CT and pathologic findings. Radiology. 1988;166(3):705-709.
13 Johkoh T., Ikezoe J., Tomiyama N., et al. CT findings in lymphangitic carcinomatosis of the lung: correlation with histologic findings and pulmonary function tests. AJR Am J Roentgenol. 1992;158(6):1217-1222.
14 Frazier A.A., Franks T.J., Mohammed T.L., et al. From the archives of the AFIP: pulmonary veno-occlusive disease and pulmonary capillary hemangiomatosis. Radiographics. 2007;27(3):867-882.
15 Mandel J., Mark E.J., Hales C.A. Pulmonary veno-occlusive disease. Am J Respir Crit Care Med. 2000;162(5):1964-1973.
16 Montani D., Kemp K., Dorfmuller P., et al. Idiopathic pulmonary arterial hypertension and pulmonary veno-occlusive disease: similarities and differences. Semin Respir Crit Care Med. 2009;30(4):411-420.
17 Wittenberg K.H., Swensen S.J., Myers J.L. Pulmonary involvement with Erdheim-Chester disease: radiographic and CT findings. AJR Am J Roentgenol. 2000;174(5):1327-1331.
18 Chung J.H., Park M.S., Shin D.H., et al. Pulmonary involvement in Erdheim-Chester disease. Respirology. 2005;10(3):389-392.
19 Dion E., Graef C., Haroche J., et al. Imaging of thoracoabdominal involvement in Erdheim-Chester disease. AJR Am J Roentgenol. 2004;183(5):1253-1260.
20 Hansell D.M., Bankier A.A., MacMahon H., et al. Fleischner Society: glossary of terms for thoracic imaging. Radiology. 2008;246(3):697-722.
21 Ren H., Hruban R.H., Kuhlman J.E., et al. Computed tomography of inflation-fixed lungs: the beaded septum sign of pulmonary metastases. J Comput Assist Tomogr. 1989;13:411-416.
22 Chung M.J., Lee K.S., Franquet T., et al. Metabolic lung disease: imaging and histopathologic findings. Eur J Radiol. 2005;54(2):233-245.
23 Graham C.M., Stern E.J., Finkbeiner W.E., et al. High-resolution CT appearance of diffuse alveolar septal amyloidosis. AJR Am J Roentgenol. 1992;158(2):265-267.
24 Marchiori E., Franquet T., Gasparetto T.D., et al. Consolidation with diffuse or focal high attenuation computed tomography findings. J Thorac Imaging. 2008;23:298-304.
25 Marchiori E., Souza A.S.Jr, Franquet T., et al. Diffuse high-attenuation pulmonary abnormalities: a pattern-oriented diagnostic approach on high-resolution CT. AJR Am J Roentgenol. 2005;184(1):273-282.
26 Remy-Jardin M., Giraud F., Remy J., et al. Importance of ground-glass attenuation in chronic diffuse infiltrative lung disease: pathologic-CT correlation. Radiology. 1993;189(3):693-698.
27 Silva C.I., Müller N.L. Idiopathic interstitial pneumonias. J Thorac Imaging. 2009;24(4):260-273.
28 Nishimura K., Kitaichi M., Izumi T., et al. Usual interstitial pneumonia: histologic correlation with high-resolution CT. Radiology. 1992;182(2):337-342.
29 American Thoracic Society, European Respiratory Society. American Thoracic Society/European Respiratory Society International Multidisciplinary Consensus Classification of the Idiopathic Interstitial Pneumonias. Am J Respir Crit Care Med. 2002;165(2):277-304.
30 Silva C.I., Müller N.L., Neder J.A., et al. Asbestos-related disease: progression of parenchymal abnormalities on high-resolution CT. J Thorac Imaging. 2008;23(4):251-257.
31 Akira M., Yamamoto S., Inoue Y., et al. High-resolution CT of asbestosis and idiopathic pulmonary fibrosis. AJR Am J Roentgenol. 2003;181(1):163-169.
32 Akira M., Yamamoto S., Yokoyama K., et al. Asbestosis: high-resolution CT-pathologic correlation. Radiology. 1990;176(2):389-394.
33 Gevenois P.A., de Maertelaer V., Madani A., et al. Asbestosis, pleural plaques and diffuse pleural thickening: three distinct benign responses to asbestos exposure. Eur Respir J. 1998;11(5):1021-1027.
34 Silva C.I., Müller N.L., Lynch D.A., et al. Chronic hypersensitivity pneumonitis: differentiation from idiopathic pulmonary fibrosis and nonspecific interstitial pneumonia by using thin-section CT. Radiology. 2008;246(1):288-297.
35 Hirschmann J.V., Pipavath S.N., Godwin J.D. Hypersensitivity pneumonitis: a historical, clinical, and radiologic review. Radiographics. 2009;29(7):1921-1938.
36 Sverzellati N., De Filippo M., Bartalena T., et al. High-resolution computed tomography in the diagnosis and follow-up of idiopathic pulmonary fibrosis. Radiol Med. January 15, 2010. [Epub ahead of print]
37 Elliot T.L., Lynch D.A., Newell J.D.Jr, et al. High-resolution computed tomography features of nonspecific interstitial pneumonia and usual interstitial pneumonia. J Comput Assist Tomogr. 2005;29(3):339-345.
38 Hunninghake G.W., Lynch D.A., Galvin J.R., et al. Radiologic findings are strongly associated with a pathologic diagnosis of usual interstitial pneumonia. Chest. 2003;124(4):1215-1223.
39 Sverzellati N., Wells A.U., Tomassetti S., et al. Biopsy-proved idiopathic pulmonary fibrosis: spectrum of nondiagnostic thin-section CT diagnoses. Radiology. 2010;254(3):957-964.
40 Akira M., Inoue Y., Kitaichi M., et al. Usual interstitial pneumonia and nonspecific interstitial pneumonia with and without concurrent emphysema: thin-section CT findings. Radiology. 2009;251(1):271-279. [Epub February 12, 2009]
41 Souza C.A., Müller N.L., Lee K.S., et al. Idiopathic interstitial pneumonias: prevalence of mediastinal lymph node enlargement in 206 patients. AJR Am J Roentgenol. 2006;186(4):995-999.
42 Kim T.S., Han J., Chung M.P., et al. Disseminated dendriform pulmonary ossification associated with usual interstitial pneumonia: incidence and thin-section CT-pathologic correlation. Eur Radiol. 2005;15(8):1581-1585. [Epub April 23, 2005]
43 Kishi K., Homma S., Kurosaki A., et al. High-resolution computed tomography findings of lung cancer associated with idiopathic pulmonary fibrosis. J Comput Assist Tomogr. 2006;30(1):95-99.
44 Kim E.A., Lee K.S., Johkoh T., et al. Interstitial lung diseases associated with collagen vascular diseases: radiologic and histopathologic findings. Radiographics. 2002;22(spec no):S151-S165.
45 Mellot F., Scherrer A. Imaging features of drug-induced lung diseases. J Radiol. 2005;86(5 pt 2):550-557. [in French]
46 Mayberry J.P., Primack S.L., Müller N.L. Thoracic manifestations of systemic autoimmune diseases: radiographic and high-resolution CT findings. Radiographics. 2000;20(6):1623-1635.
47 Desai S.R., Veeraraghavan S., Hansell D.M., et al. CT features of lung disease in patients with systemic sclerosis: comparison with idiopathic pulmonary fibrosis and nonspecific interstitial pneumonia. Radiology. 2004;232(2):560-567.
48 Tanaka N., Newell J.D., Brown K.K., et al. Collagen vascular disease-related lung disease: high-resolution computed tomography findings based on the pathologic classification. J Comput Assist Tomogr. 2004;28(3):351-360.
49 Kligerman S.J., Groshong S., Brown K.K., et al. Nonspecific interstitial pneumonia: radiologic, clinical, and pathologic considerations. Radiographics. 2009;29(1):73-87.
50 Johkoh T., Müller N.L., Colby T.V., et al. Nonspecific interstitial pneumonia: correlation between thin-section CT findings and pathologic subgroups in 55 patients. Radiology. 2002;225(1):199-204.
51 Travis W.D., Hunninghake G., King T.E.Jr, et al. Idiopathic nonspecific interstitial pneumonia: report of an American Thoracic Society project. Am J Respir Crit Care Med. 2008;177(12):1338-1347.
52 Silva C.I., Müller N.L., Hansell D.M., et al. Nonspecific interstitial pneumonia and idiopathic pulmonary fibrosis: changes in pattern and distribution of disease over time. Radiology. 2008;247(1):251-259.
53 Erasmus J.J., McAdams H.P., Rossi S.E. High-resolution CT of drug-induced lung disease. Radiol Clin North Am. 2002;40(1):61-72.
54 Rossi S.E., Erasmus J.J., McAdams H.P., et al. Pulmonary drug toxicity: radiologic and pathologic manifestations. Radiographics. 2000;20(5):1245-1259.
55 Abehsera M., Valeyre D., Grenier P., et al. Sarcoidosis with pulmonary fibrosis: CT patterns and correlation with pulmonary function. AJR Am J Roentgenol. 2000;174(6):1751-1757.
56 Hoang D.Q., Nguyen E.T. Sarcoidosis. Semin Roentgenol. 2010;45(1):36-42.
57 Padley S.P., Padhani A.R., Nicholson A., et al. Pulmonary sarcoidosis mimicking cryptogenic fibrosing alveolitis on CT. Clin Radiol. 1996;51(11):807-810.
58 Nishino M., Lee K.S., Itoh H., et al. The spectrum of pulmonary sarcoidosis: variations of high-resolution CT findings and clues for specific diagnosis. Eur J Radiol. 2010;73(1):66-73.
59 Abbott G.F., Rosado-de-Christenson M.L., Franks T.J., et al. From the archives of the AFIP: pulmonary Langerhans cell histiocytosis. Radiographics. 2004;24(3):821-841.
60 Churg A., Myers J., Suarez T., et al. Airway-centered interstitial fibrosis: a distinct form of aggressive diffuse lung disease. Am J Surg Pathol. 2004;28(1):62-68.
61 Gruden J.F., Webb W.R., Naidich D.P., et al. Multinodular disease: anatomic localization at thin-section CT—multireader evaluation of a simple algorithm. Radiology. 1999;210(3):711-720.
62 Remy-Jardin M., Beuscart R., Sault M.C., et al. Subpleural micronodules in diffuse infiltrative lung diseases: evaluation with thin-section CT scans. Radiology. 1990;177(1):133-139.
63 Parrón M., Torres I., Pardo M., et al. The halo sign in computed tomography images: differential diagnosis and correlation with pathology findings. Arch Bronconeumol. 2008;44(7):386-392.
64 Raoof S., Amchentsev A., Vlahos I., et al. Pictorial essay: multinodular disease: a high-resolution CT scan diagnostic algorithm. Chest. 2006;129(3):805-815.
65 Abbott G.F., Rosado-de-Christenson M.L., Franks T.J., et al. From the archives of the AFIP: pulmonary Langerhans cell histiocytosis. Radiographics. 2004;24(3):821-841.
66 Howling S.J., Hansell D.M., Wells A.U., et al. Follicular bronchiolitis: thin-section CT and histologic findings. Radiology. 1999;212(3):637-642.
67 Pipavath S.N., Stern E.J. Imaging of small airway disease (SAD). Radiol Clin North Am. 2009;47(2):307-316.
68 Kang E.Y., Woo O.H., Shin B.K., et al. Bronchiolitis: classification, computed tomographic and histopathologic features, and radiologic approach. J Comput Assist Tomogr. 2009;33(1):32-41.
69 Pipavath S.J., Lynch D.A., Cool C., et al. Radiologic and pathologic features of bronchiolitis. AJR Am J Roentgenol. 2005;185(2):354-363.
70 Ryu J.H., Myers J.L., Swensen S.J. Bronchiolar disorders. Am J Respir Crit Care Med. 2003;168(11):1277-1292.
71 Silva C.I., Churg A., Müller N.L. Hypersensitivity pneumonitis: spectrum of high-resolution CT and pathologic findings. AJR Am J Roentgenol. 2007;188(2):334-344.
72 Chung M.H., Edinburgh K.J., Webb E.M., et al. Mixed infiltrative and obstructive disease on high-resolution CT: differential diagnosis and functional correlates in a consecutive series. J Thorac Imaging. 2001;16(2):69-75.
73 Mueller-Mang C., Grosse C., Schmid K., et al. What every radiologist should know about idiopathic interstitial pneumonias. Radiographics. 2007;27(3):595-615.
74 Hidalgo A., Franquet T., Giménez A., et al. Smoking-related interstitial lung diseases: radiologic-pathologic correlation. Eur Radiol. 2006;16(11):2463-2470.
75 Park J.S., Brown K.K., Tuder R.M., et al. Respiratory bronchiolitis-associated interstitial lung disease: radiologic features with clinical and pathologic correlation. J Comput Assist Tomogr. 2002;26(1):13-20.
76 Attili A.K., Kazerooni E.A., Gross B.H., et al. Smoking-related interstitial lung disease: radiologic-clinical-pathologic correlation. Radiographics. 2008;28(5):1383-1396. discussion 1396–1398
77 Galvin J.R., Franks T.J. Smoking-related lung disease. J Thorac Imaging. 2009;24(4):274-284.
78 Koyama T., Ueda H., Togashi K., et al. Radiologic manifestations of sarcoidosis in various organs. Radiographics. 2004;24(1):87-104.
79 Nakatsu M., Hatabu H., Morikawa K., et al. Large coalescent parenchymal nodules in pulmonary sarcoidosis: “sarcoid galaxy” sign. AJR Am J Roentgenol. 2002;178(6):1389-1393.
80 Davies C.W., Tasker A.D., Padley S.P., et al. Air trapping in sarcoidosis on computed tomography: correlation with lung function. Clin Radiol. 2000;55(3):217-221.
81 Becciolini V., Gudinchet F., Cheseaux J.J., et al. Lymphocytic interstitial pneumonia in children with AIDS: high-resolution CT findings. Eur Radiol. 2001;11(6):1015-1020.
82 Johkoh T., Müller N.L., Pickford H.A., et al. Lymphocytic interstitial pneumonia: thin-section CT findings in 22 patients. Radiology. 1999;212(2):567-572.
83 Wittram C., Mark E.J., McLoud T.C. CT-histologic correlation of the ATS/ERS 2002 classification of idiopathic interstitial pneumonias. Radiographics. 2003;23(5):1057-1071.
84 Swigris J.J., Berry G.J., Raffin T.A., et al. Lymphoid interstitial pneumonia: a narrative review. Chest. 2002;122(6):2150-2164.
85 Honda O., Johkoh T., Ichikado K., et al. Differential diagnosis of lymphocytic interstitial pneumonia and malignant lymphoma on high-resolution CT. AJR Am J Roentgenol. 1999;173(1):71-74.
86 Chong S., Lee K.S., Chung M.J., et al. Pneumoconiosis: comparison of imaging and pathologic findings. Radiographics. 2006;26(1):59-77.
87 Oikonomou A., Muller N.L. Imaging of pneumoconiosis. Imaging. 2003;15:11-22.
88 Kim K.I., Kim C.W., Lee M.K., et al. Imaging of occupational lung disease. Radiographics. 2001;21(6):1371-1391.
89 Hirakata K., Nakata H., Haratake J. Appearance of pulmonary metastases on high-resolution CT scans: comparison with histopathologic findings from autopsy specimens. AJR Am J Roentgenol. 1993;161(1):37-43.
90 Seo J.B., Im J.G., Goo J.M., Chung M.J., et al. Atypical pulmonary metastases: spectrum of radiologic findings. Radiographics. 2001;21(2):403-417.
91 Franquet T., Giménez A., Prats R., et al. Thrombotic microangiopathy of pulmonary tumors: a vascular cause of tree-in-bud pattern on CT. AJR Am J Roentgenol. 2002;179(4):897-899.
92 Leung A.N. Pulmonary tuberculosis: the essentials. Radiology. 1999;210(2):307-322.
93 Kim J.Y., Jeong Y.J., Kim K.I., et al. Miliary tuberculosis: a comparison of CT findings in HIV-seropositive and HIV-seronegative patients. Br J Radiol. 2010;83(987):206-211.
94 Van Dyck P., Vanhoenacker F.M., Van den Brande P., et al. Imaging of pulmonary tuberculosis. Eur Radiol. 2003;13(8):1771-1785.
95 Jeong Y.J., Lee K.S. Pulmonary tuberculosis: up-to-date imaging and management. AJR Am J Roentgenol. 2008;191(3):834-844.
96 Burrill J., Williams C.J., Bain G., et al. Tuberculosis: a radiologic review. Radiographics. 2007;27(5):1255-1273.
97 Cheung O.Y., Muhm J.R., Helmers R.A., et al. Surgical pathology of granulomatous interstitial pneumonia. Ann Diagn Pathol. 2003;7(2):127-138.
98 Rossi S.E., Franquet T., Volpacchio M., et al. Tree-in-bud pattern at thin-section CT of the lungs: radiologic-pathologic overview. Radiographics. 2005;25(3):789-801.
99 Escuissato D.L., Gasparetto E.L., Marchiori E., et al. Pulmonary infections after bone marrow transplantation: high-resolution CT findings in 111 patients. AJR Am J Roentgenol. 2005;185(3):608-615.
100 Kishi K., Homma S., Kurosaki A., et al. Clinical features and high-resolution CT findings of pulmonary cryptococcosis in non-AIDS patients. Respir Med. 2006;100(5):807-812.
101 Rossi S.E., Erasmus J.J., Volpacchio M., et al. “Crazy-paving” pattern at thin-section CT of the lungs: radiologic-pathologic overview. Radiographics. 2003;23(6):1509-1519.
102 Johkoh T., Itoh H., Müller N.L., et al. Crazy-paving appearance at thin-section CT: spectrum of disease and pathologic findings. Radiology. 1999;211(1):155-160.
103 Lee C.H. The crazy-paving sign. Radiology. 2007;243(3):905-906.
104 Collins J., Blankenbaker D., Stern E.J. CT patterns of bronchiolar disease: what is “tree-in-bud”? AJR Am J Roentgenol. 1998;171(2):365-370.
105 Eisenhuber E. The tree-in-bud sign. Radiology. 2002;222(3):771-772.
106 Müller N.L., Miller R.R. Diseases of the bronchioles: CT and histopathologic findings. Radiology. 1995;196(1):3-12.
107 Franquet T., Giménez A., Prats R., et al. Thrombotic microangiopathy of pulmonary tumors: a vascular cause of tree-in-bud pattern on CT. AJR Am J Roentgenol. 2002;179(4):897-899.
108 Tack D., Nollevaux M.C., Gevenois P.A. Tree-in-bud pattern in neoplastic pulmonary emboli. AJR Am J Roentgenol. 2001;176(6):1421-1422.
109 Gaeta M., Blandino A., Scribano E., et al. Computed tomography halo sign in pulmonary nodules: frequency and diagnostic value. J Thorac Imaging. 1999;14(2):109-113.
110 Pinto P.S. The CT halo sign. Radiology. 2004;230(1):109-110.
111 Primack S.L., Hartman T.E., Lee K.S., et al. Pulmonary nodules and the CT halo sign. Radiology. 1994;190(2):513-515.
112 Lee Y.R., Choi Y.W., Lee K.J., et al. CT halo sign: the spectrum of pulmonary diseases. Br J Radiol. 2005;78(933):862-865.
113 Kim S.J., Lee K.S., Ryu Y.H., et al. Reversed halo sign on high-resolution CT of cryptogenic organizing pneumonia: diagnostic implications. AJR Am J Roentgenol. 2003;180(5):1251-1254.
114 Voloudaki A.E., Bouros D.E., Froudarakis M.E., et al. Crescentic and ring-shaped opacities. CT features in two cases of bronchiolitis obliterans organizing pneumonia (BOOP). Acta Radiol. 1996;37(6):889-892.
115 Johkoh T., Müller N.L., Ichikado K. Perilobular pulmonary opacities: high-resolution CT findings and pathologic correlation. J Thorac Imaging. 1999;14(3):172-177.
116 Ujita M., Renzoni E.A., Veeraraghavan S., et al. Organizing pneumonia: perilobular pattern at thin-section CT. Radiology. 2004;232(3):757-761.
117 Schwarz M., King T., editors. Interstitial Lung Disease, 3rd ed., Hamilton, Ontario, Canada: BC Decker, 1998.
118 Johkoh T., Müller N.L., Taniguchi H., et al. Acute interstitial pneumonia: thin-section CT findings in 36 patients. Radiology. 1999;211(3):859-863.
119 Tomiyama N., Müller N.L., Johkoh T., et al. Acute parenchymal lung disease in immunocompetent patients: diagnostic accuracy of high-resolution CT. AJR Am J Roentgenol. 2000;174(6):1745-1750.
120 Tomiyama N., Müller N.L., Johkoh T., et al. Acute respiratory distress syndrome and acute interstitial pneumonia: comparison of thin-section CT findings. J Comput Assist Tomogr. 2001;25(1):28-33.
121 Daimon T., Johkoh T., Sumikawa H., et al. Acute eosinophilic pneumonia: thin-section CT findings in 29 patients. Eur J Radiol. 2008;65(3):462-467.
122 Jeong Y.J., Kim K.I., Seo I.J., et al. Eosinophilic lung diseases: a clinical, radiologic, and pathologic overview. Radiographics. 2007;27(3):617-637. discussion 637–639
123 Johkoh T., Müller N.L., Akira M., et al. Eosinophilic lung diseases: diagnostic accuracy of thin-section CT in 111 patients. Radiology. 2000;216(3):773-780.
124 Camus P., Kudoh S., Ebina M. Interstitial lung disease associated with drug therapy. Br J Cancer. 2004;91(suppl 2):S18-S23.
125 Cleverley J.R., Screaton N.J., Hiorns M.P., et al. Drug-induced lung disease: high-resolution CT and histological findings. Clin Radiol. 2002;57(4):292-299.
126 Nguyen E.T., Silva C.I., Souza C.A., et al. Pulmonary complications of illicit drug use: differential diagnosis based on CT findings. J Thorac Imaging. 2007;22(2):199-206.
127 Gattinoni L., Caironi P., Pelosi P., et al. What has computed tomography taught us about the acute respiratory distress syndrome? Am J Respir Crit Care Med. 2001;164(9):1701-1711.
128 Churg A., Müller N.L., Silva C.I., et al. Acute exacerbation (acute lung injury of unknown cause) in UIP and other forms of fibrotic interstitial pneumonias. Am J Surg Pathol. 2007;31(2):277-284.
129 Collard H.R., Moore B.B., Flaherty K.R., the Idiopathic Pulmonary Fibrosis Clinical Research Network Investigators. Acute exacerbations of idiopathic pulmonary fibrosis. Am J Respir Crit Care Med. 2007;176(7):636-643.
130 Park I.N., Kim D.S., Shim T.S., et al. Acute exacerbation of interstitial pneumonia other than idiopathic pulmonary fibrosis. Chest. 2007;132(1):214-220.
131 Akira M., Kozuka T., Yamamoto S., et al. Computed tomography findings in acute exacerbation of idiopathic pulmonary fibrosis. Am J Respir Crit Care Med. 2008;178(4):372-378.
132 Silva C.I., Müller N.L., Fujimoto K., et al. Acute exacerbation of chronic interstitial pneumonia: high-resolution computed tomography and pathologic findings. J Thorac Imaging. 2007;22(3):221-229.
133 Castañer E., Alguersuari A., Gallardo X., et al. When to suspect pulmonary vasculitis: radiologic and clinical clues. Radiographics. 2010;30(1):33-53.
134 Primack S.L., Miller R.R., Müller N.L. Diffuse pulmonary hemorrhage: clinical, pathologic, and imaging features. AJR Am J Roentgenol. 1995;164(2):295-300.
135 Ribeiro C.M., Marchiori E., Rodrigues R., et al. Hydrostatic pulmonary edema: high-resolution computed tomography aspects. J Bras Pneumol. 2006;32(6):515-522.
136 Kim E.A., Lee K.S., Primack S.L., et al. Viral pneumonias in adults: radiologic and pathologic findings. Radiographics. 2002;22(spec no):S137-S149.
137 Reittner P., Ward S., Heyneman L., et al. Pneumonia: high-resolution CT findings in 114 patients. Eur Radiol. 2003;13(3):515-521.
138 Gruden J.F., Huang L., Turner J., et al. High-resolution CT in the evaluation of clinically suspected Pneumocystis carinii pneumonia in AIDS patients with normal, equivocal, or nonspecific radiographic findings. AJR Am J Roentgenol. 1997;169(4):967-975.
139 Reittner P., Müller N.L., Heyneman L., et al. Mycoplasma pneumoniae pneumonia: radiographic and high-resolution CT features in 28 patients. AJR Am J Roentgenol. 2000;174(1):37-41.
140 Demirkazik F.B., Akin A., Uzun O., et al. CT findings in immunocompromised patients with pulmonary infections. Diagn Interv Radiol. 2008;14(2):75-82.
141 Akira M., Atagi S., Kawahara M., et al. High-resolution CT findings of diffuse bronchioloalveolar carcinoma in 38 patients. AJR Am J Roentgenol. 1999;173(6):1623-1629.
142 Lee K.S., Kim Y., Han J., et al. Bronchioloalveolar carcinoma: clinical, histopathologic, and radiologic findings. Radiographics. 1997;17(6):1345-1357.
143 Patsios D., Roberts H.C., Paul N.S., et al. Pictorial review of the many faces of bronchioloalveolar cell carcinoma. Br J Radiol. 2007;80(960):1015-1023.
144 Jung J.I., Kim H., Park S.H., et al. CT differentiation of pneumonic-type bronchioloalveolar cell carcinoma and infectious pneumonia. Br J Radiol. 2001;74(882):490-494.
145 Aquino S.L., Chiles C., Halford P. Distinction of consolidative bronchioloalveolar carcinoma from pneumonia: do CT criteria work? AJR Am J Roentgenol. 1998;171(2):359-363.
146 Arakawa H., Kurihara Y., Niimi H., et al. Bronchiolitis obliterans with organizing pneumonia versus chronic eosinophilic pneumonia: high-resolution CT findings in 81 patients. AJR Am J Roentgenol. 2001;176(4):1053-1058.
147 Padley S.P., Adler B., Hansell D.M., et al. High-resolution computed tomography of drug-induced lung disease. Clin Radiol. 1992;46(4):232-236.
148 Ryu J.H., Myers J.L., Capizzi S.A., et al. Desquamative interstitial pneumonia and respiratory bronchiolitis-associated interstitial lung disease. Chest. 2005;127(1):178-184.
149 Lynch D.A., Travis W.D., Müller N.L., et al. Idiopathic interstitial pneumonias: CT features. Radiology. 2005;236(1):10-21.
150 Hartman T.E., Primack S.L., Swensen S.J., et al. Desquamative interstitial pneumonia: thin-section CT findings in 22 patients. Radiology. 1993;187:787-790.
151 Heyneman L.E., Ward S., Lynch D.A., et al. Respiratory bronchiolitis, respiratory bronchiolitis- associated interstitial lung disease, and desquamative interstitial pneumonia: different entities or part of the spectrum of the same disease process? AJR Am J Roentgenol. 1999;173(6):1617-1622.
152 Koyama M., Johkoh T., Honda O., et al. Chronic cystic lung disease: diagnostic accuracy of high-resolution CT in 92 patients. AJR Am J Roentgenol. 2003;180(3):827-835.
153 Levin D.L. Radiology of pulmonary Mycobacterium avium-intracellulare complex. Clin Chest Med. 2002;23(3):603-612.
154 Jeong Y.J., Lee K.S., Koh W.J., et al. Nontuberculous mycobacterial pulmonary infection in immunocompetent patients: comparison of thin-section CT and histopathologic findings. Radiology. 2004;231(3):880-886.
155 Erasmus J.J., McAdams H.P., Farrell M.A., et al. Pulmonary nontuberculous mycobacterial infection: radiologic manifestations. Radiographics. 1999;19(6):1487-1505.
156 Laurent F., Philippe J.C., Vergier B., et al. Exogenous lipoid pneumonia: HRCT, MR, and pathologic findings. Eur Radiol. 1999;9(6):1190-1196.
157 Lee J.S., Im J.G., Song K.S. Exogenous lipoid pneumonia: high-resolution CT findings. Eur Radiol. 1999;9(2):287-291.
158 King L.J., Padley S.P., Wotherspoon A.C., et al. Pulmonary MALT lymphoma: imaging findings in 24 cases. Eur Radiol. 2000;10(12):1932-1938.
159 McCulloch G.L., Sinnatamby R., Stewart S., et al. High-resolution computed tomographic appearance of MALToma of the lung. Eur Radiol. 1998;8(9):1669-1673.
160 Bae Y.A., Lee K.S., Han J., et al. Marginal zone B-cell lymphoma of bronchus-associated lymphoid tissue: imaging findings in 21 patients. Chest. 2008;133(2):433-440.
161 Lee D.K., Im J.G., Lee K.S., et al. B-cell lymphoma of bronchus-associated lymphoid tissue (BALT): CT features in 10 patients. J Comput Assist Tomogr. 2000;24(1):30-34.
162 Wislez M., Cadranel J., Antoine M., et al. Lymphoma of pulmonary mucosa-associated lymphoid tissue: CT scan findings and pathological correlations. Eur Respir J. 1999;14(2):423-429.
163 Churg A., Müller N.L. Cellular vs fibrosing interstitial pneumonias and prognosis: a practical classification of the idiopathic interstitial pneumonias and pathologically/radiologically similar conditions. Chest. 2006;130(5):1566-1570.
164 Tsubamoto M., Müller N.L., Johkoh T., et al. Pathologic subgroups of nonspecific interstitial pneumonia: differential diagnosis from other idiopathic interstitial pneumonias on high-resolution computed tomography. J Comput Assist Tomogr. 2005;29(6):793-800.
165 Erasmus J.J., McAdams H.P., Rossi S.E. Drug-induced lung injury. Semin Roentgenol. 2002;37(1):72-81.
166 Oikonomou A., Hansell D.M. Organizing pneumonia: the many morphological faces. Eur Radiol. 2002;12(6):1486-1496.
167 Johkoh T., Müller N.L., Cartier Y., et al. Idiopathic interstitial pneumonias: diagnostic accuracy of thin-section CT in 129 patients. Radiology. 1999;211(2):555-560.
168 Cordier J.F. Cryptogenic organising pneumonia. Eur Respir J. 2006;28(2):422-446.
169 Epstein D.M., Bennett M.R. Bronchiolitis obliterans organizing pneumonia with migratory pulmonary infiltrates. AJR Am J Roentgenol. 1992;158(3):515-517.
170 Wang B.M., Stern E.J., Schmidt R.A., et al. Diagnosing pulmonary alveolar proteinosis. A review and an update. Chest. 1997;111(2):460-466.
171 Frazier A.A., Franks T.J., Cooke E.O., et al. From the archives of the AFIP: pulmonary alveolar proteinosis. Radiographics. 2008;28(3):883-899. quiz 915
172 Lee K.H., Lee J.S., Lynch D.A., et al. The radiologic differential diagnosis of diffuse lung diseases characterized by multiple cysts or cavities. J Comput Assist Tomogr. 2002;26(1):5-12.
173 Schoepf U.J., editor. Multidetector-Row CT of the Thorax. Berlin-Heidelberg: Springer-Verlag, 2006.
174 Collins J. CT signs and patterns of lung disease. Radiol Clin North Am. 2001;39(6):1115-1135.
175 Takahashi M., Fukuoka J., Nitta N., et al. Imaging of pulmonary emphysema: a pictorial review. Int J Chron Obstruct Pulmon Dis. 2008;3(2):193-204.
176 Pipavath S.N., Schmidt R.A., Takasugi J.E., et al. Chronic obstructive pulmonary disease: radiology-pathology correlation. J Thorac Imaging. 2009;24(3):171-180.
177 Takasugi J.E., Godwin J.D. Radiology of chronic obstructive pulmonary disease. Radiol Clin North Am. 1998;36(1):29-55.
178 Webb E.M., Elicker B.M., Webb W.R. Using CT to diagnose nonneoplastic tracheal abnormalities: appearance of the tracheal wall. AJR Am J Roentgenol. 2000;174(5):1315-1321.
179 Vassallo R., Ryu J.H., Colby T.V., et al. Pulmonary Langerhans’-cell histiocytosis. N Engl J Med. 2000;342(26):1969-1978.
180 Brauner M.W., Grenier P., Mouelhi M.M., et al. Pulmonary histiocytosis X: evaluation with high-resolution CT. Radiology. 1989;172(1):255-258.
181 Mendez J.L., Nadrous H.F., Vassallo R., et al. Pneumothorax in pulmonary Langerhans cell histiocytosis. Chest. 2004;125(3):1028-1032.
182 Marchiori E., Araujo Neto C., Meirelles G.S., et al. Laryngotracheobronchial papillomatosis: findings on computed tomography scans of the chest. J Bras Pneumol. 2008;34(12):1084-1089.
183 Park C.M., Goo J.M., Lee H.J., et al. Tumors in the tracheobronchial tree: CT and FDG PET features. Radiographics. 2009;29(1):55-71.
184 Katz S.L., Das P., Ngan B.Y., et al. Remote intrapulmonary spread of recurrent respiratory papillomatosis with malignant transformation. Pediatr Pulmonol. 2005;39(2):185-188.
185 Chu S.C., Horiba K., Usuki J., et al. Comprehensive evaluation of 35 patients with lymphangioleiomyomatosis. Chest. 1999;115(4):1041-1052.
186 Abbott G.F., Rosado-de-Christenson M.L., Frazier A.A. From the archives of the AFIP: lymphangioleiomyomatosis: radiologic-pathologic correlation. Radiographics. 2005;25(3):803-828.
187 Pallisa E., Sanz P., Roman A., et al. Lymphangioleiomyomatosis: pulmonary and abdominal findings with pathologic correlation. Radiographics. 2002;22(spec no):S185-S198.
188 Tateishi U., Hasegawa T., Kusumoto M., et al. Metastatic angiosarcoma of the lung: spectrum of CT findings. AJR Am J Roentgenol. 2003;180(6):1671-1674.
189 Park S.I., Choi E., Lee H.B., et al. Spontaneous pneumomediastinum and hemopneumothoraces secondary to cystic lung metastasis. Respiration. 2003;70(2):211-213.
190 Birt A.R., Hogg G.R., Dubé W.J. Hereditary multiple fibrofolliculomas with trichodiscomas and acrochordons. Arch Dermatol. 1977;113(12):1674-1677.
191 Ayo D.S., Aughenbaugh G.L., Yi E.S., et al. Cystic lung disease in Birt-Hogg-Dube syndrome. Chest. 2007;132(2):679-684.
192 Souza C.A., Finley R., Müller N.L. Birt-Hogg-Dubé syndrome: a rare cause of pulmonary cysts. AJR Am J Roentgenol. 2005;185(5):1237-1239.
193 Tobino K., Gunji Y., Kurihara M., et al. Characteristics of pulmonary cysts in Birt-Hogg-Dubé syndrome: thin-section CT findings of the chest in 12 patients. Eur J Radiol. September 24, 2009. [Epub ahead of print]
194 Pittet O., Cristodoulou M., Staneczek O., et al. Diagnosis of Birt-Hogg-Dube syndrome in a patient with spontaneous pneumothorax. Ann Thorac Surg. 2006;82(3):1123-1125.
195 Stern E.J., Mülller N.L., Swensen S.J., et al. CT mosaic pattern of lung attenuation: etiologies and terminology. J Thorac Imaging. 1995;10(4):294-297.
196 Schoepf U.J., editor. Multidetector-Row CT of the Thorax. Berlin-Heidelberg: Springer-Verlag, 2006.
197 Arakawa H. Expiratory high-resolution CT: diagnostic value in diffuse lung diseases. AJR Am J Roentgenol. 2000;175:1537-1543.
198 Castañer E., Gallardo X., Ballesteros E., et al. CT diagnosis of chronic pulmonary thromboembolism. Radiographics. 2009;29(1):31-50. discussion 50–53
199 Frazier A.A., Galvin J.R., Franks T.J., et al. From the archives of the AFIP: pulmonary vasculature: hypertension and infarction. Radiographics. 2000;20(2):491-524.
200 Do K.H., Goo J.M., Im J.G., et al. Systemic arterial supply to the lungs in adults: spiral CT findings. Radiographics. 2001;21(2):387-402.
201 Aguayo S.M., Miller Y.E., Waldron J.A.Jr, et al. Brief report: idiopathic diffuse hyperplasia of pulmonary neuroendocrine cells and airways disease. N Engl J Med. 1992;327(18):1285-1288.
202 Brown M.J., English J., Müller N.L. Bronchiolitis obliterans due to neuroendocrine hyperplasia: high-resolution CT—pathologic correlation. AJR Am J Roentgenol. 1997;168(6):1561-1562.
203 Lee J.S., Brown K.K., Cool C., et al. Diffuse pulmonary neuroendocrine cell hyperplasia: radiologic and clinical features. J Comput Assist Tomogr. 2002;26(2):180-184.
204 Davies S.J., Gosney J.R., Hansell D.M., et al. Diffuse idiopathic pulmonary neuroendocrine cell hyperplasia: an under-recognised spectrum of disease. Thorax. 2007;62(3):248-252.
205 Lynch D.A. Imaging of small airways disease and chronic obstructive pulmonary disease. Clin Chest Med. 2008;29:165-179.
206 Rice A., Nicholson A.G. The pathologist’s approach to small airways disease. Histopathology. 2009;54(1):117-133.
207 King M.A., Stone J.A., Diaz P.T., et al. Alpha 1-antitrypsin deficiency: evaluation of bronchiectasis with CT. Radiology. 1996;199(1):137-141.
208 Marti-Bonmati L., Ruiz Perales F., Catala F., et al. CT findings in Swyer-James syndrome. Radiology. 1989;172(2):477-480.
209 Moore A.D., Godwin J.D., Dietrich P.A., et al. Swyer-James syndrome: CT findings in eight patients. AJR Am J Roentgenol. 1992;158(6):1211-1215.
210 Truong M.T., Sabloff B.S., Ko J.P. Multidetector CT of solitary pulmonary nodules. Radiol Clin North Am. 2010;48(1):141-155.
211 Herder G.J., van Tinteren H., Golding R.P., et al. Clinical prediction model to characterize pulmonary nodules: validation and added value of 18F-fluorodeoxyglucose positron emission tomography. Chest. 2005;128(4):2490-2496.
212 Gurney J.W., Lyddon D.M., McKay J.A. Determining the likelihood of malignancy in solitary pulmonary nodules with Bayesian analysis. Part II. Application. Radiology. 1993;186(2):415-422.
213 Bailey-Wilson J.E., Amos C.I., Pinney S.M., et al. A major lung cancer susceptibility locus maps to chromosome 6q23–25. Am J Hum Genet. 2004;75(3):460-474.
214 Winer-Muram H.T. The solitary pulmonary nodule. Radiology. 2006;239(1):34-49. [review]
215 Swensen S.J., Jett J.R., Hartman T.E., et al. Lung cancer screening with CT: Mayo Clinic experience. Radiology. 2003;226(3):756-761.
216 Henschke C.I., Naidich D.P., Yankelevitz D.F., et al. Early lung cancer action project: initial findings on repeat screenings. Cancer. 2001;92(1):153-159.
217 Pastorino U., Bellomi M., Landoni C., et al. Early lung-cancer detection with spiral CT and positron emission tomography in heavy smokers: 2-year results. Lancet. 2003;362(9384):593-597.
218 Siegelman S.S., Khouri N.F., Scott W.W.Jr, et al. Pulmonary hamartoma: CT findings. Radiology. 1986;160(2):313-317.
219 Muram T.M., Aisen A. Fatty metastatic lesions in 2 patients with renal clear-cell carcinoma. J Comput Assist Tomogr. 2003;27(6):869-870.
220 Henschke C.I., Yankelevitz D.F., Mirtcheva R., for the ELCAP Group. CT screening for lung cancer: frequency and significance of part-solid and nonsolid nodules. AJR Am J Roentgenol. 2002;178(5):1053-1057.
221 Zwirewich C.V., Vedal S., Miller R.R., et al. Solitary pulmonary nodule: high-resolution CT and radiologic-pathologic correlation. Radiology. 1991;179(2):469-476.
222 Woodring J.H., Fried A.M., Chuang V.P. Solitary cavities of the lung: diagnostic implications of cavity wall thickness. AJR Am J Roentgenol. 1980;135(6):1269-1271.
223 Hasegawa M., Sone S., Takashima S., et al. Growth rate of small lung cancers detected on mass CT screening. Br J Radiol. 2000;73(876):1252-1259.
224 Aoki T., Nakata H., Watanabe H., et al. Evolution of peripheral lung adenocarcinomas: CT findings correlated with histology and tumor doubling time. AJR Am J Roentgenol. 2000;174(3):763-768.
225 Leef J.L.III, Klein J.S. The solitary pulmonary nodule. Radiol Clin North Am. 2002;40(1):123-143. ix
226 Hartman T.E. Radiologic evaluation of the solitary pulmonary nodule. Radiol Clin North Am. 2005;43(3):459-465. vii [review]
227 Lillington G.A., Caskey C.I. Evaluation and management of solitary and multiple pulmonary nodules. Clin Chest Med. 1993;14(1):111-119.
228 MacMahon H., Austin J.H., Gamsu G., the Fleischner Society. Guidelines for management of small pulmonary nodules detected on CT scans: a statement from the Fleischner Society. Radiology. 2005;237(2):395-400.
229 Swensen S.J., Viggiano R.W., Midthun D.E., et al. Lung nodule enhancement at CT: multicenter study. Radiology. 2000;214(1):73-80.
230 Lowe V.J., Hoffman J.M., DeLong D.M., et al. Semiquantitative and visual analysis of FDG-PET images in pulmonary abnormalities. J Nucl Med. 1994;35(11):1771-1776.
231 Gould M.K., Maclean C.C., Kuschner W.G., et al. Accuracy of positron emission tomography for diagnosis of pulmonary nodules and mass lesions: a meta-analysis. JAMA. 2001;285(7):914-924.
232 Nomori H., Watanabe K., Ohtsuka T., et al. Evaluation of F-18 fluorodeoxyglucose (FDG) PET scanning for pulmonary nodules less than 3 cm in diameter, with special reference to the CT images. Lung Cancer. 2004;45(1):19-27.
[/level-membership-for-pulmolory-and-respiratory-category][not-level-membership-for-pulmolory-and-respiratory-category]
3 Computed Tomography of Diffuse Lung Diseases and Solitary Pulmonary Nodules
Foundations
Living with X-Rays and Working with Computed Tomography
X-Rays and Computed Tomography
Radiology is the science of studying anatomy and pathology using x-rays—electromagnetic waves (like visible light, only with a much shorter wavelength) capable of penetrating the tissues. In computed tomography (CT), the widely recognized imaging standard of reference for assessment of most pulmonary abnormalities, a collimated fan beam of radiation is generated by an x-ray tube inside a gantry (Fig. 3-1).
The beam is quite homogeneous when entering the body (ingoing radiation) but, point by point, inhomogeneous when exiting (outgoing radiation) because of different attenuations produced by the tissues. The attenuation highly depends on the characteristics of the tissue, calcium being at the highest and air at the lowest end of a scale with soft tissue densities (e.g., organs, muscles, blood vessels, interstitium) and fat in between (see Fig. 3-1).
Always point by point, the outgoing radiation activates a matrix of tiny sensible elements (detectors) during a continuous spiral movement of the tube-detectors system around the body (scan), and the information acquired is stored in a computer. At the end of the process, the system contains a digital three-dimensional map of single unitary elements (voxels) composing the scanned volume (see Fig. 3-1).
Computed Tomography, Spiral Computed Tomography, and High-Resolution Computed Tomography
For viewing, CT is able to return the values of a two-dimensional matrix of voxels on a monitor over a scale of grays (gray-scale), where the brightest (white) spots represent the elements with higher attenuation and the darkest (black) the ones of lower attenuation. Although spiral CT is able to show images of equal quality along planes in any direction, the axial (transverse), frontal (coronal), and sagittal (lateral) views are used more commonly (Figs. 3-2 to 3-4). For each view, a stack of images may be seen in sequence simply by browsing at the workstation through the volumetric data set; at the end of the diagnostic process, the entire volume is investigated from multiple points of view.
With a diffuse lung disease (DLD), the high-resolution option is used. An actual collimation of 0.5 to 2 mm and a high spatial frequency reconstruction algorithm (edge enhancing) generate the final images.1 The narrow collimation reduces the voxel size, thereby minimizing the averaging of densities (attenuations) inside them, and this allows the rendering of subtle anatomical details (down to 0.1–0.2 mm in the most favorable conditions1). A limit is the noise of the image because of the reduced radiation penetrating such small voxels. However, at the pulmonary level, the difference of attenuation (contrast) between lung structures and air is high; thus, the signal is high, and the final signal-to-noise ratio remains adequate for diagnostic purposes.
Terminology
In general, the structures that attenuate more are whiter (thus, more opaque or dense or also hyperdense) than the structures that attenuate less (thus, more transparent or lucent or also hyperlucent). Therefore, the concept of density/opacity/attenuation of an element is a relative one, and for the object of interest it should be expressed in comparison with a reference structure, usually the surrounding background. The mediastinal vessels, for example, are denser than the fat in which they are embedded, but in turn this fat is denser than the tracheal lumen containing air (Fig. 3-5).
If a special iodinated substance (contrast medium) is injected intravenously before the examination, the visibility of the tissues is enhanced (contrast enhancement) because iodine is a powerful absorber of radiation (see Fig. 3-5). A contrast medium is used rarely in the studies performed for a suspected DLD but frequently when a mass or a vascular condition is under investigation.
The body structures are best observed on monitors or films where the brightness/contrast is optimized to bring out the details of the image. However, human eye limitations do not allow a real-time appreciation of these details over the entire dynamic range of chest attenuations. Fortunately, all pertinent data are available to the machine, and the operator needs only to press a button to switch, through a dedicated processing referred to as windowing and leveling, from a mediastinal window (where the details in the lung are squeezed down to the absolute blackness) to a lung window (where the soft tissues are leveled out but the lung structures stand out with maximal detail) (see Fig. 3-5).
Lung Anatomy
Arteries, Veins, and Bronchi
When examined using a lung window, the lungs appear as overall grayish structures delineated by the mediastinum and thoracic cage. Their shape depends on how they are cut by the plane of the section (see Figs. 3-2 to 3-4). The homogeneously whitish elements standing out over this background are blood vessels, which appear roundish or linear depending on the plane of section. Their size should be appropriate to their position within the lung (central versus peripheral) (Fig. 3-6). Each artery is joined by a companion airway, characterized longitudinally as a pair of tapering whitish lines separated by air, which branch regularly (“railway track” appearance). The airways appear as white rings when cut transversally (see Fig. 3-6). Actually, the visibility of bronchial structures within an aerated parenchyma is far below the visibility of companion vessels because of the mostly air-containing nature of the former. Consequently, when looking at a normal lung, the general feeling is of a predominance of blood vessels with only sporadic visibility of bronchioles within the outer third of the lungs.
The outer wall of the arteries and both the outer and inner surface of the bronchial walls should present a sharply defined interface with the surrounding parenchyma (Fig. 3-7). As a rule, bronchial walls in corresponding regions of both lungs should be similar in thickness. Moreover, coupled bronchi and arteries should present roughly the same diameter, and this in turn depends on their position (central or peripheral).1 The arteries tend to divide dichotomously, whereas the veins often present a monopodial branching with several smaller branches flowing into a main collection drain. Arteries and veins also have a different course that becomes almost perpendicular at the level of the vein entrance into the mediastinum and right heart (see Fig. 3-7).
Mediastinal and thoracic pleura are invisible when normal. However, they can appear as subtle tiny linear opacities at the fissural level, where two layers fuse radiologically (see Fig. 3-7). When normal, lymphatics are not visible at any level, their size being inadequate to be perceptible radiologically.
Secondary Lobule
At the periphery of the lung, after 28 generations of arteries and 23 generations of bronchi,2 arteries and bronchi become so small that they become invisible. As a consequence, the far peripheral pulmonary parenchyma should have no visible vessels, and the same and even more is true for the bronchi (see Figs. 3-6 and 3-7). Thus, the appreciation of vessels immediately below the pleural surface should point at an abnormality. However, exceptions are possible in the most dependent areas (Fig. 3-8), where the hydrostatic pressure is higher and the vessels larger.
The centrilobular bronchioles, in particular, should not be visible, and also, when normal, the interstitial framework at the lobular level should not be appreciable per se. Consequently, when an intralobular network of white lines and/or the walls of bronchioles become visible, this means that they are thickened and hence abnormal. In general, under normal circumstances, the lobular architecture is discernible only here and there when fragments of centrilobular arteries and perilobular veins are identified; this is more frequent in the dependent portions of the lung (see Fig. 3-8).
Special Techniques
Increasing Visibility
Multiplanar Reformation
The high-resolution computed tomography (HRCT) technique has existed since the end of the 1970s, but it was the development of the spiral multislice scanning machines in the early years of the 21st century that allowed the generation of consistent high-quality images in every spatial plane in nearly every patient (MPR). The first and most popular way to render the data is called averaged because, pixel by pixel, the images show the average attenuation of the tissues across the plane of section. The natural high contrast of lung tissue and thin collimation of the x-ray beam, coupled with a high frequency algorithm of reconstruction, guarantee sharp details of anatomical and pathologic elements down to well less than 1 mm in size (see Fig. 3-8).
Pathology that occurs in the central or peripheral regions of the lung is best studied in axial images (see Fig. 3-2). Diseases that show upper or lower lung prevalence benefit from visualization in coronal view (see Fig. 3-3). Finally, disorders that prevail in the parahilar regions or in the costophrenic angles are best depicted in the sagittal view (see Fig. 3-4). With the volumetric approach, the planes may be varied according to the needs of the operator and targeted on the suspected disease (Box 3-1).
Curved Multiplanar Reformation
Having the entire volume available and working digitally makes it possible to reconstruct objects traveling in and out of a two-dimensional plane along curved reformatted images (curved MPR). This allows a structure to be traced and displayed as if it lay along a single plane. For example, an intuitive visualization of the entire course of a bronchus from a cavitated lesion to its origin can be achieved by displaying it along a manually or automatically generated centerline of the bronchial lumen (Fig. 3-9). The curved reformatted images are not real, but they are effective and easy to generate and therefore suitable for practical purposes (e.g., “virtual” bronchoscopy).
Increasing Ambience
Maximum Intensity Projection
The maximum intensity projection (MIP) technique renders only the voxels with higher attenuation in a thick slice (0.5–2 cm). The technique is suitable to render tridimensionally the vascular tree standing against a black background; moreover, with MIP, it is possible to obtain a comprehensive representation of the position of various lesions inside the lobular framework3 (Fig. 3-10). In selected cases, MIP images are useful for distinguishing between vessels and nodules and, when nodules are present, to assess their profusion.
Minimum Intensity Projection
The minimum intensity projection (minIP) technique renders only the voxels with lower attenuation in a thick slice (0.5–2 cm). This technique is useful for improving the visualization of hyperlucent elements (bronchi, emphysema, bullae, honeycombing) and some opacities, allowing a more precise study of their attributes and distribution. The minIP technique is also ideal for investigating bronchial caliper and course, particularly within areas of increased density (Fig. 3-11).
Volume Rendering
Volume rendering (VR) techniques may be also used in the assessment of DLD. When implemented, the machine renders only the structures within a specific range of attenuations and contained within a chosen volume. Volume rendering may be useful for studying a volume of lung in three dimensions from within or for inspecting its surface from outside (external volume rendering) (Fig. 3-12). This is particularly useful for concisely looking at the pulmonary surface and its abnormalities and for helping to make medical decisions (e.g., determining the site of a surgical biopsy).
Prone and Expiratory Computed Tomography
However, in supine patients, some whiter atelectatic lung is frequently seen in the most dependent posterior areas (see Fig. 3-8), where it may simulate pathology or, alternatively, hide it. These normal densities disappear with prone positioning (Fig. 3-13), and indeed some experts suggest the routine use of prone scans when diseases under consideration characteristically involve posterior lung (e.g., asbestosis).4
In normal subjects, an expiratory scan shows a uniform reduction in size of the lungs together with a homogeneous increase of their density, due to the reduced amount of air within the alveoli. When an arterial obstructive or a bronchial stenotic disease is present, variable portions of lung become darker than normal because of the reduced blood supply caused directly by hampered vascular filling or indirectly caused by hypoxemic vasoconstriction. However, in the expiratory CT, the hyperlucent areas due to vascular obstruction physiologically increase their density, whereas in the case of bronchial stenosis they do not because the air does not exit from the alveoli (air trapping) (Fig. 3-14). When arterial obstructive or bronchial stenotic diseases are suspected, supplementary expiratory scans should then be added to complete the investigative process.
Diffuse Lung Diseases
Patterns
There are some limitations when thinking in terms of patterns. First, the same disease may present with different radiologic patterns. This may result from its variable pathologic expression in a given patient (e.g., pulmonary manifestations of progressive systemic sclerosis may show histologic usual interstitial pneumonia [UIP], nonspecific interstitial pneumonia [NSIP], organizing pneumonia [OP], and even diffuse alveolar damage patterns), from its temporal phase (e.g., a hypersensitivity pneumonitis may present in the acute, subacute, or chronic stage) or from its natural progression (e.g., an NSIP may proceed from a minimal changes pattern to end-stage lung disease). Second, the same pattern may be present in several diseases (a classical model being the systemic collagen vascular diseases [CVDs]), and also this is not unexpected because the lung has a limited number of reactions to different insults. These caveats are not an absolute limit to the diagnostic approach using patterns, but they underscore the necessity of a tight integration of imaging with clinical presentation and pathology in arriving at a meaningful diagnosis for the patient, as widely recognized in the literature.5
Septal Pattern
Definition
A septal pattern is present when a thickening of the perilobular interstitium is appreciable, making the lobular boundaries evident. The bronchovascular bundle is also usually thickened, producing changes both at the central parahilar level and in the centrilobular core (Fig. 3-15). The final effect is of that of a regular network of white lines with increased evidence of the perilobular interstitial architecture but without retraction or remodeling of pulmonary structures. For this reason, the septal pattern is also called regular linear pattern or linear pattern with preserved architecture.
High-Resolution Computed Tomography Signs
A network of white lines due to thickened septal, peribronchovascular, and subpleural interstitium is the trademark of this pattern. The thickened interlobular septa appear as white lines 1 to 2 cm in length outlining the polygonal boundaries of secondary lobules (interlobular or perilobular reticulation) (Fig. 3-16). Normally, these septa are not recognizable, so their presence points to an abnormality. A few lines inside the lobule may be also visible.2,6
Centrilobular peribronchovascular thickening becomes manifest as a cuffing of the core structures of the lobule. The bronchiole, usually invisible under normal conditions, becomes evident as a white ring adjacent to a white dot of similar size (the centrilobular arteriole). It is enlarged compared with those identifiable in adjacent portions of pulmonary parenchyma (Fig. 3-17).
The thickened peribronchovascular bundle at a more central level is also perceived as arteries of increased size, compared with similar portions of pulmonary parenchyma, and as thickening of bronchial walls (Fig. 3-18). As a rule, vessel size and bronchial wall thickness in corresponding regions of one or both lungs should be similar, and a comparative evaluation of different lung regions is helpful and makes the recognition of the abnormalities easier.2
The subpleural interstitial thickening should be evaluated at the edges of the lung as a white enveloping line simulating thickened pleura. This sign is often easier to identify at the fissural level, where two layers of subpleural interstitium coexist7 (Fig. 3-19).
Pleural effusion may be an additional finding in some septal disorders. It can be small and may be seen along the costovertebral angles or fissures (Fig. 3-20), where large, significant compressive effects on the adjacent parenchyma may be present.
Subset Smooth
The anatomy of the three interstitial compartments (perilobular, peribronchovascular, and subpleural) is thickened more-or-less regularly with smooth profiles. The polygonal outlines of the lobules are visible without focal abnormalities. Their shape is variable, depending on the CT plane (Fig. 3-21).
Inside the lobules, enlarged arteries and bronchioles with thickened walls are often visible. Smoothly thickened fissures are recognizable (Fig. 3-22), in particular with multiplanar reconstructions.8 Coexisting patches of faint opacities are possible, due to partial alveolar filling (ground glass opacity [GGO]). However, these patches should not overshadow the septal aspects; otherwise, an alveolar pattern should be considered.
Diseases in the Septal Pattern, subset Smooth, are listed in Box 3-2.
Interstitial Hydrostatic Pulmonary Edema
The septal lines of pulmonary edema are usually associated with smooth subpleural and peribronchovascular interstitial thickening (peribronchial cuffing). Patchy lobular GGO often coexists, due to minimal alveolar edema9 (Fig. 3-23). There is a tendency for the hydrostatic edema to show a symmetrical basal and posterior distribution (in supine patients) (Fig. 3-24), but patchy nongravitational distributions are not impossible.10
Figure 3-23 This coronal view shows bilateral smooth perilobular, peribronchovascular, and subpleural thickening in a patient with hydrostatic pulmonary edema (Fig. 3-22 is a close-up of this image). Areas of faint GGO are also present (arrows).
Heart enlargement and bilateral pleural effusion are common findings in cardiogenic pulmonary edema (see Fig. 3-24), and in a number of patients also a pericardial effusion may coexist. When the flow of the lymph to the systemic veins decreases, an enlargement of mediastinal lymph nodes due to fluid stagnation may occur11 (Fig. 3-25).
Lymphangitic Carcinomatosis
Lymphangitic carcinomatosis may present with a fully smooth subset12 (Fig. 3-26), but not infrequently nodular irregularities (beaded appearance of septa and fissures) and random micronodules in areas of thickening occur. Nodules result from focal growth of cells within the lymphatics and local extensions into the parenchyma.6,13 Subpleural thickening, when present, may also be smooth or nodular. Pleural effusion is unilateral in 50% of cases.
The lesions of lymphangitic carcinomatosis are typically patchy, often unilateral, and not gravity-dependent12 (Fig. 3-27). Hilar lymphadenopathy is visible in 50% of patients. Enlarged mediastinal lymph nodes can be also seen in a number of cases (25% to 50%).13 Dedicated CT window settings may demonstrate metastatic lesions elsewhere (Fig. 3-28).
Veno-occlusive Disease
The presentation of veno-occlusive disease is similar to that of hydrostatic pulmonary edema. Smooth septal lines, bronchial cuffing, and patches of GGO related to alveolar wall thickening and pulmonary edema are apparent14,15 (Fig. 3-29).
The lesions present a geographical appearance with variable localization. They are always bilateral and may have a gravitational preference15 (Fig. 3-30).
Figure 3-30 An axial scan of the same patient as in Figure 3-29 confirms the gravitational distribution of the lesions.
A key radiologic sign is a coexisting enlargement of the central pulmonary arteries compatible with arterial pulmonary hypertension16 (Fig. 3-31). The right side of the heart also may be dilated without evidence of left atrial or ventricular enlargement. In addition, pericardial or pleural effusion and enlargement of the mediastinal lymph nodes may be visible.14
Figure 3-31 A contrast-enhanced axial scan (mediastinal window) of the same patient as in Figure 3-29 reveals a dilated central pulmonary artery (arrowhead) and a right pleural effusion (curved arrow). Compare the size of the main pulmonary artery with the diameter of the ascending aorta (arrow): they should be the same in a normal individual.
Erdheim-Chester Disease
Erdheim-Chester disease is a non–Langerhans cell systemic histiocytosis that produces smooth septal and subpleural interstitial thickening, with more-or-less regular contours (Fig. 3-32). Multifocal areas of ground glass attenuation, small centrilobular nodular opacities, and pleural effusion may be also present.17,18
The septal lesions of Erdheim-Chester disease involve both lungs diffusely (Fig. 3-33), but in some cases they may predominate in the upper or lower lobes.18 In addition, the pleura and the mediastinal structures may be involved (Fig. 3-34). The superior vena cava, along with the pulmonary trunk and main arteries, may be “coated” by anomalous tissue, and in case of severe involvement, a reduction of the vascular lumen is also possible. The cardiac involvement may be endocardial or myocardial (not visible with HRCT) or pericardial, the latter being the most frequent and best visible on images, thanks to the contrast provided by the adjacent pericardial fat19 (see Fig. 3-34).
Subset Nodular
The interstitial compartments are thickened in nodular form, testifying to the existence of locally growing cells or extracellular deposits within the interstitial boundaries20 (Fig. 3-35). Being interstitial, these nodules are dense with well-defined margins2 (Fig. 3-36), embedded as they are inside thickened interlobular septa and interstitial lines with an overall beaded appearance.21
Lymphoid interstitial pneumonia is a multifaceted disease that may present with different patterns, including septal. However, it tends to show more often nodules along lymphatic routes, so it has been placed in the Nodular Pattern, subset Lymphatic. Diseases in the Septal Pattern, subset Nodular, are listed in Box 3-3.
Diffuse Interstitial Amyloidosis
The diffuse interstitial form of amyloidosis is characterized by smooth or nodular septal, peribronchovascular, and subpleural thickening, frequently (50%) associated with well-defined subpleural nodules that are often calcified (Fig. 3-37).22,23 The lesions of diffuse pulmonary amyloidosis show a basal and peripheral prevalence24 (Fig. 3-38).
Figure 3-38 This is a more basal scan from the same patient as in Figure 3-37. Bull’s-eye, liver; sun, heart.
The key to the diagnosis is the existence of subpleural, confluent, calcified consolidations (Fig. 3-39). Associated findings are lymph node enlargement and unilateral or bilateral pleural effusions.25 Tracheobronchial involvement may be also present, with thickening of the tracheal and bronchial walls due to deposition of amyloid.
Fibrotic Pattern
Definition
A fibrotic pattern is present when signs of retraction and remodeling of thoracic structures are recognizable at the lobular level and/or in correspondence of larger portions of lung (Fig. 3-40).
High-Resolution Computed Tomography Signs
Irregular linear opacities (irregular reticulation) are criss-crossing, not uniform, wavering, white lines that appear as though they were traced by an unsteady hand on the lung background (Fig. 3-41). Sporadically, one could imagine that one or more of these lines represent remnants of interlobular septa (interlobular reticulation), but the visibility of interlobular septa is not the rule. On the contrary, the distortion due to fibrosis tends to reduce the recognition of the lobular architecture.2 Most of these lines criss-cross spaces of lobular size, so they are also called intralobular reticulation (see Fig. 3-41).
The vessels may appear enlarged with shaggy margins (interface sign), and the bronchi are irregularly ectatic with thickened walls and a winding or corkscrew appearance (Fig. 3-42). In the periphery of the lung, the bronchioles may be also ectatic (so visible) with the same appearance (traction bronchiectasis and bronchiolectasis) (see Fig. 3-41). Finally, parenchymal bands are long lines representing thickened connected septa marginating several lobules but also focal scarring or linear atelectasis.2
As a whole, the described lesions may vary in size and aspect, from a more-or-less coarse obvious pattern to a subtle hazy opacification of the lung referred to as fibrotic GGO that is only minimally inhomogeneous. In the latter case, ectatic bronchioles inside the GGO and superimposing irregular reticulation (indicating fibrosis) are the discriminant features26 (see Fig. 3-42).
A peculiar feature of destructive fibrosis is honeycombing. In honeycombing, small hyperlucent areas of variable size (from 2 mm to 1 cm) and shape separated by well-defined thick walls are crowded in an area where the lung architecture is lost27 (Fig. 3-43). They should be distinguished (not easy and not always possible, especially in the early cases) from also roundish or elongated, windingly linear, transparencies corresponding to ectatic bronchioles (called microscopic honeycombing by Nishimura28).
Signs of retraction and remodeling give further, at times striking, evidence of the existence of a fibrotic disorder. At the pulmonary interface, a pleural line with shaggy margins and connections with parenchymal irregular lines (interface signs) may be evident (Fig. 3-44). A thickening of the subpleural interstitium may also be obvious, as well as an increased thickness of extrapleural/mediastinal fat, the latter compensating for the shrinking lung (see Fig. 3-44). A shaggy thickening may be also observed at the interface of the visceral pleura, which becomes angulated and displaced.
When fibrosis advances, one or more lobes and even the entire lung may become reduced in size. The signs associated with this are angulation and displacement of fissures, crowding of vessels and bronchi, and mediastinal and diaphragmatic attraction toward the affected lung (Fig. 3-45).
Subset Usual Interstitial Pneumonia
The UIP subset is defined by the presence of patchy areas of irregular reticulation and gross honeycombing with prominent signs of architectural distortion (Fig. 3-46). Traction bronchiectasis and microscopic honeycombing in connection with the pathologic areas are also characteristic.28 Some GGO is possible but less extensive than the reticulation.29 Signs of retraction and remodeling of vessels, fissures, lobes, and pulmonary boundaries are common, especially in advanced cases (Fig. 3-47).
The UIP subset may be seen both in idiopathic pulmonary fibrosis (IPF) and, with identical aspects, in several CVDs or, more rarely, chronic drug toxicity. Aspects of UIP are present also in individuals who develop an acute clinical course (acute exacerbation or acceleration of IPF), where the histologic findings show superimposed features of acute lung injury; in these cases, the radiologic presentation is usually dominated by the alveolar densities of acute lung injury and it is consequently discussed under the Alveolar Pattern, subset Acute. Diseases in the Fibrotic Pattern, subset UIP, are listed in Box 3-4.
Asbestosis
The early lesions of this disease are a combination of centrilobular dotlike and branching30 opacities, which are often arranged in clusters or connected in form of subpleural curvilinear lines31 (Fig. 3-48). These nodular opacities correspond to peribronchiolar nodular fibrosis responsible also for hyperlucent areas (mosaic perfusion) of lobular size from air trapping.31 The subsequent evolution may lead to an irregular interlobular and intralobular reticulation with bronchiectasis, architectural distortion, and honeycombing.32
The lesions are predominantly or exclusively located in the subpleural lobules of the posterior regions of the lower lobes in the early phases of disease,30 but they may become more extensive as the disease progresses (Fig. 3-49).
Figure 3-49 Axial scan at the carinal level in the same patient as in Figure 3-48. At this transversal level, the fibrotic involvement of the lung is only initial, and the honeycomb changes are confined in restricted areas (arrow). Bilaterally, there are pleural plaques of typical aspect (arrowheads).
Diffuse parietal pleural thickening and pleural plaques with or without calcifications (Fig.3-50; see also Figs. 3-48 and 3-49) are considered typical of the asbestos-related disease, but not all patients with asbestosis show pleural abnormalities.2 Parenchymal bands are also characteristic of this disease (see Fig. 3-50) and may reflect thickening of interlobular septa, fibrosis along bronchovascular sheaths, coarse scars, or areas of atelectasis adjacent to pleural plaques or visceral pleural thickening.32,33
Chronic Hypersensitivity Pneumonitis
Fibrotic GGO and irregular reticulation with traction bronchiectasis and bronchiolectasis are the most common features of hypersensitivity pneumonitis, but honeycombing is also a frequent finding. Characteristically, the fibrotic lesions may be associated to a mixture of lobular areas with decreased attenuation, centrilobular nodules, and cysts inside the GGO34 (Fig. 3-51).
Both reticulation and honeycombing may prevail in the periphery of the lung and may show upper lung predominance (Fig. 3-52). However, a random distribution is also common. Lower lobe predominance is uncommon.34
Accompanying signs of retraction on the pleural surfaces and on the mediastinal profiles are generic consequences of the underlying fibrosis. Some volume loss may occur, particularly in the upper lungs35 (Fig. 3-53).
Idiopathic Usual Interstitial Pneumonia (Clinical Idiopathic Pulmonary Fibrosis)
Patchy areas of dense irregular reticulation and macro,31 as well as micro28 honeycombing alternating with normal lung (morphologic heterogeneity), are the most specific feature. Some focal areas of only slightly increased attenuation (due to uneven fibrosis) interspersed with relatively normal alveoli may coexist.28 Rugged pleural surfaces (due to the tendency for fibrosis to occur in the periphery of the secondary lobule) are very frequent.28 Characteristically, the patches of fibrosis are intermingled and sharply marginated with areas of normal parenchyma36 (Fig. 3-54).
The disease is typically subpleural,29,37 with some extension to the inner lung in connection with thickened vessels and ectatic bronchi.28 The longitudinal distribution of the lesions is interesting. Although the more complex lesions with traction bronchiectasis and honeycombing show middle and lower predominance,34 a contemporary irregular reticulation is frequently seen in the upper peripheral lung38 (Fig. 3-55). Especially in advanced fibrosis, the lung becomes smaller and the indirect signs of retraction and remodeling striking.
Focal emphysematous hyperlucencies in the upper zones of the lung28 but also inside the basal lesions are possible,39 and these may create diagnostic problems of differential diagnosis with honeycombing.40 A mild enlargement of mediastinal lymph nodes is present in approximately 70% of cases.41 Occasionally, small nodular foci of calcification25 or a disseminated dendriform pulmonary ossification42 may be found. Associated solitary pulmonary opacities from lung cancer are possible,43 as much as in all fibrotic disorders.
Some CVDs44 and, more rarely, drug reactions45 may present with aspects indistinguishable from the idiopathic UIP. Consequently, the suspicion of the underlying disorder may be formulated only on clinical grounds, but occasionally specific signs of the original disease are also seen radiologically46–48 (Fig. 3-56).
Subset Fibrotic Nonspecific Interstitial Pneumonia
The NSIP pattern is defined by the presence of homogeneous areas of GGO associated with irregular reticulation49 (Fig. 3-57). The percentage of each likely depends on the proportions of inflammation and fibrosis within the lung, and some authors have even attempted to identify definite subgroups based on the extent of reticulation and traction bronchiectasis.50 Traction bronchiectasis is characteristic (Fig. 3-58). Honeycombing, on the contrary, should be absent or minimal.51
The NSIP subset may be seen both in idiopathic NSIP and in several CVD and drug reactions, but NSIP aspects also may be present in patients with acute exacerbation of NSIP (accelerated NSIP) where the histologic findings show superimposed features of acute lung injury. In latter cases, the radiologic presentation is dominated by the alveolar densities of acute lung injury, and this is consequently discussed in the Alveolar Pattern, subset Acute. Diseases in the Fibrotic Pattern, subset Fibrotic NSIP, are listed in Box 3-5.
Box 3-5 Diseases Presenting with Fibrotic Pattern, Subset Fibrotic Nonspecific Interstitial Pneumonia
Idiopathic Fibrotic Nonspecific Interstitial Pneumonia
Characteristic features of disease include reticular/GGO opacities with homogeneous aspect in affected areas. Inside the lesions, traction bronchiectasis and bronchiolectasis are common, and their extent has been shown to be a reliable indicator of fibrosis50 (Fig. 3-59). Dense consolidations, on the contrary, are uncommon, and their presence should raise the suspicion of another disease (such as OP, chronic eosinophilic pneumonia, or bronchioloalveolar carcinoma) or, in the appropriate clinical setting, of an acute exacerbation (see Alveolar Pattern, subsets Acute and Chronic).49 Honeycombing, if present, is mild and otherwise should raise the suspicion of UIP51; however, it has been reported that, over time, a number of NSIP originally presenting with NSIP pattern progress to UIP pattern.52
The disease is bilateral and symmetric,49 involving mainly the lower lungs in more than 90% of the cases51 (Fig. 3-60), otherwise equally distributed. On the contrary, primarily upper lobe lesions are very rare.49 Axially, the pattern is diffuse in more than 50% of the cases or predominantly peripheral subpleural, but in a number of cases (20% to 43% according to some authors27,51) the immediate subpleural regions are relatively spared.
Volume loss, mostly of the lower lobes, is fairly common,51 usually in conjunction with other indirect signs of fibrosis. Lymphadenopathy is possible at the mediastinal level,49 usually mild and involving not more than two nodal stations.41
Several CVDs41 and adverse reactions to therapeutic drugs53,54 may present with aspects indistinguishable from the idiopathic NSIP. Consequently, the suspicion of the underlying disorder should be formulated on clinical grounds. Occasionally, specific signs of the original disease are visible radiologically46–49 (Fig. 3-61).
Subset Tug-of-War
Tug-of-war subset is defined by the presence of irregular linear opacities stretching between the mediastinum and the thoracic boundaries, bridging over variably involved bronchi, fissures, and more generally anatomical structures and even pathologic elements found on their way (Fig. 3-62). The mediastinal profiles are variably stretched outward and the thoracic pleural profiles inward, hence the proposal for the name of this fibrotic subset (Fig. 3-63). Diseases in the Fibrotic Pattern, subset Tug-of-War, are listed in Box 3-6.
Sarcoidosis
Fibrosis may present early in the history of the disease, when nodular elements are fairly well visible. Irregularities of the margin of the nodules, distortion of fissures, bronchial irregularities, traction bronchiectasis, and more-or-less coarse linear opacities corresponding to the fibrotic component of the disease.55 The elements of the bronchovascular bundle become crowded and show a zigzagging course with angulations55,56 (Fig. 3-64). Progressive fibrosis leads to central conglomeration of parahilar bronchi embedded in a dense agglomerate of tissue radiating from the center to the periphery.56 Honeycombing and cystic abnormalities may be also seen, but rarely the honeycombing involves mainly the lower lung zones, mimicking UIP/IPF.57
The disease shows parahilar predominance between the central and the peripheral middle and upper lung, with patchy accentuation of parenchymal distortion and severity of the lesions55,58 (Fig. 3-65).
Mediastinal lymphadenopathy frequently coexists, often calcified. CT findings suggestive of pulmonary hypertension are possible in the late disease.2 Cavitation of conglomerated masses may be seen in patients with necrotizing sarcoid granulomatosis, the entity first described by Liebow characterized by sarcoid-like granulomas and vasculitis associated with variable degrees of necrosis56 (Fig. 3-66).
Subset Bronchocentric Fibrosis
Focal fibrosis from constrictive bronchiolitis is concentrated on the bronchioli and too subtle to be appreciated radiologically. However, indirect signs of bronchial narrowing are visible, namely a patchy dark lung (Fig. 3-67). This condition is subsequently discussed in the Dark Lung Pattern.
Pulmonary Langerhans cell histiocytosis, also a prominently centrilobular fibrotic process, on the contrary is well visible in form of thick walls around enlarged airways (Fig. 3-68) that assume early a cystic aspect.59 Consequently, its insertion in the cystic pattern has been considered more suitable. Diseases in the Fibrotic Pattern, subset Bronchocentric Fibrosis, are listed in Box 3-7.
Airway-Centered Interstitial Fibrosis
The main findings of airway-centered interstitial fibrosis are peribronchovascular interstitial thickening with traction bronchiectasis, thickened airway walls, and surrounding dense tissue with irregular margins (Fig. 3-69). Bronchiolectasis and honeycombing may also occur in a limited number of cases. GGO, poorly defined centrilobular micronodules, and lobular air trapping with the mosaic attenuation of the dark lung pattern are lacking.59
The lesions show a central rather than a peripheral distribution. They consistently show scarring around the airways60 (Fig. 3-70).
Nodular Pattern
Definition
A nodular pattern is defined by the presence of multiple roundish opacities ranging in diameter from 2 to 10 mm (Fig. 3-71).
High-Resolution Computed Tomography Signs
On HRCT, lung nodules appear as white, roundish lesions with variable morphology and lobular distribution, depending on the route of arrival and on the modality of spread.2,7,61
Nodules that have low-density and ill-defined margins (nodular GGO) have a characteristic soft aspect, like snowflakes (Fig. 3-72). Sometimes they are very tiny and difficult to recognize.20 They are commonly seen in patients with disease that primarily affects centrilobular bronchioles and the immediate area around them. The low-density CT aspect is due to minimal thickening of the peribronchiolar interstitium or partial filling of the peribronchiolar alveoli.2 Both conditions are below the CT spatial resolution, and thus the common final effect is a focal low-density lesion. The ill-defined margins are due to progressive reduction of interstitial or alveolar involvement extending away from the centrilobular area to the periphery. These types of nodules may coalesce, resulting in the appearance of extensive GGO.
Nodules with high-density and well-defined margins are commonly seen in patients with diseases primarily affecting the interstitium and growing spherically in it surrounded by aerated parenchyma.2,61 They present a solid aspect like opaque beads and obscure the edges of vessels or other structures that they touch (Fig. 3-73). They may have regular or lobulated contours, the latter aspect secondary to asymmetrical growth. The nodules may coalesce with development of larger opacities or pseudoplaques along the costal or fissural margins.62
On occasion, the nodules may have shaggy profiles, especially in diseases with a fibrotic component (Fig. 3-74). The existence of small black areas inside these high-density nodules may be due to necrosis (see Fig. 3-74) or traction bronchiolectasis. The presence of faint increased lung attenuation around the nodules (halo sign) is most often an expression of hemorrhage (see Fig. 3-74) or of inflammatory infiltrates from any origin.62,65 Regarding the lobular distribution, this is the result of the route of arrival and of their modality of spread, both underlying their distinction in subsets.
