CHAPTER 115 Computed Tomographic Angiography of the Lower Extremities
Computed tomographic angiography (CTA) is at the forefront of noninvasive assessment of the peripheral arteries (CTA runoff).1 The advantage of CTA over catheter angiography is the absence of complications attributed to its more invasive predecessor, such as pseudoaneurysm and arteriovenous fistula.2 In addition, CTA requires a shorter stay for the patient, is less costly than catheter angiography, and has the potential to be more cost-effective than magnetic resonance angiography (MRA).3
With the aid of postprocessing tools now available, CTA is able to provide the interpreting physician and vascular surgeon with information concerning the site of obstruction, extent of vascular disease, and strategy for the appropriate type of vascular intervention.4
TECHNICAL REQUIREMENTS
An appropriate CTA protocol must provide both large field of view coverage and spatial resolution optimized for maximal contrast agent bolus enhancement of the arterial tree while minimizing ionizing radiation exposure and contrast agent dose.1
The individual requirements are as follows:
TECHNIQUES
Indications
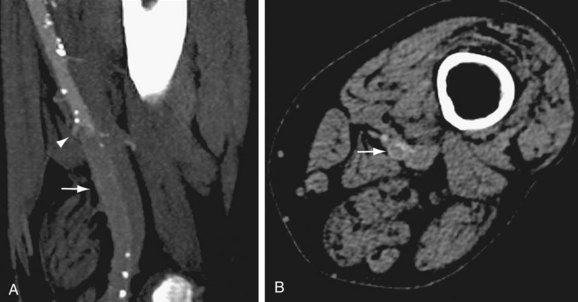
 FIGURE 115-1
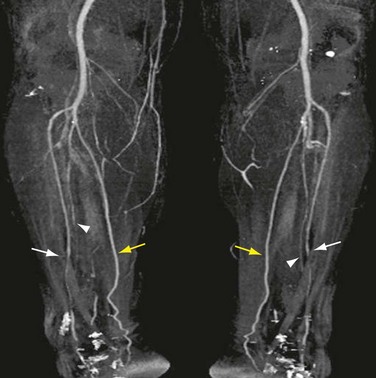
 FIGURE 115-2
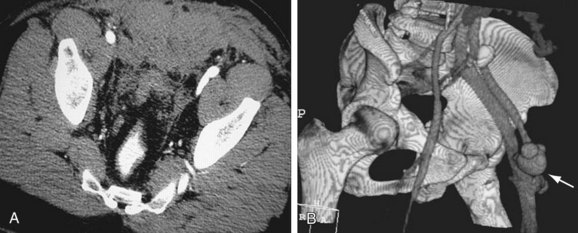
 FIGURE 115-3
 FIGURE 115-4
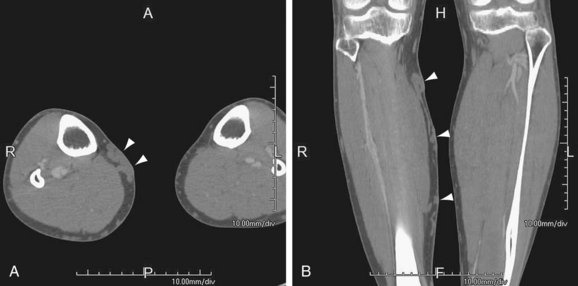
 FIGURE 115-5
By far, the most common indication is peripheral arterial disease (also known as peripheral arterial occlusive disease) in both the acute and chronic setting and in patients for follow-up and surveillance after surgical or percutaneous revascularization (Figs. 115-6 and 115-7).
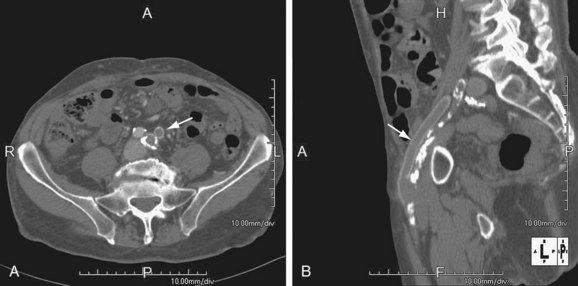
 FIGURE 115-6
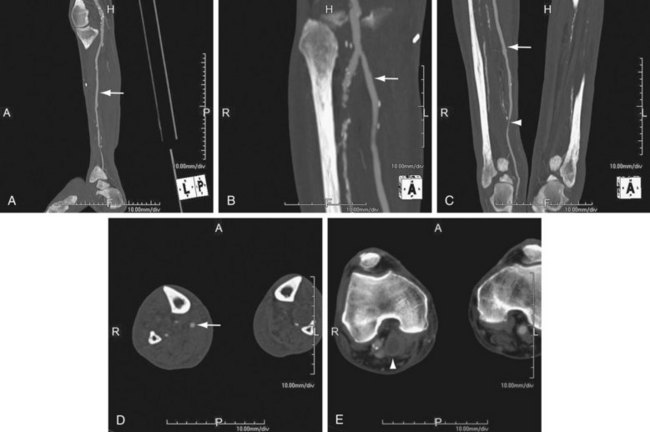
 FIGURE 115-7
Contraindications
Renal Impairment
The ultimate decision to administer an intravenous contrast agent is a shared one between the interpreting physician and the referring physician after informed consent of the patient in the event of renal impairment. The timing of dialysis in relation to the time of the scan is of importance. MRA is an option and may have to be performed without intravenous gadolinium-chelate contrast agent if the patient is at risk for development of nephrogenic systemic fibrosis (e.g., glomerular filtration rate less than 30 mL/min/1.73 m2).11
Orthopedic Hardware or High-Attenuation Object
Although it is not technically a contraindication, the artifact resulting from a high-attenuation object12 may obscure the artery of interest and limit the utility of the examination. Catheter angiography may be required because MRI may also be inflicted with significant artifact in such situations (Fig. 115-8).
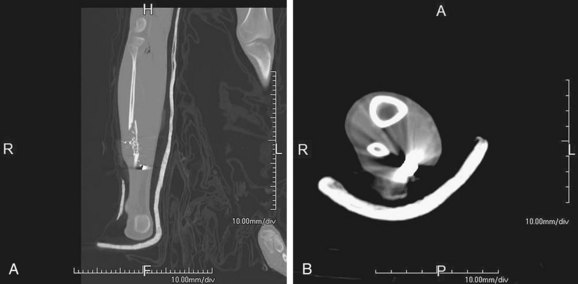
 FIGURE 115-8
Technique Description
Technique involves image acquisition and contrast agent administration.
Image Acquisition
Field of View
The field of view must answer the clinical question and provide information about associated vascular pathologic changes that would affect management. In the case of peripheral arterial occlusive disease, such as in patients with claudication, this involves the assessment of the abdominal aorta to assess the inflow and to exclude coexisting abdominal aortic aneurysm (Fig. 115-9).
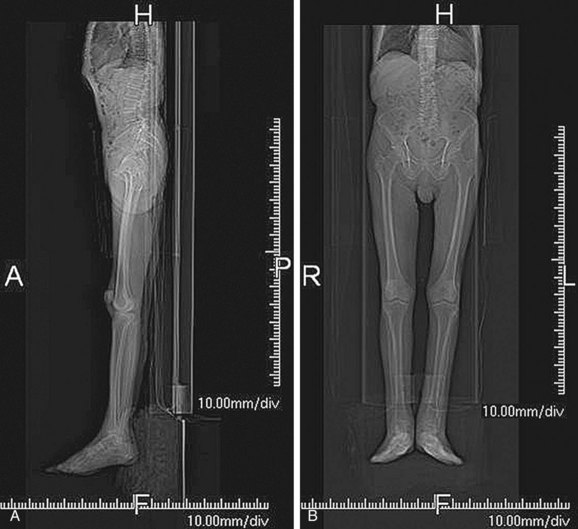
 FIGURE 115-9
An initial image through the abdomen and pelvis before the administration of the contrast agent is followed by arterial phase images from the celiac artery origin to the toes in a single acquisition. An immediate second acquisition is prudent through the calves, particularly with the newer scanners, in which outrunning of the contrast bolus can be a problem. Venous phase images are not routine and are obtained as clinically necessary. Breath-hold is required for the acquisition through the abdomen and pelvis.1,13
It is important to keep the patient’s knees and legs together, close to the isocenter. Excessive plantar flexion can erroneously depict occlusion of the dorsalis pedis and should be avoided.14
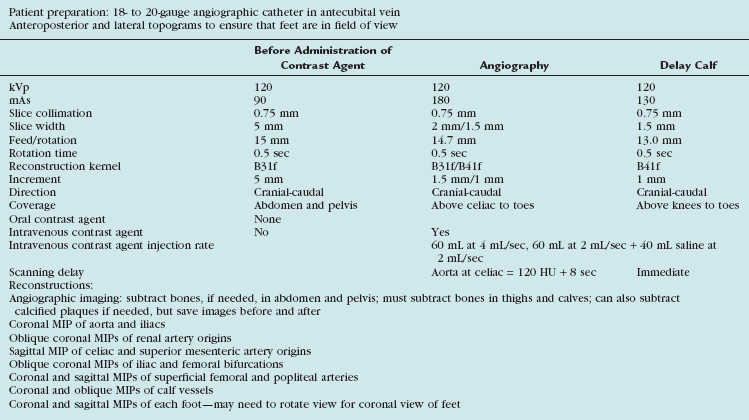
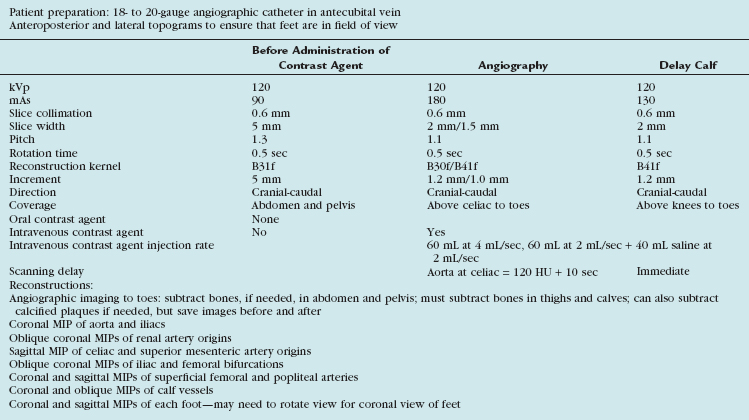
Scanning Protocols
The acquisition parameters depend on the number of detectors and are vendor specific (Tables 115-1 and 115-2). Regardless, the scan time should be such that the entire arterial tree of interest is covered in a reasonable time during which the arteries remain maximally opacified (i.e., in the first and single pass of contrast bolus). With the latest multidetector CT scanners, this does not involve a tradeoff between spatial resolution and z-axis coverage. With the 4-detector CT, a choice usually needs to be made, as will be explained.
Background Principles
Further discussion of this area involves recapitulation of some concepts.
Increasing the pitch results in the following:
A pitch greater than 1 broadens the slice sensitivity profile and in essence increases the effective section thickness.12
The optimal number of detectors that can provide sub-millimeter isotropic spatial resolution and coverage in a reasonable time without outrunning the bolus or incurring venous enhancement is 16 detectors. For proper visualization of the suprageniculate arteries in the absence of heavy calcification, a 4-detector scanner with 2.5-mm detector width can suffice. As a general rule, the larger the detector configuration, the lower the scanning pitch and the slower the gantry rotation speed.1
Reconstruction Parameters
The major parameters in reconstruction are section thickness, overlap, and kernel.
The section thickness determines the through-plane spatial resolution (i.e., z-axis spatial resolution). Of course, having a thinner section (within the limits of the detector size) would mean a higher spatial resolution, but with the attendant increase in noise that may detrimentally affect both the signal-to-noise and contrast-to-noise ratios (Fig. 115-10). Thus, an optimal spatial resolution, which depends on the diameter of the smallest vessel that needs to be resolved, must be sought.
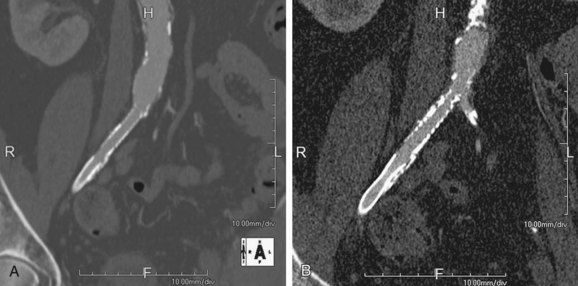
 FIGURE 115-10
Some degree of overlap of the reconstructed images is beneficial because it allows smoother three-dimensional reformats with minimal stair-step artifacts on oblique imaging views (Fig. 115-11).
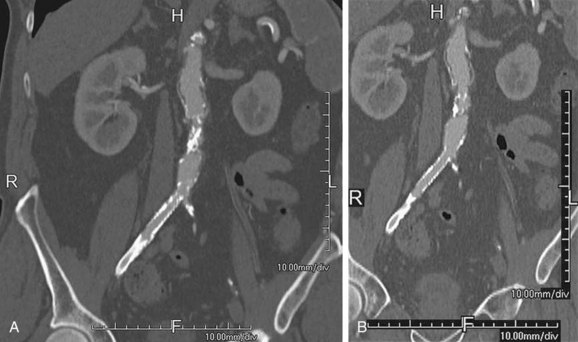
 FIGURE 115-11
Contrast Bolus Considerations
Preferably, the contrast agent is administered through a 20-gauge antecubital peripheral venous catheter by means of a dual-chamber injector. The trick is to time the CT image acquisition with the peak contrast agent concentration in the target arteries. Of note, the acquisition does not follow the real-time first pass of the contrast agent through the arterial tree because such a task would require coordination of unattainable precision. Rather, the acquisition images the arteries during the period that the arteries are enhanced (“the contrast hangs around”). There are two approaches to ensure accurate timing1: bolus tracking and test bolus.
Bolus Tracking Technique
In bolus tracking (Figs. 115-12 and 115-13), a tracker (i.e., monitoring region) is set at an operator-determined location in the target arterial tree. This technique is automated; the scanner performs serial imaging of that tracker location, and the density within the tracker location is monitored. When the density of the tracker region of interest exceeds a predetermined threshold (e.g., 130 HU), CT scanning begins, typically after an operator-determined delay period (e.g., 5 seconds). The advantage of bolus tracking is its automated nature and resulting ease of operation. The disadvantage is its generalization and therefore inability to adapt to a patient’s circulatory time. This may be important in patients with poor circulatory times, such as patients with heart failure or large aortic aneurysms.
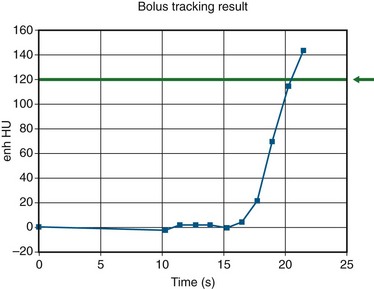
 FIGURE 115-12
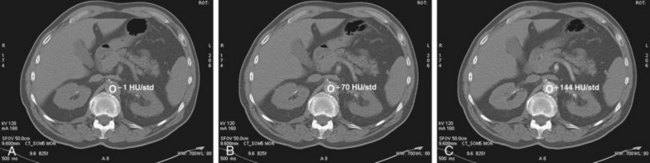
 FIGURE 115-13
Pitfalls and Solutions
Acquisition Considerations
Poor image quality can result from poor synchronization of the peak maximal enhancement of arteries and image acquisition. Basically, the acquisition may have occurred too early or too late.1
Too early an acquisition may be due to scan parameters or patient factors. The scan parameters that predispose to premature acquisition include large detector collimation, fast gantry rotation, and high scanning pitch, essentially translating into faster anatomic coverage (i.e., scanning speed). The important patient factors to be appreciated are reduced cardiac function, increased volume of distribution resulting in contrast bolus dilution (e.g., aortic aneurysm), and steno-occlusive disease that delays contrast transit and can be strikingly asymmetric (Fig. 115-14).
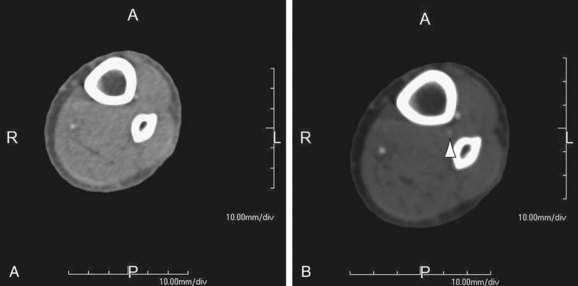
 FIGURE 115-14
The major problem with late acquisition is venous enhancement (or venous contamination). Patient factors that lead to venous contamination include (1) rapid venous filling due to regional hyperemia from inflammation, such as from an infected foot ulcer (a common situation in arteriopaths; Fig. 115-15), and (2) arteriovenous communication, such as an arteriovenous fistula or arteriovenous shunts, in the setting of severe occlusive disease.17
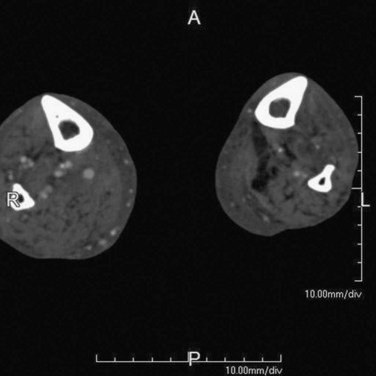
 FIGURE 115-15
The point to be emphasized is that venous contamination can often be due to vascular pathologic processes and should not lead to a knee-jerk criticism of the technique or technologist. Appreciation of lower extremity vascular anatomy with cognizance of the fact that deep veins travel in pairs (venae comitantes) should allow distinction between veins and arteries in the cruropedal region by the experienced interpreter (Fig. 115-16). In addition, unlike MRA, CTA images generally have sub-millimeter resolution in the axial plane, where the arteries and veins can be viewed without overlap.
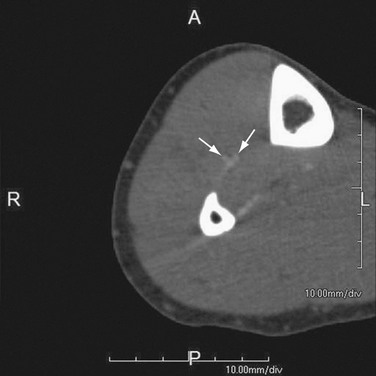
 FIGURE 115-16
Interpretation Considerations
The most important problem in interpretation is the overestimation of stenoses due to calcification.12 Calcium or any high-attenuation structure leads to the following:
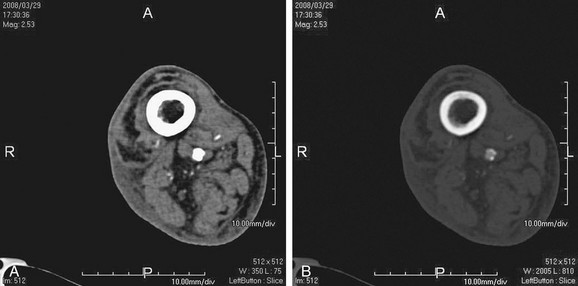
 FIGURE 115-17
Image Interpretation
Postprocessing
The progress in three-dimensional image processing has created a worthy discipline in its own right and has revolutionized the handling of the extremely large data sets that accompany high-resolution and large field of view study, such as a peripheral CTA runoff examination.1,19
The following are basic principles to be appreciated.
Multiplanar Reformation
Curved multiplanar reformation lacks spatial perception, a problem that can be somewhat circumvented by the use of multipath curved planar reformation (Fig. 115-18).20
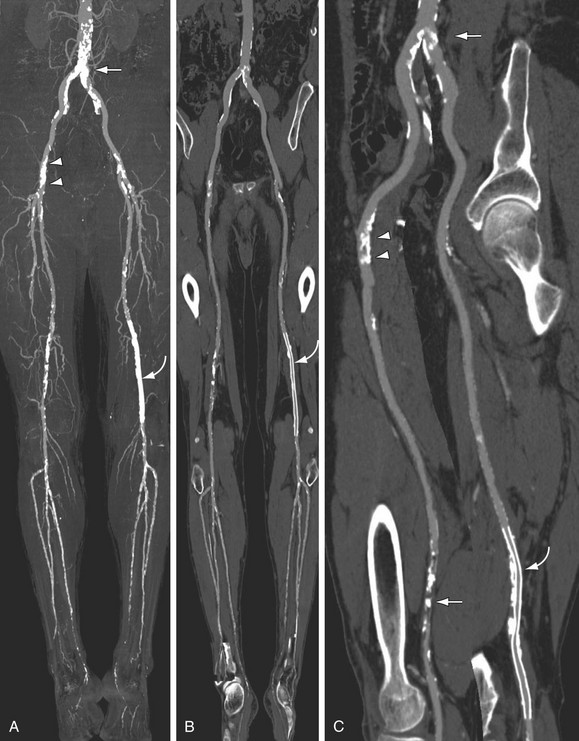
 FIGURE 115-18
Maximum Intensity Projection
MIP processing will produce images similar to those of conventional angiography. MIP algorithms choose the highest attenuation voxels for projectional display in a prespecified volume, which would mean an accurate outline of arteries except that voxels from bone (necessitating bone editing) and other high-attenuation structures such as metal are often featured with disproportionate contribution. MIP provides an overview that is essential in conveying a large amount of clinical information in a single picture, including the presence of collaterals and the status of branch vessels. However, the technique can be misleading in terms of the degree of narrowing if there is extensive calcified atherosclerotic plaque, which is common at ostial segments in patients with atherosclerosis. MIP viewing may result in difficult interpretation in regions of calcified atherosclerotic plaque and in regions in which vessels travel in and out of the prescribed volume. Another pitfall of MIP is that it does not provide depth perception (Figs. 115-19 to 115-21).
 FIGURE 115-19
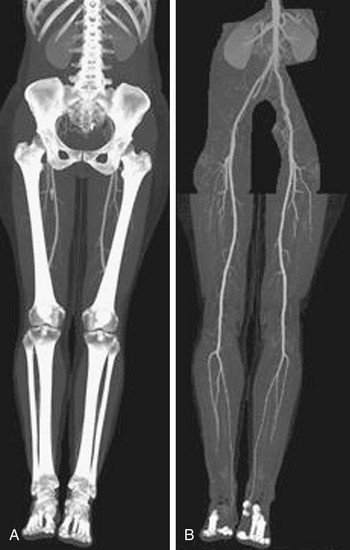
 FIGURE 115-20
 FIGURE 115-21
Volume Rendering
As the name suggests, volume rendering uses the entire imaging volume (Fig. 115-22). Automated or manual assignment gives a tissue with a certain attenuation range a color and a level of transparency. For example, to visualize arteries separate from neighboring bone, volume rendering processing can be performed to designate that the tissue is red with no transparency between 200 and 500 HU and that the tissue is white with 100% transparency above 1000 HU. However, tissue attenuation values are a continuum with overlap of CT densities of plaque, iodinated contrast agent, and bone. Thus, accurate angiographic display of CTA data may still require a fair amount of manual and automatic editing of unwanted structures, making the process quite time-consuming even for the seasoned three-dimensional postprocessing operator.
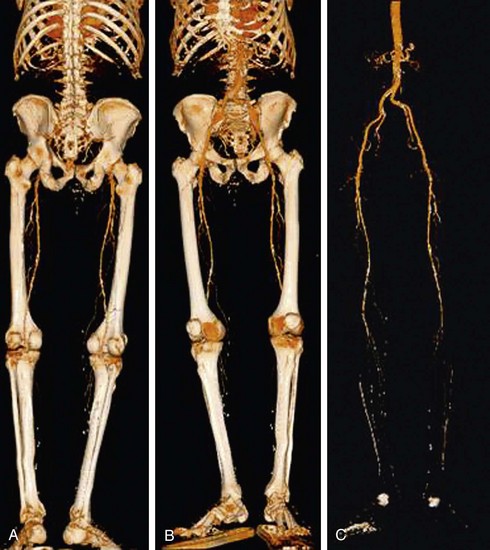
 FIGURE 115-22
Reporting
Reporting of imaging findings must convey to the referring physician information that aids in diagnosis, prognosis, and treatment planning. Interpreters of peripheral CTA examinations should be familiar with the recommendations of the TransAtlantic Inter-Society Consensus.21 The Consensus document provides recommendations on the nature of intervention based on the location and length of the obstruction, among other factors, such as the status of the distal runoff and of the proximal inflow vasculature, and the presence and eccentricity of calcified plaque. The interpreter should avoid merely providing a litany of stenoses but attempt to think like a vascular surgeon in reporting peripheral CTA results (Fig. 115-23).
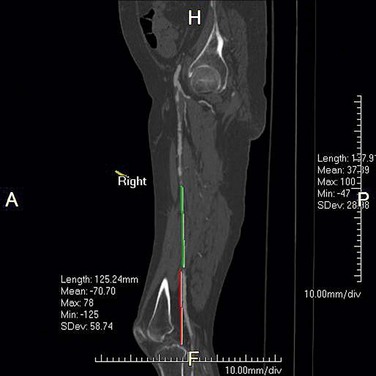
 FIGURE 115-23 The report of a CTA runoff must contain information that assists the vascular surgeon with both diagnosis and treatment planning. The length of an occluded segment and the distance of the reconstituted segment from a bone landmark must be included, as should the status of the runoff. In the patient shown in Figure 115-2, for example, the posterior tibial arteries were patent in their entirety and would be the choice of distal attachment for a bypass of the mid superficial femoral artery occlusion. The anterior tibial and peroneal arteries were severely narrowed or occluded for most of their course.
The report can be broadly divided into the following categories:
The arterial tree is best subdivided into the following:
Patency can be described in the following manner:
When a vessel is occluded or has critical stenosis, it is important to state the following:
For the quantification of the degree of stenosis, the diameter or area of the artery in the diseased segment (L) is compared with the diameter or area of the artery in the healthy arterial segment (R). Percentage stenosis is calculated as (1 − L/R) × 100 (Fig. 115-24). Although measurement of area stenosis is more accurate than measurement of diameter stenosis, it is the consistency of measurement that is more important.22
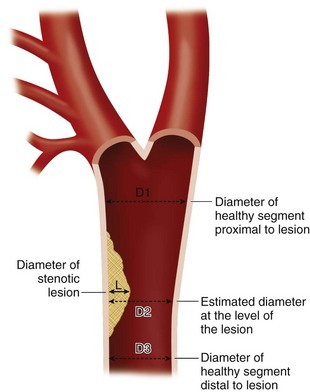
 FIGURE 115-24


Fleischmann D, Hallett RL, Rubin GD. CT angiography of peripheral arterial disease. J Vasc Interv Radiol. 2006;17:3-26.
Ota H, Takase K, Rikimaru H, et al. Quantitative vascular measurements in arterial occlusive disease. Radiographics. 2005;25:1141-1158.
Roditi GH, Harold G. Magnetic resonance angiography and computed tomography angiography for peripheral arterial disease. Imaging. 2004;16:205-229.
1 Fleischmann D, Hallett RL, Rubin GD. CT angiography of peripheral arterial disease. J Vasc Interv Radiol. 2006;17:3-26.
2 Waugh JR, Sacharias N. Arteriographic complications in the DSA era. Radiology. 1992;182:243-246.
3 Visser K, Kock MC, Kuntz KM, et al. Cost-effectiveness targets for multi-detector row CT angiography in the work-up of patients with intermittent claudication. Radiology. 2003;227:647-656.
4 Schernthaner R, Fleischmann D, Lomoschitz F, et al. Effect of MDCT angiographic findings on the management of intermittent claudication. AJR Am J Roentgenol. 2007;189:1215-1222.
5 Chow LC, Napoli A, Klein MB, et al. Vascular mapping of the leg with multi-detector row CT angiography prior to free-flap transplantation. Radiology. 2005;237:353-360.
6 Fleiter TR, Mervis S. The role of 3D-CTA in the assessment of peripheral vascular lesions in trauma patients. Eur J Radiol. 2007;64:92-102.
7 Hyodoh H, Hori M, Akiba H, et al. Peripheral vascular malformations: imaging, treatment approaches, and therapeutic issues. Radiographics. 2005;25:S159-S171.
8 Karcaaltincaba M, Aydingoz U, Akata D, et al. Combination of extremity computed tomography angiography and abdominal imaging in patients with musculoskeletal tumors. J Comput Assist Tomogr. 2004;28:273-277.
9 Chew FS, Bui-Mansfield LT. Imaging popliteal artery disease in young adults with claudication: self-assessment module. AJR Am J Roentgenol. 2007;189(Suppl):S13-S16.
10 Takase K, Imakita S, Kuribayashi S, et al. Popliteal artery entrapment syndrome: aberrant origin of gastrocnemius muscle shown by 3D CT. J Comput Assist Tomogr. 1997;21:523-528.
11 http://www.fda.gov/CDER/drug/InfoSheets/HCP/gccaHCP.htm. Accessed May 13, 2008
12 Multidetector CT—Principles and Protocols. Knollman F. Coakley FV. 2005. Elsevier. Philadelphia.
13 Rubin GD, Schmidt AJ, Logan LJ, Sofilos MC. Multi-detector row CT angiography of lower extremity arterial inflow and runoff: initial experience. Radiology. 2001;221:146-158.
14 Hartnell GG. Contrast angiography and MR angiography: still not optimum. J Vasc Interv Radiol. 1999;10:99-100.
15 Fleischmann D. Use of high-concentration contrast media in multiple-detector-row CT: principles and rationale. Eur Radiol. 2003;13(Suppl 5:M14-M20.
16 Fleischmann D, Rubin GD, Bankier AA, Hittmair K. Improved uniformity of aortic enhancement with customized contrast medium injection protocols at CT angiography. Radiology. 2000;214:363-371.
17 Milne EN. The significance of early venous filling during femoral arteriography. Radiology. 1967;88:513-518.
18 Johnson TR, Krauss B, Sedlmair M, et al. Material differentiation by dual energy CT: initial experience. Eur Radiol. 2007;17:1510-1517.
19 Fishman EK, Ney DR, Heath DG, et al. Volume rendering versus maximum intensity projection in CT angiography: what works best, when, and why. Radiographics. 2006;26:905-922.
20 Roos JE, Fleischmann D, Koechl A, et al. Multipath curved planar reformation of the peripheral arterial tree in CT angiography. Radiology. 2007;244:281-290.
21 Norgren L, Hiatt WR, Dormandy JA, et al. TASC II Working Group. Inter-Society Consensus for the Management of Peripheral Arterial Disease (TASC II). J Vasc Surg. 2007;45(Suppl S):S5-S67.
22 Ota H, Takase K, Rikimaru H, et al. Quantitative vascular measurements in arterial occlusive disease. Radiographics. 2005;25:1141-1158.
