[level-membership-for-cardiovascular-category]
Chapter 14 Computed Tomographic Angiography
Volumetric data acquisition with multidetector computed tomography (MDCT) has enabled the development of computed tomographic angiography (CTA), a diagnostic modality that has clearly revolutionized the diagnosis of vascular disorders. Adequate imaging of the peripheral vascular system during a single acquisition and a single injection of contrast medium became feasible with the introduction of a 4-slice computed tomography (CT) system with a 0.5-second gantry rotation (thinnest collimation 4 × 2.5 mm) in 1998.1 The introduction of 8-slice CT in 2000 enabled shorter scan times, but did not yet provide improved longitudinal resolution (thinnest collimation 8 × 1.25 mm). The introduction of 16-slice CT made it possible to routinely acquire substantial anatomical volumes with isotropic sub-millimeter spatial resolution.2 Computed tomographic angiography scans of the peripheral vasculature could now be routinely acquired with 16 × 0.625 mm or 16 × 0.75 mm collimation, which provided the level of resolution required to investigate small-vessel involvement (<1 mm).
Fundamentals of Computed Tomography Imaging
Major Components of a Computed Tomography Scanner
The major components of a CT scanner are an x-ray tube and generator, a collimator, and photon detectors. These components are mounted on a rotating gantry where the x-ray tube produces the x-rays necessary for imaging. The pre-detector collimator helps shape the x-ray beams that emanate from the x-ray tube in order to cut out unnecessary radiation. The detectors consist of multiple rows of detector elements (>900 elements per row in current scanners) that receive x-ray photons that have traversed through the patient, with the post-detector collimators preventing backscatter, which degrades image quality. Newer scanners have as many as 320 detector rows, and the width of each detector (“detector collimation”) has decreased from 2.5 mm in 4-slice systems to 0.5 mm. The most important benefit of increasing the detector rows is increased coverage per gantry rotation (a 320-row detector CT with a detector width of 0.5 mm will have 160 mm z-axis coverage). The submillimeter detector width improves spatial resolution in the z-axis, while increased coverage shortens scan time. Each detector element contains radiation-sensitive solid state material (e.g., cadmium tungstate, gadolinium oxide, gadolinium oxysulfide) that converts the absorbed x-rays into visible light.3 The light is then detected by a silicone photodiode, amplified, and converted into a digital signal.
Gantry rotation time determines the temporal resolution of the images, with older scanners having a rotation time of 0.75 seconds, and more contemporary scanners a rotation time of 0.33 seconds.2 The temporal resolution of a single source scanner, one x-ray generator mounted on the gantry, is slightly higher than half the time it takes for the gantry to rotate 360 degrees. Thus a 0.33-second gantry rotation will effectively provide a temporal resolution of 0.17 seconds. With a dual-source scanner, two x-ray generators mounted on the gantry, the temporal resolution will improve by a factor of two.

Electrocardiographic Gating
Electrocardiographic gating is a method of gating imaging events to portions in the cardiac cycle where motion may be minimal, namely diastole. Electrocardiographic gating is indispensable for coronary imaging and vascular structures that are prone to cardiac motion artifact, such as the ascending aorta. The two most common ECG gating methods are retrospective and prospective gating. With traditional spiral scanning, ECG gating is performed retrospectively, where the data and ECG information are acquired, and subsequent reconstructions can be performed at various time points in the R-R interval.4 Compared to prospective ECG gating, which is the method used for axial scanning, the scan is triggered at the R wave, and image acquisition occurs at a fixed point in the cardiac cycle. However, with recent advances in CT imaging, it is now possible to perform a prospectively ECG-triggered helical scan using high pitch with extremely low radiation exposure.5 These have been referred to as flash scans and are gaining significant popularity for coronary imaging.
Contrast Administration
All angiographic x-ray contrast remains in the extracellular space and rapidly distributes between the intravascular and extravascular spaces immediately after intravenous (IV) administration.6 It is the process during the early phase of rapid contrast distribution and redistribution that determines vascular enhancement. Vascular enhancement differs significantly from parenchymal (soft tissue) enhancement characteristics. The two key components that determine arterial enhancement are the amount of contrast per unit time (mL/s) and the duration of administration (seconds). The resulting product of the two is the volume of contrast (flow rate × duration). For example, 100 mL of contrast media given at 5 mL/s will require 20 seconds to deliver. The relationship between flow rate, volume of contrast, and duration of administration is the most important concept to understanding injection protocols for vascular imaging.
Currently, low or isoosmolar nonionic contrast agents are the most commonly used for CTA. It is imperative to assess renal function prior to administration of contrast so decisions can be made in regard to prophylactic measures, type of contrast used, and whether the study should be cancelled. Contrast is given IV using a power injector. Since contrast arrival time to the region of interest may vary, appropriate timing must be determined by using a test bolus or automated bolus tracking technique.7 The less common technique of using a test bolus is performed by giving a small dose of contrast material and determining the time it takes for the region of interest to opacify. More commonly, a triggered or automated bolus tracking technique is used, where a region of interest is drawn on the aorta closest to the area of interest. A repetitive low-dose acquisition is acquired 5 to 10 seconds after contrast administration until a given HU threshold is achieved (typically 110 HU). The actual CTA will be acquired once this threshold is obtained. The typical volume of contrast used is 100 to 120 mL, with an iodine concentration between 320 and 370 mg/mL, administered at a rate of 4 mL/s and followed by a saline flush.
Image Reconstruction at the Scanner Console
Various image reconstruction filters are offered by each manufacturer. Filters are referred to as sharp or soft. Sharper reconstruction filters will provide more details but also more noise and are best for assessment of stents and areas of calcification. Softer reconstruction filters provide less image detail but less noise as well. Soft to medium filters are usually used for most CTA applications. Image reconstruction can also be performed at different cardiac phases of cardiac-gated acquisitions. It may be important in assessment of coronary anatomy in cases of thoracic aortic dissection and thoracic aortic aneurysms.8 This is most important for cardiac CTA where coronary anatomy may have to be assessed at different phases to ensure accurate delineation of coronary stenosis. When ECG-gated thoracic aortic imaging is performed, various phases can be reconstructed to assess the aorta.
Image Postprocessing
Similar to vascular magnetic resonance angiography (MRA) (see Chapter 13), multiple postprocessing techniques can be used in vascular CTA to assess the hundreds to thousands of images generated. Usually two data sets are reconstructed: thick and thin sets. The thick set (5.0 mm) is used for general assessment, whereas the thin set (0.5-0.75 mm) is better suited for detailed evaluation. Image formats used for evaluation include (1) multiplanar reformats (MPR), (2) maximal intensity projections (MIP), (3) curved planer reformats (CPR), (4) volume rendering (VR), and (5) shaded surface display (SSD). Please refer to Chapter 13 for a description of these techniques.
Radiation Exposure and Radiation Dose Reduction
Radiation exposure of the patient during CT and the resulting potential radiation hazards has recently gained considerable attention from both the public and the scientific literature.9–12Radiation exposure is defined as the total charge of ions produced in a unit of dry air by a given amount of x-ray or γ-ray irradiation. In the International System of Units (SI), exposure is measured in terms of coulombs (C)/kg or amperes (A) .s/kg. Exposure is also commonly measured in units of roentgens (R), where 1 R equals 2.58 × 10− 4 C/kg. Absorbed dose is the energy imparted to a volume of matter by ionizing radiation, divided by the mass of the matter. The SI unit of absorbed dose is the gray (Gy), where 1 Gy equals 1 joule (J)/kg. The traditional unit is the rad, short for radiation absorbed dose, which equals 1 cGy or 10− 2 Gy. Although absorbed dose is a useful concept, the biological effect of a given absorbed dose varies depending on the type and quality of radiation emitted. A dimensionless radiation weighting factor is used to normalize for this effect, where the weighting factor ranges from 1 for photons (including x-rays and γ-rays) and electrons to 20 for α particles. The sievert (Sv), a special SI unit to represent equivalent dose, was adopted to avoid confusion with absorbed dose. One Sv equals 1 J/kg. The traditional unit for equivalent dose is the rem, short for roentgen equivalent man. One rem equals 1 cSv, or 10− 2 Sv. Equivalent dose multiplied by the tissue-weighting factor is often termed weighted equivalent dose, properly measured in Sv or rem. The sum of the weighted equivalent dose over all organs or tissues in an individual is termed the effective dose (E).13
Computed Tomography–Specific Dosimetry
In addition to the nomenclature for radiation dosimetry described above, a particular set of terms has been developed for CT.14 The dose profile (D[z]) for a CT scanner is a mathematical description of the dose as a function of position on the z axis (perpendicular to the tomographic plane). The CT dose index (CTDI), measured in Gy, is the area under the radiation dose profile for a single rotation and fixed table position along the axial direction of the scanner, divided by the total nominal scan width or beam collimation. CTDI is difficult to measure and therefore not commonly reported; instead, the CTDI100 is measured. CTDI100 represents the integrated radiation exposure from acquiring a single scan over a length of 100 mm. To estimate the average radiation dose to a cross-section of a patient’s body, a weighted CTDI (CTDIw) is calculated. This is determined by the equation:


where EDLP, measured in units of mSv / (mGy ∙ cm), is a body region–specific conversion factor. The most commonly used EDLP values are reported in the 2004 CT Quality Criteria.15 These EDLP values are determined using Monte Carlo methods averaged for multiple scanners.
Dose Reduction Techniques
There are several ways to lower the dose delivered to a patient.14,16 These methods can be used either in isolation or combined to exponentially lower exposure. Reducing tube current will lead to a direct reduction in radiation dose to a patient. However, a conscious decision must be made as to whether the tradeoff in radiation reduction outweighs image quality. This becomes very important in obese patients, where reduction in tube current may result in rather poor images. The contrast-to-noise ratio increases with decreasing x-ray tube voltage.5 As a consequence, to obtain the adequate contrast-to-noise ratio, the dose to the patient may be reduced by lowering the kV setting. There is nearly a 50% reduction in radiation exposure when using 80 kV instead of 120 kV when performing CTA. A recent study recommends 100 kV as the standard mode for aortoiliac CTA, and reports dose savings of 30% without loss of diagnostic information.17
Electrocardiographic-controlled dose modulation is a method employed during continuous imaging with retrospective studies. Typically the output is kept at its nominal value during a user-defined phase (in general, the mid- to end-diastolic phase), while during the rest of the cardiac cycle, the tube output is reduced to 20% of its nominal value to allow for image reconstruction throughout the entire cardiac cycle. Using this technique, dose reduction of 30% to 50% has been demonstrated in clinical studies.18–22
Anatomical tube current modulation is a technique adapted to the patient’s geometry during each rotation of the gantry. Tube output is modulated on the basis of the tissue attenuation characteristics of the localizer scan or determined online by evaluating the signal of a detector row. By employing such a technique, dose can be reduced by 15% to 35% without degrading image quality, depending on the body region.23 A more sophisticated variation of anatomical tube current modulation varies tube output according to patient geometry in the longitudinal direction so as to maintain an adequate dose when moving to different body regions—for instance, from thorax to abdomen (automatic exposure control).23 Automatic adaptation of the tube current to patient size prevents both over- and under-irradiation, considerably simplifies the clinical workflow for the technician, and eliminates the need to look up tables of patient weight and size for adjusting the mAs settings.
Clinical Applications for Computed Tomographic Angiography in Vascular Disease
Computed Tomographic Angiography of the Neurovascular Circulation
Technical considerations
Computed tomographic angiography is comparable to digital subtraction angiography (DSA) for the measurement of residual carotid artery stenosis and is the preferred method of assessment at many institutions.24–26 To perform CTA of the head and neck arteries, the patient is placed in the supine position with the arms along the sides of the body. The topogram is used to assist planning of the imaging volume, which should start from the aortic arch and end at the level of the circle of Willis. A submillimeter detector collimation is required for images, with the greatest spatial resolution in the z axis. A test bolus or bolus tracking algorithm can be used to determine the start of the scan. The pitch can range from 0.5 and 1.0, depending on the vendor and the number of detector rows. Breath-holding and cessation of swallowing is critical to eliminate motion artifacts. For assessment of carotid circulation, reconstruction is typically performed with smooth reconstruction kernels (e.g., Siemens B20f) using a slice thickness between 0.6 and 1.0 mm and a 50% to 80% reconstruction increment.
Attention to appropriate window settings will have significant impact on measured variances in luminal contrast density. Differences in the measured residual lumen and beam-hardening from calcified plaque will overestimate the degree of stenosis. To avoid this problem, a simple formula may be used to calculate the optimal window settings for carotid stenosis assessment with CTA.27 The window width used is the product of the intraluminal HU × 2.07, and the widow level is the product of the intraluminal HU × 0.72. The degree of stenosis should be reported in terms of percent stenosis or residual luminal area. Percent stenosis is defined as the ratio of the maximal luminal narrowing to the normal internal carotid artery (ICA) distal to the bulb, as was described in the North American Symptomatic Carotid Endarterectomy Trial (NASCET).28 However, the segment of normal ICA measurement can range from 5 to 8 mm, which will affect the calculated degree of stenosis. This can be averted by using the residual luminal diameter instead of the percent stenosis,29–33 or using a simple visual estimation of the degree of stenosis rather than using a caliper-based method.34 The current standard uses the percent stenosis measurement based on NASCET, but there are papers describing the use of residual lumen diameter, where 1.5 mm is used as the cutoff for hemodynamically significant stenosis, which correlates with an ultrasound peak systolic velocity of greater than 250 cm/s and a NASCET measurement of more than 70% stenosis.35
If the clinical question is whether there is a total or subtotal internal carotid occlusion, an immediate delayed acquisition through the neck is helpful to detect slow opacification through a residual lumen. It is important to be aware that sometimes the ascending pharyngeal artery may mimic a subtotally occluded ICA. This is easily differentiated by the fact that the ascending pharyngeal artery does not reach the skull base, whereas the ICA does. Accurate distinction is critically important; a subtotally stenosed ICA may be amenable to revascularization.36–38
Computed Tomographic Angiography in Atherosclerotic and Nonatherosclerotic Disease
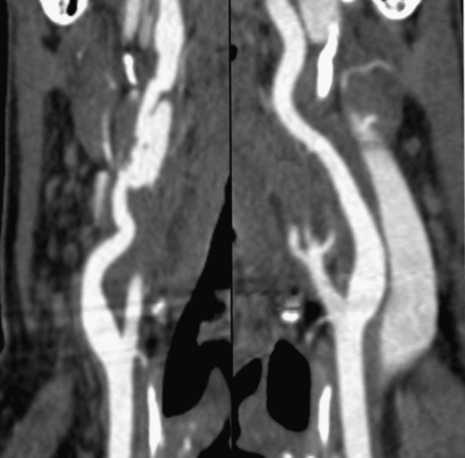
Technical advances in CTA from the last decade have allowed unprecedented imaging for a number of neurovascular applications, including evaluation for carotid artery stenosis, acute ischemic and hemorrhagic stroke, intracranial vascular anomalies, and craniocervical trauma. By far the most common indication for CTA of the extracranial circulation is for suspected carotid artery stenosis due to atherosclerosis (Fig. 14-1). Computed tomographic angiography is also part of the comprehensive evaluation of the patient with an acute stoke, where nonenhanced brain CT, vascular angiography, and perfusion imaging can be acquired during the comprehensive CT examination. Nonatherosclerotic diseases such as fibromuscular dysplasia (FMD), aneurysms or pseudoaneurysms, or dissections can also be imaged with high spatial resolution (Fig. 14-2). Additionally, CTA has a unique role in follow-up after carotid artery stenting procedures (see Fig. 14-1) instead of using MRA, which typically has significant susceptibility artifacts.
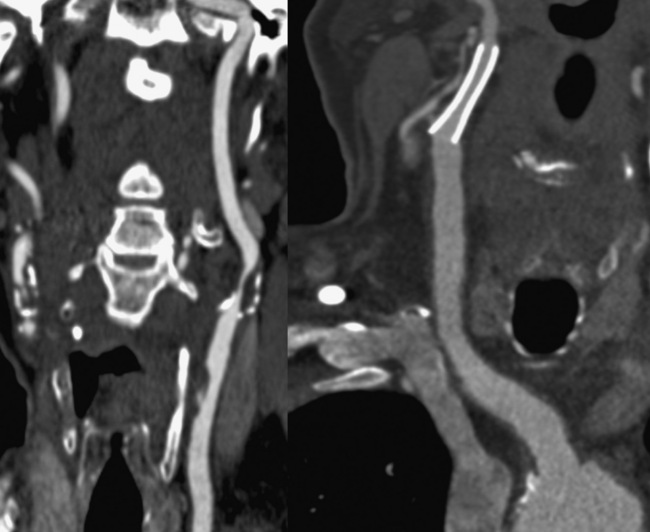
Figure 14-1 Carotid artery atherosclerosis.
(Adapted with permission from Berg M et al: CT angiography of the extracranial and intracranial circulation with imaging protocols. In Mukherjee D, Rajagopalan S, editors: CT and MR angiography of the peripheral circulation: practical approach with clinical protocols, London, 2007, Informa UK Ltd., p. 67.)
Diagnosis of carotid disease
MDCT has shown a 100% correlation with invasive angiography for locating significant stenosis. The interobserver agreement in evaluating total versus subtotal occlusion, stenosis length, retrograde ICA flow, and location of the stenotic site is 1.0, 0.94, 0.86, and 0.89, respectively.24,39 MDCT is also helpful in identifying underlying etiology such as dissection, atherosclerosis, or thrombosis. Berg et al. studied 35 consecutive symptomatic patients with cerebrovascular disorders (e.g., minor stroke, transient ischemic attack (TIA), amaurosis fugax, dizziness) and performed MD-CTA.24 The main focus of the study was comparing MD-CTA to conventional x-ray DSA and rotational DSA as reference standards. In this study, the degree of stenosis was slightly underestimated with CTA, with mean differences (± standard deviation) per observer of 6.9 ± 17.6% and 10.7 ± 16.1% for cross-sectional, and 2.8 ± 19.2% and 9.1 ± 16.8% for oblique sagittal MPRs, compared with x-ray and rotational angiography, respectively. Computed tomographic angiography was somewhat inaccurate for measuring the absolute minimal diameter of subtotally occluded carotid arteries. For symptomatic lesions, interactive CTA interpretation combined with MPR measurements of lesions with a visual estimate of 50% or greater diameter narrowing had a sensitivity of 95% and specificity of 93% for detection of carotid stenosis compared with DSA. Based on these data, it can be concluded that CTA is sensitive for detecting significant carotid artery stenosis.
Computed Tomographic Angiography of the Thorax
Pulmonary arteries
Technical Considerations and Clinical Applications
Pulmonary embolism (PE) is the third most common cause of cardiovascular death in the United States after ischemic heart disease and stroke, with an estimated annual incidence of 300,000 to 600,000 cases per year.40 Even though there is a high prevalence of PE, it continues to be underdiagnosed, with only 43 to 53 patients per 100,000 being accurately identified.41
Computed tomography of the pulmonary arteries (CTPA) is the current diagnostic test of choice for assessing pulmonary thromboembolic disease. In the PIOPED-II study,42 CTPA was principally performed on 4-slice CT with a slice thickness of 1 to 1.25 mm. In this study, the overall positive predictive value in diagnosing PE was 86% (97% for proximal, 68% for segmental, and 25% for subsegmental thrombus), and the negative predictive value was 95%. The value of CTPA varied with the clinical pretest probability of PE: in patients with high or intermediate clinical probability, the positive predictive value for PE was 96%. However, in the face of low clinical pretest likelihood, 42% of patients had a false-positive CTPA result. Therefore, a positive CTPA that was discordant with clinical data had little diagnostic value, at least on the basis of this study. There are randomized controlled studies using later-generation CT scanners that have addressed the issue of their superiority over the 4-slice systems used in PIOPED-II.43–45 The expectation is that thinner detectors and larger detector assembly would allow rapid imaging of the pulmonary artery and branches in a few seconds, avoiding motion artifact.
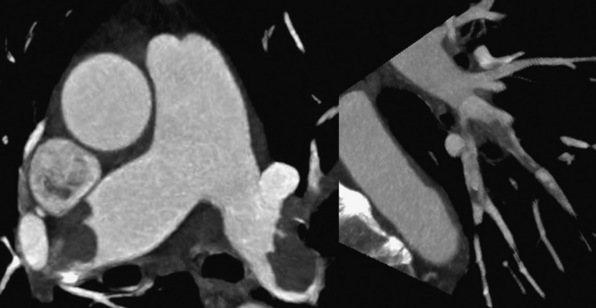
The CTPA findings of acute PE can be divided into arterial findings and ancillary findings. Intraluminal filling defects may partially or completely occlude a pulmonary artery and typically cause significant dilation of the vessel. Acute emboli appear as adherent intravascular filling defects that form acute angles to the vessel wall, whereas chronic thrombi have the appearance of mural adherent thrombi contiguous with the vessel wall. Acute PEs that straddle the bifurcation of the left and right pulmonary arteries are referred to as saddle emboli (Fig. 14-3). Lung infarcts, atelectasis, and oligemia of the affected territory are common lung parenchymal findings with a PE.
CTPA examinations should have optimized window settings, where the window width is equal to the mean attenuation of the pulmonary artery plus 2 standard deviations, and the window level should be half this value. Active scrolling in and out each main, lobar, segmental, and subsegmental artery avoids confusion with veins or mucous-filled bronchi. Multiplanar reformats and MIPs of the pulmonary arteries can be used to improve reader confidence for subtle or questionable findings, but improved diagnostic accuracy has not been proven.46,47 An important fact to keep in mind while interpreting a CTPA study is that most PEs are larger than 1 or 2 mm. Therefore, filling defects seen on only one 1.25-mm image are more likely to be artifact rather than true emboli. Pulmonary emboli typically originate from the pelvic and lower-extremity deep venous anatomy. Less commonly, the source of emboli will be from the thorax, such as the superior vena cava or brachiocephalic veins, likely as a complication of indwelling catheters.
Computed Tomographic Venography for Acute Deep Venous Thrombosis
The usual findings of a pelvic or proximal lower-extremity deep venous thrombosis (DVT) is a partial or complete IV filling defect. Commonly there is associated generalized leg and perivenous edema seen on the acquired images.48
Predictors of Patient Outcome
There are many CTPA findings that give powerful prognostic information. These include the presence of right ventricular (RV) dilation, interventricular septal flattening suggesting significant RV pressure overload, and reflux of contrast into the inferior vena cava, all of which may result from a massive acute PE. A short-axis diameter ratio of the right to left ventricles of 1 to 1.5 or greater is an indicator for severe RV strain and carries a poor prognosis.49 A right-to-left ventricular diameter ratio of greater than 0.9 in a 4-chamber view is associated with increased 30-day mortality, cardiopulmonary resuscitation, ventilator support, and the use of vasopressors.50
Thoracic aorta
Technical Considerations
Development of 16-slice MD-CTA and beyond has made it possible to acquire nearly isotropic submillimeter images within seconds. Standard protocol for acute aortic pathology should include precontrast CT to assess whether intramural hematoma (IMH) is present or if there is blood, which is high density, within the pericardium, pleural space, or mediastinum, indicating aortic rupture. Precontrast CT is performed with a low-dose technique using 1.5-mm collimation to reduce the total radiation dose.51,52 The scan range of the precontrast CT should be restricted to an area from the lung apex to the upper abdomen, but the contrast-enhanced (CE) CT portion should cover the thoracic inlet to the femoral head.53 There is no standard iodine concentration for a dedicated aortic protocol. Normally, a body weight–adapted iodine concentration accounting for flow rates of 1.0 to 1.6 g/s is sufficient to opacify the entire aorta.54,55 An iodine concentration of 3 to 4 mL of 300 mg I/mL/s (0.9-1.2 g/s) may be adequate for most patients, whereas obese patients may require 5 mL of 300 mg I/mL/s (1.5 g/s) to obtain adequate opacification of the aorta. A bolus tracking method using 100 HU with a scan delay of 5 to 7 seconds, followed by a saline chaser to minimize venous contamination, is the ideal method to obtain CE-CTA images.52
Adequate opacification of the entire aorta is achieved by administering the contrast material at least as long as the scan time plus the delay time. For example, if the scan time and scan delay time are 15 and 5 seconds, respectively, a 20-second injection of contrast material followed by a 50-mL saline chaser would be sufficient. With 64-slice MDCT, it is possible to scan the entire aorta with submillimeter collimation (collimation, 0.625 mm; slice thickness, 0.625 mm; reconstruction interval, 0.3 mm) within a single breath-hold, thus making high-resolution 3D displays possible. Cardiac motion may simulate an intimal flap resembling aortic root dissection, which can be eliminated using ECG-gated acquisition.54,56 This will substantially increase the amount of radiation received by the patient, but will lend improved ability to not only evaluate the aortic root but also the coronary arteries.
Clinical Applications
Acute Aortic Syndromes
Computed tomographic angiography plays an important role in the assessment of acute aortic syndromes. These entities comprise penetrating aortic ulcerations (PAU), IMH, and acute aortic dissection (AAD) (see Chapter 34). Dissection presents with severe chest and/or back pain of sudden onset that is often described as “ripping” or “tearing.” This is typically associated with hypertension and older age. However, there are other strong associations with inherited collagen disorders including Marfan’s and Ehlers-Danlos’ syndromes. MDCT is the imaging modality of choice for evaluating the presence of AAD. The major advantage of MDCT is its ability to visualize the entire aorta and the branch vessels, and its rapid through-put. With MDCT, it is important to discern potential artifacts caused by motion of the aortic root and which may simulate an intimal flap. With ECG gating, motion artifact can be eliminated. This may be important in cases when also assessing coronary patency and left ventricular (LV) wall motion.
Penetrating aortic ulceration is the protrusion of plaque through the intima and internal elastic membrane of the aorta. Penetrating aortic ulceration can be seen when the lumen is filled with contrast. It appears as a focal contrast outpouching that may enhance the aortic wall. The most common site of PAU is the middle or lower descending thoracic aorta.57 Penetrating aortic ulceration has to be differentiated from a nonpenetrating atheromatous ulcer, where the ulceration is confined within the intimal layer. The location of intimal calcification can be helpful in this situation.58 Atheromatous ulcers overlie the aortic contour and calcified intima, whereas PAU extends beyond this margin.51,58,59 However, differentiating a calcified mural thrombus, IMH, and PAU can be quite challenging.60 The natural history of PAU can vary depending on the location.61–64 Attenuation of the aortic wall on precontrast images can help distinguish acute IMH or PAU with some mural hemorrhage from chronic IMH. Typically, acute IMH has high attenuation (50-70 HU), in contrast to lower attenuation with chronic IMH. The size of a PAU has influence on its natural history.65 Penetrating aortic ulceration depth and diameter greater than 10 mm and 20 mm, respectively, were independent predictors of extension of IMH or dissection and rupture in one study.64 In another study, however, no predictors of adverse outcomes were acknowledged except for overt rupture upon presentation.66 The interval change in diameter on follow-up CT may be more important than the size of the PAU on the initial CT exam to determine treatment options or patient prognosis.57
The pathogenesis of IMH is not well understood, but hypertension is the major predisposing factor. The two pathophysiological mechanisms of IMH are spontaneous bleeding into the media from the vasa vasorum and intimal tear with complete thrombosis of the false lumen. More recent studies suggest that most IMHs result from an entry tear similar to aortic dissection.60,67–69 Identification of an intimal tear is often underappreciated on preoperative CT but is seen intraoperatively.60 An IMH is visualized as a crescent or ring-shaped region of the aortic wall, with characteristic high attenuation.51,70 In the International Registry of Aortic Dissection (IRAD), location of the IMH was associated with adverse outcome.71 A recent publication from Korea, however, contradicted the IRAD findings.72 New ulceration on follow-up CT and progression of IMH to a thickness greater than 11 mm are associated with progression to overt aortic dissection.73,74
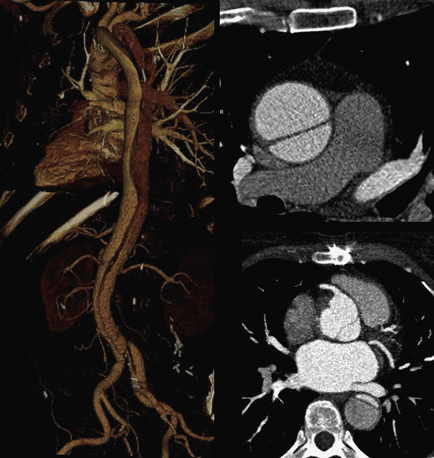
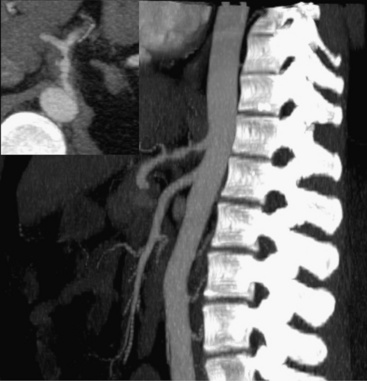
Acute aortic dissection is easily detected by MDCT, a first-line imaging study for evaluating patients59 (Fig. 14-4). Stanford classification is based on extent of the intimal flap, where type A dissection involves the ascending aorta, and type B only involves the descending aorta.75 Important aspects of the evaluation of AAD include location and extent, site of entry/exit, side branch involvement, presence of aortic rupture, patency of false lumen, and associated complications. An inward displacement of intimal calcification can be a sign of aortic dissection on precontrast MDCT. Identifying the location of the entry tear is extremely important because this may affect endovascular treatment options. Likewise, reentry tears can be visualized in the descending and abdominal aorta or iliac arteries.76 Differentiating between the true and false lumen is extremely important because the major side branches originating from the false lumen may be occluded after stent-graft placement.59 The dissection flap may directly extend into or obstruct the ostium of an affected side branch vessel. A simple method to differentiate true from false lumen is to identify the communication with uninvolved aortic segment. The larger lumen is typically the false lumen because the pressure in the false lumen is higher than that of the true lumen.51,59,70 Typically, the true lumen has greater opacification with contrast because of the higher velocity of blood compared to the false lumen.51,59 The false lumen may also show a beak sign, which is the acute angle between the intimal flap and outer false lumen on axial images.51,59,70 Intraluminal thrombus is much more commonly seen within the false lumen, owing to the slower flow of blood. Less commonly seen are strands of incompletely torn connective tissue of the aortic media, known as the cobweb sign.77
Thoracic Aortic Aneurysms
A true aortic aneurysm is a dilation of the aorta greater than 50% comprising the intima, media, and adventitial layers. The aortic root and ascending aorta are affected in nearly 60% of patients with a thoracic aneurysm, the aortic arch in 10%, the descending thoracic aorta in 40%, and the thoracoabdominal aorta in 10% of cases.78 MDCT can determine the extent, location, and size of the aneurysm. The diameter of the aneurysm should be measured in the true aortic short axis. MDCT also can detect complications such as rupture, infection, and fistulas.
Congenital Anomalies of the Thoracic Aorta
Computed tomographic angiography can be used to assess congenital anomalies such as aortic coarctation and anomalous origin of the head and neck vessels (see Chapter 63). Magnetic resonance angiography however, is more useful in this circumstance, because it provides additional hemodynamic data not possible with CTA. Computed tomography has a unique role in assessing the relationship of vascular structures such as the main pulmonary artery, ascending aorta, and mammary arteries to the sternum.
Computed Tomographic Angiography of the Abdominal Aorta
Clinical applications
Abdominal Aortic Dissection
The most common cause for dissection of the abdominal aorta and iliac arteries is propagation of a thoracoabdominal aortic dissection. Focal dissection of the abdominal aorta is rare, occurring in only 1.3% of all aortic dissections.79 A focal dissection is usually associated with hypertension, smoking, diabetes, previous aneurysm surgery, and hyperlipidemia.80 In addition to assessing the vasculature, CTA can also provide information on soft-tissue structures, including complications such as hemorrhage. A noncontrast study may illustrate acute hemorrhage or IMH within an aortic dissection plane and may reveal complications. In addition, a precontrast study in conjunction with a postcontrast study may allow for comparison of subtle changes in thrombus opacification, suggesting a slow bleed. An additional delayed acquisition 1 to 2 minutes post contrast can help identify slow hemorrhage and venous abnormalities.
Abdominal Aortic Aneurysm
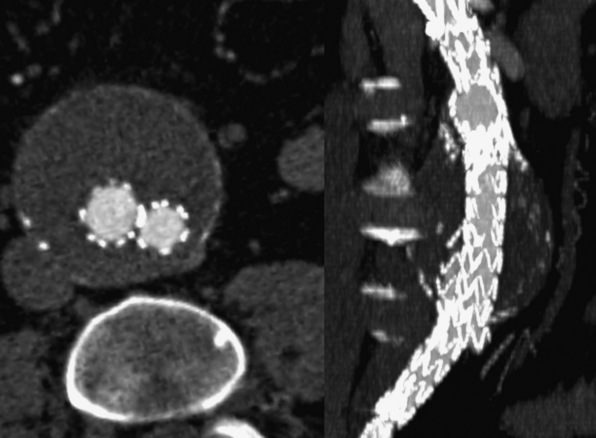
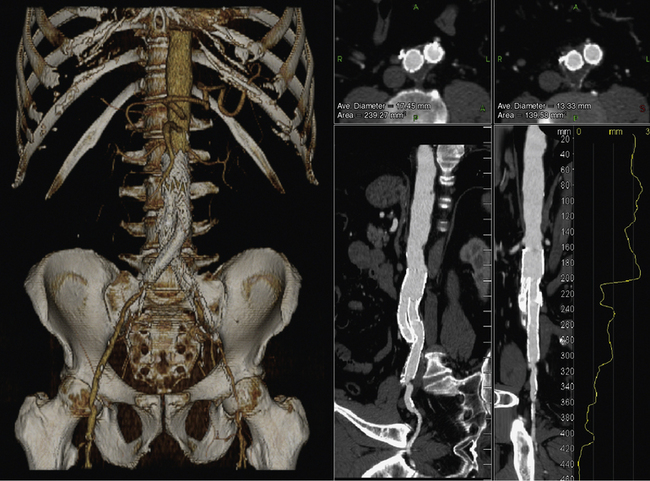
An abdominal aortic aneurysm (AAA) is defined by a greater than 50% enlargement of the abdominal aorta compared to a normal aortic segment. A less than 50% dilation of the aorta is referred to as ectasia.81,82 Although ultrasound is the preferred screening modality for AAA, CTA is often required to assess the extent and complications of an AAA and to plan treatment.81 Regardless of the indication for a CTA exam, true short- and long-axis measurements of the aneurysm must be reported. The distance between the lowermost renal artery and the superior border of the aneurysm, referred to as the neck, provides a standardized description of its location. Computed tomographic angiography can assess the shape and angulation of the neck, measure the maximum diameter of the AAA, and provide a thorough assessment of the iliac and femoral arteries. These determinations are important, especially when consideration is being made for endovascular aneurysm repair (EVAR; Fig. 14-5). Computed tomographic angiography can visualize mural thrombus and calcification within the aneurysm, which have important implications for EVAR (Fig. 14-6). Identifying the number and location of the renal arteries, the presence of a retroaortic left renal vein, and assessment of the mesenteric and hypogastric arteries also are important for operative planning.
Surveillance Following Endovascular Aneurysm Repair
Computed tomographic angiography is the modality of choice for surveillance of patients who have undergone EVAR because it assesses potential complications, including endoleaks. A post–stent-graft examination consists of precontrast dynamic first circulation imaging, and immediate delayed postcontrast imaging. The precontrast study allows identification of calcification so that it is not confused with endoleak. The immediate delayed postcontrast study may identify a slow endoleak that might be missed on the dynamic first circulation study.83 Computed tomographic angiography is used to measure the maximum external dimensions of the aneurysm sac, the lumen of the aortic stent-graft along with its two limbs, the distance between the proximal margin of the stent-graft and the inferior margin of the most inferior renal artery, and the lower margin of the stent-graft and the iliac artery bifurcation of each side.
Endoleaks cause increased pressure within the aneurysm sac and thereby increase the potential for continued aneurysm growth and rupture. A type I endoleak is either a proximal or distal attachment site endoleak, and is usually discovered during implantation. Delayed type I endoleak may be related to changes in tortuosity of the aorta secondary to aneurysm reshaping and should be suspected on CT when acute hemorrhage or contrast pooling is found in the aneurysm sac adjacent to the device attachment site.84 Type II endoleak, the most common form of endoleak, is caused by continued blood flow into the aneurysm sac through a small arterial branch that is excluded by the stent-graft. This type of endoleak resolves spontaneously in most instances and is seen as a small area of contrast opacification within the aneurysm. It is often located at a distance from the graft.85 Type III endoleak is caused by mechanical disruption of the material of an endograft or by separation of an iliac extender from the main graft. This type of endoleak is considered high pressure and carries a high risk for rupture. It appears as a large central collection of contrast distant from the landing zone of the graft.86 A type IV endoleak is due to graft porosity, which is often detected near the time of implantation prior to endothelialization of the graft conduit. This type of endoleak is self-healing and resolves with cessation of anticoagulation. A type V endoleak is result of endotension from arterial pressurization within the aneurysm sac and is without an identifiable cause. This is a diagnosis of exclusion after CTA and invasive angiography fail to identify an alternative type of endoleak.84
Vasculitis
In the abdomen, CTA also has a role in assessing vascular wall and branch vessel changes associated with large-vessel and medium-vessel vasculitis, such as Takayasu arteritis and polyarteritis nodosa, respectively. There are four subtypes of Takayasu’s arteritis (see Chapter 42): type 1 is confined to the aortic arch and branches, type 2 involves the descending thoracic and abdominal aorta, type 3 includes type 1 and 2 components, and type 4 combines type 1, 2, and 3 with pulmonary artery involvement. In patients in the acute stage of vasculitis, CTA findings include thickening and enhancement of the vessel wall. In the chronic form of the disease, there may be arterial stenosis, occlusion, or aneurysm formation.87
Other Applications of Computed Tomographic Angiography
Renal artery disease
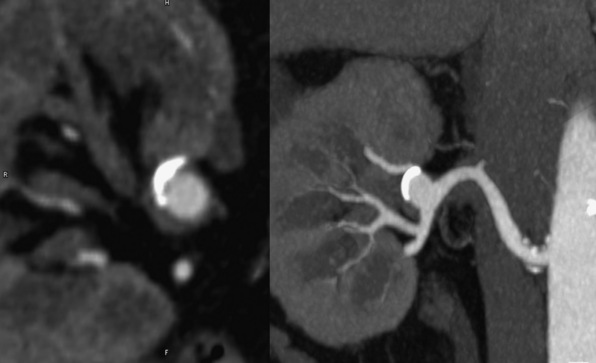
The superb isotropic spatial resolution (0.5 × 0.5 × 0.5 mm) of CTA enables assessment of the renal arteries that is unsurpassed by other imaging modalities. There are approximately 6 seconds between initial renal arterial and venous opacification because of the rapid transit time within the kidney.88 This requires acquiring images with a very high temporal resolution to decrease the degree of venous contamination. Common applications for CTA of the renal arteries include renal artery stenosis (RAS) either from atherosclerosis or FMD, acute renal artery occlusion, and renal artery aneurysms. Atherosclerotic renal artery disease manifests as a stenosis occurring at the vessel origin or proximal segment (typically within 2 cm of the ostium).89 Fibromuscular dysplasia often involves the mid- to distal renal artery and appears as multiple sequential stenoses (“string of pearls”) and possibly renal artery aneurysm.90 Acute renal artery occlusion may rapidly lead to renal infarction.89 The CTA appearance includes occlusion of a renal artery with or without an intimal flap, the former indicting propagation of dissection. Renal artery infarction manifests as wedge-shaped or global perfusion abnormalities. Renal artery aneurysms are rare and are most commonly detected incidentally (Fig. 14-7). The most common cause of renal artery aneurysms is associated with atherosclerosis but may also be related to FMD, connective tissue disease, mycotic infection, or vasculitis (e.g., Behçet’s syndrome, polyarteritis nodosa).89,91 Computed tomographic angiography also has a role in surveillance of patients after renal artery stenting. The biggest limitation of CTA use is that a large proportion of patients with renal artery disease also have advanced renal dysfunction, precluding a CE-CTA study.
Mesenteric artery disease
Computed tomographic angiography is useful in the assessment of mesenteric artery disease, including mesenteric artery aneurysms, dissection, vasculitis, and FMD (Fig. 14-8). Mesenteric artery aneurysms involve the splenic (60%), hepatic (20%), superior mesenteric (5.5%), celiac (4%), pancreatic (2%), and gastroduodenal arteries (1.5%).92,93 Traditionally, these types of aneurysms were diagnosed by invasive angiography. With the increased speed and resolution of CTA, they are increasingly detected noninvasively. Usually, celiac artery and superior mesenteric artery (SMA) dissections result from propagation of aortic dissection. On CTA, the dissection flap may be visualized in the proximal vessel and may cause complete occlusion. Rarely, spontaneous dissections of the SMA may occur. These have a relatively high mortality rate.94,95 Stenosis of the celiac axis may be due to a fibrous band that unites the crura on both sides of the aortic hiatus. This is termed median arcuate ligament syndrome. Typically, the ligament crosses superior to the origin of the celiac axis, but in some people there is a variant in which it crosses inferiorly and can cause compression of the proximal portion of the celiac axis.96 This diagnosis is suggested by CTA when there is focal narrowing with a “hook-like” appearance in the proximal celiac axis.
Peripheral artery disease
Technical Considerations
Contemporary MDCT scanners are capable of assessing the distal vessels in lower extremities. To image vessels smaller than 1 mm in diameter, as is the case in pedal vessels, submillimeter detector collimation is necessary. Patients are placed in a supine position on the scanner table in a feet-first orientation. The typical field-of-view (FOV) should extend from the diaphragm to the toes, with an average scan length of 110 to 130 cm. The scanning protocol begins with a scout image of the entire FOV, followed by a test bolus or bolus triggering acquisition. Breath-holding may be necessary for the more proximal abdominal station, but not for the distal stations. This is followed by a CE angiographic acquisition during the arterial contrast phase. With newer scanners, care must be taken to set the gantry rotation times and pitch appropriately to avoid the risk of “outrunning” the contrast bolus. A second late acquisition of the calf vessels can be obtained in the event of inadequate pedal opacification during the arterial phase. For most CTA applications, 100 to 140 mL of contrast (with an iodine concentration between 350-370 mg/mL) is administered at a rate of 4 mL/s and followed by a saline flush.97 Recently a fixed time strategy has been recommended to image peripheral artery disease (PAD)98 (Table 14-1). In this strategy, the pitch is varied to accomplish a fixed scan time of 40 seconds in all patients. A biphasic injection protocol is used to provide sustained opacification of the arterial system. This approach standardizes PAD imaging protocols and consistently enables good-quality scans. Images are reconstructed using a smooth kernel into one data set of thicker slices at 5.0-mm slice thickness for general assessment, and another data set of thinner slices of 0.6 to 0.75 mm, incorporating a 25% to 50% overlap. When stenosis is present, the determination of severity is typically by visual estimation rather than a computer-based technique. The combination of MIP, CPR, and axial plane imaging will allow the experienced reader to discern mild (0%-50%), moderate (50%-70%), and severe (>70%) stenosis.99,100
Table 14-1 Biphasic Injection Protocol for Peripheral Artery Disease Imaging
| Suggested Injection Protocol | |
|---|---|
| Contrast agent | Low-osmolar nonionic, 350-370 mg/mL |
| Scan time | Fixed at 40 s |
| Injection duration | 35 s |
| Pitch | Variable and adjusted to scan time of 40 s |
| Delay | Bolus trigger to occur on reaching threshold of 150-200 HU |
| Weight-based biphasic injection rate | < 55 kg: 20 mL (4 mL/s) + 96 mL (3.2 mL/s) |
| 56-65 kg: 23 mL (4.5 mL/s) + 108 mL (3.6 mL/s) | |
| 66-85 kg: 25 mL (5.0 mL/s) + 120 mL (4.0 mL/s) | |
| 86-95 kg: 28 mL (5.5 mL/s) + 132 mL (4.4 mL/s) | |
| > 95 kg: 30 mL (6.0 mL/s) + 144 mL (4.8 mL/s) | |
HU, Hounsfield unit; s, second.
Atherosclerotic Peripheral Artery Disease
The major indication for CTA in the evaluation of PAD is in the diagnosis and preinterventional evaluation of symptomatic patients (Fig. 14-9). Findings from CTA can assist the decision to use open surgical or endovascular therapy for revascularization.101 Computed tomographic angiography is less useful in patients with tibioperoneal atherosclerotic disease, since these patients are typically diabetic and have heavily calcified vessels that may preclude accurate assessment of the degree of stenosis. A meta-analysis of CTA in PAD including mostly 4-slice systems reported a pooled sensitivity and specificity for detecting a stenosis of greater than 50% per segment of 92% (95% confidence interval [CI], 89%-95%) and 93% (95% CI, 91%-95%), respectively. The diagnostic performance of CTA in the infrapopliteal tract was lower, but not significantly different from that in the aortoiliac and femoropopliteal levels.102–104
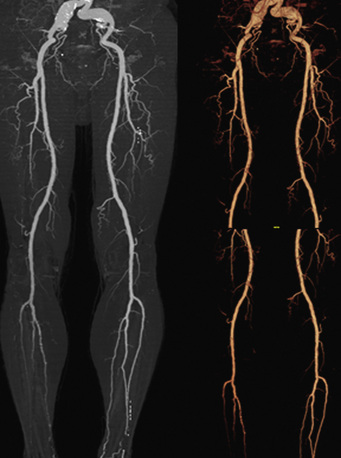
Figure 14-9 Abdominal computed tomographic angiography (CTA) with runoff.
(Adapted from Cohen E, Doshi A, Lookstein R: CT angiography of the lower extremity circulation with protocols. In Mukherjee D, Rajagopalan S, editors: CT and MR angiography of the peripheral circulation: practical approach with clinical protocols, London, 2007, Informa UK Ltd., p. 140.)97
At least one study has evaluated the comparative effectiveness of various imaging approaches in PAD. The outcome measures included clinical utility, functional patient outcomes, quality of life, and diagnostic and therapeutic costs related to the initial imaging test during 6 months of follow-up. Higher confidence and less additional imaging were found for MRA and CTA compared with duplex sonography, and at lower costs.105
Peripheral Artery Aneurysm
Approximately 10% of patients with AAAs have femoral and/or popliteal artery aneurysms (Fig. 14-10). Popliteal artery aneurysm is defined as arterial diameter greater than 7 mm, and femoral artery aneurysm is defined as arterial diameter greater than 10 mm.106,107 Computed tomographic angiography has great utility in diagnosing concomitant aneurysms and also helps distinguish popliteal artery aneurysm from Baker cyst or cystic adventitial disease of the popliteal artery. In the case of femoral artery aneurysm, CTA is appropriate to define the presence of iliac and native femoral vessel disease and plan revascularization strategies.108
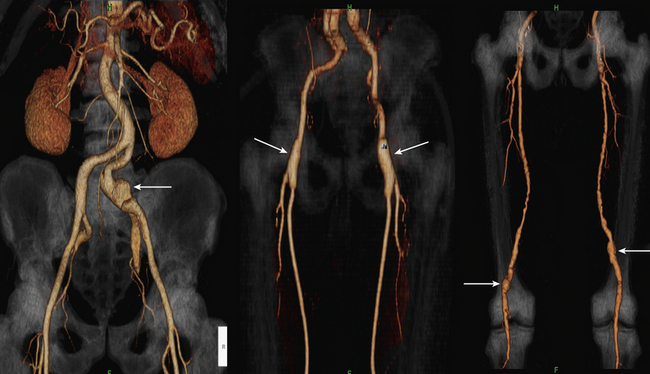
Figure 14-10 Peripheral arterial aneurysms.
(Adapted from Cohen E, Doshi A, Lookstein R: CT angiography of the lower extremity circulation with protocols. In Mukherjee D, Rajagopalan S, editors: CT and MR angiography of the peripheral circulation: practical approach with clinical protocols, London, 2007, Informa UK Ltd., p. 140.)97
Vasculitis
The two most common types of arteritis affecting the lower extremity are thromboangiitis obliterans (TAO) (Buerger’s disease) and Takayasu’s arteritis (see Chapters 42 and 44 and Fig. 14-10). Thromboangiitis obliterans typically affects the small to medium-sized arteries of the extremities, and primarily affects young male smokers. The distal nature of the disease may favor the use of CTA over MRA in light of the submillimeter resolution of the technique, which permits imaging of femoropopliteal occlusive disease extending into the tibioperoneal circuit. The angiographic appearance is one of abrupt vessel occlusion or focal high-grade concentric stenoses associated with extensive collateral circulation, resulting in a “corkscrew” appearance. Takayasu’s arteritis mostly involves the thoracic aorta and brachiocephalic vessels, with less frequent involvement of the abdominal aorta and visceral branches.109 Other forms of arteritis may affect the peripheral circulation but are uncommon. These include polyarteritis nodosa, Behçet’s disease, and Kawasaki disease. As seen on CTA, the patterns and types of vessels involved are useful in distinguishing these entities.
Endovascular Stent Evaluation
Computed tomographic angiography may be used for evaluation of in-stent restenosis, particularly in proximal vessels such as the iliac and femoral arteries. This may require reconstruction with alternate kernels and adjustment of window levels. There are only limited data comparing CT to other modalities for evaluating peripheral stents,110 but there are emerging data for other circulatory beds that are similar or even smaller than lower-extremity vessels. For instance, a recent prospective study assessed renal in-stent restenosis in 86 patients (95 stents).111 CTA had a negative predictive value of 100%, specificity of 99%, and positive predictive value of 90%. For renal artery in-stent restenosis, computed tomographic angiography was reported to have a specificity of 95% and positive predictive value of 56%. In the coronary circulation, sensitivity and specificity using 64-slice systems exceed 90%.112 In practice, these rates may be lower owing to significant publication bias in these reports.
Computed tomographic angiography is used to evaluate patients who have aortoiliac, aortofemoral, or axillofemoral bypass grafts.113 Surveillance of grafts is important and is primarily performed by duplex ultrasound evaluation. Recent studies, however, suggest that CTA may be superior to duplex ultrasound evaluation.114 Attention must be paid to the cumulative radiation dose and the use of contrast agents. Assessment of the graft should include careful evaluation of the proximal anastomotic area to exclude stenosis or aneurysm, the body of the graft, and the touch-down site of the graft.
Other indications
A variety of other conditions represent less common indications for the use of peripheral CTA. These include persistent sciatic artery, popliteal entrapment, and cystic medial adventitial disease (Fig. 14-11). Arteriovenous malformations and fistulas may be well delineated by acquiring images during the arterial and venous phase. Computed tomographic angiography imaging may be used to characterize congenital vascular anomalies.
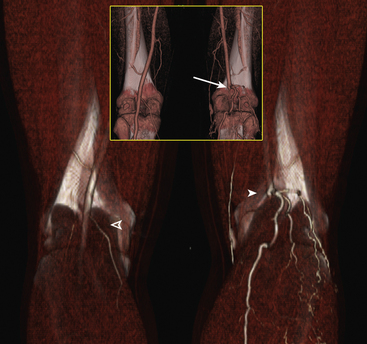
Figure 14-11 Popliteal artery entrapment.
(Adapted from Cohen E, Doshi A, Lookstein R: CT angiography of the lower extremity circulation with protocols. In Mukherjee D, Rajagopalan S, editors: CT and MR angiography of the peripheral circulation: practical approach with clinical protocols, London, 2007, Informa UK Ltd., p. 143.)97
1 Ligon B.L. Biography: history of developments in imaging techniques: Egas Moniz and angiography. Semin Pediatr Infect Dis. 2003;14:173–181.
2 Fleischmann D. Present and future trends in multiple detector-row CT applications: CT angiography. Eur Radiol. 2002;12(Suppl 2):S11–S15.
3 Kalender W.A. Technical foundations of spiral CT. Semin Ultrasound CT MR. 1994;15:81–89.
4 Kalender W.A., Seissler W., Klotz E., et al. Spiral volumetric CT with single-breath-hold technique, continuous transport, and continuous scanner rotation. Radiology. 1990;176:181–183.
5 Petersilka M., Bruder H., Krauss B., et al. Technical principles of dual source CT. Eur J Radiol. 2008;68:362–368.
6 Dawson P., Blomley M.J. Contrast media as extracellular fluid space markers: adaptation of the central volume theorem. Br J Radiol. 1996;69:717–722.
7 van Hoe L., Marchal G., Baert A.L., et al. Determination of scan delay time in spiral CT-angiography: utility of a test bolus injection. J Comput Assist Tomogr. 1995;19:216–220.
8 Leschka S., Wildermuth S., Boehm T., et al. Noninvasive coronary angiography with 64-section CT: effect of average heart rate and heart rate variability on image quality. Radiology. 2006;241:378–385.
9 Einstein A.J., Henzlova M.J., Rajagopalan S. Estimating risk of cancer associated with radiation exposure from 64-slice computed tomography coronary angiography. JAMA. 2007;298:317–323.
10 Fazel R., Krumholz H.M., Wang Y., et al. Exposure to low-dose ionizing radiation from medical imaging procedures. N Engl J Med. 2009;361:849–857.
11 Ron E. Cancer risks from medical radiation. Health Phys. 2003;85:47–59.
12 Einstein A.J., Moser K.W., Thompson R.C., et al. Radiation dose to patients from cardiac diagnostic imaging. Circulation. 2007;116:1290–1305.
13 Martin C.J. The application of effective dose to medical exposures. Radiat Prot Dosimetry. 2008;128:1–4.
14 Martin C.J. Radiation dosimetry for diagnostic medical exposures. Radiat Prot Dosimetry. 2008;128:389–412.
15 Bongartz G., Golding S.J., Jurik A.G., et al. European guidelines for multislice computed tomography. 2004. Funded By The European Commission. Contract Number FIGM-CT2000-20078-CT-TIP. March 2004
16 Blankstein R., Shah A., Pale R., et al. Radiation dose and image quality of prospective triggering with dual-source cardiac computed tomography. Am J Cardiol. 2009;103:1168–1173.
17 Wintersperger B., Jakobs T., Herzog P., et al. Aorto-iliac multidetector-row CT angiography with low kV settings: improved vessel enhancement and simultaneous reduction of radiation dose. Eur Radiol. 2005;15:334–341.
18 Lee E.J., Lee S.K., Agid R., et al. Comparison of image quality and radiation dose between fixed tube current and combined automatic tube current modulation in craniocervical CT angiography. AJNR Am J Neuroradiol. 2009;30:1754–1759.
19 Arnoldi E., Johnson T.R., Rist C., et al. Adequate image quality with reduced radiation dose in prospectively triggered coronary CTA compared with retrospective techniques. Eur Radiol. 2009;19:2147–2155.
20 Hurwitz L.M., Yoshizumi T.T., Goodman P.C. v: Radiation dose savings for adult pulmonary embolus 64-MDCT using bismuth breast shields, lower peak kilovoltage, and automatic tube current modulation. AJR Am J Roentgenol. 2009;192:244–253.
21 Hausleiter J., Meyer T., Hadamitzky M., et al. Radiation dose estimates from cardiac multislice computed tomography in daily practice: impact of different scanning protocols on effective dose estimates. Circulation. 2006;113:1305–1310.
22 Raff G.L., Chinnaiyan K.M., Share D.A., et al. Radiation dose from cardiac computed tomography before and after implementation of radiation dose-reduction techniques. JAMA. 2009;301:2340–2348.
23 Meeson S, Alvey CM, Golding SJ: The in vivo relationship between cross-sectional area and CT dose index in abdominal multidetector CT with automatic exposure control, J Radiol Prot 30:139–147.
24 Berg M., Zhang Z., Ikonen A., et al. Multi-detector row CT angiography in the assessment of carotid artery disease in symptomatic patients: comparison with rotational angiography and digital subtraction angiography. AJNR Am J Neuroradiol. 2005;26:1022–1034.
25 Josephson S.A., Bryant S.O., Mak H.K., et al. Evaluation of carotid stenosis using CT angiography in the initial evaluation of stroke and TIA. Neurology. 2004;63:457–460.
26 Zhang Z., Berg M.H., Ikonen A.E., et al. Carotid artery stenosis: reproducibility of automated 3D CT angiography analysis method. Eur Radiol. 2004;14:665–672.
27 Saba L., Mallarin G. Window settings for the study of calcified carotid plaques with multidetector CT angiography. AJNR Am J Neuroradiol. 2009;30:1445–1450.
28 Fisher M., Martin A., Cosgrove M., et al. The NASCET-ACAS plaque project. North American Symptomatic Carotid Endarterectomy Trial. Asymptomatic Carotid Atherosclerosis Study. Stroke. 1993;24:I24–25. discussion I31–22
29 Zhang Z., Berg M., Ikonen A., et al. Carotid stenosis degree in CT angiography: assessment based on luminal area versus luminal diameter measurements. Eur Radiol. 2005;15:2359–2365.
30 Bartlett E.S., Walters T.D., Symons S.P., et al. Quantification of carotid stenosis on CT angiography. AJNR Am J Neuroradiol. 2006;27:13–19.
31 Bartlett E.S., Walters T.D., Symons S.P., et al. Carotid stenosis index revisited with direct CT angiography measurement of carotid arteries to quantify carotid stenosis. Stroke. 2007;38:286–291.
32 Bartlett E.S., Symons S.P., Fox A.J. Correlation of carotid stenosis diameter and cross-sectional areas with CT angiography. AJNR Am J Neuroradiol. 2006;27:638–642.
33 Bartlett E.S., Walters T.D., Symons S.P., et al. Classification of carotid stenosis by millimeter CT angiography measures: effects of prevalence and gender. AJNR Am J Neuroradiol. 2008;29:1677–1683.
34 Waaijer A., Weber M., van Leeuwen M.S., et al. Grading of carotid artery stenosis with multidetector-row CT angiography: visual estimation or caliper measurements? Eur Radiol. 2009;19:2809–2818.
35 Suwanwela N., Can U., Furie K.L., et al. Carotid Doppler ultrasound criteria for internal carotid artery stenosis based on residual lumen diameter calculated from en bloc carotid endarterectomy specimens. Stroke. 1996;27:1965–1969.
36 Lev M.H., Romero J.M., Goodman D.N., et al. Total occlusion versus hairline residual lumen of the internal carotid arteries: accuracy of single section helical CT angiography. AJNR Am J Neuroradiol. 2003;24:1123–1129.
37 Chen C.J., Lee T.H., Hsu H.L., et al. Multi-Slice CT angiography in diagnosing total versus near occlusions of the internal carotid artery: comparison with catheter angiography. Stroke. 2004;35:83–85.
38 Bartlett E.S., Walters T.D., Symons S.P., et al. Diagnosing carotid stenosis near-occlusion by using CT angiography. AJNR Am J Neuroradiol. 2006;27:632–637.
39 Delgado Almandoz J.E., Romero J.M., Pomerantz S.R., et al. Computed tomography angiography of the carotid and cerebral circulation, vii–viii. Radiol Clin North Am. 2010;48:265–281.
40 Goldhaber S.Z., Morpurgo M. Diagnosis, treatment, and prevention of pulmonary embolism. Report of the WHO/International Society and Federation of Cardiology Task Force. JAMA. 1992;268:1727–1733.
41 Stein P.D., Beemath A., Olson R.E. Trends in the incidence of pulmonary embolism and deep venous thrombosis in hospitalized patients. Am J Cardiol. 2005;95:1525–1526.
42 Stein P.D., Fowler S.E., Goodman L.R., et al. Multidetector computed tomography for acute pulmonary embolism. N Engl J Med. 2006;354:2317–2327.
43 Coche E., Verschuren F., Keyeux A., et al. Diagnosis of acute pulmonary embolism in outpatients: comparison of thin-collimation multi-detector row spiral CT and planar ventilation-perfusion scintigraphy. Radiology. 2003;229:757–765.
44 Qanadli S.D., Hajjam M.E., Mesurolle B., et al. Pulmonary embolism detection: prospective evaluation of dual-section helical CT versus selective pulmonary arteriography in 157 patients. Radiology. 2000;217:447–455.
45 Winer-Muram H.T., Rydberg J., Johnson M.S., et al. Suspected acute pulmonary embolism: evaluation with multi-detector row CT versus digital subtraction pulmonary arteriography. Radiology. 2004;233:806–815.
46 Brader P., Schoellnast H., Deutschmann H.A., et al. Acute pulmonary embolism: comparison of standard axial MDCT with paddlewheel technique. Eur J Radiol. 2008;66:31–36.
47 Chiang E.E., Boiselle P.M., Raptopoulos V., et al. Detection of pulmonary embolism: comparison of paddlewheel and coronal CT reformations–initial experience. Radiology. 2003;228:577–582.
48 Coche E.E., Hamoir X.L., Hammer F.D., et al. Using dual-detector helical CT angiography to detect deep venous thrombosis in patients with suspicion of pulmonary embolism: diagnostic value and additional findings. AJR Am J Roentgenol. 2001;176:1035–1039.
49 Reid J.H., Murchison J.T. Acute right ventricular dilatation: a new helical CT sign of massive pulmonary embolism. Clin Radiol. 1998;53:694–698.
50 Quiroz R., Kucher N., Schoepf U.J., et al. Right ventricular enlargement on chest computed tomography: prognostic role in acute pulmonary embolism. Circulation. 2004;109:2401–2404.
51 Bhalla S., West O.C. CT of nontraumatic thoracic aortic emergencies. Semin Ultrasound CT MR. 2005;26:281–304.
52 Salvolini L., Renda P., Fiore D., et al. Acute aortic syndromes: role of multi-detector row CT. Eur J Radiol. 2008;65:350–358.
53 Batra P., Bigoni B., Manning J., et al. Pitfalls in the diagnosis of thoracic aortic dissection at CT angiography. Radiographics. 2000;20:309–320.
54 Manghat N.E., Morgan-Hughes G.J., Roobottom C.A. Multi-detector row computed tomography: imaging in acute aortic syndrome. Clin Radiol. 2005;60:1256–1267.
55 Johnson T.R., Nikolaou K., Wintersperger B.J., et al. Optimization of contrast material administration for electrocardiogram-gated computed tomographic angiography of the chest. J Comput Assist Tomogr. 2007;31:265–271.
56 Roos J.E., Willmann J.K., Weishaupt D., et al. Thoracic aorta: motion artifact reduction with retrospective and prospective electrocardiography-assisted multi-detector row CT. Radiology. 2002;222:271–277.
57 Hayashi H., Matsuoka Y., Sakamoto I., et al. Penetrating atherosclerotic ulcer of the aorta: imaging features and disease concept. Radiographics. 2000;20:995–1005.
58 Macura K.J., Corl F.M., Fishman E.K., et al. Pathogenesis in acute aortic syndromes: aortic dissection, intramural hematoma, and penetrating atherosclerotic aortic ulcer. AJR Am J Roentgenol. 2003;181:309–316.
59 Chiles C., Carr J.J. Vascular diseases of the thorax: evaluation with multidetector CT, viii. Radiol Clin North Am. 2005;43:543–569.
60 Park K.H., Lim C., Choi J.H., et al. Prevalence of aortic intimal defect in surgically treated acute type A intramural hematoma. Ann Thorac Surg. 2008;86:1494–1500.
61 Quint L.E., Williams D.M., Francis I.R., et al. Ulcerlike lesions of the aorta: imaging features and natural history. Radiology. 2001;218:719–723.
62 Harris J.A., Bis K.G., Glover J.L., et al. Penetrating atherosclerotic ulcers of the aorta. J Vasc Surg. 1994;19:90–98. discussion 98–99
63 Coady M.A., Rizzo J.A., Hammond G.L., et al. Penetrating ulcer of the thoracic aorta: what is it? How do we recognize it? How do we manage it? J Vasc Surg. 1998;27:1006–1015. discussion 1015–1006
64 Ganaha F, Miller D.C., Sugimoto K., et al. Prognosis of aortic intramural hematoma with and without penetrating atherosclerotic ulcer: a clinical and radiological analysis. Circulation. 2002;106:342–348.
65 Jeudy J., Waite S., White C.S. Nontraumatic thoracic emergencies, ix. Radiol Clin North Am. 2006;44:273–293.
66 Cho K.R., Stanson A.W., Potter D.D., et al. Penetrating atherosclerotic ulcer of the descending thoracic aorta and arch. J Thorac Cardiovasc Surg. 2004;127:1393–1399. discussion 1399–1401
67 Beauchesne L.M., Veinot J.P., Brais M.P., et al. Acute aortic intimal tear without a mobile flap mimicking an intramural hematoma. J Am Soc Echocardiogr. 2003;16:285–288.
68 Berdat P.A., Carrel T. Aortic dissection limited to the ascending aorta mimicking intramural hematoma. Eur J Cardiothorac Surg. 1999;15:108–109.
69 Neri E., Capannini G., Carone E., et al. Evolution toward dissection of an intramural hematoma of the ascending aorta. Ann Thorac Surg. 1999;68:1855–1856.
70 Castaner E., Andreu M., Gallardo X., et al. CT in nontraumatic acute thoracic aortic disease: typical and atypical features and complications. Radiographics. 2003;23:S93–S110.
71 Hagan P.G., Nienaber C.A., Isselbacher E.M., et al. The International Registry of Acute Aortic Dissection (IRAD): new insights into an old disease. JAMA. 2000;283:897–903.
72 Song J.K., Kim H.S., Song J.M., et al. Outcomes of medically treated patients with aortic intramural hematoma. Am J Med. 2002;113:181–187.
73 Sueyoshi E., Matsuoka Y., Imada T., et al. New development of an ulcerlike projection in aortic intramural hematoma: CT evaluation. Radiology. 2002;224:536–541.
74 Song M.O., Kim K.J., Chung S.I., et al. Distribution of human group a rotavirus VP7 and VP4 types circulating in Seoul, Korea between 1998 and 2000. J Med Virol. 2003;70:324–328.
75 Roberts W.C. Aortic dissection: anatomy, consequences, and causes. Am Heart J. 1981;101:195–214.
76 Manghat N.E., Walsh M., Roobottom C.A., et al. Can the “vortex sign” be used as an imaging indicator of the false lumen in acute aortic dissection? Clin Radiol. 2005;60:1037–1038.
77 Williams D.M., Joshi A., Dake M.D., et al. Aortic cobwebs: an anatomic marker identifying the false lumen in aortic dissection–imaging and pathologic correlation. Radiology. 1994;190:167–174.
78 Isselbacher E.M. Thoracic and abdominal aortic aneurysms. Circulation. 2005;111:816–828.
79 Trimarchi S., Tsai T., Eagle K.A., et al. Acute abdominal aortic dissection: insight from the International Registry of Acute Aortic Dissection (IRAD). J Vasc Surg. 2007;46:913–919.
80 Jonker F.H., Schlosser F.J., Moll F.L., et al. Dissection of the abdominal aorta. Current evidence and implications for treatment strategies: a review and meta-analysis of 92 patients. Endovasc Ther. 2009;16:71–80.
81 Pande R.L., Beckman J.A. Abdominal aortic aneurysm: populations at risk and how to screen. J Vasc Interv Radiol. 2008;19:S2–S8.
82 Annambhotla S., Bourgeois S., Wang X., et al. Recent advances in molecular mechanisms of abdominal aortic aneurysm formation. World J Surg. 2008;32:976–986.
83 Rozenblit A.M., Patlas M., Rosenbaum A.T., et al. Detection of endoleaks after endovascular repair of abdominal aortic aneurysm: value of unenhanced and delayed helical CT acquisitions. Radiology. 2003;227:426–433.
84 Bashir M.R., Ferral H., Jacobs C., et al. Endoleaks after endovascular abdominal aortic aneurysm repair: management strategies according to CT findings. AJR Am J Roentgenol. 2009;192:W178–W186.
85 Tolia A.J., Landis R., Lamparello P., et al. Type II endoleaks after endovascular repair of abdominal aortic aneurysms: natural history. Radiology. 2005;235:683–686.
86 Gorich J., Rilinger N., Sokiranski R., et al. Leakages after endovascular repair of aortic aneurysms: classification based on findings at CT, angiography, and radiography. Radiology. 1999;213:767–772.
87 Gotway M.B., Araoz P.A., Macedo T.A., et al. Imaging findings in Takayasu’s arteritis. AJR Am J Roentgenol. 2005;184:1945–1950.
88 Foley W.D. Special focus session: multidetector CT: abdominal visceral imaging. Radiographics. 2002;22:701–719.
89 Kawashima A., Sandler C.M., Ernst R.D., et al. CT evaluation of renovascular disease. Radiographics. 2000;20:1321–1340.
90 Beregi J.P., Louvegny S., Gautier C., et al. Fibromuscular dysplasia of the renal arteries: comparison of helical CT angiography and arteriography. AJR Am J Roentgenol. 1999;172:27–34.
91 Sabharwal R., Vladica P., Law W.P., et al. Multidetector spiral CT renal angiography in the diagnosis of giant renal artery aneurysms. Abdom Imaging. 2006;31:374–378.
92 Chiesa R., Astore D., Guzzo G., et al. Visceral artery aneurysms. Ann Vasc Surg. 2005;19:42–48.
93 Rokke O., Sondenaa K., Amundsen S., et al. The diagnosis and management of splanchnic artery aneurysms. Scand J Gastroenterol. 1996;31:737–743.
94 Barmeir E., Halachmi S., Croitoru S., et al. CT angiography diagnosis of spontaneous dissection of the superior mesenteric artery. AJR Am J Roentgenol. 1998;171:1429–1430.
95 Krupski W.C., Effeney D.J., Ehrenfeld W.K. Spontaneous dissection of the superior mesenteric artery. J Vasc Surg. 1985;2:731–734.
96 Lindner H.H., Kemprud E. A clinicoanatomical study of the arcuate ligament of the diaphragm. Arch Surg. 1971;103:600–605.
97 Cohen E.I., Doshi A., Lookstein R.A. CT angiography of the lower-extremity circulation with protocols. In: Mukherjee D., Rajagopalan S. CT and MR angiography of the peripheral circulation: practical approach with clinical protocols. London: Informa UK Ltd; 2007:133–146.
98 Fleischmann D. CT angiography: injection and acquisition technique, vii. Radiol Clin North Am. 2010;48:237–247.
99 Catalano C., Fraioli F., Laghi A., et al. Infrarenal aortic and lower-extremity arterial disease: diagnostic performance of multi-detector row CT angiography. Radiology. 2004;231:555–563.
100 Schernthaner R., Stadler A., Lomoschitz F., et al. Multidetector CT angiography in the assessment of peripheral arterial occlusive disease: accuracy in detecting the severity, number, and length of stenoses. Eur Radiol. 2008;18:665–671.
101 Norgren L., Hiatt W.R., Dormandy J.A., et al. Inter-Society Consensus for the Management of Peripheral Arterial Disease (TASC II). Eur J Vasc Endovasc Surg. 2007;33(Suppl 1):S1–S75.
102 Heijenbrok-Kal M.H., Kock M.C., Hunink M.G. Lower extremity arterial disease: multidetector CT angiography meta-analysis. Radiology. 2007;245:433–439.
103 Schernthaner R., Fleischmann D., Lomoschitz F., et al. Effect of MDCT angiographic findings on the management of intermittent claudication. AJR Am J Roentgenol. 2007;189:1215–1222.
104 Dellegrottaglie S., Sanz J., Macaluso F., et al. Technology insight: magnetic resonance angiography for the evaluation of patients with peripheral artery disease. Nat Clin Pract Cardiovasc Med. 2007;4:677–687.
105 Ouwendijk R., de Vries M., Stijnen T., et al. Multicenter randomized controlled trial of the costs and effects of noninvasive diagnostic imaging in patients with peripheral arterial disease: the DIPAD trial. AJR Am J Roentgenol. 2008;190:1349–1357.
106 Wright L.B., Matchett W.J., Cruz C.P., et al. Popliteal artery disease: diagnosis and treatment. Radiographics. 2004;24:467–479.
107 Diwan A., Sarkar R., Stanley J.C., et al. Incidence of femoral and popliteal artery aneurysms in patients with abdominal aortic aneurysms. J Vasc Surg. 2000;31:863–869.
108 Lopera J.E., Trimmer C.K., Josephs S.G., et al. Multidetector CT angiography of infrainguinal arterial bypass. Radiographics. 2008;28:529–548. discussion 549
109 Chung J.W., Kim H.C., Choi Y.H., et al. Patterns of aortic involvement in Takayasu arteritis and its clinical implications: evaluation with spiral computed tomography angiography. J Vasc Surg. 2007;45:906–914.
110 Blum M.B., Schmook M., Schernthaner R., et al. Quantification and detectability of in-stent stenosis with CT angiography and MR angiography in arterial stents in vitro. AJR Am J Roentgenol. 2007;189:1238–1242.
111 Steinwender C., Schutzenberger W., Fellner F., et al. 64-Detector CT angiography in renal artery stent evaluation: prospective comparison with selective catheter angiography. Radiology. 2009;252:299–305.
112 Sun Z., Almutairi A.M. Diagnostic accuracy of 64 multislice CT angiography in the assessment of coronary in-stent restenosis: a meta-analysis. Eur J Radiol. 2009;73:266–273.
113 Foley W.D., Stonely T. CT angiography of the lower extremities, ix. Radiol Clin North Am. 2010;48:367–396.
114 Willmann J.K., Mayer D., Banyai M., et al. Evaluation of peripheral arterial bypass grafts with multi-detector row CT angiography: comparison with duplex US and digital subtraction angiography. Radiology. 2003;229:465–474.
[/level-membership-for-cardiovascular-category][not-level-membership-for-cardiovascular-category]<
[/not-level-membership-for-cardiovascular-category]
