Fig. 7.1
Complement activation and regulation system. The complement system consists of more than 30 molecules and forms three major pathways: the classical pathway (CP), alternative pathway (AP), and lectin pathway (LP). Italic characters mean complement regulatory proteins. C1-INH C1 inhibitor, MBL mannose-binding lectin, MASP MBL-associated serine protease, fB factor B, fD factor D, fI factor I, fH factor H, FHL-1 fH-like protein-1, CFHR proteins complement FH-related proteins
7.2.2 Regulation Mechanism
The complement system is controlled by soluble and cell-bound regulators. The C1 inhibitor (C1-INH), which belongs to the serpin family, is only one strong inhibitor in circulation for early components such as C1r, C1s, and MASP (Fig. 7.2) [7, 8]. AP is controlled by two types of inhibition mechanisms, termed decay-accelerating activity and cofactor-mediated cleavage. Decay-accelerating activity dissociates C3 and C5 convertases. Cofactor activity cleaves C3b into iC3b (inactivated form) and C3f with factor I. Plasma factor H (fH) and its truncated form factor H-like protein-1 (FHL-1), plasma C4-binding protein (C4bp), cell-bound complement receptor 1 (CR1, CD35), decay-accelerating factor (DAF, CD55), and membrane cofactor protein (MCP, CD46) belong to regulators of the complement activation family [9]. Cell-bound regulators, CD59, soluble clusterin, and vitronectin, prevent MAC formation. Carboxypeptidase N (CPN) is a soluble protease that digests anaphylatoxin, C3a, and C5a and inactivates them into C3a desArg and C5a desArg, respectively [4, 8].
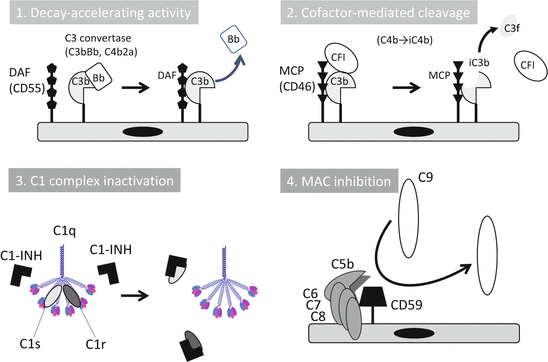

Fig. 7.2
Complement regulation mechanisms. Complement activation cascades are regulated by humoral and cell membrane-bound molecules. DAF decay-accelerating factor, Bb activated split form of factor B, MCP membrane cofactor protein, CFI complement factor I, C1-INH C1 inhibitor (The figure was modified from Kavanagh et al. [38])
7.2.3 Complement Production and Consumption
A detailed analysis of the role of the complement system in the pathogenesis of glomerulonephritis would discriminate a subpopulation of patients from others. It is emphasized that we need to have concern about the production, consumption, and deficiencies of complement components. Complement deficiencies are common genetic disorders. In most cases, heterozygotes produce one-half of the normal plasma level of a specific complement protein. The frequency of deficiency of C1-INH, MBL, C4, and C9 is approximately 1:50,000, 1:10, 1:3 (including partial deletion), and 1:1000 (in Japanese healthy blood donors), respectively [10, 11]. In an analysis of a patient with low CH50, we were first concerned with the possibility of complement deficiencies. Next, we should take notice of overproduction of complement components. The liver is the main source of these components. Because the complement components belong to the acute reactive proteins, like C-reactive protein, infections and chronic inflammation enhance the production of complement components by hepatocytes [12]. Intriguingly, the target organ can also produce the components in situ [13, 14]. For example, C3 is synthesized by kidney resident cells and a single donor kidney is able to produce 5 % of circulating C3 [13, 15]. Actually, we can see the fluctuations of complement levels in the context of many clinical situations. The breakdown product of C3, C3a desArg or, in another term, “acylation-stimulating protein (ASP),” is recognized as one type of adipocytokine. Adipocytes also produce C3, fB, and fD, which are spontaneously activated by the nearby adipocytes themselves. CPN splits C3a into C3a desArg and arginine. C3a desArg has been recognized as an inactivated form of C3a, but energetic studies identified it as a potent stimulator of glucose transport and triglyceride synthesis in adipocytes [16, 17]. Then, the level of C3 increases in an overnutrition state, such as metabolic syndrome, diabetes, or obesity (Fig. 7.3a, b). Body mass index (BMI) and serum complement parameters such as C3, C4, and CH50 have a positive correlation. Especially, the serum level of C3 has a strong correlation with BMI and can fluctuate with insulin resistance. Cryoglobulin-containing serum easily activates CP in test tubes (the so-called cold activation), with the results of the serum level of components and the titer of CH50 being overestimated [18]. Generally, in autoimmune diseases, such as lupus nephritis (LN) and IgG4-related tubulointerstitial nephritis, IC activates CP. In these diseases, IC leads to the consumption of early components of CP in the fluid phase, and laboratory data presents a low serum level of C4 and a low titer of CH50 [19]. Simultaneously, renal depositions of early components of CP, C1q, and C4 were observed. On the other hand, in the cases of post-streptococcal acute glomerulonephritis (PSAGN), most patients presented a low serum level of C3, a low titer of CH50, and glomerular depositions of C3. Thus, it is recognized that AP is the main route of complement activation in PSAGN. From the viewpoint of excess of AP activation, a newly defined clinical entity “C3 glomerulopathy,” which comprises of glomerular lesions with predominant C3 staining, was proposed. Although this category contains cases of membranoproliferative glomerulonephritis (MPGN) and dense deposit disease, many pathogenic abnormalities, such as fH mutations, C3 gene variants, nephritic factors, anti-complement regulatory proteins, were reported [20]. The histological damage of these cases was deduced due to uncontrolled AP activation.
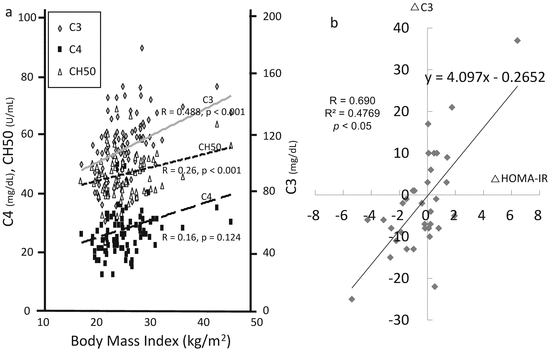

Fig. 7.3
Metabolic impact on the serum levels of C3 in hypertensive and/or chronic kidney disease patients. (a) Correlations between serum levels of complement parameters and body mass index. The serum levels of C3 presented the most significant positive correlation with body mass index. (b) Fluctuations of serum levels of C3 and insulin resistance. Scatter plots of follow-up differences in 35 subjects who were free of dietary restrictions at two time points in the following 6 months. The plots of 24 subjects (69.9 %) were located in the first quadrant or third quadrant and showed a significant positive relationship. Insulin resistance was assessed using the homeostasis model assessment (HOMA-IR) (The figure was modified from Ohsawa et al. [17])
7.3 The Role of Complements in IgA Nephropathy: Fluid Phase
Because serum levels of C3 and C4 fluctuate within the normal range, complement activation in the fluid phase has not been focused on in clinical practice. However, the ratio of the serum level of IgA and C3 (IgA/C3 ratio, more than 3.01) has become a candidate biomarker for the diagnosis of IgAN [21, 22]. In this clinical parameter, a low serum level of C3 contributes to the increase of the IgA/C3 ratio. A cross-sectional study has also indicated that serum C3 levels do not increase despite the elevated levels of other complement components in IgAN at the time of biopsy (Table 7.1). These evidences suggest the possibility that the consumption of serum C3 and MBL via AP and LP might be increased compared with hepatic production of C3 and MBL [23]. Aggregated IgA, polymeric IgA, and chemically deglycosylated IgA1 can activate directly with AP; however, the molecular basis for this difference is not fully understood [24, 25]. To the best of our knowledge, galactose-deficient IgA1 itself is able to activate C3 directly in fluid phase [26].
Table 7.1
Serum levels of complement components in patients with IgA nephropathy
|
N
|
CH50
|
C1q
|
C4
|
C3
|
C5
|
B
|
P
|
MBL
|
|
|---|---|---|---|---|---|---|---|---|---|
|
(U/ml)
|
(mg/dl)
|
(mg/dl)
|
(mg/dl)
|
(%)
|
(%)
|
(µg/ml)
|
(mg/ml)
|
||
|
IgA nephropathy
|
50
|
44.0 ± 8.1a
|
13.4 ± 2.8
|
28 ± 11a
|
101 ± 26
|
122 ± 28
|
114 ± 32a
|
32.6 ± 27.0a
|
1.8 ± 1.8
|
|
Healthy controls
|
50
|
33.5 ± 5.4
|
12.6 ± 1.7
|
21 ± 5
|
106 ± 17
|
112 ± 17
|
95 ± 18
|
21.0 ± 24.0
|
2.1 ± 1.8
|
There is accumulating evidence to support a hypothesis of the occurrence of LP activation in the pathogenesis of IgAN. Under-O-glycosylated IgA leads to the polymerization of IgA [27], and purified polymeric IgA from patients with IgAN can activate LP [28]. On the other hand, prominent ligands for MBL are mannose and N-acetylglucosamine (GlcNAc), and ligands for ficolins are GlcNAc. Although such an under-O-glycosylated IgA1 (N-acetylgalactosamine, GalNAc) from patients with IgAN could potentially interact with plant lectins [29], GalNAc residues cannot be recognized by MBL and ficolins. So far, certain ligands of MBL and ficolin are yet to be defined. Secretory IgA (SIgA) is the first line of defense in protecting the respiratory and intestinal tract and is a credible candidate. Since the N-glycans on the heavy chains of both IgA1 and SIgA2 present terminal GlcNAc and mannose residues, they could be recognized by MBL and ficolins [30].
7.3.1 Fluctuation of Serum Level of C3 and MBL Deficiency
Because IgAN is a chronic glomerular disease and progresses gradually over the long term, additional factors may have a lot of influence on the prognosis. We reported on the fluctuations of the serum level of C3 over a long-term observation (mean observation period, 6.7 ± 2.1 years) in 122 patients with IgAN. In the patients whose renal symptoms, including hematuria, proteinuria, and estimated glomerular filtration rate (eGFR), were improved, the serum level of C3 was significantly elevated (Fig. 7.4) [31]. A subsequent analysis showed that body mass index has a positive correlation with the serum levels of C3 and C4 (Table 7.2) [32]. Thus, the levels and fluctuations of serum C3 and/or C4 might reflect the disease activity and simultaneously, metabolic alteration in patients with IgAN, leading us to believe that we have to pay attention when evaluating the serum levels of complement components.
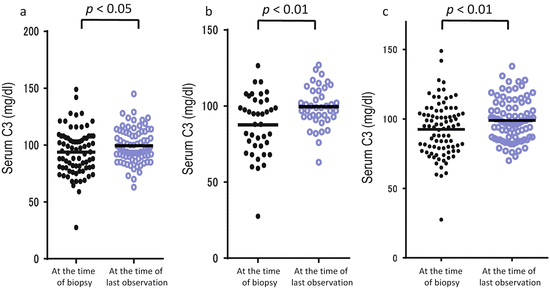

Fig. 7.4
Fluctuations of serum levels of C3 in IgA nephropathy. Serum C3 levels of the 122 patients at the time of biopsy and last observation were collected. The patients whose hematuria (a) and proteinuria (b) had disappeared presented significantly increased serum levels of C3. Also the patients whose estimated glomerular filtration rate (eGFR) had been maintained presented significantly increased serum levels of C3 (c) (The figure was modified from Suzuki et al. [31])
Table 7.2
Relationship of body mass index and clinical data by linear regression models in patients with IgA nephropathy
|
R
|
p
|
||
|---|---|---|---|
|
Uric acid
|
(mg/dL)
|
0.4427
|
<0.0001
|
|
Triglyceride
|
(mg/dL)
|
0.4231
|
<0.0001
|
|
C4
|
(mg/dL)
|
0.4179
|
<0.0001
|
|
Hemoglobin
|
(mg/dL)
|
0.3540
|
<0.0001
|
|
C3
|
(mg/dL)
|
0.3575
|
<0.0001
|
|
HDL cholesterol
|
(mg/dL)
|
−0.3480
|
<0.0001
|
|
Creatinine
|
(mg/dL)
|
0.3416
|
<0.0001
|
|
Systolic blood pressure
|
(mmHg)
|
0.3311
|
<0.0001
|
|
Diastolic blood pressure
|
(mmHg)
|
0.3052
|
<0.0001
|
|
(n = 193)
|
|||
Functional MBL deficiency is involved in 10–20 % of the healthy population. It is characterized by low levels of functional multimers due to a number of genetic polymorphisms within the coding (codon 54 of exon 1 is the most common in humans and it determines serum concentration and carbohydrate recognition ability) and the promoter regions of the MBL2 gene (Fig. 7.5) [33, 34]. We previously compared the clinical backgrounds between MBL-sufficient patients of IgAN and MBL-deficient patients of IgAN (Table 7.3) [35]. The mean urinary protein and eGFR levels in MBL-deficient subjects were better than in MBL-sufficient subjects. Pirulli et al. reported a similar distribution of polymorphism frequency between healthy volunteers and IgAN patients [36]. Of great interest is whether a difference can be found between MBL deficiency and MBL sufficiency at the onset and progression of IgAN.
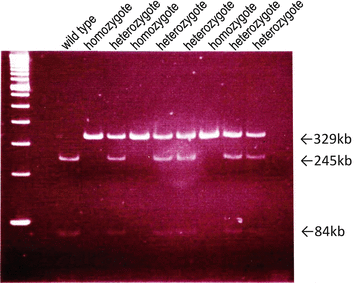

Fig. 7.5
Mbl-2 gene polymorphism of eight of mannose-binding lectin (MBL)-deficient patients. Codon 54 wild-type allele showed two bands (245 bp and 84 bp), the heterozygote allele showed three bands (329 bp, 245 bp, and 84 bp), and the homozygote allele only one band (329 bp) (The figure was modified from Ishii et al. [34])
Table 7.3
Clinical background compared with MBL-sufficient and MBL-deficient patients with IgA nephropathy
|
MBL sufficient
|
MBL deficient
|
|
|---|---|---|
|
n
|
55
|
6
|
|
Gender (M/F)
|
22:33
|
3:3
|
|
Age (y)
|
30.6 ± 8.7
|
26.5 ± 6.7
|
|
Serum creatinine (mg/dL)
|
0.83 ± 0.30
|
0.71 ± 0.14
|
|
Estimated GFR (mL/min/1.73 m2)
|
85.3 ± 30.9
|
98.4 ± 13.8
|
|
Urinary protein (g/g·creatinine)
|
1.45 ± 1.58
|
0.69 ± 0.97
|
|
History of macrohematuria (%)
|
27.3
|
33.3
|
|
IgA (mg/dL)
|
316.9 ± 112.9
|
265.2 ± 69.6
|
|
C3 (mg/dL)
|
97.8 ± 15.8
|
93.2 ± 2.6
|
|
C4 (mg/dL)
|
21.9 ± 6.1
|
19.8 ± 6.6
|
|
CH50 (unit/mL)
|
40.1 ± 6.7
|
34.4 ± 3.4
|
7.3.2 Mutation of CFHR Proteins
fH, a strong regulator of C3 convertase formation via the binding of C3b, has binding sites to self-cell surface via glycosaminoglycan and thus is a biphasic regulator of AP, namely, in the fluid phase and on the cell surface [37]. Complement factor H-related (CFHR) proteins (CFHR1, CHFR2, CFHR3, CFHR4, and CFHR5) are not able to bind any complement components, but inhibit binding activity between fH and C3b [38]. The complement factor H (CFH) gene and CFHR1–CFHR5 encoding five CFHR proteins are located in tandem in the regulators of complement activation cluster at chromosome 1q32 [39]. Gharavi et al. identified the gene deletion of CFHR3 and CFHR1 within the CFH locus by genome-wide association study (GWAS) [40]. This CFHR3–CFHR1 homozygous deletion is protective in the pathogenesis of IgAN, C3 glomerulopathy, and age-related macular degeneration [41, 42]. Recently, advanced data was reported, and minor allele A of rs6677604, which is a noncoding single nucleotide polymorphism in intron 11 of the CFHR gene, highly tagged CFHR3–CFHR1 deletion [43].
7.4 The Role of Complements in IgA Nephropathy: Local Tissue
Tomino et al. deduced that the polymeric form of IgA1 is predominantly eluted from the renal tissues of IgAN patients [44]. Tomino and Conley et al. also confirmed the predominantly glomerular deposition of IgA1, rather than that of IgA2 [45, 46]. A subsequent report showed that patients with mesangial deposits of IgA1 and C3c showed no deposits of C4, MBL, and MASP-1. AP is certainly activated in glomerulus [47]. Endo et al. first demonstrated that the glomerular deposition of MBL/MASP-1 occurred in 25 % of cases of IgAN and that this was not observed in the normal kidney and that the frequency was higher than that found in the other forms of glomerulonephritis [48]. Patients with glomerular deposits of MBL/MASP-1 were young, and the duration of the disease prior to renal biopsy was short compared with that in patients without MBL/MASP-1 deposition. Therefore, Roos et al. concluded that the glomerular activation of LP was associated with more severe renal damage, as demonstrated by proteinuria, decreased renal function, and more severe histological findings, such as mesangial proliferation, crescent formation, glomerular sclerosis, and interstitial fibrosis [26]. Because a recent cohort study also confirmed the significance of MBL deposition in IgAN, the glomerular deposition of MBL is a prognostic marker of IgAN [49].
In an experimental model, Hashimoto et al. analyzed the grouped ddY mouse, which presents spontaneous IgAN [50]. They found that the complement components belonging to LP and CP were deposited in glomeruli; furthermore, the serum level of IgA–MBL complex and IgA–IgG2a complex was significantly higher (Fig. 7.6). Further analysis of this model might unravel the pathogenic obscurities between complement activation and IgAN.
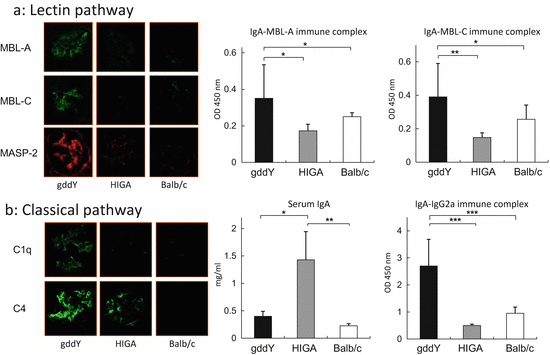

Fig. 7.6
Pathological role of lectin pathway and classical pathway in mouse model. (a) Mannose-binding lectin (MBL) and MBL-associated serine protease (MASP)-2 were positive in glomerulus obtained from grouped ddY (gddY) mice and negative in control mice (HIGA and Balb/c mice). Serum levels of IgA–MBL-A immune complex (IC) and IgA–MBL-C IC were significantly higher in gddY mice than those of HIGA and Balb/c mice. *p = 0.01, **p = 0.001. (b) The positive area of glomerular C1q and C4 staining in gddY mice was stronger than that in HIGA mice. A: The serum level of IgA was significantly higher in HIGA mice than in those of gddY and Balb/c mice. However, the serum level of IgA–IgG2a IC was significantly higher in gddY mice than those of HIGA and Balb/c mice (The figure was modified from Hashimoto et al. [50])
7.4.1 Ligands for MBL
Hisano et al. reported that patients with mesangial deposits of IgA1 alone showed no deposition of C4, MBL, and MASP-1, and patients with deposits of both of IgA1 and IgA2 showed depositions of C4, MBL, and MASP-1. They concluded that AP activation occurs as a result of the mesangial deposition of IgA1 and that LP activation is associated with mesangial deposition of IgA2 [47]. On the other hand, Oortwijn et al. focused on SIgA and clearly demonstrated glomerular staining of SIgA with MBL and C4d in the patients with IgAN [30].
Generally, the protease-damaged surface of glomerular resident cells or apoptotic cells can be recognized by MBL. In regard to patients of lupus nephritis (LN), we recently proposed that positive glomerular staining for annexin V would be seen in the majority of patients who had confirmed glomerular deposits of MBL, L-ficolin, and properdin [51]. Further examinations will also be necessary to elucidate the initial activator of LP in situ.
7.4.2 Other Histological Significances of Complement Deposition
Two recent studies focused on the glomerular deposition of C4d and revealed that renal survival was significantly more ameliorated in patients of C4d-negative IgAN than in those of C4d positive [52, 53]. The 3-year renal survival rate was 39 % in C4d-positive patients and 66 % in C4d-negative patients, and the 20-year renal survival rate was 28 % in C4d-positive patients and 85 % in C4d-negative patients. In these studies, C4d-positive IgAN also presented higher blood pressure, urinary protein, and findings of segmental sclerosis and tubular damage than in those of C4d-negative IgAN. It is deeply interesting that these factors are the same as previously recognized independent worsening factors in IgAN. Thus, the presence of mesangial deposits of C4d may help us to identify patients with a worse prognosis.
Mesangial C3 deposition is highly observed in more than 90 % of renal specimens in IgAN [1, 54]. Although we also encounter the extraglomerular deposition of C3 (ex-C3) in the results of a routine histological study (Fig. 7.7), these findings have received less attention in the pathogenesis of IgAN. We analyzed 170 patients who were diagnosed with IgAN [55]. 79 cases presented C3 deposition in glomeruli without other ex-C3 deposits, and 91 cases presented C3 deposition with ex-C3 deposition located in Bowman’s capsules and/or afferent and efferent arterial walls. Valenzuela et al. suggested that passive diffusion probably does not explain ex-C3 deposition, and a drainage pathway of IC, which connects from the intraglomerulus to extraglomerulus, is assumed. Because the intraglomerular mesangial matrix is continuous to the extraglomerular mesangial matrix in the juxtaglomerular region, as shown in several tracer injection studies, arteriolar C3 deposits might be derived from paramesangial areas [56–58]. We also speculated that an IC that consists of C3 is able to translocate from the paramesangial region to Bowman’s capsule through the adhesive lesion between the glomerular capillaries and Bowman’s capsules. In our study, the cases of ex-C3 deposits presented distinct clinical characteristics, such as hypertension and dyslipidemia at the time of renal biopsy. Especially, in the cases of ex-C3 deposits with obeity, the conventional symptomatic therapy resulted in their worse prognosis. Thus, we need to highlight the metabolic impacts on the progression of IgAN patients who have ex-C3 deposit.
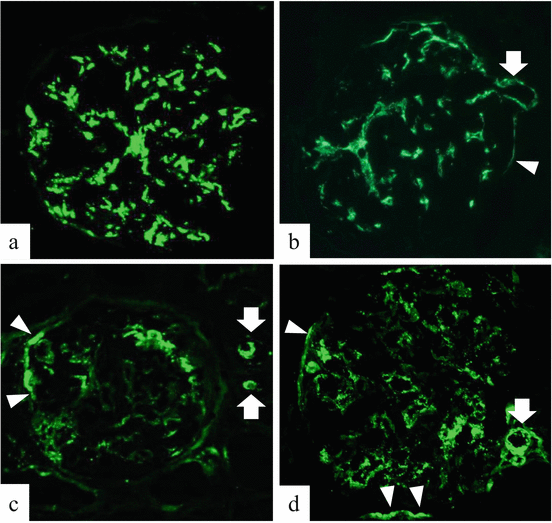

Fig. 7.7
Staining pattern of C3 deposition of IgA nephropathy (×200). Representative immunofluorescence photograph of IgA nephropathy. (a) C3 deposits in mesangial area. (b–d) These glomeruli have mesangial and extraglomerular deposits of C3 (arrow, afferent and/or efferent arteriolar deposition; arrow head, Bowman’s capsule deposition) (The figure was modified from Ohsawa et al. [55])
7.5 New Insights
Several pathogenic viral and bacterial antigens have been proposed as being responsible for the formation of mesangial deposits of IgA, and infection might trigger the onset and progression of IgAN [59, 60]. Gong et al. described the association of the MBL polymorphism of codon 54 and infection in patients with IgAN [61]. In that report, patients carrying the variant allele (GAC) had episodes of upper respiratory or gastrointestinal infections prior to onset, or exacerbation of IgAN, which are absent in wild homozygotes (GGC/GGC).
In other types of glomerular disease, such as membranous nephropathy and LN, patient’s urine contains complement regulatory proteins and MAC, amounts of which fluctuate with disease activity [62–64]. We found strong associations between the urinary level of fH and that of MAC along with the disease progression of IgAN [65]. Also, urinary levels of fH and MAC were positively correlated with serum creatinine, urinary N-acetyl-ß-D-glucosaminidase, urinary ß2-microglobulin, urinary protein, the degree of interstitial fibrosis, and the percentage of global glomerular sclerosis. Recently, Liu et al. showed that urinary MBL and C3 are candidates for predicting biomarkers for IgAN [66]. Especially, in urinary MBL, the concentration of MBL was significantly elevated along with histological damage, estimated GFR, and proteinuria.
Looking at recent progress, the pathological importance of LP activation and properdin are in focus for kidney diseases. In the case of LN, LP and PDP might be activated via the recognition of surface molecules of glomerular resident cells, which are usually hidden in the cell membrane [51, 67]. On the other hand, properdin can directly bind to proximal tubular epithelial cells (PTEC) and accelerate PTEC damage via AP activation by surpassing fH regulation [67]. The pathophysiological significance of PDP will be mandatory in the search for renal damage mechanisms.
To elucidate the participations of complement system paves to develop the new therapeutic strategies. The anti-C5 monoclonal antibody eculizumab® achieves therapeutic success in atypical hemolytic uremic syndrome and C3 glomerulopathy [68]. A constant region of eculizumab consists of IgG4 that lacks the ability to bind to the Fc receptor and to activate complements via CP. The following case report is interesting: a 16-year-old male presented rapidly progressive glomerulonephritis with heavy proteinuria, and his histological diagnosis was IgAN [69]. In spite of aggressive immunosuppressive treatment, his renal function had been worsening. The induction of eculizumab for 3 months was able to rescue renal function, and discontinuation of eculizumab resulted in deterioration of renal function. We have to explore the application of eculizumab and develop new complement-directed drugs.
7.6 Conclusion
A deeper understanding of the mechanism of complement activation may help to elucidate the pathogenesis of IgAN. This chapter summarizes the current knowledge of the role of the complement system in the pathogenesis of IgAN. Because traces of LP activation in the fluid phase and local glomerular tissues have accumulated, it appears that the activations of AP and LP are very much involved in the pathogenesis of IgAN.
Conflict of Interest
The author declares that he has no conflict of interest.
References
1.
2.
3.
4.
Ricklin D, Hajishengallis G, Yang K, Lambris JD. Complement: a key system for immune surveillance and homeostasis. Nat Immunol. 2010;11:785–97.CrossRefPubMedPubMedCentral
5.
Kemper C, Atkinson JP, Hourcade DE. Properdin: emerging roles of a pattern-recognition molecule. Annu Rev Immunol. 2009;28:131–55.CrossRef
6.
7.
Zipfel PF, Skerka C. Complement regulators and inhibitory proteins. Nat Rev Immunol. 2009;9:729–40.PubMed
8.
Noris M, Remuzzi G. Overview of complement activation and regulation. Semin Nephrol. 2013;33:479–92.CrossRefPubMedPubMedCentral
9.
Nilsson B, Ekdahl KN. Complement diagnostics: concepts, indications, and practical guidelines. Clin Dev Immunol. 2012. doi:10.1155/2012/962702.PubMedPubMedCentral
10.
Hauptmann G, Goetz J, Uring-Lambert B, Grosshans E. Component deficiencies: 2. Fourth Component. 1986;39:232–49.
11.
12.
13.
Ohsawa I, Ohi H, Endo M, Fujita T, Kanmatsuse K, Nonaka M. Novel estimation of histologic activity in human glomerulonephritis by detection of complement component C3 messenger RNA. Clin Exp Nephrol. 1998;2:50–7.CrossRef
14.
15.
Tang S, Zhou W, Sheerin NS, Vaughan RW, Sacks SH. Contribution of renal secreted complement C3 to the circulating pool in humans. J Immunol. 1999;162:4336–41.PubMed
16.
Cianflone K, Xia Z, Chen LY. Critical review of acylation-stimulating protein physiology in humans and rodents. Biochim Biophys Acta (BBA) Biomembr. 2003;1609:127–43.CrossRef
17.
18.
19.
Nagamachi S, Ohsawa I, Sato N, Ishii M, Kusaba G, Kobayashi T, et al. Immune complex-mediated complement activation in a patient with IgG4-related tubulointerstitial nephritis. Case Rep Nephrol Urol. 2011;1:7–14.CrossRefPubMedPubMedCentral
20.
Pickering MC, D’Agati VD, Nester CM, Smith RJ, Haas M, Appel GB, et al. C3 glomerulopathy: consensus report. Kidney Int. 2013;84:1079–89.CrossRefPubMedPubMedCentral
21.
Tomino Y, Suzuki S, Imai H, Saito T, Kawamura T, Yorioka N, et al. Measurement of serum IgA and C3 may predict the diagnosis of patients with IgA nephropathy prior to renal biopsy. J Clin Lab Anal. 2000;14:220–3.PubMed
22.
23.
24.
25.
Nikolova EB, Tomana M, Russell MW. The role of the carbohydrate chains in complement (C3) fixation by solid-phase-bound human IgA. Immunology. 1994;82:321–7.PubMedPubMedCentral
26.
27.
Kokubo T, Hiki Y, Iwase H, Tanaka A, Toma K, Hotta K, et al. Protective role of IgA1 glycans against IgA1 self-aggregation and adhesion to extracellular matrix proteins. J Am Soc Nephrol. 1998;9:2048–54.PubMed
28.
29.
30.
31.
32.
Shimamoto M, Ohsawa I, Suzuki H, Hisada A, Nagamachi S, Honda D, et al. Impact of body mass index on progression of IgA nephropathy among Japanese patients. J Clin Lab Anal. 2014. doi:10.1002/jcla.21778.PubMed
33.
34.
Ishii M, Ohsawa I, Inoshita H, Kusaba G, Onda K, Wakabayashi M, et al. Serum concentration of complement components of the lectin pathway in maintenance hemodialysis patients, and relatively higher levels of L-ficolin and MASP-2 in mannose-binding lectin deficiency. Ther Apher Dial. 2011;15:441–7.CrossRefPubMed
35.
Ohsawa I, Ishii M, Ohi H, Tomino Y. Pathological scenario with the mannose-binding lectin in patients with IgA nephropathy. J Biomed Biotechnol. 2012. doi:10.1155/2012/476739.PubMedPubMedCentral
36.
37.
Barbour TD, Pickering MC, Cook HT. Dense deposit disease and C3 glomerulopathy. Semin Nephrol. 2013;33:493–507.CrossRefPubMedPubMedCentral
38.
Kavanagh D, Goodship TH, Richards A. Atypical hemolytic uremic syndrome. Semin Nephrol. 2013;33:508–30.CrossRefPubMedPubMedCentral
39.
40.
Gharavi AG, Kiryluk K, Choi M, Li Y, Hou P, Xie J, et al. Genome-wide association study identifies susceptibility loci for IgA nephropathy. Nat Genet. 2011;43:321–7.CrossRefPubMedPubMedCentral
41.
Malik TH, Lavin PJ, de Goicoechea JE, Vernon KA, Rose KL, Patel MP, et al. A hybrid CFHR3-1 gene causes familial C3 glomerulopathy. J Am Soc Nephrol. 2012;23:1155–60.CrossRefPubMedPubMedCentral
42.
Raychaudhuri S, Ripke S, Li M, Neale BM, Fagerness J, Reynolds R, et al. Associations of CFHR1-CFHR3 deletion and a CFH SNP to age-related macular degeneration are not independent. Nat Genet. 2010;42:553–5.CrossRefPubMedPubMedCentral
43.
Zhu L, Zhai YL, Wang FM, Hou P, Lv JC, Xu DM, et al. Variants in complement factor H and complement factor H-related protein genes, CFHR3 and CFHR1, affect complement activation in IgA nephropathy. J Am Soc Nephrol 2014; pii: ASN.2014010096
44.
45.
Conley ME, Cooper MD, Michael AF. Selective deposition of immunoglobulin A1 in immunoglobulin A nephropathy, anaphylactoid purpura nephritis, and systemic lupus erythematosus. J Clin Invest. 1980;66:1432–6.CrossRefPubMedPubMedCentral
46.
Tomino Y, Sakai H, Miura M, Endoh M, Nomoto Y. Detection of polymeric IgA in glomeruli from patients with IgA nephropathy. Clin Exp Immunol. 1982;49:419–25.PubMedPubMedCentral
47.
48.
49.
Liu L, Liu N, Chen Y, Wang L, Jiang Y, Wang J, et al. Glomerular mannose‐binding lectin deposition is a useful prognostic predictor in immunoglobulin A nephropathy. Clin Exp Immunol. 2013;174:152–60.CrossRefPubMedPubMedCentral
50.
Hashimoto A, Suzuki Y, Suzuki H, Ohsawa I, Brown R, Hall S, et al. Determination of severity of murine IgA nephropathy by glomerular complement activation by aberrantly glycosylated IgA and immune complexes. Am J Pathol. 2012;181:1338–47.CrossRefPubMedPubMedCentral
51.
52.
Espinosa M, Ortega R, Sanchez M, Segarra A, Salcedo MT, Gonzalez F, et al. Association of C4d deposition with clinical outcomes in IgA nephropathy. Clin J Am Soc Nephrol. 2014;9:897–904.CrossRefPubMedPubMedCentral
53.
Sahin OZ, Yavas H, Taslı F, Gibyeli DG, Ersoy R, Uzum A, et al. Prognostic value of glomerular C4d staining in patients with IgA nephritis. Int J Clin Exp Pathol. 2014;7:3299–304.PubMedPubMedCentral
54.
55.
56.
Valenzuela R, Gogate PA, Deodhar SD, Gifford RW. Hyaline arteriolar nephrosclerosis. Immunofluorescence findings in the vascular lesions. Lab Invest. 1980;43:530–4.PubMed
57.
58.
60.
61.
62.
63.
64.
65.
Onda K, Ohsawa I, Ohi H, Tamano M, Mano S, Wakabayashi M, et al. Excretion of complement proteins and its activation marker C5b-9 in IgA nephropathy in relation to renal function. BMC Nephrol. 2011;12:64. doi:10.1186/1471-2369-12-64.CrossRefPubMedPubMedCentral
66.
Liu L, Jiang Y, Wang L, Liu N. Urinary mannose‐binding lectin is a biomarker for predicting the progression of immunoglobulin (Ig) A nephropathy. Clin Exp Immunol. 2012;169:148–55.CrossRefPubMedPubMedCentral
67.
Nagamachi S, Ohsawa I, Suzuki H, Sato N, Inoshita H, Hisada A, et al. Properdin has an ascendancy over factor H regulation in complement-mediated renal tubular damage. BMC Nephrol. 2014;15:82. doi:10.1186/1471-2369-15-82.CrossRefPubMedPubMedCentral
68.


