[level-membership-for-otolaryngology-category]
Chapter 4 Clinical polysomnography
1 INTRODUCTION
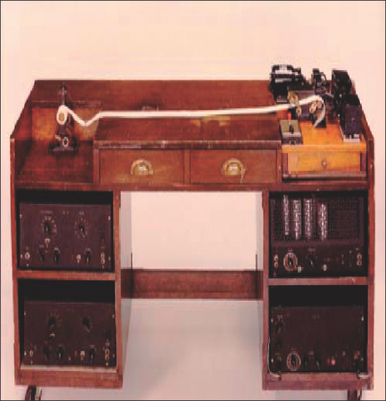
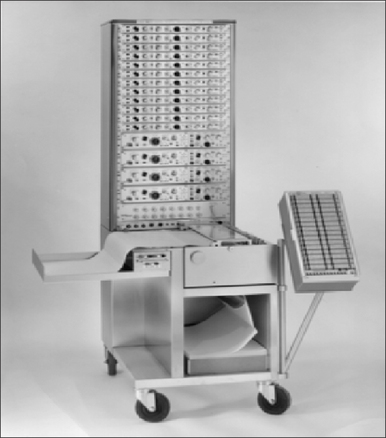
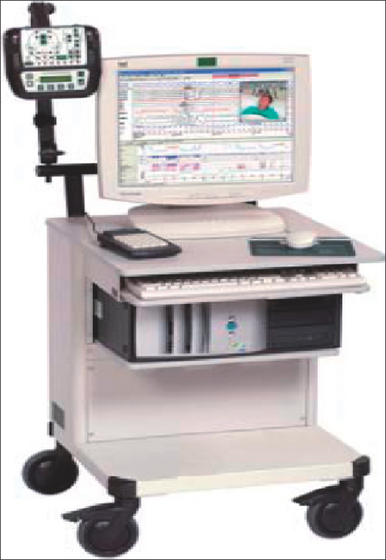
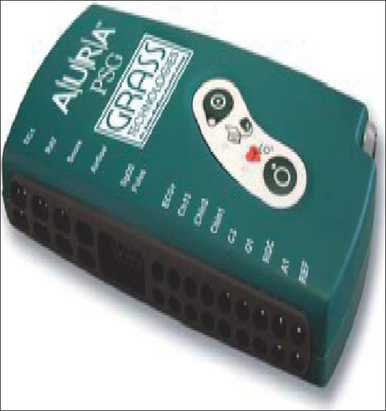
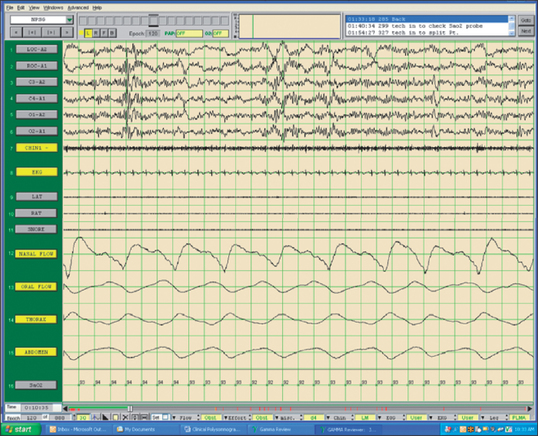
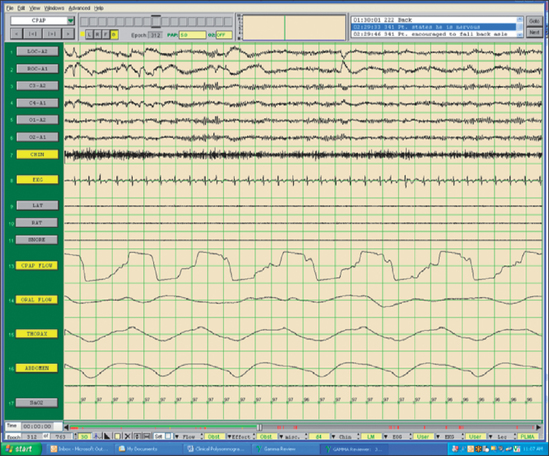
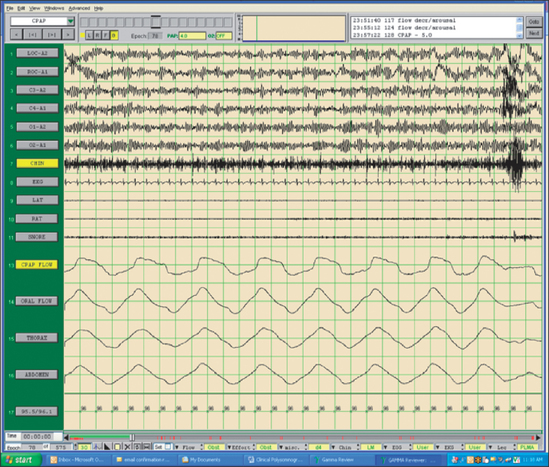
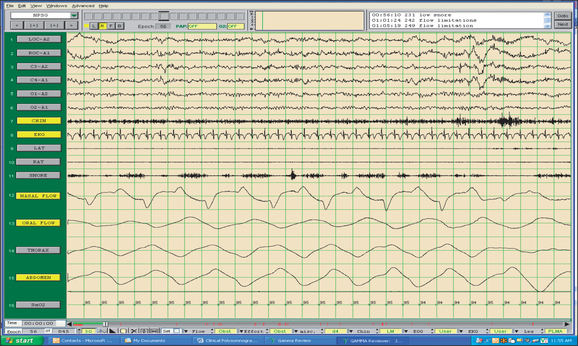
The field of sleep medicine has experienced an explosion of interest in recent years. This heightened focus on achieving an advanced understanding of sleep and its inherent pathologies is attributable, in large part, to significant improvement in the development of more suitable instrumentation. This, in turn, has led to more accurate measurement and comprehension of sleep processes and related parameters, although many questions regarding sleep mechanisms remain. The relative simplicity of instrumentation used by Hans Berger in the late 1920s to first describe the human electroencephalogram (EEG)1 has been eclipsed by technology implemented today at sleep centers around the world where not only the EEG is recorded during polysomno-graphy (PSG), but usually the electro-oculogram (EOG), electromyogram (EMG), electrocardiogram (ECG), respiratory effort, nasal/oral airflow, SaO2 levels, snoring, and body position with video monitoring are as well. In a much less standardized manner, additional parameters may be measured depending upon the clinical presentation of the patient and the technical capabilities of the individual sleep center. Thus, end tidal CO2 (ETCO2) may be measured in a patient with chronic obstructive pulmonary disease (COPD) or the placement of an esophageal balloon may be considered in appropriate patients to clarify the diagnosis of upper airway resistance syndrome (UARS) by measuring esophageal pressures during sleep. We have seen a gradual transformation from the traditional, pen-and-paper recording of sleep to the current, state-of-the-art, digital acquisition and reviewing of sleep (see Figs 4.1–4.4). As our knowledge of sleep and its pathologies is refined, the inexorable demand for further advancements concerning instrumentation becomes more acute, as is true in many other areas of health science in general. This chapter will serve to clarify the types of sleep studies used in the evaluation process of sleep-related breathing disorders (SRBD), provide guidelines for their acquisition pre- and postoperatively, and present typical montages used during PSG with special attention paid to the measurement of nasal/oral airflow.
2 SLEEP-RELATED BREATHING DISORDERS (SRBDs) AND RECOMMENDED TESTING
According to the American Academy of Sleep Medicine (AASM), when factors inclusive of sensitivity, specificity, likelihood ratios, and strength of evidence are analyzed, a categorization of four subtypes of sleep-monitoring procedures is the outcome.2 Type 1 is the gold standard attended in-laboratory PSG, while the other three include portable monitoring methods inclusive of Type 2 (comprehensive), Type 3 (modified portable sleep apnea testing or cardiorespiratory sleep study), and Type 4 (continuous single recording, such as ambulatory overnight pulse oximetry, or dual bioparameter recording). Type 4 monitoring devices are considered unacceptable by the AASM for making the diagnosis of obstructive sleep apnea. Type 2 and 3 devices may be helpful in an attended setting used for patients without significant comorbid conditions, and if manually scored by trained personnel. It has been noted that the Type 3 devices have a tendency to underestimate the severity of OSA secondary to the absence of EEG monitoring in that arousals are not scored.3 Furthermore, it is recommended by the AASM that symptomatic patients with negative portable studies undergo attended PSG for further clarification.2 According to AASM standards, a full night PSG is routinely indicated for the diagnosis of SRBDs and for continuous positive airway pressure (CPAP) titration in patients with a documented diagnosis of a SRBD for whom PAP is warranted. Such patients include those with a Respiratory Disturbance Index (RDI) of at least 15 per hour of sleep regardless of their presenting symptomatology or those with a RDI of at least five per hour of sleep with excessive daytime sleepiness. Split-night PSGs (diagnostic segment followed by CPAP titration on the same night) are considered acceptable if the Apnea/Hypopnea Index (AHI) is at least 40 events per hour of sleep and is documented by means of at least 2 hours of diagnostic recording, or if the AHI is between 20 and 40 in the presence of repetitive lengthy obstructions and major desaturations. In addition, the CPAP titration must be carried out for more than 3 hours, and the PSG must document that CPAP eliminates the respiratory events during sleep, including REM sleep with the patient in the supine position.2
Excessive daytime somnolence is often part of the clinical presentation of patients with a SRBD. There are several means by which the degree of somnolence may be measured, both subjectively (e.g. Epworth Sleepiness Scale) and objectively. The Multiple Sleep Latency Test (MSLT) is a series of nap opportunities (usually four or five) scheduled 2 hours apart beginning 1.5–3 hours after the morning awakening following PSG, which are conducted under specified conditions using accepted protocols. Patients are asked to try to fall asleep during these nap opportunities. The procedures used to perform the Maintenance of Wakefulness Test (MWT) are similar to those utilized for the MSLT with the exception that the patient is asked to remain awake under the same soporific conditions utilized for the MSLT. The MSLT is a validated objective measure of the patient’s ability or tendency to fall asleep while the MWT is a validated objective measure of the patient’s ability to remain awake under soporific conditions. Although closely related, these two procedures serve to define a patient’s sleepiness from different perspectives. The MSLT is not routinely indicated in the initial evaluation for a SRBD or in the assessment of change following treatment with nasal CPAP.4 However, the MWT may be used to assess an individual’s ability to remain awake if an inability to do so potentially constitutes a public or personal safety issue. Patients with a SRBD who are employed in occupations involving public transportation or safety may require assessment of their ability to remain awake. Although data regarding usefulness of the MSLT or the MWT are limited, using the MWT to assess ability to remain awake has been reported to have greater face validity than using the MSLT.4 However, the predictive value of either test for assessing accident risk and safety within the context of real- life circumstances is not well established. The assessment of the patient’s ability to remain awake and consequent safety risks should involve the integration of findings from the history, compliance with therapy, subjective rating scales, and in some cases, objective testing using the MWT.
4 SPECIAL POPULATIONS
Patients with some specific medical conditions deserve mention. In general, those with a history of coronary artery disease, congestive heart failure, a history of stroke or transient ischemic attacks, significant tachyarrhythmias or bradyarrhythmias should be screened for signs and symptoms of a SRBD.2 If there is a reasonable suspicion of these conditions, then a PSG is warranted. Furthermore, the application of CPAP at least during the perioperative period in many cases is prudent.
The pediatric population also merits attention. Although most children with obstructive sleep apnea present with a history of snoring and evidence of some difficulty breathing during sleep, not all of them snore. Paradoxical breathing is often prominent secondary to their very compliant rib cages. The scoring of respiratory events in adults requires a duration of at least 10 seconds, while the standard in children has been defined by a period of at least two respiratory cycles.5 In children, these respiratory events may or may not be followed by EEG arousals. This often leads to fairly normal sleep architecture. The respiratory events occur predominantly in REM sleep. The ordering of PSG is indicated in neonates and infants when apnea of prematurity or of infancy is suspected, or following apparent life-threatening events (ALTEs). When severe gastroesophageal reflux is suspected, PSG is also indicated. The presence of a craniofacial congenital malformation involving the face, mouth, tongue, neck or chest, such as Treacher Collins syndrome or Pierre Robin syndrome, or following surgery on a child performed to correct these anatomical abnormalities, should also prompt a consideration for PSG. Other disorders which should urge the clinician to obtain PSG include suspected seizure disorders or any disorder which can cause hypotonia.6
5 UNDERSTANDING SLEEP MONTAGES
AC amplifier recordings on pen and paper are, by definition, bipolar derivations. Since electrical potential is a relative measurement and is always calculated as the difference between two potential points,7 each individual AC channel on the pen-and-paper recording represents a derivation of one channel being subtracted from another. Most typically, the EOG as measured by the left and right outer canthi (LOC/ROC) and EEG channels (i.e. C3/C4/O1/O2) are referenced to the contralateral mastoid (i.e. A1/A2) whereas EMG (i.e. mentalis–submentalis), left and right anterior tibialis (LAT/RAT) and ECG signals (i.e. left and right subclavicle) are typically referenced to themselves. This means that there are two electrodes applied to the same site. Through various combinations of analog capacitors and resistors, biological signals that are amplified are also filtered for unwanted electrical potentials (i.e. 60 cycle noise). Ultimately, what is written to paper is the final product of amplified and filtered, biological signals that are plotted as a function of time (e.g. paper speed). There is no way to alter the data once they are written.
Given these difficulties plus the recent advances in computing technology, digital PSGs are currently the standard for most sleep laboratories. Although digital sleep systems were originally designed to emulate the analog polygraphs, improvements in microprocessor speed and graphic cards have allowed digital systems to advance beyond the limitations of the analog systems. For example, analog PSG systems were limited by physical space; there were only so many oscillators (the magnet, coil and pen apparatus that allowed the biological signal to be written to paper) you could attach to the chassis of the polygraph. As is evidenced by the original standardized manual for recording and staging sleep,8 only a limited number of channels were used to record sleep compared to today’s standards. In contrast, today’s digital sleep systems can easily allow for more than 32 channels of AC and DC channels.
Another important advance in digital PSG is the ability to perform referential recording. Referential recording, in contrast to bipolar recording, sends the signals from each biological input to a common reference (e.g. C3-Ref, LOC-Ref, Chin EMG-Ref). In other words, referential recording allows us to record the potential difference between a particular electrode and a reference electrode.9 Frequently, the common reference is cephalic (e.g. Cz or FPz) although there are several examples of non-cephalic references (e.g. the nose). The advantage of this type of recording is that it allows the polysomnographer to re-reference electrodes, invert polarity, change montages and change filter settings after the PSG is complete.
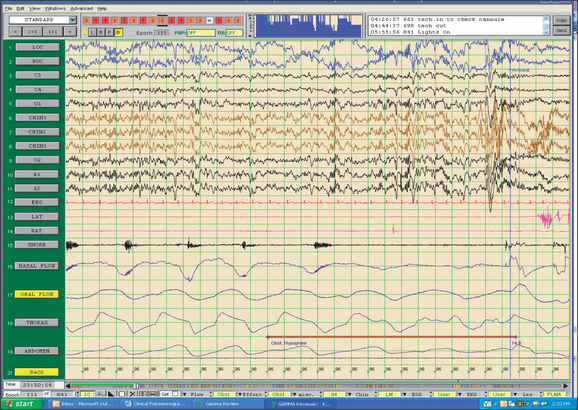
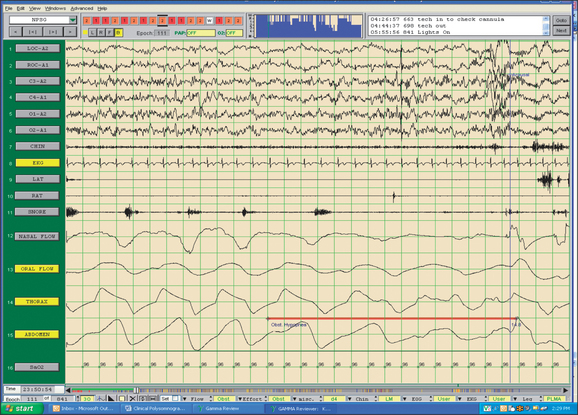
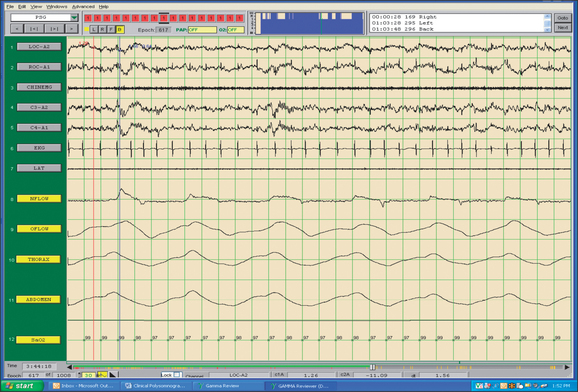
Fig. 4.5 shows a standard, referential sleep montage. In particular, channels 1–11 are referenced to a common reference (Cz) and channels 12–19 are bipolar in origin. Channels 1–19 are collected through an AC amplifier. The SaO2 channel is collected through a DC amplifier. As is typically the case with referential data, there are no filters applied. Fig. 4.6 shows the same epoch of data, but is correctly referenced as bipolar derivations (except the DC channel (SaO2)) and appropriate filter settings are applied. In this case, EOG and EEG channels 1–6 are referenced to the contralateral mastoid and channels 8–15 are referenced to themselves.
6 UNDERSTANDING MONTAGE CHANNELS
In order to interpret and score sleep stages, a combination of EOG, EEG and Chin EMG channels are necessary. Some of the derivations are, by default, back-up channels8 (e.g. C4/A1 and O2/A1) as a way of avoiding disruption of the patient’s sleep should one of the leads become compromised. As is seen in Fig. 4.5, there are three referential Chin EMG channels collected, with one of these leads always serving as a back-up. When displayed in its appropriate bipolar derivation, only one Chin EMG channel appears (see Fig. 4.6). The third chin lead can be re-referenced in case one of the other chin leads falls off. In order to interpret the impact of physiological events upon sleep architecture, other channels have been added to aid in the differential diagnosis of sleep disorders. In particular, these channels are typically ECG, Leg EMG (LAT, RAT), a snore microphone, airflow from the nose and mouth, thoracic and abdominal deflections and pulse oximetry (SaO2). It is also not uncommon in sleep recordings to see additional channels measuring capnometry (ETCO2) and position sensors. Table 4.1 illustrates the types of channels that are most typically included in current digital recordings of sleep along with their appropriate labels, sample rates and filter setting ranges. Included in Table 4.1 are the traditional PSG sensitivity settings and their approximated, corresponding, digital, peak-to-peak (p-p) values. This is because analog and digital PSG systems differ regarding units of sensitivity: units of analog sensitivity are calculated as follows:
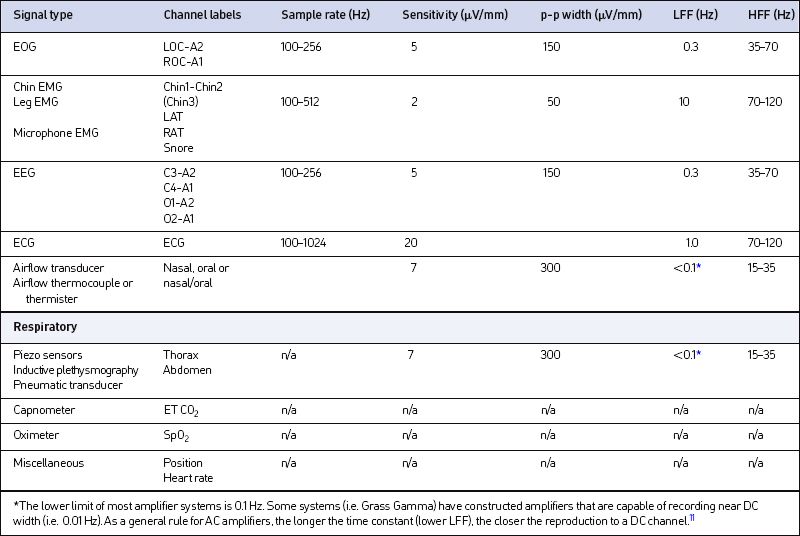

Digital systems, in contrast, divide the display into the number of vertical pixels allowed for each channel that are expressed in peak-to-peak microvolts per channel.10
In contrast to the continuous, voltage-time display seen in analog data, digital data converts biological signals into discrete impulses, called quantizing. The finer the steps, the more accurately digital data represents the analog data.12 This analog-to-digital (A–D) conversion is dependent upon two factors for accuracy: sampling frequency and bit depth. Sampling frequency, the number of digital samples taken per second, is modulated by Nyquist’s theorem:

Nyquist’s theory dictates that the fastest frequency signal that can be represented is one-half the sampling frequency. For example, a sampling frequency of 256 Hz accurately represents signal frequencies up to 128 Hz. Sampling below 2 fN (fN=Nyquist frequency) results in either aliasing or signal distortion due to folding of frequency components larger than fN onto lower frequencies.13 Aliasing refers to the phenomenon where sinusoidal signals change frequency and phase during sampling (see Fig. 4.7). In either case, since the digital data are no longer uniquely related to a particular analog signal, unambiguous reconstruction is impossible.13
Bit depth (vertical resolution) designates the number of divisions into which the range of voltages can be represented. Each stepwise increase in bit depth increases the number of possible amplitude levels by a factor of two. For example, a bit depth of eight means that there are 28=256 individual steps between the minimum and maximum allowable voltages. For PSG recordings, the full scale range should approximate 2000 μV. The lower limit of the dynamic range is set by amplifier noise which, in most commercial systems, is around 0.1 μV. Systems not capable of meeting this minimum dynamic range run the possibility of losing data or collecting inadequate data. Adding bits will tend to increase the precision of the measurement. It should be noted that most commercial systems are now capable of collecting data with a large enough dynamic range (+5000 μV) that data errors such as saturation, a process whereby the amplifier sends a signal greater in strength than the dynamic range (see Fig. 4.8), are highly unlikely.
7 ASSESSING AIRFLOW AND RESPIRATORY SIGNALS
7.1 THERMOCOUPLES AND THERMISTERS
For years, thermocouples and thermisters were the only available, non-invasive tools for assessing airflow. Thermocouples are made from two dissimilar metals with different coefficients of expansion.14 The thermocouple is typically placed under the nares and over the mouth and rates of temperature change are expressed as a continuous, analog, sinusoidal signal. Thermisters also detect temperature changes between room air and expired air through use of a Wheatstone bridge circuit that acts as a DC converter.14 The beads of the thermisters are placed in a nearly identical fashion to the thermocouple and signal output is also continuous and sinusoidal in nature. While these measures were adequate for detecting either the presence or absence of airflow, they were not designed to or not sensitive enough to detect subtle changes that were occurring in the upper airway.
7.2 NASAL PRESSURE TRANSDUCER
Even though the esophageal balloon is considered the gold standard for identifying respiratory effort and upper airway physiology, the insertion of the balloon is so highly invasive that this is an impractical technique for routine use. In the mid-1990s, however, it was determined that use of a nasal cannula connected to a pneumotachograph provided a very close approximation to the sensitivity of the esophageal balloon.15 With the advent of this technology and its widespread usage, a number of differential diagnostic possibilities emerged in the assessment and treatment of SRBDs. In particular, UARS was introduced to the diagnostic lexicon and alternative treatment opportunities became available to patients with milder forms of OSA.
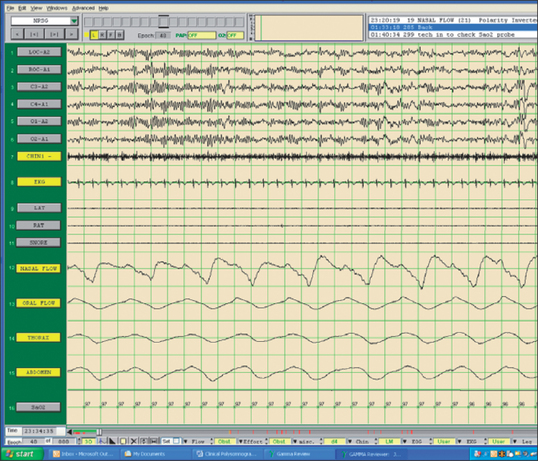
Nasal flow, as measured through a nasal cannula system, measures a pressure drop across a relatively constant resistance (nares). Even though nasal flow is not precisely quantifiable, the flow signal generated is approximately proportional to the pressure across the resistor.11 The pressure across the resistor is noteworthy because some commercial nasal cannulas include an oral measurement component. This type of cannula recording system is flawed due to lack of resistance on the oral flow and, as a result, caution is warranted when interpreting data from this type of system. DC amplification is the preferred modality for the nasal cannula signal although amplifiers capable of long time constants (>5 seconds) will also work. Time constants shorter than 5 seconds will adversely affect the morphology of the inspiratory flow signal. Fig. 4.9 shows an accurate representation of flow limitation during stage 1 sleep.
7.3 STRAIN GAUGES
The piezoelectric sensor is the most common method utilized to detect changes in lung volume. Its popularity is due to the relatively low cost and ease of application. This type of gauge is sensitive to changes in length since electrical current varies inversely to the length of the gauge,16 although the signal is not easily quantifiable. Instead, the qualitative or morphological aspect of the signal is taken into account with the ideal respiratory signal appearing as a perfect sinusoid. Fig. 4.5 shows an example of respiratory signals collected with piezoelectric sensors. One important caution is that since piezoelectric respiratory sensors typically sample at less than 2 fN, there is an increased likelihood of aliasing errors (see Fig. 4.7).
7.4 RESPIRATORY INDUCTANCE PLETHYSMOGRAPHY (RIP)
Electrical conductors that, by definition, measure inductance can be applied to thoracic and abdominal sensors.16 The changes in inductance can be measured electronically through frequency oscillators that are output to a demodulator unit that converts the signal into a scaled, analog form.14 The advantage RIP sensors have over other methods of respiratory monitoring is that the RIP signal can be calibrated. As a result, the RIP sensor is considered the truest measure of paradoxical breathing and it has additionally been utilized as a way of assessing UARS. Disadvantages to this sensor include cost and artifact due to patient movement. For example, if a RIP sensor were to slide from its original position, the initial calibration would become less meaningful. As is seen in Fig. 4.10, the output signal of the RIP sensors is qualitatively comparable to the piezoelectric sensors.
1. Berger H. Uber dar elektrenkephalogram des menschen. Arch Psychiat Nervenky. 1929;87:527-570.
2. Kushida C.A., Littner M.R., Morgenthaler T., et al. Practice parameters for the indications for polysomnography and related procedures: an update for 2005. Sleep. 2005;28(4):499-516.
3. Littner M, Hirshkowitz M, Shararfkhaneh A, et al. Nonlaboratory assessment of sleep-related breathing disorders. In: Sleep Medicine Clinics, 1(4). Hirshkowitz M, Sharafkhaneh A, eds. Philadelphia: WB Saunders; 2006, pp. 461–3.
4. Littner M., Kushida C.A., Wise M., et al. Practice parameters for clinical use of the multiple sleep latency test and the maintenance of wakefulness test. Sleep. 2005;28(1):113-121.
5. Rosen G., Carskadon M., Ferber R., et al. Pediatric obstructive sleep apnea. In: Sateia M., editor. The International Classification of Sleep Disorders. 2nd edn. Westchester, Illinois: American Academy of Sleep Medicine; 2005:56-59.
6. Sheldon S. Polysomnography in infants and children. In: Sheldon S., Ferber R., Kryger M., editors. Principles and Practice of Pediatric Sleep Medicine. Edinburgh: Elsevier Saunders; 2005:49-71.
7. Quigg M. Channels and montages. In: EEG Pearls. Quigg M, ed. The Pearls Series. Edinburgh: Mosby, Elsevier; 2006, pp. 21–23.
8. Rechtschaffen A., Kales A., editors. A Manual of Standardized Terminology: Techniques and Scoring System for Sleep Stages of Human Subjects. Los Angeles, CA: UCLA Brain Information Service/Brain Research Institute, 1968.
9. Rowan JA, Tolunsky E. Origin and technical aspects of the EEG. In: Primer of EEG with a Mini-Atlas. Philadelphia, PA: Butterworth-Heinemann; 2003, pp. 1–21.
10. Quigg M. Channels and montages. In: EEG Pearls. Quigg M, ed. The Pearls Series. Edinburgh: Mosby, Elsevier; 2006, pp. 11–12.
11. Norman R.G., Ahmed M.M., Walsleben J.A., et al. Detection of respiratory events during NPSG: nasal cannula/pressure sensor versus thermistor. Sleep. 1997;20:1175-1184.
12. Quigg M. Channels and montages. In: EEG Pearls. Quigg M, ed. The Pearls Series. Edinburgh: Mosby, Elsevier; 2006, pp. 13–14.
13. Smith SW. The Scientist’s and Engineer’s Guide to Digital Signal Processing. 2nd edn. California Technical Publishing, CA; pp. 225–42.
14. Spriggs WH. Equipment and amplifiers. In: Principles of Polysomnography: A Complete Training Program for Sleep Technicians. Salt Lake City, UT: Sleep Ed, LLC, 2002; pp. 50–58.
15. Hosselet J.J., Norman R.G., Ayappa I., et al. Detection of flow limitation with a nasal cannula/pressure transducer system. Am J Respir Crit Care Med.. 1998;157(5):1461-1467.
16. Kryger M.H. Monitoring respiratory and cardiac function. In: Kryger M., Roth T., Dement W., editors. Principles and Practice of Sleep Medicine. 3rd edn. Philadelphia: W.B. Saunders; 2000:1217-1230.
Bolliger CT. Sleep Apnea – Current Diagnosis and Treatment. Progress in Respiratory Research Series, vol. 35. Basel: Karger; 2006.
Butkov N. Atlas of Clinical Polysomnography, volumes 1 and 11. Ashland, OR: Synapse Media; 1996.
Kryger M., Roth T. Dement W. Principles and Practice of Sleep Medicine, 4th edn. Philadelphia: Elsevier Saunders; 2005.
McNicholas W., Phillipson E. Breathing Disorders in Sleep. Philadelphia: WB Saunders; 2002.
[/level-membership-for-otolaryngology-category][not-level-membership-for-otolaryngology-category]
Chapter 4 Clinical polysomnography
1 INTRODUCTION
The field of sleep medicine has experienced an explosion of interest in recent years. This heightened focus on achieving an advanced understanding of sleep and its inherent pathologies is attributable, in large part, to significant improvement in the development of more suitable instrumentation. This, in turn, has led to more accurate measurement and comprehension of sleep processes and related parameters, although many questions regarding sleep mechanisms remain. The relative simplicity of instrumentation used by Hans Berger in the late 1920s to first describe the human electroencephalogram (EEG)1 has been eclipsed by technology implemented today at sleep centers around the world where not only the EEG is recorded during polysomno-graphy (PSG), but usually the electro-oculogram (EOG), electromyogram (EMG), electrocardiogram (ECG), respiratory effort, nasal/oral airflow, SaO2 levels, snoring, and body position with video monitoring are as well. In a much less standardized manner, additional parameters may be measured depending upon the clinical presentation of the patient and the technical capabilities of the individual sleep center. Thus, end tidal CO2 (ETCO2) may be measured in a patient with chronic obstructive pulmonary disease (COPD) or the placement of an esophageal balloon may be considered in appropriate patients to clarify the diagnosis of upper airway resistance syndrome (UARS) by measuring esophageal pressures during sleep. We have seen a gradual transformation from the traditional, pen-and-paper recording of sleep to the current, state-of-the-art, digital acquisition and reviewing of sleep (see Figs 4.1–4.4). As our knowledge of sleep and its pathologies is refined, the inexorable demand for further advancements concerning instrumentation becomes more acute, as is true in many other areas of health science in general. This chapter will serve to clarify the types of sleep studies used in the evaluation process of sleep-related breathing disorders (SRBD), provide guidelines for their acquisition pre- and postoperatively, and present typical montages used during PSG with special attention paid to the measurement of nasal/oral airflow.
2 SLEEP-RELATED BREATHING DISORDERS (SRBDs) AND RECOMMENDED TESTING
According to the American Academy of Sleep Medicine (AASM), when factors inclusive of sensitivity, specificity, likelihood ratios, and strength of evidence are analyzed, a categorization of four subtypes of sleep-monitoring procedures is the outcome.2 Type 1 is the gold standard attended in-laboratory PSG, while the other three include portable monitoring methods inclusive of Type 2 (comprehensive), Type 3 (modified portable sleep apnea testing or cardiorespiratory sleep study), and Type 4 (continuous single recording, such as ambulatory overnight pulse oximetry, or dual bioparameter recording). Type 4 monitoring devices are considered unacceptable by the AASM for making the diagnosis of obstructive sleep apnea. Type 2 and 3 devices may be helpful in an attended setting used for patients without significant comorbid conditions, and if manually scored by trained personnel. It has been noted that the Type 3 devices have a tendency to underestimate the severity of OSA secondary to the absence of EEG monitoring in that arousals are not scored.3 Furthermore, it is recommended by the AASM that symptomatic patients with negative portable studies undergo attended PSG for further clarification.2 According to AASM standards, a full night PSG is routinely indicated for the diagnosis of SRBDs and for continuous positive airway pressure (CPAP) titration in patients with a documented diagnosis of a SRBD for whom PAP is warranted. Such patients include those with a Respiratory Disturbance Index (RDI) of at least 15 per hour of sleep regardless of their presenting symptomatology or those with a RDI of at least five per hour of sleep with excessive daytime sleepiness. Split-night PSGs (diagnostic segment followed by CPAP titration on the same night) are considered acceptable if the Apnea/Hypopnea Index (AHI) is at least 40 events per hour of sleep and is documented by means of at least 2 hours of diagnostic recording, or if the AHI is between 20 and 40 in the presence of repetitive lengthy obstructions and major desaturations. In addition, the CPAP titration must be carried out for more than 3 hours, and the PSG must document that CPAP eliminates the respiratory events during sleep, including REM sleep with the patient in the supine position.2
Excessive daytime somnolence is often part of the clinical presentation of patients with a SRBD. There are several means by which the degree of somnolence may be measured, both subjectively (e.g. Epworth Sleepiness Scale) and objectively. The Multiple Sleep Latency Test (MSLT) is a series of nap opportunities (usually four or five) scheduled 2 hours apart beginning 1.5–3 hours after the morning awakening following PSG, which are conducted under specified conditions using accepted protocols. Patients are asked to try to fall asleep during these nap opportunities. The procedures used to perform the Maintenance of Wakefulness Test (MWT) are similar to those utilized for the MSLT with the exception that the patient is asked to remain awake under the same soporific conditions utilized for the MSLT. The MSLT is a validated objective measure of the patient’s ability or tendency to fall asleep while the MWT is a validated objective measure of the patient’s ability to remain awake under soporific conditions. Although closely related, these two procedures serve to define a patient’s sleepiness from different perspectives. The MSLT is not routinely indicated in the initial evaluation for a SRBD or in the assessment of change following treatment with nasal CPAP.4 However, the MWT may be used to assess an individual’s ability to remain awake if an inability to do so potentially constitutes a public or personal safety issue. Patients with a SRBD who are employed in occupations involving public transportation or safety may require assessment of their ability to remain awake. Although data regarding usefulness of the MSLT or the MWT are limited, using the MWT to assess ability to remain awake has been reported to have greater face validity than using the MSLT.4 However, the predictive value of either test for assessing accident risk and safety within the context of real- life circumstances is not well established. The assessment of the patient’s ability to remain awake and consequent safety risks should involve the integration of findings from the history, compliance with therapy, subjective rating scales, and in some cases, objective testing using the MWT.
4 SPECIAL POPULATIONS
Patients with some specific medical conditions deserve mention. In general, those with a history of coronary artery disease, congestive heart failure, a history of stroke or transient ischemic attacks, significant tachyarrhythmias or bradyarrhythmias should be screened for signs and symptoms of a SRBD.2 If there is a reasonable suspicion of these conditions, then a PSG is warranted. Furthermore, the application of CPAP at least during the perioperative period in many cases is prudent.
The pediatric population also merits attention. Although most children with obstructive sleep apnea present with a history of snoring and evidence of some difficulty breathing during sleep, not all of them snore. Paradoxical breathing is often prominent secondary to their very compliant rib cages. The scoring of respiratory events in adults requires a duration of at least 10 seconds, while the standard in children has been defined by a period of at least two respiratory cycles.5 In children, these respiratory events may or may not be followed by EEG arousals. This often leads to fairly normal sleep architecture. The respiratory events occur predominantly in REM sleep. The ordering of PSG is indicated in neonates and infants when apnea of prematurity or of infancy is suspected, or following apparent life-threatening events (ALTEs). When severe gastroesophageal reflux is suspected, PSG is also indicated. The presence of a craniofacial congenital malformation involving the face, mouth, tongue, neck or chest, such as Treacher Collins syndrome or Pierre Robin syndrome, or following surgery on a child performed to correct these anatomical abnormalities, should also prompt a consideration for PSG. Other disorders which should urge the clinician to obtain PSG include suspected seizure disorders or any disorder which can cause hypotonia.6
[/not-level-membership-for-otolaryngology-category]
