Clinical Measurement and Monitoring
Clinical measurement is limited by four major constraints:
 Feasibility of measurement. The sensitivity and inherent variability of a clinical measurement depend on complex interactions and technical difficulties at the biological interface between the patient and the instrument.


Monitoring is the process by which clinical measurements are assessed and used to direct therapy. In general, monitors consist of four components (Table 16.1): (1) a device which connects to the patient – this may either be a direct attachment or via a tube or lead; (2) a measuring device, often a transducer which converts the properties of the patient into an electrical signal; (3) a computer which may amplify the signal, filter it and integrate it with other variables to produce a variety of derived variables; (4) a display which may show the results as a wave, a number or a combination. It is important to appreciate that most monitors do not directly measure the displayed variable, and that the displayed variable may not reflect physiological function. For example, an electrocardiograph (ECG) does not measure cardiac function and therefore a normal ECG trace does not guarantee that the heart is pumping effectively. When interpreting measurements, the following questions should be asked:
TABLE 16.1
Connection to patient
Measuring device
Electronic filter/amplifier
Display
 What is being measured? In the case of arterial pressure, there is an obvious answer. However, in some cases, for example ‘depth of anaesthesia’, it may not be clear what the monitor is measuring. In addition, many monitors use data from a variety of sources. For example, heart rate is usually derived from the ECG. However, if the ECG fails to provide the data required, the monitor often switches automatically to a rate from either a pulse oximeter or an arterial pressure waveform. Thus, the displayed value may change rapidly despite the patient remaining stable.


Table 16.2 shows the checks which the anaesthetist should follow before using a patient monitor.
TABLE 16.2
What is being measured?
What method is being used?
Has the monitor been serviced and calibrated?
Is the environment appropriate?
Is the patient appropriate?
Is it attached to the appropriate part of the patient?
Is the range appropriate?
Can the display be read?
Are the alarms on and have the limits been set?
PROCESS OF CLINICAL MEASUREMENT
Stages of Clinical Measurement


The Microprocessor Revolution
Advantages of digital signal processing include:
 continuous real-time detection, processing and recording of measurements
 increased range of measurements possible
 miniaturization of complicated and powerful instruments
 sophisticated artefact rejection and noise reduction algorithms


 storage in memory, permitting trend analysis, future display and further analysis


Essential Requirements for Clinical Measurement
The Importance of Repeated Measurements
Differences in repeated clinical measurements arise from three causes:


Measurement of Continuous Signals Over Time
Analogue and Digital Processing
Data Display
Useful instruments communicate measurements in an appropriate and user-friendly manner.
Microprocessor-Controlled Displays
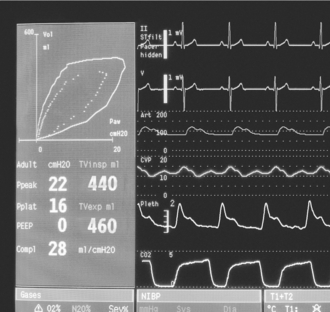
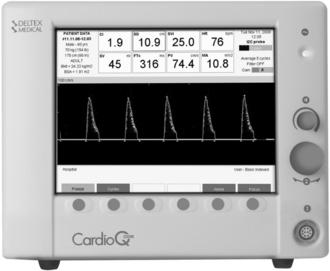
Digital signal processing has revolutionized clinical measurement. Modern monitors comprise a single system integrating various measurements of physiology, and display information as discrete measurements as well as continuous analogue waveforms (Fig. 16.1). This paradox, the conversion of analogue information into digital and then back to analogue, illustrates the real power of digital signal processing to manipulate and present information in a relevant and user-friendly manner. Data patterns (waveforms, trends, graphs) can be recreated or processed in other ways from the original digital signal to assist the anaesthetist, with the original digital signal being stored in a computer record without degradation of the quality of the signal.
BIOLOGICAL ELECTRICAL SIGNALS
Amplification
Noise and Interference
Noise Originating from the Patient: Millivolt ECG potentials on the body surface are hundreds of times larger than microvolt EEG signals on the scalp. EMG signals may be even larger, and muscular activity, especially shivering, causes severe interference. Two features of electronic amplifier design substantially improve the EEG signal-to-noise ratio. ECG potentials are essentially the same across the scalp and are ignored by amplifiers with a high common mode rejection. EMG activity has a higher frequency content than the EEG signal, and may be minimized by a low-pass filter which attenuates the higher-frequency response of the amplifier to a level which attenuates the EMG signals and does not interfere with the characteristics of the EEG.
Noise Originating from the Patient–Electrode Interface: Recording electrodes do not behave as passive conductors. All skin–metal electrode systems employ a metal surface in contact with an electrolyte solution. Polarization describes the interaction between metal and electrolyte which generates a small electrical gradient. Electrodes comprising metal plated with one of its own salts, e.g. silver—silver chloride, avoid this problem because current in each direction does not significantly change the electrolyte composition. Mechanical movement of recording electrodes may also cause significant potential gradients – alteration in the physical dimensions of the electrode changes the cell potential and skin–electrode impedance. Differences in potential between two electrodes connected to a differential amplifier are amplified and asymmetry of electrode impedance seriously impairs the common mode rejection ratio of the recording amplifier.
Noise Originating Outside the Patient: Electrical interference. Mains frequency interference with the recording of biological potentials may be troublesome, particularly in electromagnetically noisy clinical environments. Patients function physically as large unscreened conductors and interact with nearby electrical sources through the processes of capacitive coupling and electromagnetic induction.
THE CARDIOVASCULAR SYSTEM
Electrocardiography
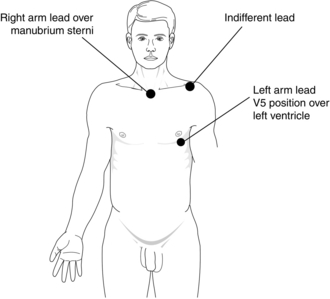
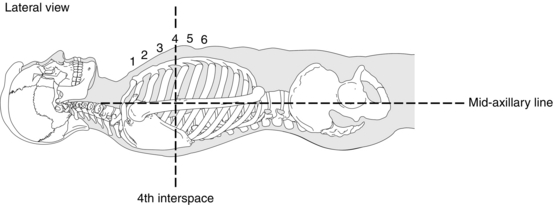
Different lead positions detect electrical activity from different parts of the myocardium. The commonest position of the electrodes used in the operating theatre is the CM5 arrangement, as this is the best position to detect ischaemia of the left ventricle (Fig. 16.2).
Arterial Pressure
Oscillometric Measurement of Arterial Pressure
The oscillometric measurement of arterial pressure estimates arterial pressure by analysis of the pressure oscillations which are produced in an occluding cuff by pulsatile blood flow in the underlying artery during deflation of the cuff (Fig. 16.3). The original automatic oscillometers used two cuffs. The upper cuff was inflated to occlude the arterial flow and then gradually deflated. As the blood flow began to pass under the upper cuff, the small changes in volume were detected by the lower cuff with an electromechanical pressure transducer. Modern machines use a single cuff with two tubes for inflation/measurement. During slow deflation, each pulse wave produces a pressure transient in the cuff which may be distinguished from the slowly decreasing ambient pressure in the cuff. Above systolic pressure, the transients are small, but suddenly increase in magnitude when the cuff pressure reaches the systolic point. As the cuff pressure decreases further, the amplitude reaches a peak and then starts to diminish. The mean arterial pressure correlates closely with the lowest cuff pressure at which the maximum amplitude is maintained. As the cuff pressure reaches diastolic pressure, the transients abruptly diminish in amplitude. To avoid high cuff pressures and long deflation times, monitors inflate the cuff to just above a normal systolic pressure and then slowly decrease the pressure until a pulse is detected. Consequently, estimates of diastolic pressure can be unreliable. If a pulse is not detected, the cuff is then inflated to a higher pressure. This process may be repeated several times before a measurement is made.
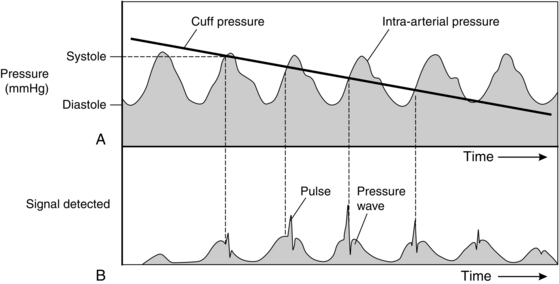
FIGURE 16.3 Diagram showing: (A) Relationship between cuff pressure and intra-arterial pressure as cuff pressure decreases during oscillometry; (B) the signal created by the relative pressure changes in A. The sharp spikes of pressure in B are created by the walls of the artery opening and closing. These spikes are detected by a transducer first when the cuff pressure is just below systolic arterial pressure; their amplitude reaches a peak at mean arterial pressure and they cease when the cuff pressure is below diastolic pressure.
Clinical studies comparing automatic oscillometric instruments with direct arterial pressure have demonstrated good correlation for systolic pressure with a tendency to overestimate at low pressures and underestimate at high pressures. Mean and diastolic pressures were less reliable. The 95% confidence interval for all three indices exceeded 15 mmHg. The disadvantages of automated oscillometry are shown in Table 16.3.
TABLE 16.3
Disadvantages of Automated Oscillometry
Delayed measurement with arrhythmias or patient movement
Inaccuracy with systolic pressure < 60 mmHg
Inaccurate if the wrong size cuff used
May be inaccurate in obese patients
Discomfort in awake patients
Skin and nerve damage in prolonged use
Delay in injected drugs reaching the circulation
Backflow of blood into i.v. cannulae
Pulse oximeter malfunction as cuff is inflated
Other Techniques: Measuring devices depend on the detection of movement of the arterial wall using changes in pressure or sound below audible frequencies and detection of blood flow using the Doppler shift of an ultrasound signal, or plethysmography. Several other techniques have been used to measure arterial pressure, but have failed to find widespread usage. These include the Penaz technique, which measures the effect of external pressure on the blood flow through a finger, and other devices relying on pressure measurements over an artery, Doppler probes or detection of Korotkoff sounds with a microphone.
Direct Measurement
The advantage of direct measurements is a real-time measure of arterial pressure, which is essential when administering drugs such as vasopressors to critically ill patients (Table 16.4). Such measurement systems also provide a means for obtaining samples for arterial blood gas analysis and other blood tests. The use of arterial cannulae has therefore become standard practice for severely ill patients, both in the operating theatre and in the intensive care unit.
TABLE 16.4
Advantages of Direct Arterial Pressure Measurement
Accuracy of pressure measurement
Beat-by-beat observation of changes when blood pressure is variable or when vasoactive drugs are used
Accuracy at low pressures
Ability to obtain frequent blood samples
However, errors are common as a result of malpositioning of the transducers and failure to zero the transducer before use. For example, if the operating table is moved upwards while the transducer remains static, the difference in height artificially increases the pressure reading. Further, while modern disposable sets are usually reliable and accurate, they may occasionally malfunction. Unusual readings should therefore be checked against a reading from a non-invasive monitor. Complications relating to arterial cannulae are shown in Table 16.5.
TABLE 16.5
Complications Relating to Arterial Cannulae
Requires skill to insert
Bleeding
Pain on insertion
Arterial damage and thrombosis
Embolization of thrombus or air
Ischaemia to tissues distal to puncture site
Sepsis
Inadvertent injection of drugs
Late development of fistula or aneurysm
Resonant Frequency and Damping: Fourier showed that all complex waveforms may be described as a mixture of simple sine waves of varying amplitude, frequency and phase. These consist of a fundamental wave, in this case at the pulse frequency, and a series of harmonics. The lower harmonics tend to have the greatest amplitude and a reasonable approximation to the arterial pressure waveform may be obtained by accurate reproduction of the fundamental and first 10 harmonics. In other words, to reproduce an arterial waveform at 120 beats min–1 accurately would require transduction with a linear frequency response up to a frequency of at least (120 × 10)/60 = 20 Hz. Accurate reproduction of a waveform requires that both the amplitude and phase difference of each harmonic are faithfully reproduced. This requires a transduction system with a natural frequency higher than the significant frequency components of the system, and the correct amount of damping.
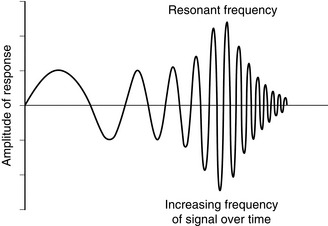
The fluid and diaphragm of the transducer constitute a mechanical system which oscillates in simple harmonic motion at the natural resonant frequency. This determines the frequency response of the measurement system (Fig. 16.4). The resonant frequency of a catheter-transducer measuring system is highest, and the frictional resistance to fluid flow which dampens the frequency response is lowest, when the velocity of movement of fluid in the catheter is minimized. This is achieved with a stiff, low-volume displacement diaphragm and a short, wide, rigid catheter.
Determination of the Resonant Frequency and Damping: The resonant frequency and the effects of damping may be estimated by applying a step change in pressure to the catheter-transducer system and recording the response (Fig. 16.5). The underdamped system responds rapidly but overshoots and oscillates close to the natural resonant frequency of the system; frequency components of the pressure wave close to the resonant frequency are exaggerated. By contrast, the overdamped system responds slowly and the recorded signal decreases slowly to reach the baseline, with no overshoot. High-frequency oscillations are damped, underestimating the true pressure changes. These extremes are undesirable.
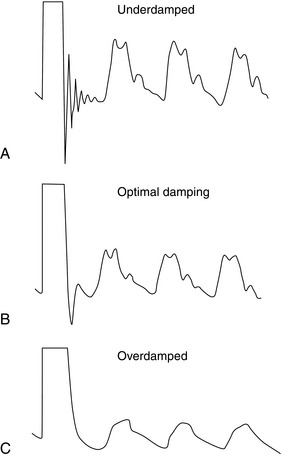
Optimal Damping: Optimal damping maximizes the frequency response of the system, minimizes resonance and represents the best compromise between speed of response and accuracy of transduction. A small overshoot represents approximately 7% of the step change in pressure, with the pressure then following the arterial waveform (Fig. 16.5).
Central Venous Pressure
There are four common routes for central venous catheterization.
 Long catheters inserted via the antecubital fossa are relatively easy and safe to insert but are of small diameter. Catheters inserted via the basilic or cephalic vein are sometimes difficult to advance past the shoulder. It is also difficult to determine if the tip of the catheter is within a central vein without X-ray imaging. Thrombosis of the veins is common if the catheter is left in situ for more than 24 h.


As the central venous pressure is relatively low, it may be measured using a simple manometer. However, a central venous catheter is usually connected to the same type of transducer and flush system described for arterial cannulae. This provides a continuous readout of pressure, allowing the effect of infusions of fluids to be assessed in real time. However, because the central venous pressure is low, great care is required to ensure that the pressure is measured relative to the correct zero point (the right atrium) on the patient (Fig. 16.6). Although a single reading of central venous pressure is of little diagnostic use, a change in response to fluid challenge is more useful. In general, if a fluid challenge has little effect on the central venous pressure, the patient is likely to be hypovolaemic. In contrast, a marked increase in pressure indicates fluid overload. However, in unwell patients, the correlation between the CVP response to a fluid challenge and circulating volume is poor. Caution is required in using this principle to guide fluid therapy in hospitalized patients.
Complications are infrequent but potentially serious, and are shown in Table 16.6.
TABLE 16.6
Complications of Central Venous Catheterization
Acute
Arrhythmias
Bleeding
Air embolus
Pneumothorax
Damage to thoracic duct, oesophagus, carotid artery, stellate ganglion
Cardiac puncture
Catheter embolization
Delayed
Sepsis
Thrombosis
Cardiac rupture
Pulmonary Artery Pressure
Although a central venous cannula may be used to estimate venous volume, it measures the filling of the right side of the heart. However, cardiac output and systemic arterial pressure are determined primarily by the filling pressure of the left side of the heart. When introduced, the pulmonary artery flotation catheter (PAFC), with its ability to measure cardiac output and left atrial pressure, appeared to be a major advance. Recently, however, frequent complications, a lack of evidence of improved survival and the introduction of non-invasive techniques to estimate cardiac output have led to a decline in its use. The PAFC is also known as a Swan-Ganz or balloon tip catheter (Fig. 16.7).
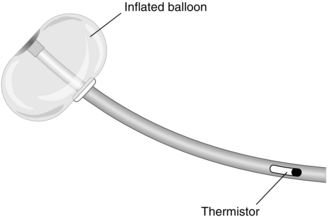
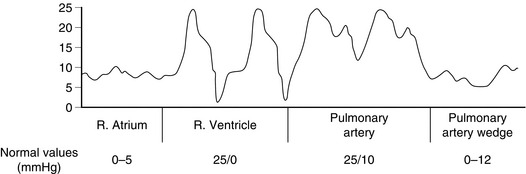
A PAFC is a long catheter with three or four lumens, and a thermistor near the tip. It is inserted into a neck vein through a large cannula. A flexible plastic sheath allows the catheter to be inserted, withdrawn and rotated after insertion without desterilizing it. After insertion into the superior vena cava, saline is injected to inflate a balloon at the tip. The pressure at the tip is measured via a transducer and displayed on a monitor. The catheter is then advanced slowly so that the blood flow directs the catheter toward the pulmonary artery. As the catheter is advanced, a series of changes in pressure is observed, marking the progression through the right atrium and right ventricle into the pulmonary artery (Fig. 16.8). Eventually, the balloon ‘wedges’ into a pulmonary artery. At this point, the tip is isolated from the pulmonary artery and measures the pressure in the pulmonary capillaries, which is taken to reflect left atrial pressure. Although the ability to estimate left atrial pressure is useful, the interpretation of measurements is as problematic as for central venous pressure (see above). For the same reasons, measuring the changes after a fluid challenge is more useful than a single reading.
The ability to measure the filling pressure of the left ventricle as well as the cardiac output was a major advance, and has led to many advances in our understanding of cardiac physiology and the mechanisms and treatments of diseases such as sepsis. However, the process of insertion described above is not always straightforward and prolonged manipulation may be needed to direct the catheter into the pulmonary artery. Arrhythmias are extremely common with catheter insertion and the technique carries all the risks of central venous catheterization noted above in addition to the risks shown in Table 16.7.
TABLE 16.7
Risks of Pulmonary Artery Catheterization (in Addition to those Shown in Table 16.6)
Arrhythmias with catheter manipulation
Damage to tricuspid and pulmonary valves
Knotting of catheter
Pulmonary infarction if balloon left inflated
Pulmonary artery rupture with balloon inflation
Cardiac rupture
Cardiac Output
The Fick Principle: The Fick principle defines flow by the ratio of the uptake or clearance of a tracer within an organ to measurements of the arteriovenous difference in concentration. It may be used to measure cardiac output, notably when applied to oxygen uptake or indicator dilution, and also regional blood flow, e.g. cerebral blood flow using the uptake of nitrous oxide, and renal blood flow from the excretion of compounds cleared totally by the kidney, such as para-aminohippuric acid.

Indicator Dilution: An indicator is injected as a bolus into the right heart and the concentration reaching the systemic side of the circulation is plotted against time (Fig. 16.9). The average concentration is calculated from the area under the concentration–time curve divided by the duration of the curve. The cardiac output during the period of this measurement is the ratio of the dose of indicator to the average concentration.
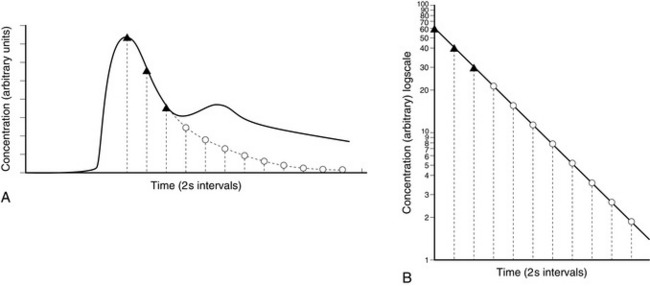
FIGURE 16.9 (A) Single injection indicator dilution curve showing distortion of downslope produced by recirculation. (B) Re-plot on semi-logarithmic paper.  = points taken from the downslope in A to establish the slope of the re-plot in B;
  = points taken from B to plot tail of curve in A. (Reproduced with permisssion from Sykes, M.K., Vickers, M.D., Hull, C.J., 1991. Principles of clinimeasurement, third ed. Blackwell Scientific Publications, Oxford.)

The main problem with this technique is that when the dye has been measured at the artery it passes back to the heart and then back to the arteries (known as recirculation), making the calculations more complex. This may be circumvented by extrapolation of the early exponential downslope to define the tail of the curve which would have been recorded if recirculation had not occurred (Fig. 16.9). The area under the curve is calculated by integration.
Chemical Indicator Dilution: Original studies used indocyanine green as the chemical indicator. It is non-toxic and has a relatively short half-life so that repeated measurements may be made. It also has a peak spectral absorption at 800 nm, which is the wavelength at which absorption of oxygenated haemoglobin is identical to that of reduced haemoglobin. The measurement is therefore not affected by arterial saturation. However, because the dye is cleared from the circulation only slowly, recirculation makes repeated measurements impossible. More recent monitors use an injection of lithium as a marker which is detected with a modified arterial catheter.
Thermal Indicator Dilution: This technique requires a PAFC to be in the pulmonary artery. The principle of the method is similar to other indicator dilution methods, but the injection and sampling are performed on the right side of the heart. A bolus of 10 mL of saline at room temperature is injected into the right atrium and the temperature change is recorded by a thermistor at the tip of the PAFC in the pulmonary artery. The smaller the temperature drop, the larger is the cardiac output. The recorded temperatures generate an exponential dilution curve with no recirculation. The ‘heat dose’ is the product of the difference in temperature between the injectate and blood multiplied by the density, specific heat and volume of the injectate. The average change in heat content is the area under the temperature–time graph multiplied by the density and specific heat of blood.
Thermal dilution techniques offer many advantages:
 the indicator is cheap and non-toxic
 repeated measurements may be made without accumulation of the indicator


Disadvantages of thermal dilution include the following:
 invasive and expensive pulmonary artery catheterization is required: the mortality associated with PAFC use may outweigh improvements in care
 the thermistor probe must be matched to the cardiac output processor
 mixing of the large bolus with venous blood may be incomplete
 pulmonary artery flow varies more with ventilation than does systemic flow


Pulse Contour Analysis: The shape of the arterial pulse (the pulse contour) is a product of the rate of ejection of blood into the aorta and the elasticity of the arterial tree. Therefore, if some assumptions are made about the arterial tree, the volume ejected at each heartbeat (stroke volume) may be calculated from the shape of the arterial pulse contour. Multiplying this by the heart rate provides an estimate of cardiac output. This system has the advantage of being able to calculate the cardiac output in near real-time using an arterial cannula alone.
Doppler Ultrasonography: Ultrasound techniques can detect the shape, size and movement of tissue interfaces, especially soft tissues and blood, including the echocardiographic measurement of blood flow and the structure and function of the heart. Sound waves are transmitted by the oscillation of particles in the direction of wave transmission and are defined by the amplitude of oscillation (the difference between ambient and peak pressures) and the wavelength (distance between successive peaks) or frequency (inversely proportional to wavelength, the number of cycles per second). These characteristics are measured by a pressure transducer placed in the path of an oncoming wave. The human ear detects frequencies within the range of 20–20 000 Hz. Diagnostic ultrasound uses frequencies in the range of 1–10 MHz. Short-term diagnostic use of ultrasound appears to be free from hazard.
Generation and Detection of Ultrasound: Generation and sensing of ultrasound are performed by transducers which are manufactured from ceramic materials containing lead zirconate and lead titanate which display the piezoelectric effect: the generation of an electrical charge in response to mechanical pressure. These substances are cheap, easily shaped and very efficiently transform mechanical to electrical energy and vice versa. Pressure on the surface of these materials generates a related and measurable electric charge. Conversely, applying a high-frequency alternating potential difference across the transducer changes the thickness and generates pressure waves in the form of ultrasound of the same frequency as the applied voltage.
Properties of Ultrasound: Shorter wavelengths and higher frequencies improve the resolution of distance, but tissue penetration is simultaneously reduced. Amplitude determines the intensity of the ultrasound beam, the number and size of echoes recorded and therefore the sensitivity of the instrument. Ultrasound is absorbed by tissues and reflected at tissue interfaces. The intensity of the beam decreases exponentially as it passes through tissue. Attenuation depends on the nature and temperature of the tissue, and is related linearly to the frequency of the ultrasound.
Detection of Motion by the Doppler Effect: Cardiac Output: When ultrasound waves reflect off an object moving towards the transmitter, there is an apparent increase in frequency as the object encounters more oscillations in a given time. This physical phenomenon is termed the Doppler effect. The change in frequency is proportional to the velocity of the object and two constants: the frequency of the transmitted ultrasound and the velocity of ultrasound in the medium. The velocity of the object can be calculated using the Doppler equation:

(Fd = change in Doppler frequency; C = speed of sound in medium; Ft = transmitted frequency; θ = angle of probe relative to the flow of blood)
In practice, a beam of ultrasonic waves is focused on the descending aorta and reflections from red cells are measured by a transducer in the same probe. Probes may be transthoracic (usually placed in the sternal notch) or placed in the oesophagus. The speed–time curve of the red cells (Fig. 16.10) is integrated to calculate the average velocity over each cardiac cycle. The stroke volume can be calculated by multiplying the average velocity per cycle with an estimation of the cross-sectional area of the aorta (using pre-determined values based on population data, or estimated echocardiographically).
Transoesophageal Echocardiography: Transoesophageal echocardiography uses a miniaturized ultrasonic probe inserted into the oesophagus under anaesthesia. It provides a real-time picture of all four cardiac chambers and valves. Its advantage is that it can identify any malfunctioning valves in addition to any wall-motion abnormalities related to myocardial ischaemia. It can also identify if therapy has successfully treated the ischaemia.
Thoracic Electrical Bioimpedance: Tissue impedance depends on blood volume. Measurement of thoracic impedance provides an index of stroke volume. Two circumferential electrodes are placed around the neck and two around the upper abdomen. A small (< 1 mA) constant, high-frequency (> 1 kHz) alternating current is passed between the outer electrodes and the resulting potential difference is detected by the inner pair. This potential is rectified, smoothed and filtered to record voltage fluctuations which reflect changes in impedance due to ventilation and cardiac activity. The cardiac activity is extracted by signal-averaging relative to the ECG R wave. This represents changes in thoracic blood volume and clearly resembles the pulse waveform.
THE RESPIRATORY SYSTEM
Measurement of Gas Flow and Volume

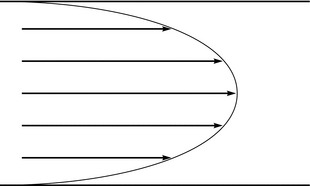
The concept of velocity is important in flow measurement because several instruments measure the velocity of flow and not the flow rate. The velocities of all molecules in a gas or liquid are not the same. Axial streaming is characteristic of laminar flow (Fig. 16.11).
Measuring Volume
Spirometers
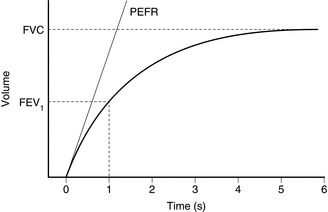
Dry spirometers are more convenient for clinical work. Gas displaces a rolling diaphragm or bellows and the expansion is recorded and related to gas volume. The ‘Vitalograph’ is a specialized type of bellows spirometer used for lung function testing. The patient makes a maximal forced exhalation into the spirometer through a wide-bore tube. The expansion of the wedge-shaped bellows is recorded by a stylus on a pressure-sensitive chart. The stylus moves across the x-axis (time) at a constant rate. The resultant plot represents the volume–time plot of the patient’s expiration (Fig. 16.12). The FVC is the maximal volume expired. Understanding of technique and active cooperation of the patient are essential for accurate and precise recordings. The patient must make an airtight seal with the mouthpiece and the nose is occluded with a nose clip. Expiration should be as forcible and rapid as possible. Several attempts are recorded. The highest value measured is recorded because the technique is dependent on voluntary effort, which usually improves with practice.
The Wright Respirometer
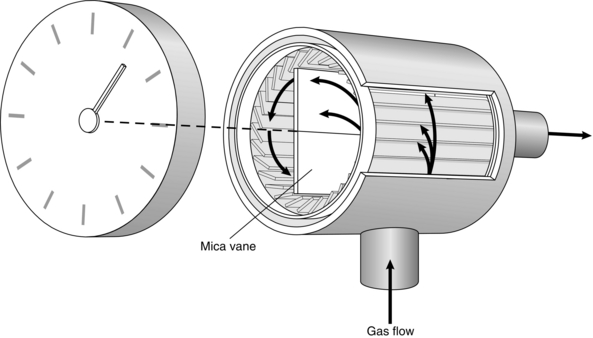
This device contains a light mica vane which rotates within a small cylinder (Fig. 16.13). Inflowing air is directed on to the vane by tangential slits. Rotation of the vane drives a gear chain and pointer on a dial. This mechanism is described as inferential because it does not measure either the volume or the flow of all of the gas flowing through the device. It is calibrated for normal tidal volumes and breathing rates by a sine wave pump. However, the meter seriously over-reads at high tidal volumes and under-reads at low tidal volumes because of the inertia of the moving parts.
Indirect Methods of Measuring Tidal Volume
Pneumography: Pneumographs sense changes in chest and abdominal circumference. Non-elastic tapes are placed around the chest and abdomen and the ends are connected to a displacement sensor. The output may be calibrated to provide a tidal volume signal. However, these devices are sensitive to position and require frequent calibration.
Respiratory Inductance Plethysmography: Respiratory inductance plethysmography uses a wire coil sewn into an elasticated strap. Expansion of the chest or abdomen increases the space between the coils and so alters the inductance generated by a high-frequency alternating (AC) current. The change in inductance depends on the cross-sectional area enclosed by the coil, which is closely related to change in volume. Inductance plethysmography has been used in various physiological studies to monitor postoperative respiratory depression and to detect apnoea.
Measuring Gas Flow
Variable Orifice (Constant Pressure Change) Flowmeters
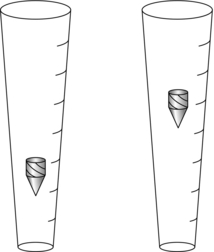
Rotameter: The Rotameter consists of a vertical glass tube inside which rotates a light metal alloy bobbin (Fig. 16.14). The flow of gas is controlled by the fine-adjustment flow control valve at the bottom of the Rotameter, and when this is opened, the pressure of the gas forces the bobbin up the tube. The inside of the tube is shaped like an inverted cone, so that the cross-sectional area of the annular space exactly opposes the downward pressure resulting from the weight of the bobbin. The pressure decrease remains constant throughout the range of flows for which the tube is calibrated and the bobbin rotates freely in the steady stream of gas. Each Rotameter must be calibrated for a specific gas. Laminar flow predominates at low flow rates and depends on the viscosity of gas. Turbulent flow increases at higher flow rates and the density of the gas becomes an important factor. Both density and viscosity of a gas vary with temperature and pressure, and each Rotameter must be calibrated for one specific gas in appropriate conditions.
The Peak Flowmeter: This useful clinical instrument is capable of measuring flow rates up to 1000 L min–1. Air flow causes a vane to rotate or a piston to move against the constant force of a light spring. This opens orifices which permit air to escape. The position adopted by the vane or piston depends primarily on the flow rate and on the area of the orifice which must be exposed to the air flow to maintain a constant pressure. The light moving vane or piston rapidly attains a maximum position in response to the peak expiratory flow. It is held in this position by a ratchet. The reading is obtained from a mechanical pointer which is attached to the vane or piston.
Variable Pressure Change (Fixed Orifice) Flowmeters
Bourdon Gauge Flowmeter: A Bourdon gauge is used to sense the pressure change across an orifice and is calibrated to the gas flow rate. These rugged meters are not affected by changes in position and are useful for metering the flow from gas cylinders at high ambient pressure. Back-pressure causes over-reading of the actual flow rate.
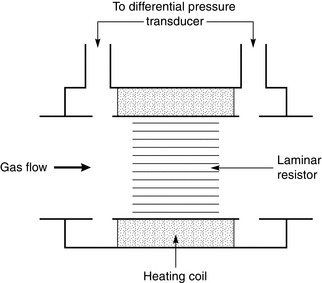
Pneumotachograph: The pneumotachograph measures flow rate by sensing the pressure change across a small but laminar resistance. Careful design ensures that the differential manometer senses the true lateral pressure exerted by the gas on each side of the resistance element (Fig. 16.15). The differential manometer needs to be very sensitive to record the tiny changes in pressure across the resistance and transduce them to a continuous electrical output. This signal may be integrated to give volume and the manometer must have good zero and gain stability.
Other Devices for Measuring Gas Flow
Measurements other than pressure change across an orifice have been used to measure flow.
Hot-Wire Flowmeters: These employ the rate of cooling of a heated wire, which depends on the gas flow rate and is measured by sensing the change in temperature. It also depends on the thermal conductivity of the gas, which is affected by changes in the gas composition and the presence of water vapour. This method is inexpensive, robust, reliable and works over a wide range of flows. However, it is not able to determine the direction of gas flow.
Ultrasonic Flowmeters: These flowmeters use the vortex-shedding technique. Gas is passed through a tube containing a rod 1–2 mm in diameter, mounted at right angles to the direction of gas flow. Vortices form downstream of the rod, the number of vortices formed being directly related to the flow rate. The vortices are detected using ultrasound and integrated to give a volume signal. Measurement is not affected greatly by temperature, humidity or changes in gas composition. A critical flow rate is required for the formation of vortices and the flowmeter is most accurate when the tidal volume is large.
GAS AND VAPOUR ANALYSIS

Physical Methods
Speed of response of the system is determined by two components:


Specific Methods


Carbon Dioxide and Anaesthetic Gases
Absorption of Radiation: Infrared radiation (1–15 μm) is absorbed by all gases with two or more dissimilar atoms in the molecule. Carbon dioxide, nitrous oxide and anaesthetic vapours absorb light at different wavelengths. Therefore, a cell is arranged with light sources on one side of a chamber and photoelectric cells on the other. Infrared light is dispersed through a prism or diffraction grating into a spectrum of different wavelengths. The test gas is then passed through the chamber and the amount of light absorbed is measured. The absorption spectrum is specific to each gas, and according to Beer–Lambert laws (see ‘Oximetry’), the amount of light absorbed is proportional to the concentration of the gas. In practice, the chambers have mirrors on each side so the light passes across the chamber many times to amplify the absorption. The chamber is also heated to avoid condensation. Accuracy is around 0.5% with a response time of < 0.5 s.
There are several sources of error with infrared analysis:
 The absorption wavebands of different gases may be coincident. For instance, the peak absorption bands for carbon dioxide, nitrous oxide and carbon monoxide are at 4.3, 4.5 and 4.7 μm respectively, and the absorption spectra inevitably overlap. Error is minimized by narrowing the band of infrared light


 Unexpected vapours, such as ethanol from an intoxicated patient, may introduce errors.
At the start of expiration, the carbon dioxide concentration is zero (dead space gas). The concentration then increases to a plateau level (alveolar gas). The end-tidal value of carbon dioxide concentration is used usually as a measure of the adequacy of ventilation because it approximates to alveolar and therefore arterial carbon dioxide partial pressure. However, when the respiratory rate is high, if tidal volume is low, if the sampling point is distant from the airway or if the gases tend to mix in the circuit, the ‘end-tidal’ value tends to be artificially low. This may give the impression that the lungs are being hyperventilated. For these reasons, it is difficult to measure end-tidal carbon dioxide meaningfully in small children. This is also true in patients, often smokers, who have marked ventilation/perfusion mismatch; there is often a prolonged upstroke on the capnograph trace and the relationship between end-tidal and arterial carbon dioxide tensions becomes less reliable (Fig. 16.16). If the capnograph trace does not appear to resemble a square wave, problems should be suspected and the arterial carbon dioxide partial pressure should be checked by blood gas analysis.
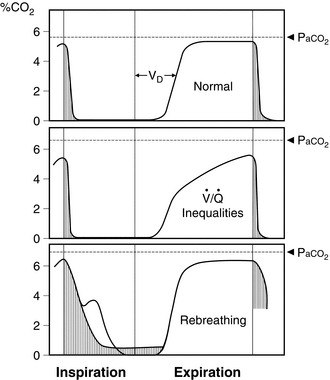
 , ventilation/perfusion.
Mass Spectrometry: Mass spectrometers are capable of separating the components of complex gas mixtures according to their mass and charge by deflecting the charged ions in a magnetic field. When a sample is introduced into a mass spectrometer, it passes into a vacuum where it is bombarded with high-energy electrons. These break up larger molecules and strip off their outer electrons. The resulting positively charged ions are then accelerated by a negatively-charged plate into a magnetic field. The magnetic field causes the moving particles to curve depending on how heavy they are (their mass:charge ratio). A row of sensors then measures the number of molecules and their sizes, in proportion to the partial pressure of the sampled gas. A mass spectrum is produced by relating the detector output on the y-axis (calibrated to concentration of gas) to the accelerating voltage on the x-axis (calibrated to molecular weight).
Gas–Liquid Chromatography: A gas chromatograph consists of two components: a column packed with inert beads covered in a thin film of oil (‘the stationary phase’), and a constant stream of inert gas which passes through the column. When a sample of gas is introduced at one end, the mixture passes into the column and past the oil. Insoluble gases tend to stay in the carrier gas and move through the column quickly, while soluble gases tend to dissolve in the oil, slowing their progress. At the other end of the column is a non-specific detector unit which yields an electronic signal proportional to the quantity of each substance present. Commonly used detectors include katharometers, flame ionization and electron capture detectors. Thus, any gas may be identified by the time it takes to pass through the column and its quantity measured by the detector unit. Their chief advantage is the ability to identify the components in a mixture of unknown compounds.
Raman Scattering: Passing a high-powered laser through a sample of gas causes a scattering of light of different wavelengths in a process known as the ‘Raman effect’. The change in wavelength is characteristic of the molecule under study. Thus, sensors placed at the side of the chamber may detect this radiation and identify the gases present. The size and complexity of this technique have restricted its use.
BLOOD GAS ANALYSIS
A potential difference is generated across hydrogen ion-sensitive glass depending on the gradient of hydrogen ions. The hydrogen ion concentration within the pH electrode is fixed by a buffer solution, so that the potential across the glass is dependent on the hydrogen ion concentration in the sample (Fig. 16.17).

Oxygenation
Oxygen Tension
Oxygen Electrode: the Polarographic Method: The oxygen electrode (Clark) consists of a platinum wire, nominally 2nm in diameter, embedded in a rough-surfaced glass rod. This is immersed in a phosphate buffer which is stabilized with KCl and contained in an outer jacket which incorporates an oxygen-permeable polyethylene or polypropylene membrane (Fig. 16.18). A polarizing voltage of between 600 and 800 mV is applied to the platinum wire and as oxygen diffuses through the membrane electro-oxidoreduction occurs at the cathode:
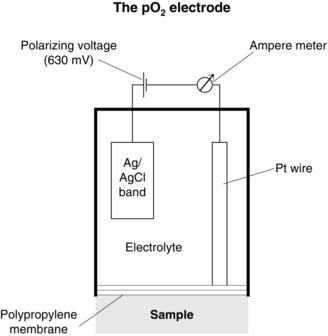
FIGURE 16.18 The oxygen electrode. (Reproduced from the Radiometer Reference Manual. Permission from Radiometer A/S, Åkandevej 21, DK-2700 Brønshøj, Denmark.)

Corresponding oxidation occurs at the Ag:AgCl anode:


Galvanic or Fuel Cell: Galvanic cells convert energy from an oxidation-reduction chemical process into electrical energy. The potential generated is dependent on the oxygen concentration.
Transcutaneous Electrodes: Transcutaneous electrodes are non-invasive and used extensively for monitoring neonatal blood gas tensions. The electrodes are based on principles similar to those used in blood gas analysers but also incorporate a heating element. The electrode is attached to the skin to form an airtight seal using a contact liquid and the area is heated to 43°C. At this temperature, the blood flow to the skin increases and the capillary oxygen diffuses through the skin, allowing measurement of the diffused gases by the attached electrode. The values obtained from the transcutaneous electrode are lower than those from a simultaneous arterial specimen. Many factors affect the transcutaneous measurement of oxygen tension, including the skin site and thickness. Most importantly, the electrode depends on local capillary blood flow and under-reads in the presence of hypotension and microcirculatory perfusion failure. Problems occur with surgical diathermy; the heating current circuit provides a return path for the cutting current which may cause the transcutaneous electrode to overheat.

Oximetry: Measurement of Oxygen Saturation
In Vitro Oximetry: Oximetry relies on the differing absorption of light at different wavelengths by the various states of haemoglobin. The absorption of radiation passing through a sample is measured. The degree of absorption of light, defined by the ratio of incident to emergent light intensities on a logarithmic scale, is proportional to the concentration of the molecules absorbing light (Beer’s law) and the thickness of the absorbing layer (Lambert’s law).
Oxyhaemoglobin and deoxyhaemoglobin differ at both the red and infrared portions of the absorption spectrum (Fig. 16.19). The differential absorption of two wavelengths of red and infrared light permits the calculation of the ratio of the concentrations of oxygenated and reduced haemoglobins. Additional wavelengths are added in co-oximeters for the calculation of the proportions of other species of haemoglobin, such as carboxyhaemoglobin and methaemoglobin, and the absolute absorbance is used to estimate total haemoglobin concentration from the sum of the various haemoglobins. This is important in measurements of oxyhaemoglobin for use in the calculation of oxygen content.
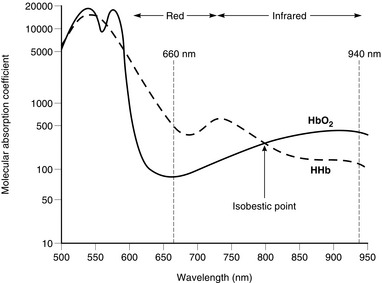
Pulse Oximetry: Light transmitted through tissues is absorbed not only by arterial blood but also by other tissue pigments and venous blood. However, the variation in light absorption with each pulse beat results almost entirely from pulsatile arterial blood flow. Two light-emitting diodes – red (660 nm) and infrared (940 nm) – shine light through a finger or earlobe and a photocell detects the transmitted light. The output of the sensor is processed to display a pulse waveform and the arterial oxygen saturation.
The pulse oximeter progresses through the following steps.
1. The sensor first measures the ambient light and subtracts this value from all other measurements. This implies that sudden changes in ambient light levels, e.g. after drapes are moved, may cause transient errors.
2. An LED is turned on and off rapidly. The absorption of transmitted light is then measured and the variations with time are recorded. The result is a waveform with a trough as blood flows into the finger (more absorption) during systole and a peak as blood flows into the veins in diastole. The monitor requires around eight heartbeats to make a calculation and then assumes the frequency of this waveform is the heart rate. Frequent ectopic beats or atrial fibrillation may lead to a delay in calculation or unreliable results.
3. The monitor then analyses the measurements and splits the absorption into two components. The fixed or unchanging absorption is assumed to result from tissues such as skin, muscle and bone (Fig. 16.20). The varying absorption is then assumed to be caused by arterial blood moving into the tissue. In situations such as hypotension, hypovolaemia or hypothermia, pulsation may be reduced to a point at which the monitor is not able to make any calculations and it fails to read. When a patient is on cardiac bypass the tissues are perfused, but if the flow is non-pulsatile, pulse oximeters cannot provide a reading.
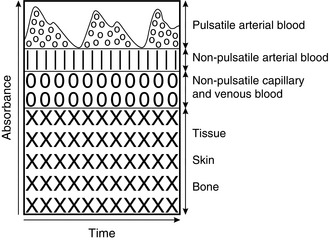
FIGURE 16.20 Schematic representation of the contribution of pulsatile arterial blood, non-pulsatile blood and tissues to the absorbance of light.
4. Steps 1–3 are repeated sequentially using light of at least two different wavelengths at around 120 Hz. When the absorptions of each different wavelength are known, the proportion of oxygenated and deoxygenated haemoglobin may be calculated. The measurements are processed and a new value displayed around every 8 s. Whilst improving reliability, this averaging introduces delay. Another source of delay is circulatory, dependent on the distribution of blood from the lungs to the tissues. The response time can exceed 1 min in normal subjects, and is exaggerated by low cardiac output or vasoconstriction.
Pulse oximeters provide rapid, non-invasive measurement of pulse rate and an estimate of oxygen saturation. The pulse oximeter has become one of the most widely used monitors and is particularly useful in situations in which it is difficult to identify cyanosis, e.g. if light levels are low, in pigmented patients and in areas where access is difficult such as CT/MRI scanners. Pulse oximeters are also used to measure the oxygen saturation in patients with intermittent respiratory problems, e.g. postoperative patients and those with sleep apnoea. Advances in technology have resulted in several small battery-powered devices becoming available for out-of-hospital use. Calibration points between 80% and 100% are derived from volunteer studies, and accuracy of pulse oximeters is around ± 2% above an oxygen saturation of 70%. Accuracy below 70% is not known precisely, because it is not ethical to conduct trials at these levels. It is important to note that, especially when oxygen therapy is used, normal oxygen saturation does not equate to normal ventilation. For example, in opioid overdose, hypoventilation may lead to potentially fatal hypercapnia without any decrease in oxygen saturation if the patient is breathing a high concentration of oxygen. Complications are rare. The major drawbacks and source of error of pulse oximetry are summarized in Table 16.8.
TABLE 16.8
Disadvantages of Pulse Oximetry
Damage to skin caused by pressure from probe
Failure to detect hypoxaemia in carbon monoxide poisoning
Failure to detect hypoventilation
Slow response times: instrument and circulatory delay
Signal quality adversely affected by hypoperfusion
Inter-instrument variability
THE NERVOUS SYSTEM
Depth of Anaesthesia


Auditory Evoked Potentials
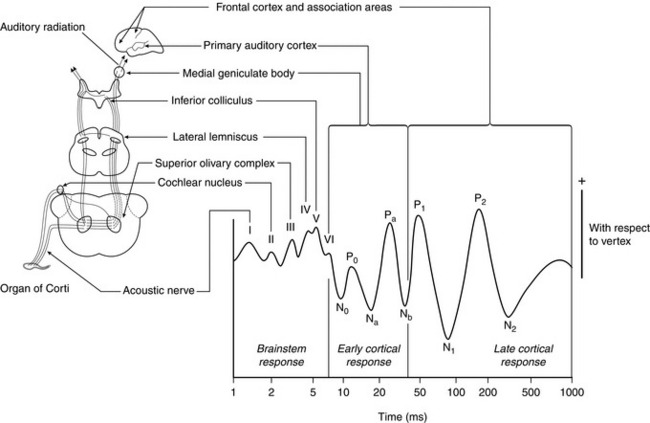
Auditory evoked potential monitors measure the slowing of auditory information processing produced by anaesthetic agents. The patient wears headphones which repeatedly play soft ‘clicks’. Each click produces neuronal activity in the auditory cortex. While the signal from a single click is masked by other brain activity, the signal from repeated clicks can be averaged to isolate the auditory signal. The activity in the auditory cortex may therefore be displayed as the auditory evoked potential, which has a characteristic waveform (Fig. 16.21). The time delay for some waves can then be measured and the result converted into a value typically from zero to 100, reflecting depth of anaesthesia. The equipment cannot be used in patients who have impaired hearing and may require several seconds to generate enough data to process. Monitors using this principle are commercially available, but have yet to be used widely. Equipment using either visual or somatosensory stimulation has also been developed.
TEMPERATURE
Commercial thermometers make use of several temperature-dependent phenomena.
Remote Reading Instruments
MONITORING STANDARDS
The current recommendations from the Association of Anaesthetists of Great Britain and Ireland are shown in Table 16.9. However, it is not sufficient that the monitors are available. Departmental heads are responsible for ensuring not only that equipment is available but also that it works correctly, that it is maintained to appropriate standards, that staff are trained in its use and that it is used appropriately.
TABLE 16.9
Summary of Recommendations for Standards of Monitoring During Anaesthesia and Recovery
The anaesthetist must be present and care for the patient throughout the conduct of an anaesthetic.*
Monitoring devices must be attached before induction of anaesthesia and their use continued until the patient has recovered from the effects of anaesthesia.
The same standards of monitoring apply when the anaesthetist is responsible for a local/regional anaesthetic or sedative technique for an operative procedure.
A summary of information provided by monitoring devices should be recorded on the anaesthetic record. Electronic record keeping systems are now recommended.
The anaesthetist must ensure that all equipment has been checked before use. Alarm limits for all equipment must be set appropriately before use. Audible alarms must be enabled during anaesthesia.
Table 16.10 indicates the monitoring devices which are essential and those which must be immediately available during anaesthesia. If it is necessary to continue anaesthesia without a device categorized as ‘essential’, the anaesthetist must clearly note the reasons for this in the anaesthetic record.
Additional monitoring may be necessary as deemed appropriate by the anaesthetist.
A brief interruption of monitoring is only acceptable if the recovery area is immediately adjacent to the operating theatre. Otherwise monitoring should be continued during transfer to the same degree as any other intra- or inter-hospital transfer.
Provision, maintenance, calibration and renewal of equipment is an institutional responsibility.
*In hospitals employing Anaesthetic Practitioners (APs), this responsibility may be delegated to an AP supervised by a consultant anaesthetist in accordance with guidelines published by the Royal College of Anaesthetists (www.rcoa.ac.uk).
Reproduced with permission from the Association of Anaesthetists of Great Britain and Ireland 2007.
GENERAL GUIDELINES FOR MONITORING DURING ANAESTHESIA
Table 16.10 summarizes the required monitors for different components of anaesthesia. Monitors should be applied to the awake patient and readings taken to ensure that they are functioning correctly before induction of anaesthesia. If uncooperative patients make application of monitoring impossible before induction, the monitors should be applied as soon as possible after induction and the reason recorded on the anaesthetic chart.
TABLE 16.10
The following must also be available:


The following must also be immediately available:


Reproduced with permission from the Association of Anaesthetists of Great Britain and Ireland 2007.
Additional Monitoring
The standards in Table 16.10 are the minimum acceptable levels and apply to healthy patients undergoing minor surgery. If the patient is unwell before surgery or major surgery is planned, additional monitoring should be applied. It is difficult to give strict guidelines on what conditions or surgery should prompt the use of each monitor. Suggestions are given in Table 16.11.
TABLE 16.11
Variables that it may be Appropriate to Monitor During Anaesthesia in some Patients in Addition to the Essential Monitoring for all Anaesthetized Patients
| Indications | Monitors |
| Operative duration > 3 h | Direct arterial pressure measurement |
| Blood loss > 10% blood volume | Central venous pressure |
| Operations on: Chest Central nervous system Cardiovascular system |
Pulmonary capillary wedge pressure Cardiac output Transoesophageal echocardiography Blood loss measurement |
| Clinically significant coexisting disease | Urine output |
| Temperature: | |
| Patient | |
| Blood warmer, mattress | |
| Inspired gas | |
| Blood gas analysis | |
| Serum electrolyte concentrations | |
| Haemoglobin concentration | |
| Coagulation status |
ANAESTHETIC RECORD-KEEPING
The design of anaesthetic records varies widely, and is probably unimportant provided that it facilitates recording and display of all the relevant data. Suggestions for the reasonable content of an anaesthetic record data set are shown in Table 16.12.
TABLE 16.12
Suggested Data for Inclusion on Anaesthetic Records
PREOPERATIVE INFORMATION
Patient identity
Name/ID number/gender
Date of birth
Assessment and risk factors
Date of assessment
Assessor, where assessed
Weight (kg) [height (m) optional]
Base vital signs (BP, HR)
Medication, incl. contraceptive drugs
Allergies
Addiction (alcohol, tobacco, drugs)
Previous GAs, family history
Potential airway problems
Prostheses, teeth, crowns
Investigations
Cardiorespiratory fitness
Other problems
ASA grade ± comment
Urgency
Scheduled – listed on a routine list
Urgent – resuscitated, not on a routine list
Emergency – not fully resuscitated
PERIOPERATIVE INFORMATION
Checks
Nil by mouth
Consent
Premedication, type and effect
Regional anaesthesia
Consent
Block performed
Entry site
Needle used, aid to location
Catheter: y/n
Patient position and attachments
Thrombosis prophylaxis
Temperature control
Limb position
Postoperative instructions
Drugs, fluids and doses
Analgesic techniques
Place and time
Place
Date, start and end times
Personnel
All anaesthetists named
Check performed, anaesthetic room, theatre
Operation planned/performed
Apparatus
Check performed, anaesthetic room, theatre
Vital signs recording/charting
Monitors used and vital signs recorded not less frequently
than every 5 min
Drugs and fluids
Dose, concentration, volume
Cannulation
Injection site(s), time & route
Warmer used
Blood loss, urine output
Airway and breathing system
Route, system used
Ventilation: type & mode
Airway type, size, cuff, shape
Special procedures, humidifier, filter
Throat pack
Difficulty
Special airway instructions, incl. oxygen
Monitoring
Untoward events
Abnormalities
Critical incidents
Preoperative, perioperative, postoperative
Context, cause, effect
Hazard flags
Warnings for future care
Association of Anaesthetists of Great Britain and Ireland. Checklist for anaesthetic equipment. London: AAGBI, 2012.
Association of Anaesthetists of Great Britain and Ireland. Risk management 1998. London: AAGBI, 1998.
Association of Anaesthetists of Great Britain and Ireland. Recommendations for standards of monitoring during anaesthesia and recovery, fourth ed. London: AAGBI, 2007.
Cruikshank, S. Mathematics and statistics in anaesthesia. Oxford: Oxford Medical Publications; 1998.
Davis, P.D., Kenny, G. Basic physics and measurement in anaesthesia, fifth ed. Oxford: Butterworth-Heinemann; 2003.
Sykes, M.K., Vickers, M.D., Hull, C.J. Principles of clinical measurement, third ed. Oxford: Blackwell Scientific Publications; 1991.