Chapter 12 Clinical electrocardiography and arrhythmia management
This chapter examines the clinical use of the ECG, one of the most important diagnostic tools in an emergency department. It must be stressed, however, that the ECG may appear normal, even in the presence of severe cardiac disease.
ECG INTERPRETATION
1 Chest and upper abdominal pain, dyspnoea, shock
History and examination are the mainstays of assessment, with the ECG playing a complementary role. The main conditions requiring early diagnosis are acute myocardial infarction (AMI), unstable angina, aortic dissection and pulmonary embolism (PE).
Myocardial infarction
Note that the initial ECG may be normal in about half of patients with AMI.
ST elevation
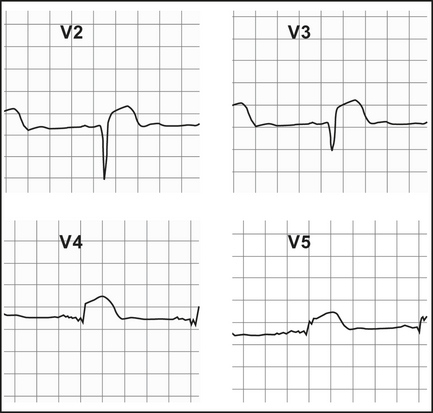
Q waves
Q waves > 2 mm, > 40 ms follow in those leads showing ST elevation, if the infarct evolves (Table 12.1). They may appear within the first hour or, more commonly, within 2–6 hours (Figure 12.2). Differentiate from nonpathological septal Q waves in LI, LII, aVF or V5,V6, which are small (< 2 mm) and narrow.
Table 12.1 Infarct localisation—the ECG pattern distribution (early ST elevation, later Q waves)—will help to localise the site of infarction, and the usual coronary artery occluded
| ECG pattern distribution | Site | Infarct-related artery |
|---|---|---|
| I, aVL | Lateral | Circumflex |
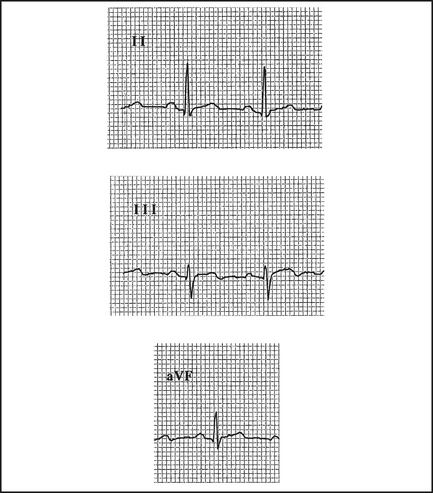
| II, III, aVF | Inferior | Right coronary, circumflex |
| V2–4 | Anterior | Left anterior descending (LAD) |
| V1,2 (large R, ↓ST) | Posterior | Right coronary |
R wave
A prominent R wave in V1, and often V2, suggests a posterior infarct, as well as incomplete right bundle branch block (RBBB), right ventricular hypertrophy (RVH) or left accessory pathway.
Pulmonary embolus (PE)
Anticoagulation is indicated (see Chapter 10, ‘Pulmonary emboli and venous thromboses’). Consult urgently for compromised patients following massive PE as they may need urgent thrombolysis or embolectomy.
2 Collapse, palpitations, syncope, dizziness, altered consciousness
The ECG can help to determine a cardiac cause.
Ventricular fibrillation (VF)
This grossly irregular and variable amplitude arrhythmia is easy to recognise (Figure 12.4), unless it is low in amplitude, when it can be mistaken for asystole (if in doubt, treat as VF).

Rarely, continued ALS may still rescue a patient with a preterminal rhythm.
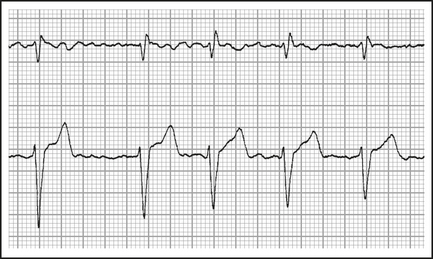
Ventricular tachycardia (VT)
A wide-complex tachycardia represents VT (Figure 12.5) in over 90% of cases, approaching 100% in patients with prior AMI. If in doubt, treat as VT.
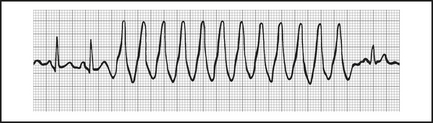
Most VT occurs in the setting of structural heart disease, usually ischaemic.
Prolonged QTc interval
A QTc (corrected for the rate) of over 0.44 s predisposes to VT and torsades, and should be corrected as soon as possible. Table 12.2 lists the causes of a prolonged QTc, which may progress to torsades de pointes.
Table 12.2 Causes of prolonged QT interval and torsades de pointes
| Cause | Specific drugs, conditions |
|---|---|
| Antiarrhythmics | Quinidine, procainamide, disopyramide, amiodarone, sotalol |
| Antipsychotics | Thioridazine, haloperidol, chlorpromazine |
| Antidepressants | Tricyclics |
| Antiinfective |
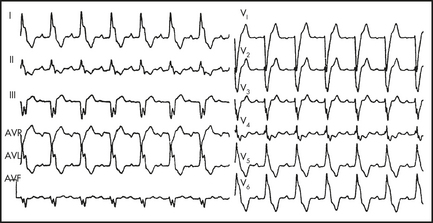
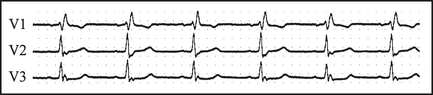
Brugada syndrome
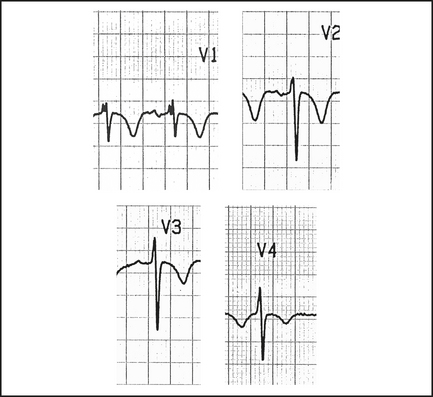
This is a disorder which causes VF and polymorphic VT, and which can be inherited in an autosomal dominant pattern. It is more common in South East Asians and males, and there may be a family history of sudden cardiac death. There is an abnormality in the cardiac sodium (Na+) channel. It should be considered in any young male presenting with syncope, seizures, chest pain, sudden cardiac arrest, a family history of unexplained death or the incidental finding of a Brugada pattern on routine ECG.
The ECG features of Brugada are ST elevation and T wave inversion in leads V1–3, mimicking a RBBB. Figure 12.6 shows a type 1. These changes may be transient. The rarer types 2 and 3 have ‘saddleback’ ST segments with upright T waves
Heart block
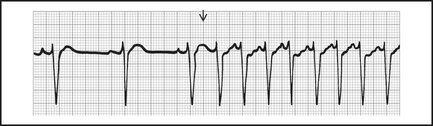
Third-degree, complete AV/heart block (CHB)
There is no P to QRS relationship; all of the atrial impulses are blocked at the AV node, so that regular P waves (rate > 50) are seen with an independent, idioventricular, QRS with a rate of around 30–40. If the QRS complex arises just below the AV node, the QRS may be narrow and normal in appearance (junctional AV block). More distal rhythms are relatively wide (> 0.12 s). In general, the broader escape rhythms are more unstable, and more likely to progress to ventricular standstill. Patients with complete heart block (CHB) may decompensate with poor cardiac output, hypotension or loss of consciousness (Stokes-Adams attack). Urgent treatment with atropine 0.3–0.6 mg IV, isoprenaline infusion and/or pacing are indicated. Atropine appears to be more effective for narrow complex CHB, and may worsen the block in broad complex CHB.
Bundle branch block (BBB)
LBBB (Figure 12.7), due to functional or anatomical block of the LBB and delayed depolarisation of the left ventricle, is seen as an rS in V1 and a broad RR1 in V5,6 with a wide QRS (> 0.12 s). It can be benign, but it is more commonly associated with ischaemic heart disease (IHD) and hypertension. It is important to note that evidence of AMI may still be seen on the ECG (see above, under ‘Myocardial infarction’).
RBBB (Figure 12.8), due to functional or anatomical block of the RBB and delayed depolarisation of the right ventricle, is seen as an RSR1 pattern in V1,2 with a wide QRS (> 0.12 s) and is often benign, but can also be a sign of acute right heart strain, such as acute pulmonary embolism. AMI is not disguised by a RBBB.
Atrial fibrillation (AF)
In atrial fibrillation, there are no P waves, and the rhythm is irregular (Figure 12.9). It is the most common supraventricular tachycardia and its incidence increases with age.
Atrial flutter
Generally, atrial flutter has an atrial rate of 300 with variable block (commonly 2:1 or 3:1).
Paroxysmal supraventricular tachycardia (PSVT)
PSVT has a regular rate, usually 150–200 (range 100–280, see Figure 12.10). It is a junctional tachycardia, where the AV node is an integral part of the arrhythmia circuit.
Vagal manoeuvres such as carotid sinus massage may terminate PSVT.
Adenosine is effective and relatively safe to use for chemical reversion, given as IV boluses through a wide-bore (e.g. 18-gauge in cubital fossa) IV cannula of 6 mg, 12 mg up to 18 mg if needed. In some patients, it causes a feeling of impending doom which may be prevented or treated with a small dose of midazolam, 0.01 mg/kg IV. Verapamil 5 mg IV slowly at 1 mg/minute may be used with care, but it can cause intractable hypotension, CHB and asystole, especially if the patient is also on a beta-blocker or digoxin.
Radiofrequency ablation (RA) may be needed if adenosine is unsuccessful
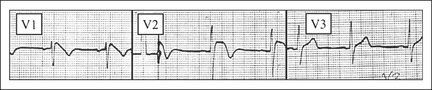
Wolff-Parkinson-White syndrome (WPW)
WPW is due to pre-excitation of the ventricles by an accessory pathway, bypassing the AV node, resulting in a short P-R interval, and a slurred upstroke or ‘delta wave’ on the R wave, best seen in V2–6 (see Figure 12.11).
Holter monitoring
Despite a history suggestive of an abnormal rhythm, none may be detected during emergency department assessment. The patient should be considered for admission for cardiac monitoring or Holter monitoring as an outpatient.
Sustained arrhythmias are more significant, particularly in symptomatic patients.
Holter monitoring is also useful in checking response to antiarrhythmics.
3 Electrolyte imbalance, drug overdose, environmental emergencies
Arrhythmias can arise as a result of any of these conditions.
Environmental emergencies
Hypothermia and electrocution are examples causing cardiac effects.
Axis (electrical pathway mapping)
Axis generally refers to the QRS axis and the direction of depolarisation in the ventricles as reflected in the frontal plane (the anterior chest wall). It is best illustrated by a clock face with each numerical division representing 30° (see Figure 12.12).
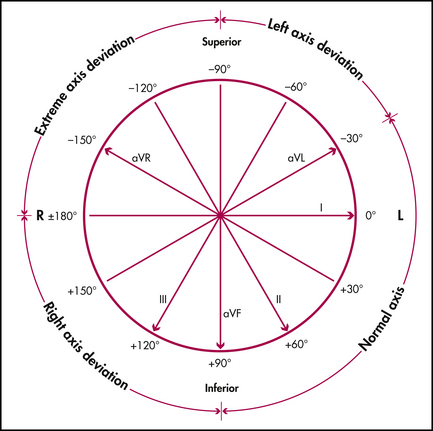
Figure 12.12 The QRS frontal plane cardiac axial reference system
Yuen Derek, after Fisch C, Mirvis D, Goldberg A. Electrocardiography. In: Libby P, Bonow R et al (eds). Braunwald’s heart disease. 8th edn. Philadelphia: WB Saunders; 2007
Combining this information, the quadrant in which the QRS vector lies can be determined.
To determine the axis more accurately (within 30°), note which limb or standard lead has the most isoelectric QRS (equally up and down); the axis is at 90° to this in the predetermined quadrant (use Figure 12.12). The range of normal axis can extend from -30° to +90°, as patients who are obese can have a more horizontal heart (vector in left upper quadrant), while those who are asthenic have a more vertical heart (90° axis). Thus, if the QRS is isoelectric in lead aVR, and the above criteria point to the left upper quadrant (left axis deviation), then a perpendicular (90°) to the aVR axis gives an axis of –60° in the left upper quadrant. The QRS axis is then –60° in the frontal plane.
Australian Medicines Handbook. Adelaide: Australian Medicines Handbook Pty Ltd; 2007. pp 272–273
Bersten A.D., Soni N., Oh T.E., editors. Intensive care manual, 5th edn., Philadelphia: Butterworth-Heinemann, 2003.
Brugada P., Brugada R., Brugada J. Should patients with an asymptomatic Brugada electrocardiogram undergo pharmacological and electrophysiological testing? Circulation. 2005;112:279-292.
Chan T.C., Brady W.J., Harrigan R., et al. ECG in emergency medicine and acute care. Elsevier Mosby; 2005.
Dubin D. Rapid interpretation of EKGs, 7th edn. Tampa, Florida: Cover Publishing; 2007.
Hampton J.R. The ECG in practice, 4th edn. Churchill Livingstone; 2003.
Harrison T.R., Braunwald E. Harrison’s principles of internal medicine, 16th edn. New York: McGraw-Hill; 2004.
Libby P., Bonow R., et al, editors. Braunwald’s heart disease, 8th edn, WB Saunders, 2007.
Medi C., Hankey G.J., Freedman S.B. Clinical update. Atrial fibrillation. Med J Aust. 2007;186(4):197-202.
Wagner G.S., Marriott H.J.L. Marriott’s practical electrocardiography, 11th edn. Lippincott Williams & Wilkins; 2007.