108 Clinical Assessment of Renal Function
Five to 15 percent of patients in intensive care units (ICUs) experience acute deterioration in renal function.1,2 Conversely, renal dysfunction adds substantially to the morbidity and mortality of these patients. Moreover, changes in renal function directly affect drug disposition. Thus, a means to assess renal function is essential for optimal management. The glomerular filtration rate (GFR) is the standard measure of renal function. It reflects overall renal functional capacity and, in renal failure, correlates with structural damage to the kidney. This chapter reviews selected aspects of renal physiology with an emphasis on measurement of renal function, consequences of altered function, and approaches to improving renal function. The focus is on measurement and optimization of glomerular filtration rate (GFR) and renal blood flow (RBF).
 Renal Blood Flow
Under physiologic conditions, blood flow to the kidneys is 20% of cardiac output. This high rate of blood flow (1-1.2 L/min) is particularly remarkable in that the kidneys make up only 0.5% of total body weight. The high blood flow rate is due, at least in part, to the unique anatomic arrangement of the renal vasculature, with the interlobar and arcuate vessels offering little resistance to flow. This in turn is because the interlobular arteries originate from the arcuates in a parallel arrangement and because the afferent arterioles also arise in a parallel arrangement from the interlobular vessels. It is this parallel arrangement that accounts for the low resistance, because the total resistance of n equals parallel paths, each with a resistance R, is R/n3. Major resistance vessels in the kidney are the afferent and efferent arterioles that bound the glomerular capillary network. Although total resistance is a function of resistance across each of these vessels, it is a unique feature of the kidney that variations in the individual resistances across the afferent and efferent arterioles, respectively, may lead to alterations in glomerular capillary pressure and, hence, in GFR.3
Despite a wide range of perfusion pressures, RBF and GFR are maintained relatively constant, a process described as autoregulation. The term autoregulation generally refers to the relative constancy of GFR over a range of perfusion pressures but also refers to the regulation of RBF. Emphasis has been placed on the preglomerular vasculature, mainly the afferent arterioles, as the major site at which renal perfusion is regulated. However, studies also suggest that the larger vessels, such as the interlobular vessels, may respond to a variety of vasoactive stimuli and participate in an autoregulatory phenomenon. A variety of hypotheses have been generated to explain the autoregulatory response of the kidney with respect to RBF. There is evidence to suggest mediation by neural, humoral, or intrarenal factors that regulate the renal circulation.4
Other vasoactive compounds that affect the renal circulation include the plasma and glandular kallikreins and kinins and endothelium-derived vasoactive factors such as nitric oxide and endothelin.4 Among the catecholamines, α- and β-adrenergic agonists are known to affect renal vascular tone by causing vasoconstriction and vasodilatation, respectively. In addition, dopamine in low doses leads to renal vasodilatation. Emphasis has more recently been placed on atrial natriuretic peptide and purinergic agents such as adenosine. The effect is likely to be influenced by changes in salt intake and extracellular fluid volume as well as by hydration status. For example, the influence of AII on renal hemodynamics is greater in sodium depletion, which also activates the sympathetic nervous system. In response to mild nonhypotensive hemorrhage, renal hemodynamics are relatively well maintained. However, with further reductions in volume associated with a more severe hemorrhage, renal ischemia mediated by activation of the renin-angiotensin system, renal efferent adrenergic nerves, and circulating catecholamines may occur.4
Finally, modification of dietary protein and amino acid intake may affect renal hemodynamics. Dietary protein intake in excess of 1 g/kg/d has been associated with renal vasodilatation, as have infusions of casein hydrolysates and amino acids.5,6 Conversely, chronic consumption of a low-protein diet may be associated with renal vasoconstriction.
Measurement of Renal Blood Flow
where UPAH and PPAH refer to urine and plasma PAH concentration, respectively, and V is urine flow rate in milliliters per minute.
RBF can be estimated by correction for the hematocrit (Hct):
Although available, this test is rarely used in clinical practice. In fact, direct quantitation of RPF and RBF is rarely indicated outside research studies; however, sometimes it is necessary to document that the kidneys are being perfused. In this case, one of three additional methods may be utilized: (1) selective arteriography, including CT angiography and MR angiography, (2) Doppler ultrasonography, and (3) external radionuclide scanning.
Because the latter two methods are noninvasive, they are preferred. With respect to the nuclide study, until recently, scanning was usually performed utilizing 125I-iodohippurate sodium; however, the poor radiologic characteristics of 131I limit its use in renal imaging.7 More recently, other agents such as 127I-orthoiodohippurate and 99mTc-L, L-ethylenedicysteine may prove to be superior.7,8
Clinical Correlates
Although a significant body of data has been obtained to indicate a complex relationship between neurocirculatory factors and renal hemodynamics, several points can be made from a clinical perspective. Optimization of cardiac output and extracellular fluid (ECF) volume, including the intravascular space, is essential for the maintenance of renal perfusion. Particularly because the effects of vasoactive compounds such as AII and catecholamines are accentuated in the presence of renal hypoperfusion and volume contraction, attention should be directed to an assessment of ECF volume, with correction of any deficits, and to optimizing cardiac function. Frequently, pharmacologic agents have been employed to maintain renal perfusion in situations in which this may be compromised. Specifically, there has been widespread use of so-called low-dose or renal-dose dopamine infusions. This is based on the observation that in low doses (<3 µg/kg/min) dopamine leads to renal vasodilatation.9 At higher doses, renal vasoconstriction may occur.
The beneficial effects of dopamine infusion have not been documented in patients who are depleted of sodium chloride and volume, and the use of dopamine has not been shown to be effective beyond a short period of infusion.9–11 That is, infusions of renal-dose dopamine for 24 to 36 hours may be beneficial in the appropriate circumstance, but there is no evidence supporting the long-term use of this agent. Thus, justification for prolongation of its use beyond several days is not supported by available data. Furthermore, reports suggest that adverse outcomes may be associated with the use of dopamine.11 Continuous infusions of fenoldopam mesylate, a potent dopamine A-1 receptor agonist, have been employed in an attempt to preserve renal function in a variety of clinical settings. A meta-analysis of 16 randomized trials in critically ill patients showed that fenoldopam significantly reduced the risk of acute kidney injury, need for renal replacement therapy, and in-hospital death.12 Beyond anecdotal evidence, there are no compelling data to support the use of other potential vasodilator substances such as prostaglandins. Although high-protein feeding and amino acid infusions may increase RBF by an undefined mechanism, there is no justification for utilizing these therapies solely from a hemodynamic point of view.5,6
 Glomerular Filtration Rate
Measurement of Glomerular Filtration Rate
More recently, other radiolabeled nuclides have been found to be satisfactory substitutes for inulin and have advantages in the measurement of GFR.7,8,13,14 Particularly 99mTc-labeled diethylenetriamine pentaacetic acid (DTPA) and 125I- or 131I-labeled iothalamate clearances closely approximate the CIn.15,16 99mTc-DTPA has been utilized and found to give measurements that correlate closely with CIn in ICU patients.17,18 In addition, the clearance of gentamicin has been utilized in a limited fashion to measure GFR.19,20 At the present time it is not common for GFR to be measured directly. Rather, GFR is estimated by the endogenous creatinine clearance or serum creatinine determination (see later).
The normal values for GFR given previously apply for individuals from the teenage years through approximately age 35. Thereafter, GFR declines in most individuals. Whereas this decline was formerly thought to occur at a relatively constant rate of approximately 10 mL/min per decade,21–23 more recent data obtained in a longitudinal fashion indicate that this reduction is not so predictable.24 In addition, a circadian rhythm for GFR has been described.25,26 GFR is maximal in the daytime, whereas a minimal value during the night has been found in normal individuals. Whether this circadian pattern of GFR occurs in critically ill hospitalized patients is not known.
 Creatinine Clearance and Serum Creatinine
Creatinine Clearance
The endogenous creatinine clearance (CCr) enjoys widespread use as a reasonable gauge of GFR when great precision is not demanded, which it rarely is in clinical practice. The use of creatinine as a marker of GFR has the advantage that creatinine is endogenously produced and is easily measured by inexpensive methods. Creatinine, like inulin, is freely filtered and absorbed minimally if at all by the tubules. However, creatinine is secreted, and the contribution of secretion to total excretion is greater as the GFR decreases and serum creatinine rises. At GFRs below 40 mL/min, CCr exceeds CIn by 50% to 100%.15,27 When GFR is significantly depressed and it is deemed important to get a more precise measurement of GFR, one of the previously mentioned methods to estimate GFR directly might be utilized. Additionally, because CCr overestimates GFR and the clearance of urea underestimates GFR, the mean value of simultaneously obtained creatinine and urea clearances has been shown to provide a close estimation of CIn when the latter is below 20 mL/min.28
Because cimetidine competes with creatinine for tubular secretion (see later), administration of cimetidine may increase the accuracy both of creatinine clearance in 24-hour collections (when given for several days beforehand) and of 4-hour, water-loaded clearances.29–31 Taking advantage of this effect results in a more accurate estimate of GFR. Specifically, CCr obtained in the presence of cimetidine (400 mg as a priming dose followed by 200 mg every 3 hours) yielded values that closely approximated CIn.29,30 Volume expansion in humans causes a small rise in GFR, whereas volume depletion, severe heart failure, hypotension, anesthesia, surgery, trauma, sepsis, and even mild intestinal bleeding without frank hypotension may depress GFR substantially.
Various methods are available to measure creatinine. Creatinine is frequently measured using the Jaffé alkaline picric acid reaction. Although this method is widely utilized, this reaction also measures other chromogens, which may lead to a false elevation in the estimated serum creatinine (SCr) measurement. Substances such as acetoacetate (in ketoacidosis), pyruvate, ascorbate, 5-flucytosine, certain (but not all) cephalosporin antibiotics, and very high urate artifactually raise SCr in normal subjects by 0.5 to 2 mg/dL.32–38 These substances are excreted into the urine but contribute trivially compared with overall urine creatinine (UCr). Thus, noncreatinine chromogens affect the SCr but have little effect on the UCr.
In individuals with normal renal function, the contribution of serum noncreatinine chromogens to raising the SCr is approximately equal to the contribution of secretion to creatinine excretion, such that the CCr closely approximates GFR. As GFR decreases, the contribution of noncreatinine chromogens to the total measured SCr becomes less than the secreted moiety, and the CCr overestimates GFR to a greater extent. Direct enzymatic creatinine measurements are not affected by noncreatinine chromogens. Very high levels of serum glucose (>1000 mg/dL) and 5-flucytosine may interfere with the enzymatic reaction, whereas high levels of bilirubin (>5 mg/dL) affect the autoanalyzer method36 and lead to falsely low SCr values. It is therefore important to know the method by which a given laboratory measures SCr. Competing for the same proximal tubular organic base secretory site as creatinine, certain pharmacologic agents may suppress this process and lead to a rise in SCr. Trimethoprim, probenecid, and cimetidine, but not ranitidine, are organic bases that inhibit creatinine secretion competitively and can result in a mild elevation in SCr, usually 0.5 mg/dL or less.39–42
As with all clearance methods, the CCr is subject to errors that may amount to as much as 10% to 15% or more. In addition to potential problems in estimating SCr and UCr, errors in timing of urine collection, incomplete collection, and inaccurate measurement of urine volume are other factors that contribute to errors.43 Although 24-hour UCr clearances have been widely utilized, no specified time period is required for the clearance to be obtained. In fact, shorter collection periods of several hours may be more accurate in patients passing adequate amounts of urine (not oliguric), particularly if the patient is not in a steady state (see later). To reduce errors in volume measurement, one can induce a water diuresis in stable subjects before beginning the test,44 although this is rarely practical in the ICU setting. Nevertheless, because many ICU patients have indwelling Foley catheters, it should be possible for accurately timed urine collections to be obtained and for CCr to be measured with reasonable accuracy.
Serum Creatinine
Because of the practical and technical problems in obtaining estimates of GFR by clearance methods, renal function is most commonly estimated by following the SCr in hospitalized patients. Creatinine is formed nonenzymatically from creatine and phosphocreatine in muscle cells and is normally present in the serum at a concentration of 0.8 to 1.4 mg/dL in adults and 0.3 to 0.6 mg/dL in children and pregnant subjects. The measured SCr depends on the method of measurement, as discussed previously, GFR, rate of creatinine production, volume of distribution (e.g., SCr is lower in anasarca), and extent of its tubular secretion and intestinal degradation.3 Because creatinine production is closely related to muscle mass, SCr is generally less in females than in males and decreases as muscle mass is lost with aging or with debilitating illnesses.
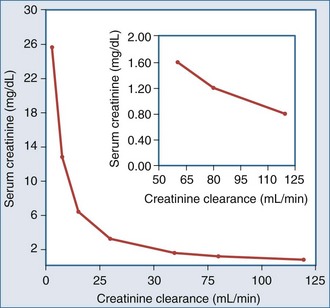
The relationship between SCr and CCr (and hence GFR) can be described by a rectangular hyperbola43; however, this relationship applies in the steady state and assumes a constant rate of creatinine production (Figure 108-1). Thus, a doubling of the SCr, reflects a 50% decrease in CCr, a fourfold increase in SCr, a 75% drop in GFR, and so on. Because creatinine production may not remain constant, SCr may underestimate the decrease in GFR in critically ill patients who have a decrease in muscle mass secondary to an ongoing catabolic state. Moreover, it should be appreciated that SCr is an insensitive marker of change early in the course of renal disease. Thus, a 33% fall in GFR may raise the SCr from 0.8 to 1.2 mg/dL, a value still within the normal range. If the prior value is not known, this fall in GFR may go unrecognized.
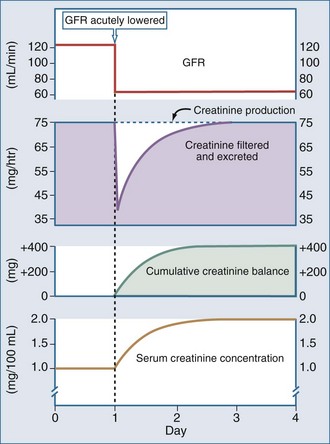
SCr provides a close estimate of GFR only in the steady state. With an abrupt decrease in GFR, as may occur in acute renal failure, creatinine production would be expected to continue unchanged, but because of the decrease in GFR, creatinine excretion will be impaired. As a result, the SCr increases until a new steady state is obtained, at which time the amount of creatinine produced equals the amount filtered (GFR − SCr) and excreted (UCr − V). Depending on the extent of damage and decrease in GFR, it may take several days for a new steady state to be achieved (Figure 108-2). Therefore, following an insult leading to an abrupt decrease in GFR, the SCr rises progressively over the next several days. This should not be interpreted as a new insult each day, but rather that a steady state has not yet been obtained. While the SCr is changing, its absolute value cannot be used as an accurate measure of the decrease in GFR. If an accurate measurement of GFR is needed during this time, a short CCr can be obtained.
A variety of equations have been developed to estimate CCr based on the SCr without collection of urine.45,46 Table 108-1 is a compilation of the more commonly used equations.47 These equations generally take into consideration muscle mass (estimated as body weight), sex (males having a higher GFR than females), and age. Aging, hepatic diseases, excessive muscle wasting, severe muscular atrophy or dystrophy, hyperthyroidism, paralysis, and chronic glucocorticoid therapy have been associated with reduced creatinine generation.17 In addition, particularly at low levels of GFR, correction for nonrenal creatinine metabolism is also recommended.48,49 One of the most commonly utilized equations is that developed by Cockcroft and Gault50:
TABLE 108-1 Common Equations for Estimating Glomerular Filtration Rate or Creatinine Clearance
| Cockcoft-Gault (CCr · BSA/1.73 m2) For men: CCr = [(140 − age) · weight (kg)]/SCr · 72 For women: CCr = ([(140 − age) · weight (kg)]/SCr · 72) · 0.85 |
| MDRD (1) GFR = 170 · [SCr]–0.999 · [age]–0.176 · [0.762 if patient is female] · [1.18 if patient is black] · [BUN]–0170 · [Alb]0.318 |
| MDRD (2) GFR = 186 · [SCr.]–1.154 · [age]–0.203 · [0.742 if patient is female] · [1.212 if patient is black] |
| Jellife (1) (CCr · BSA/1.73 m2) For men: (98 − [0.8 · (age − 20)])/SCr For women: (98 – [0.8 · (age − 20)])SCr · 0.90 |
| Jellife (2) For men: (100/SCr) − 12 For women: (80/SCr) − 7 |
| Mawer For men: weight · [29.3 − (0.203 · age)] · [1 − (0.03 · SCr)] For women: weight · [25.3 − (0.175 · age)] · [1 − (0.03 · SCr)] |
| Bjornsson For men: [27 − (0.173 · age)] · weight · 0/SCr For women: [25 − (0.175 · age)] · weight · 0.07/SCr |
| Gates For men: (89.4 · SCr–1.2) + (55 − age) · (0.447 · SCr–1.1) For women: (89.4 · SCr–1.2) + (55 − age) · (0.447 · SCr–1.1) |
| Salazar-Corcoran For men: [137 − age] · [(0.285 · weight) + (12.1 · height2)]/(51 · SCr) For women: [146 − age] · [(0.287 · weight) + (9.74 · height2)]/(60 · SCr) |
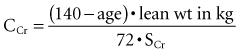
where age is expressed in years. The preceding expression is used for men. The formula for women is the preceding formula multiplied by 0.85.
The reliability of this equation as a measure of GFR has been assessed in patients with diabetes, pregnant women with renal disease,51 obese individuals,52 elderly individuals,53,54 and black Americans with hypertensive renal disease.55 It has also been assessed in critically ill patients.56 These studies have indicated that the accuracy of GFR estimates using the Cockcroft-Gault equation is similar to or greater than 24-hour CCr, and the precision is better. This equation seems to be most accurate for estimating GFR when the latter is in the range of 10 to 100 mL/min.52,55,56 The advantage of this formula is that it is simple and underscores the essential determinants of CCr.
The MDRD (Modification of Diet in Renal Disease) study equation has gained widespread acceptance by most clinical laboratories, which now routinely report estimated GFR values for blacks and nonblacks when a serum creatinine is ordered.57–59 Its major limitations are imprecision and underestimation of measured GFR at high GFR values (GFR > 60 mL/min/1.73 m2). The MDRD equation is generally more precise than the Cockroft-Gault equation.60
Limitations at higher GFR values prompted a recent modification by the Chronic Kidney Disease Epidemiology Collaboration Research Group.61 This equation offers improved precision, especially with higher GFR values up to 90 mL/min/1.73 m2.
Serum Urea Nitrogen
Several pharmacologic agents also may affect urea nitrogen formation. Tetracyclines may lead to an increase in SUN by an anti-anabolic effect without any detectable change in GFR, whereas glucocorticoids and severe illnesses or trauma do the same by inducing endogenous protein hypercatabolism. Because of the widespread use of hyperalimentation in ICU patients, an impairment in renal function is often associated with a marked disproportion in the elevation of SUN compared with SCr. For this reason, the issue is raised as to whether SUN elevation itself poses an important threat to the patient if the GFR is in a range that should not lead to enhanced morbidity by itself. In those circumstances, it is useful to measure the rate of urea appearance (or generation) to estimate whether other factors such as gastrointestinal bleeding, excessive amino acid infusions, and protein administration are contributing to the increase in SUN above that expected by the decrease in GFR.47,48 Urea nitrogen (UN) appearance can be determined from urine urea nitrogen (UUN), SUN, and body weight as follows:
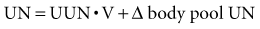
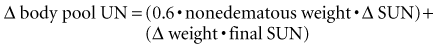
where UUN • V is 24-hour UN excretion, and Δ body pool UN = 0.6 − nonedematous weight (kg) • Δ SUN/day.
If the weight is changing47,48:
Nitrogen balance (BN) is equal to:
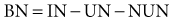
where IN is urea nitrogen intake, and NUN is nonurea nitrogen excretions.48
NUN, which includes fecal nitrogen, urinary creatinine, uric acid, and unmeasured nitrogen, averages 0.031 g nitrogen/kg/d.48 The data obtained from the just-described measurements may be quite useful in evaluating the cause of disproportionate elevations in SUN. If the patient is in a steady state (with a stable weight and SUN), BN = 0, and IN can be estimated from UN + NUN.48 Because catabolism, except for severe trauma and burns, is usually 2 to 4 g nitrogen per day, additional conclusions can be drawn if the patient is not in the steady state. For example, if it is known that IN is less than UN + NUN, gastrointestinal bleeding with or without excess catabolism would be suggested. Similarly, one can evaluate if the increase in SUN is a reflection of excessive exogenous protein and amino acid administration (usually >1.5 g/kg/d; g UN 0.16 = g protein or amino acids). If IN is above UN, such as in severe liver disease, the clinician might more carefully evaluate changes in weight and SUN as well as clearances, because the latter may be more severely depressed than initially suspected.
 Sodium Balance and Extracellular Fluid Volume
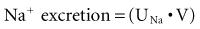
Sodium is the primary cation of the ECF, present in a concentration of 140 to 142 mmol/L. The volume of the ECF is approximately 20% of total body weight and represents a third of total body water. Regulation of ECF volume is governed by factors regulating sodium balance and sodium excretion. The reader is referred to an excellent review on this topic.62 For the purposes of this discussion, several factors are emphasized. Under physiologic conditions and in the steady state, sodium balance is maintained because the amount of sodium excreted equals that which enters the body by oral and intravenous routes. Sodium excretion and the fraction of filtered sodium that is excreted (FENa) can be readily determined. Absolute sodium excretion is measured as the product of the urine sodium concentration and the urine volume:
FENa can be determined as follows:
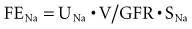
For practical reasons, the CCr (= UCr • V/SCr) is used to estimate GFR, such that:
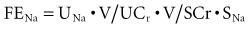
Because the V term in the numerator and denominator cancels out:
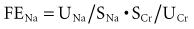
Thus, FENa can be calculated from the sodium and creatinine determined in a random urine sample and serum (or plasma) simultaneously. The resulting calculation is expressed as a percentage by multiplying by 100. This test is of value in the setting of acute renal failure to aid in distinguishing a prerenal from a renal parenchymal etiology.63 It is not usually helpful in aiding in the diagnosis of urinary tract obstruction or in the presence of underlying chronic renal insufficiency. The reason for the difficulty in interpretation in chronic renal insufficiency can be illustrated by the following considerations. At a GFR of 130 mL/min and a dietary sodium intake of 3 g of sodium (130 mmol), an individual in sodium balance will excrete 0.5% of the filtered load (FENa = 0.5%). For sodium balance to be maintained at lower levels of GFR with the same sodium intake, FENa must be increased progressively. Successive decreases in GFR by 2 from 130 would result in an FENa of 1%, 2%, 4%, and 8%, respectively. Thus, interpretation of the FENa in a patient with acute renal failure superimposed on chronic renal insufficiency is problematic unless the prior steady-state FENa is known. This is rarely the case.
The fractional excretion of chloride (FECl) has been suggested to be more accurate than that of sodium in helping to distinguish prerenal from parenchymal causes of acute renal failure.64 This is particularly so in the situation in which acute renal failure occurs with simultaneous metabolic alkalosis. If the urine contains substantial amounts of bicarbonate urinary pH (UpH > 7), sodium excretion increases to maintain electroneutrality. Under these circumstances, the FENa may give misleading information, but the FECl can be used to obtain the same information.
Although urinary sodium excretion can be used to help make determinations with respect to ECF volume under certain circumstances, this may be fraught with potential errors. No laboratory test is available to provide this information. Rather, the astute clinician must rely on bedside evaluation complemented, where appropriate, with measurements of central venous pressure and pulmonary capillary wedge pressure to assist in making determinations with respect to ECF volume status. For example, a low FENa (<1%) in the setting of acute renal failure usually indicates a decrease in renal perfusion but does not provide information on the status of the patient’s ECF volume. Because a low FENa can be seen with either ECF volume contraction or severe congestive heart failure, these conditions must be distinguished at the bedside. Moreover, sometimes a low FENa exists even in the presence of parenchymal renal disease, such as acute glomerulonephritis, severe burns, and radiocontrast nephropathy. Finally, administration of potent diuretic agents can alter the FENa and may result in misleading interpretations. For this reason, urine samples should be obtained before diuretics are administered. However, it may not be possible to obtain urinary sodium or chloride values while a patient is not receiving diuretics. In this setting the fractional excretion of urea nitrogen has been employed to distinguish prerenal from renal causes of acute kidney injury. In a well-hydrated individual, the FeUN is 50% to 65%,65 whereas in oliguric prerenal azotemia, the FeUN is below 35%. The use of FeUN in the setting of acute kidney injury has not attained widespread acceptance owing to variable results on comparative trials.65,66
A few additional points are worthy of note with respect to diuretic use. There is now ample evidence that in a patient in positive sodium balance, diuretic therapy should not be utilized without simultaneously restricting sodium intake, including intravenous saline, if negative sodium balance and reduction in edema fluid are desired.67 In general, this requires restriction of dietary sodium intake, usually to less than 2 g of sodium per day (0.88 mmol) if the patient is in an edema-forming state. Although a diuresis can be effected even with liberal sodium intake, this requires higher doses of diuretics and more frequent administration of these agents. The coexistence of hyponatremia should not deter clinicians from restricting sodium intake, but rather should cause them to address solute-free water intake as well. Of course, under certain circumstances, obligatory intakes make it difficult to achieve optimal restriction to assist diuresis. That is, with various pharmacologic drips, blood products, and feeding regimens necessary in acutely ill patients in the ICU, this may become a difficult problem. Under those circumstances, increasing doses of diuretics, including continuous infusions of loop diuretics, may be required.
Key Points
Chertow GM, Sayegh MH, Allgren RL, Lazarus JM. Is the administration of dopamine associated with adverse or favorable outcome in acute renal failure? Am J Med. 1996;101:49-53.
Levey AS, Stevens LA, Schmid CH, Zhang Y, Castro AFIII, Feldman HI, et al. A new equation to estimate glomerular filtration rate. Ann Intern Med. 2009;150:604-612.
Robert S, Zarowitz BJ, Peterson EL, Dumler F. Predictability of creatinine clearance estimates in critically ill patients. Crit Care Med. 1993;21:1487-1495.
Wilcox CS, Mitch WE, Kelly RA, Skorecki K, Meyer TW, Friedman PA, et al. Response of the kidney to furosemide: I. Effects of salt intake and renal compensation. J Lab Clin Med. 1983;102:450-458.
Wharton WW3rd, Sondeen JL, McBiles M, Gradwohl SE, Wade CE, Ciceri DP, et al. Measurement of glomerular filtration rate in ICU patients using 99mTc-DTPA and inulin. Kidney Int. 1992;42:174-178.
1 Jochimsen F, Schafer JH, Maurer A, et al. Impairment of renal function in medical intensive care: Predictability of acute renal failure. Crit Care Med. 1990;18:480.
2 Menashe PI, Ross SA, Tottlieb JE. Acquired renal insufficiency in critically ill patients. Crit Care Med. 1988;16:1106.
3 Oken DE, Schoolwerth AC. The kidneys. In: Noe DA, Rock RC, editors. Laboratory Medicine: The Selection and Interpretation of Clinical Laboratory Studies. Baltimore: Williams & Wilkins; 1994:401-461.
4 Arendshorst IWJ, Navar LG. Renal circulation and glomerular hemodynamics. In: Schrier RW, Gottschalk CW, editors. Diseases of the Kidney. 6th ed. Boston: Little, Brown; 1997:59-106.
5 Bergstrom J, Ahlberg M, Alvestrand A. Influence of protein intake on renal hemodynamics and plasma hormone concentrations in normal subjects. Acta Med Scand. 1985;217:189.
6 Bosch JP, Saccaggi A, Lauer A, et al. Renal functional reserve in humans. Am J Med. 1983;75:943.
7 Dondi M, Fanti S. Determination of individual renal function through noninvasive methodologies. Curr Opin Nephrol Hypertens. 1995;4:520.
8 Bubeck B. Radionuclide techniques for the evaluation of renal function: Advantages over conventional methodology. Curr Opin Nephrol Hypertens. 1995;4:514.
9 Szerlip HM. Renal-dose dopamine: Fact and fiction. Ann Intern Med. 1991;115:153.
10 Denton MD, Chertow GM, Brady HR. Renal-dose dopamine for the treatment of acute renal failure: Scientific rationale, experimental studies and chemical trials. Kidney Int. 1996;49:4.
11 Chertow GM, Sayegh MH, Allgren RL, Lazarus JM. Is the administration of dopamine associated with adverse outcomes in acute renal failure? Am J Med. 1996;101:49.
12 Landoni G, Biondi-Zoccai GG, Tumlin JA, Bove T, De Luca M, Calabro MG, et al. Benefical impact of fenoldopam in critically ill patients with or at risk for acute renal failure: a meta-analysis of randomized clinical trials. Am J Kidney Dis. 2007;49:56.
13 Blaufox MD. Measurement of renal function. Curr Opin Nephrol Hypertens. 1995;4:503.
14 Blaufox MD, Aurell M, Bubeck B, et al. Report of the radionuclides in nephrourology committee on renal clearance. J Nucl Med. 1996;37:1883.
15 Shemesh O, Golbetz H, Riss JP, et al. Limitations of creatinine as a filtration marker in glomerulopathic patients. Kidney Int. 1985;28:830.
16 Blaufox MD. Radionuclide techniques for the diagnosis of urinary tract disease. In: Narins RG, Stein JH, editors. Contemporary Issues in Nephrology. Diagnostic Techniques in Renal Disease. New York: Churchill Livingstone; 1992:305-329.
17 Wharton WW, Sondeen JL, McBiles M, et al. Measurement of glomerular filtration rate in ICU patients using 99mTc-DTPA and inulin. Kidney Int. 1992;42:174.
18 Robert S, Zarowitz BJ. Is there a reliable index of glomerular filtration rate in critically ill patients? Drug Intell Clin Pharmacol. 1991;25:169.
19 Salazar DE, Corcoran GB. Predicting creatinine clearance and renal drug clearance in obese patients from estimated fat-free body mass. Am J Med. 1988;84:1053.
20 Zarowitz BJ, Robert S, Peterson EL. Prediction of glomerular filtration rate using aminoglycoside clearance in critically ill medical patients. Ann Pharmacother. 1992;26:1205.
21 Davies DF, Shock NW. Age changes in glomerular filtration rate, effective renal plasma flow and tubular excretory capacity in adult males. J Clin Invest. 1950;29:496.
22 Rowe JW, Andres R, Tobin JD, et al. The effect of age on creatinine clearance in men: A cross-sectional and longitudinal study. J Gerontol. 1976;31:155.
23 Kafetz K. Renal impairment in the elderly: A review. J R Soc Med. 1983;76:398.
24 Epstein M. Aging and the kidney. J Am Soc Nephrol. 1996;7:1106.
25 Koopman MG, Koomen GCM, Krediet RT, et al. Circadian rhythm of glomerular filtration rate in normal individuals. Clin Sci (Colch). 1989;77:105.
26 Van Acker BAC, Koomen GCM, Koopman MG, et al. Discrepancy between circadian rhythms of inulin and creatinine clearance. J Lab Clin Med. 1992;120:400.
27 Bauer H, Brooks CS, Burch RN. Clinical appraisal of creatinine clearance as a measurement of glomerular filtration rate. Am J Kidney Dis. 1982;2:337.
28 Lubowitz H, Slatopolsky E, Shankel S, et al. Glomerular filtration rate: Determination in patients with chronic renal disease. JAMA. 1967;199:252.
29 Hilbrands LB, Artz MA, Wetzets JIM, et al. Cimetidine improves the reliability of creatinine as a marker of glomerular filtration. Kidney Int. 1991;40:1171.
30 Rocci MLJr, Vlasses PH, Ferguson RK. Creatinine serum concentrations and H2-receptor antagonists. Clin Nephrol. 1984;22:214.
31 Marcen R, Serrano P, Teruel JL, et al. Oral cimetidine improved the accuracy of creatinine clearance in transplant patients on cyclosporine (abstract). Transplant Proc. 1994;26:2624.
32 Gerard SK, Khayam-Bashi H. Characterization of creatinine error in ketotic patients: A prospective comparison of alkaline picrate methods with an enzymatic method. Am J Clin Pathol. 1985;84:659.
33 Molitch ME, Rodman E, Hirsch CA, et al. Spurious serum creatinine elevations in ketoacidosis. Ann Intern Med. 1980;93:280.
34 Cruickshank AM, Shenkin A. A comparison of the effect of acetoacetate concentration on the measurement of serum creatinine using Technicon SMAC II, Beckman Astra and enzymatic techniques. Ann Clin Biochem. 1987;24:317.
35 Mascioli SR, Bantle JP, Freier EF, et al. Artifactual elevation of serum creatinine level due to fasting. Arch Intern Med. 1984;144:1575.
36 Levey AS, Perrone RD, Madias NE. Serum creatinine and renal function. Annu Rev Med. 1988;39:465.
37 Kroll MH, Elin RJ. Mechanism of cefoxitin and cephalothin interference with the Jaffé method for creatinine. Clin Chem. 1983;29:2044.
38 Kroll MH, Koch TR, Drusano GL, et al. Lack of interference with creatinine assays by four cephalosporin-like antibiotics. Am J Clin Pathol. 1984;82:214.
39 Berglund F, Killander J, Pompeius R. Effect of trimethoprim-sulfamethoxazole on the renal excretion of creatinine in man. J Urol. 1975;114:802.
40 Odlind B, Hallgren R, Sohtell M, et al. Is 125I iothalamate an ideal marker for glomerular filtration? Kidney Int. 1985;27:9.
41 Dubb JW, Store RM, Familiar R, et al. Effect of cimetidine on renal function in normal man. Clin Pharmacol Ther. 1978;24:76.
42 Van Acker BAC, Koomen GCM, Koopman MG, et al. Creatinine clearance during cimetidine administration for measurement of glomerular filtration rate. Lancet. 1992;340:1326.
43 Kassirer JP. Clinical evaluation of kidney function-glomerular function. N Engl J Med. 1971;285:385.
44 Lemann J, Bidani AK, Bain RP, et al. Use of the serum creatinine to estimate glomerular filtration rate in health and early diabetic nephropathy. Am J Kidney Dis. 1990;16:236.
45 National Kidney Foundation. K/DOQI clinical practice guidelines for chronic kidney disease: evaluation, classification, and stratification. Am J Kidney Dis. 2002;39:S1.
46 Stevens LA, Coresh J, Greene T, Levey AS. Assessing kidney function-measured and estimated glomerular filtration rate. N Engl J Med. 2006;354:2473.
47 Lin J, Knight EL, Hogan ML, Singh AK. Comparison of prediction equations for estimating glomerular filtration rate in adults without kidney disease. J Am Soc Nephrol. 2003;14:2573.
48 Maroni BJ, Steinman I, Mitch WE. A method for estimating nitrogen intake of patients with chronic renal failure. Kidney Int. 1985;27:58.
49 Mitch WE. Restricted diets and slowing the progression of chronic renal insufficiency. In: Mitch WE, Klahr S, editors. Nutrition and the Kidney. 2nd ed. Boston: Little, Brown; 1993:243-262.
50 Cockcroft DW, Gault MH. Prediction of creatinine clearance from serum creatinine. Nephron. 1976;16:31.
51 Quadri KliM, Bernardini J, Greenberg A, et al. Assessment of renal function during pregnancy using a random urine protein to creatinine ratio and Cockcroft-Gault formula. Am J Kidney Dis. 1994;24:416.
52 Cochran MSt, John K. A comparison between estimates of GFR using 99mTc] DTPA clearance and the approximation of Cockcroft and Gault. Aust NZ J Med. 1993;23:494.
53 O’Connell MB, Dwinell AM, Bannick-Mohrland SD. Predictive performance of equations to estimate creatinine clearance in hospitalized elderly patients. Ann Pharmacother. 1992;26:627.
54 Sokoli LJ, Russell RM, Sadowski JA. Establishment of creatinine clearance reference values for older women. Clin Chem. 1994;40:2276.
55 Toto R, Kirk K, Coresh J, et al. Evaluation of serum creatinine for estimating glomerular filtration rate in African Americans with hypertensive nephrosclerosis: Results from the African-American Study of Kidney Disease and Hypertension (AASK) Pilot Study. J Am Soc Nephrol. 1997;8:279.
56 Robert S, Zarowitz BJ, Peterson EL, Duniler F. Predictability of creatinine clearance estimates in critically ill patients. Crit Care Med. 1993;21:1487.
57 Levey AS, Bosch JP, Lewis JB, Greene T, Rogers N, Roth D. A more accurate method to estimate glomerular filtration rate from serum creatinine: a new prediction equation. Modification of Diet in Renal Disease Study Group. Ann Intern Med. 1999;130:461.
58 Levery As, Coresh J, Greene T, Stevens LA, Zhang YL, Hendriksen S, et al. Chronic Kidney Disease Epidemiology Collaboration. Using standardized serum creatinine values in the modification of diet in renal disease study equation for estimating glomerular filtration rate. Ann Intern Med. 2006;145:247.
59 Miller WG. Reporting estimated GFR: a laboratory perspective (editorial). Am J Kidney Dis. 2008;52:645.
60 Poggio Ed, Wang X, Greene T, Van Lente F, Hall PM. Performance of the modification of diet in renal disease and Cockcroft-Gault equations in the estimation of GFR in health and in chronic kidney disease. J Am Soc Nephrol. 2005;16:459.
61 Levey AS, Stevens LA, Schmid CH, Zhang Y, Castro AFIII, Feldman HI, et al. A new equation to estimate glomerular filtration rate. Ann Int Med. 2009;150:604.
62 Miller JA, Tobe SW, Skorecki KL. Control of extracellular fluid volume and pathophysiology of edema formation. 5th ed. Brenner BM, Rector FCJr, editors. The Kidney. vol 1. Philadelphia: WB Saunders; 1996:817-872.
63 Espinel CH. The FE test: Use in the differential diagnosis of acute renal failure. JAMA. 1976;236:579.
64 Anderson RJ, Gross PA, Gabow P. Urinary chloride concentration in acute renal failure. Miner Electrolyte Metab. 1984;10:92.
65 Carvounis CP, Nisar S, Guro-Razuman S. Significance of the fractional excretion of urea in the differential diagnosis of acute renal failure. Kidney Int. 2002;62:2223.
66 Pepin MN, Bouchard J, Legault L, Ethier J. Diagnostic performance of fractional excretion of urea and fractional excretion of sodium in the evaluations of patients with acute kidney injury with or without diuretic treatment. Am J Kidney Dis. 2007;50:566.
67 Wilcox CS, Mitch WE, Kelly RA, et al. Response of the kidney to furosemide: I. Effects of salt intake and renal compensation. J Lab Clin Med. 1983;102:450.
