[level-membership-for-radiology-category] Hyperdense on NECT, isodense on CECT


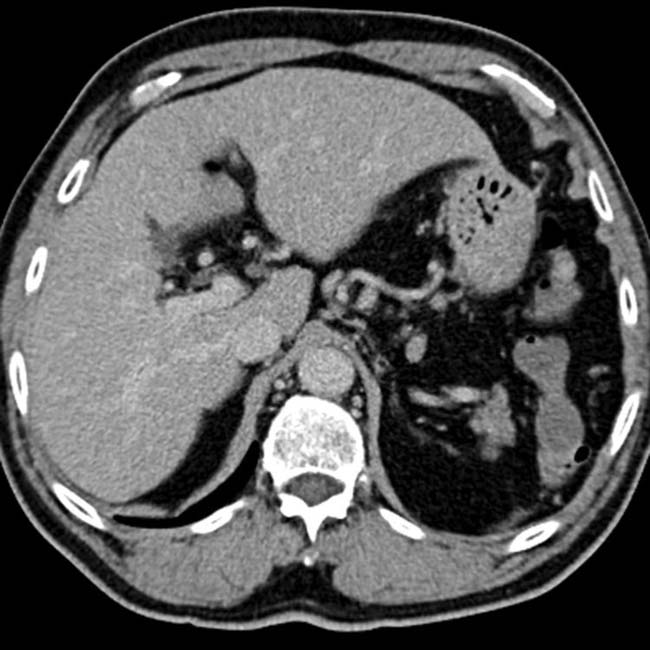
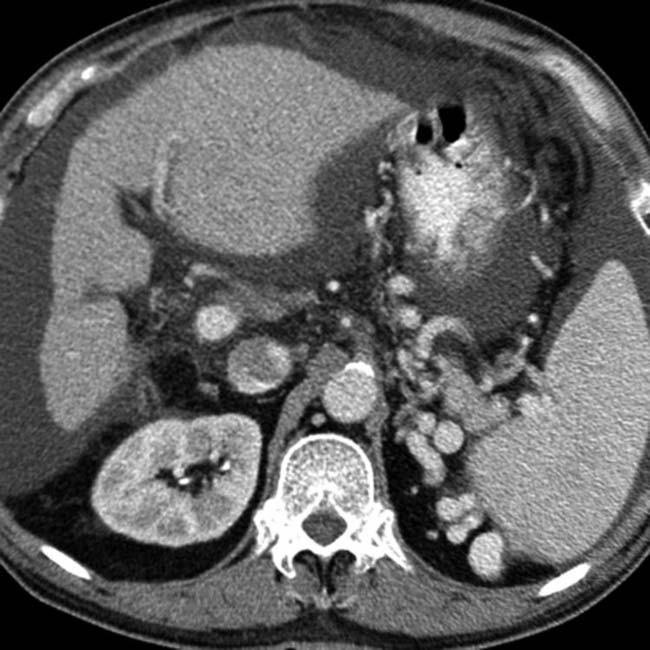
 to the edges of the caudate and right lobes, respectively. Note the bands of fibrosis
  and ascites.
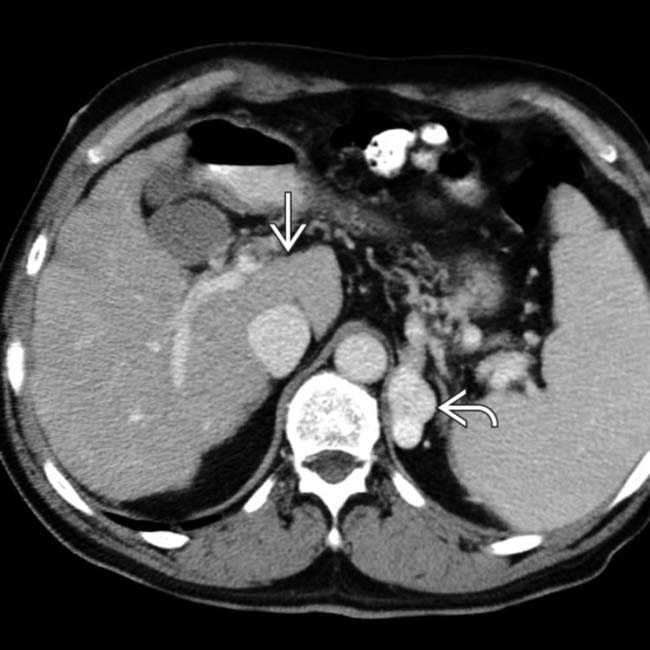
 . Note the enlarged caudate lobe
  , which is as wide as the right lobe, although the caudate lobe is normally no more than 60% of the width of the right lobe.
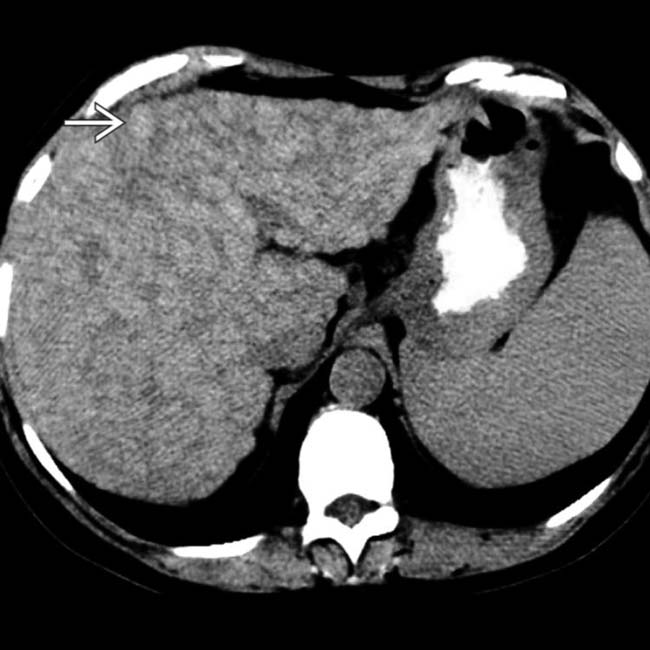
 , surrounded by lace-like fibrosis.
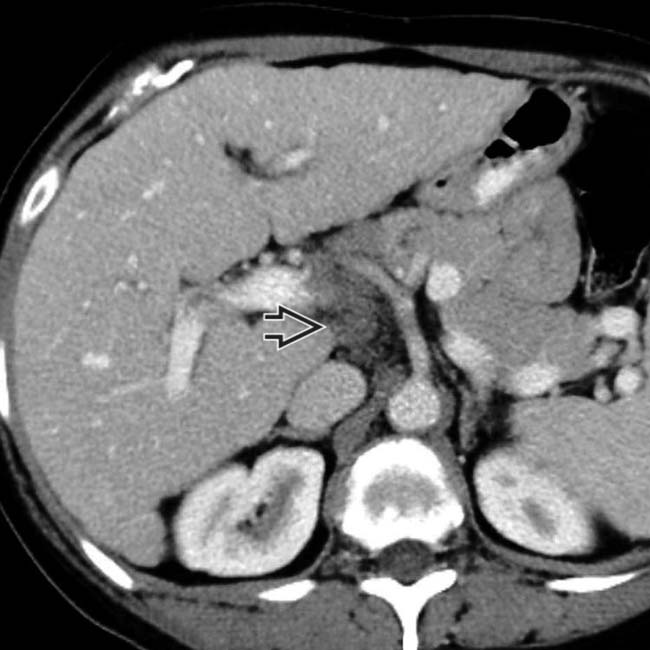
 , another typical feature of primary biliary cirrhosis, is also noted. Primary biliary cirrhosis is an autoimmune disease that typically affects women in their 5th or 6th decade.
IMAGING
General Features


CT Findings


• Vascular derangements


PATHOLOGY
General Features


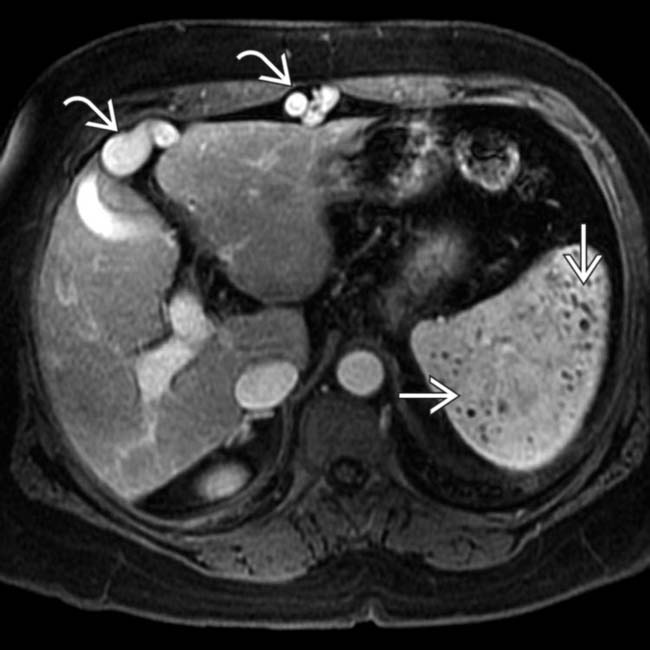
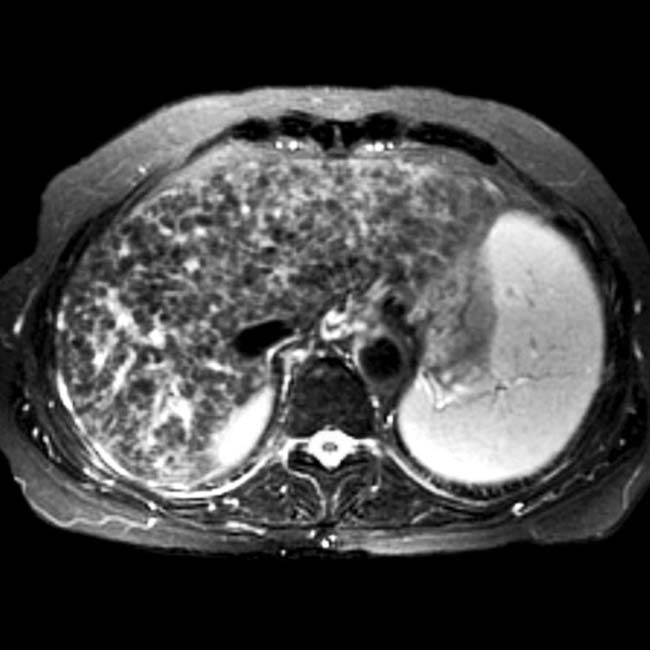
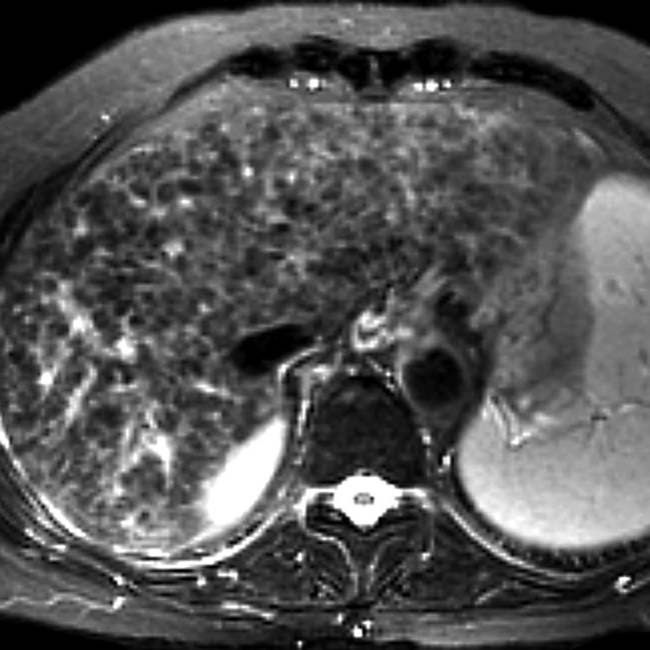
 . Within the spleen are innumerable small lesions that are especially evident as hypointense foci on this GRE T1WI contrast-enhanced image
  , representing Gamna-Gandy bodies.
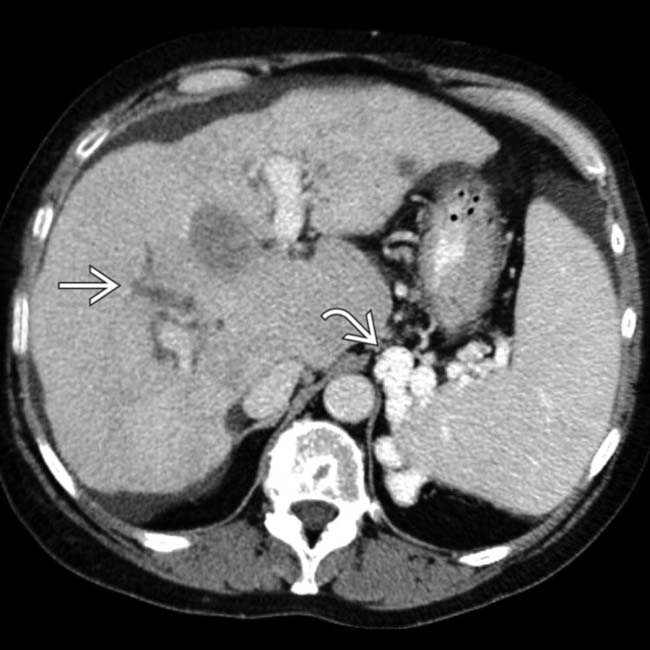
 . The intrahepatic ducts
  are dilated with an abnormal arborization, suggestive of PSC.
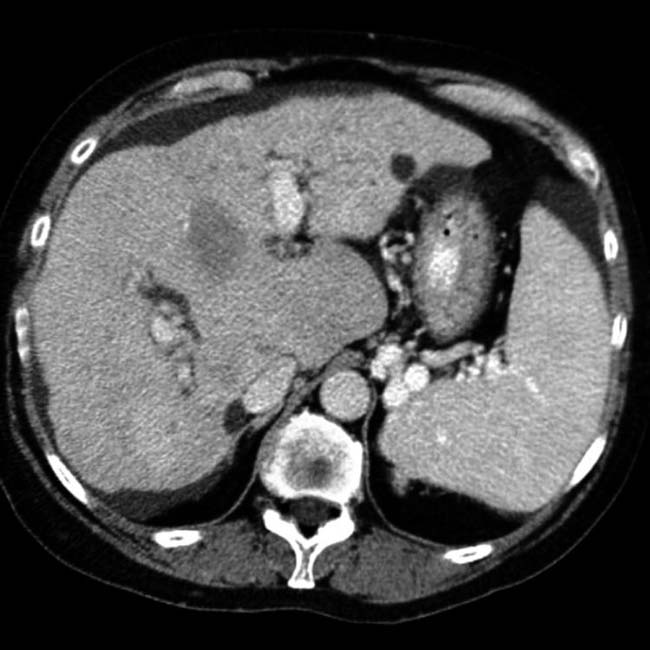
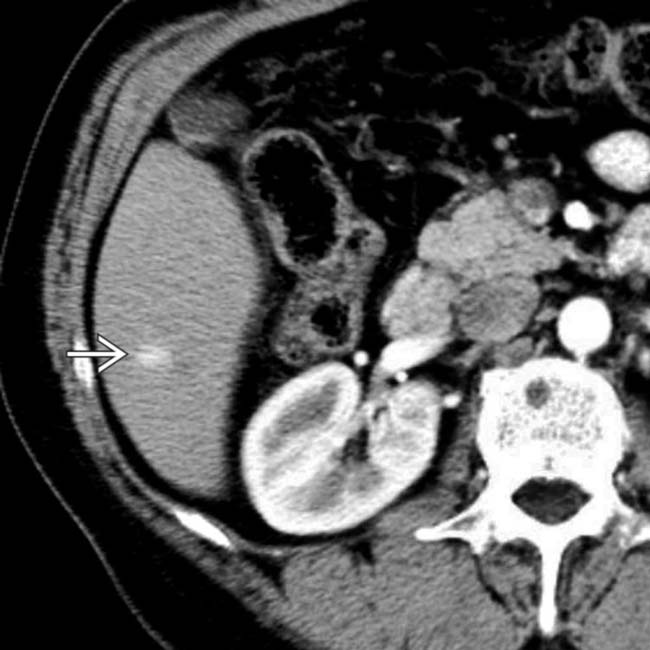
 that was isodense to the liver on all other phases. This lesion was not evident on repeat CT or MR over the next 2 years and presumably represents a small arterioportal shunt.
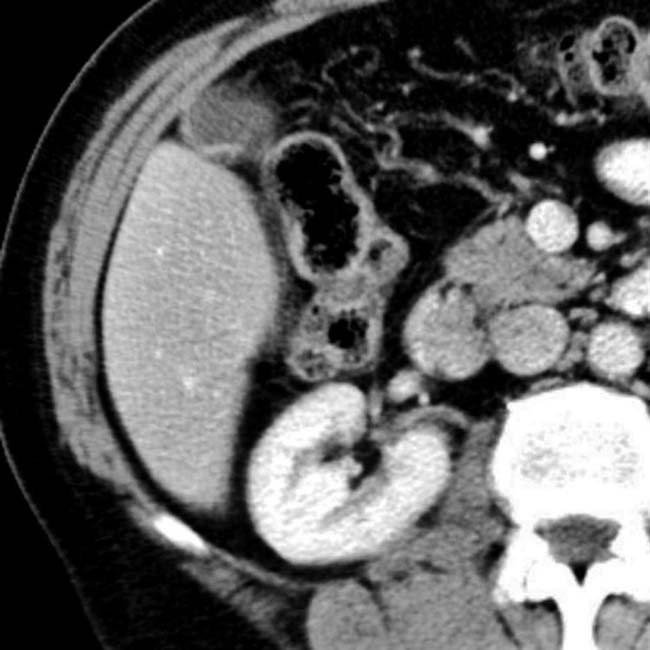
 .
.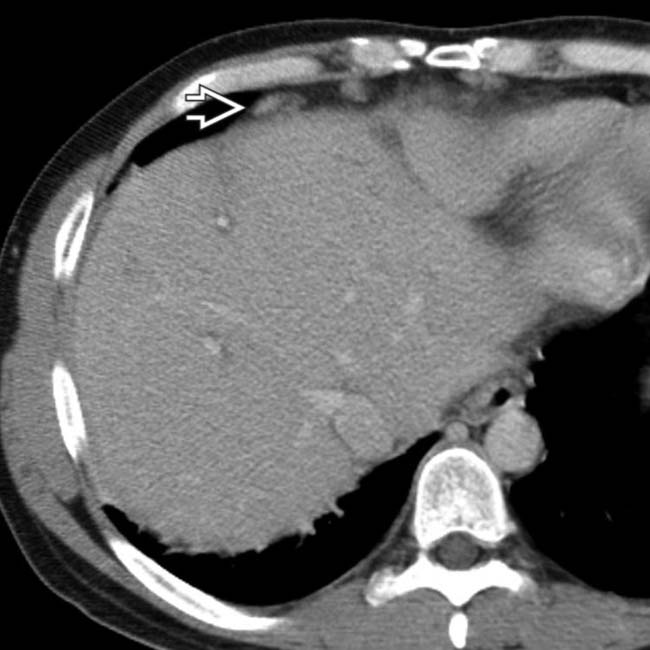
 in cardiophrenic regions. The intrahepatic ducts are not dilated but were found to be beaded and strictured on ERCP.
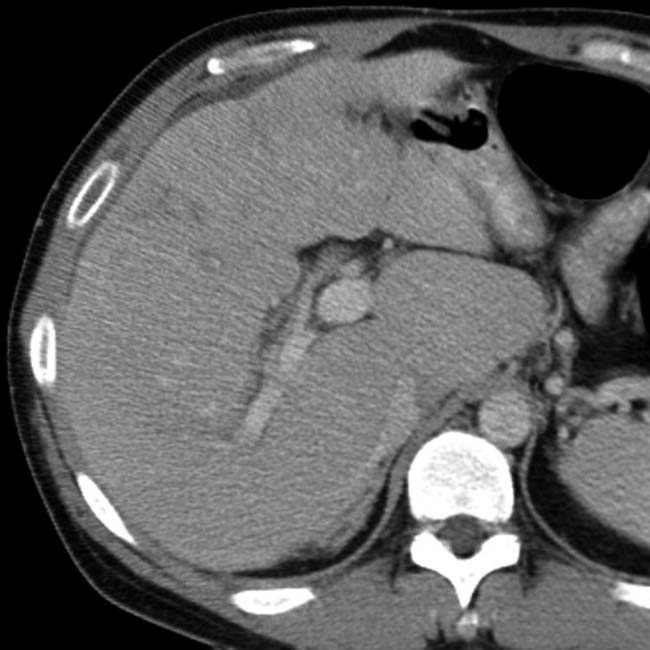
 .
.
 . Unrecognized or untreated right heart failure or constrictive pericarditis can lead to acute or irreversible hepatic damage.
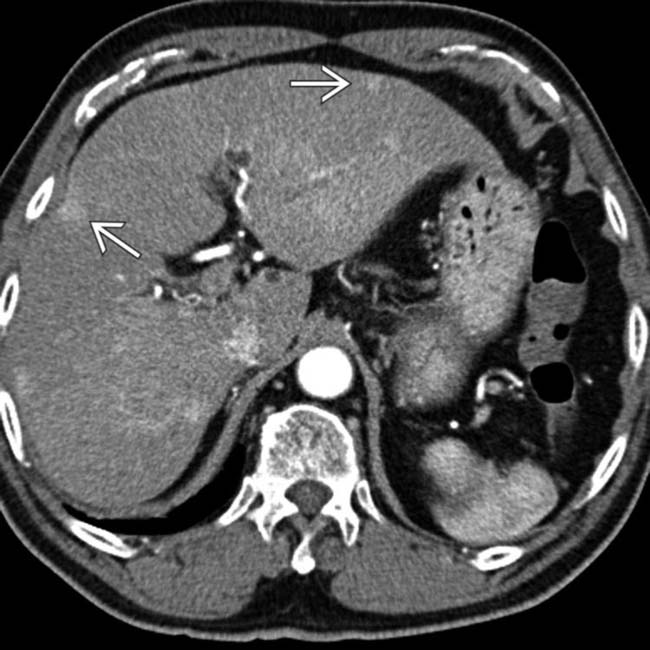
 .
.
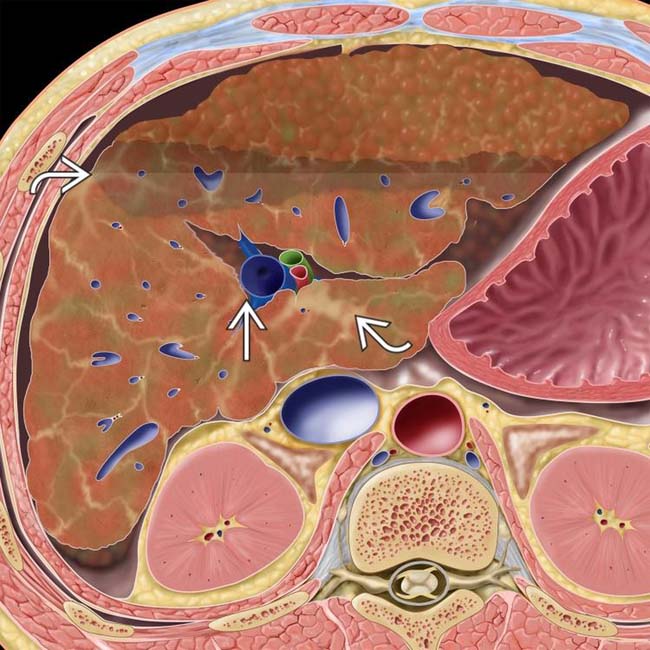
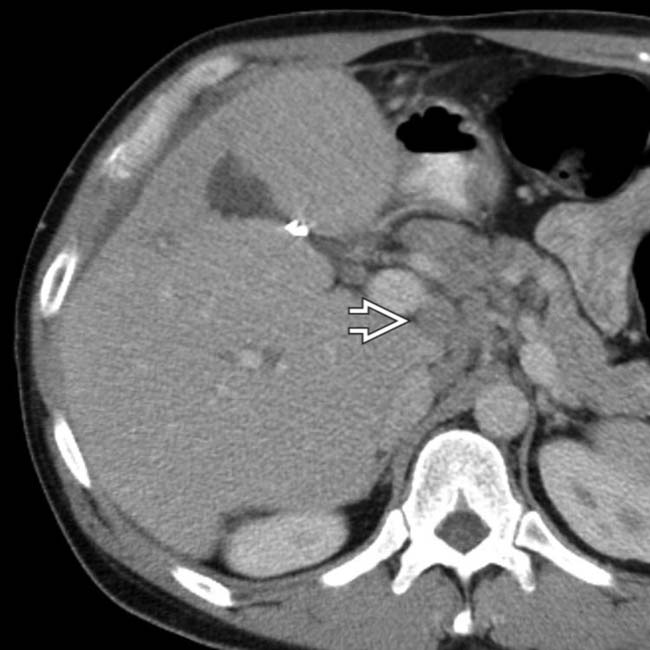
 . Also note the “corkscrew” enlarged hepatic arterial branch
  and the widened fissures, all typical of cirrhosis.
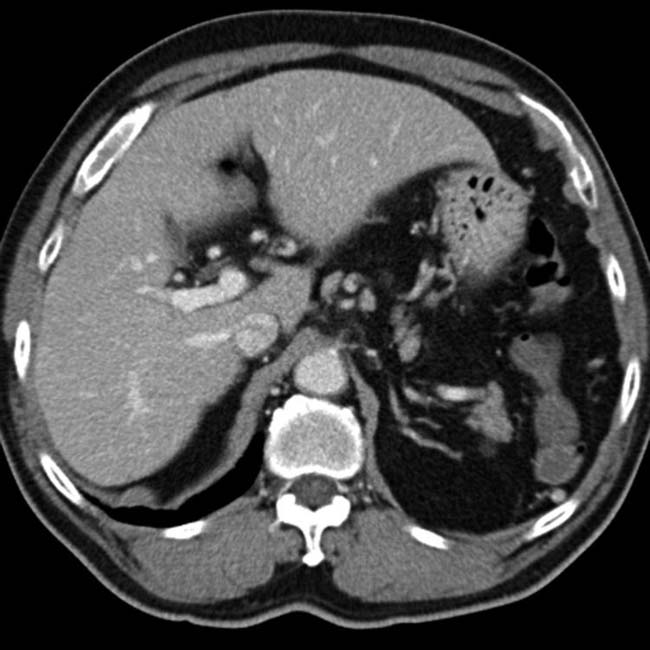
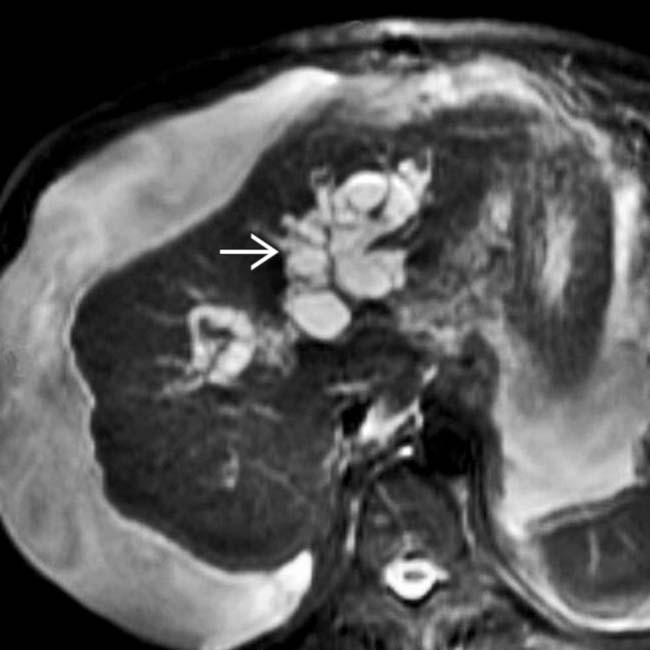
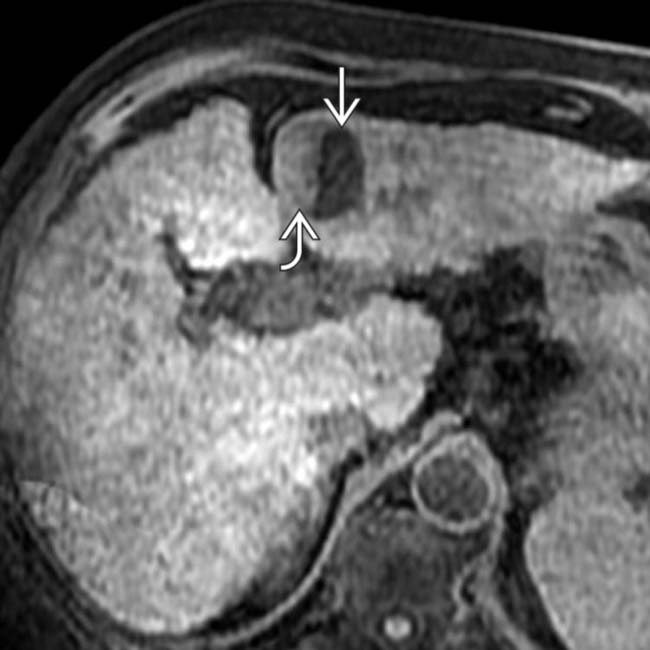
 that do not arborize (branch) as bile ducts and are spherical in shape, representing peribiliary cysts.
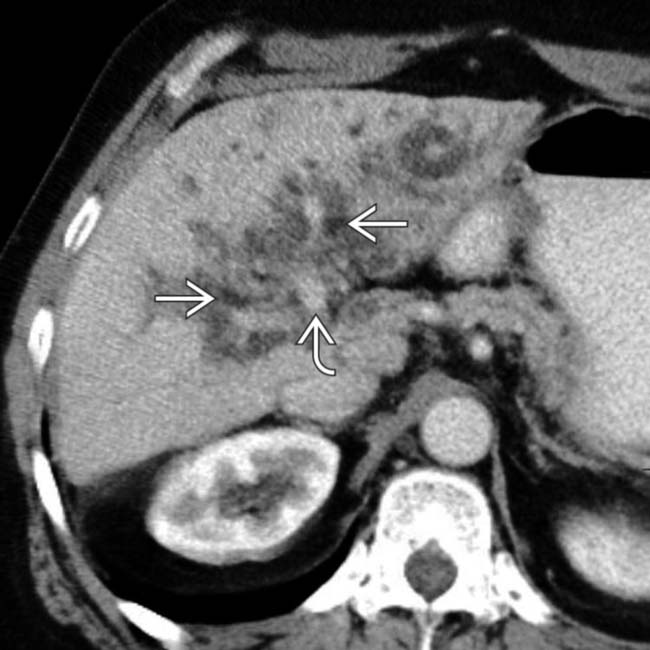
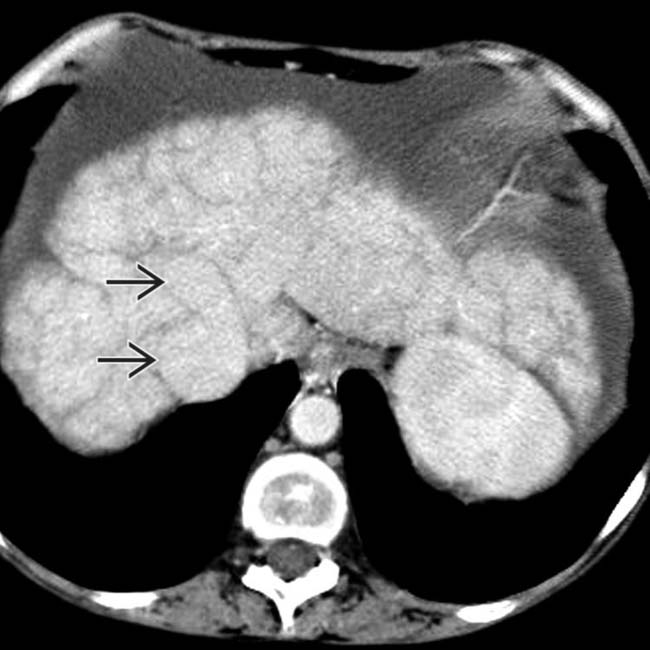
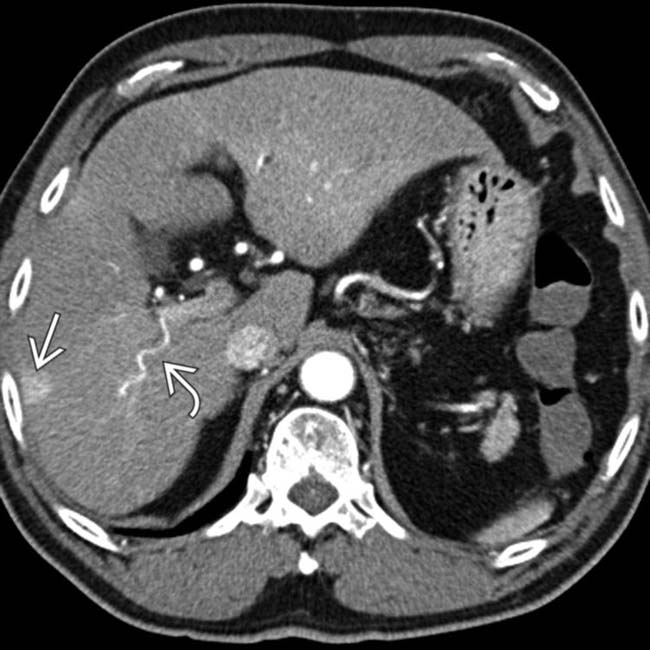
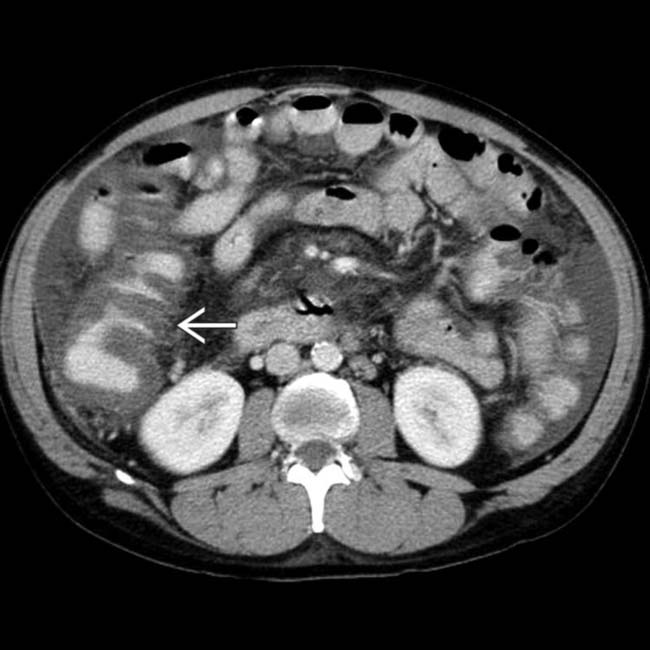
 are surrounded by a collar of low density, some of which probably represent periportal edema. However, there are also discrete low-density focal lesions
  that represent periportal cysts.
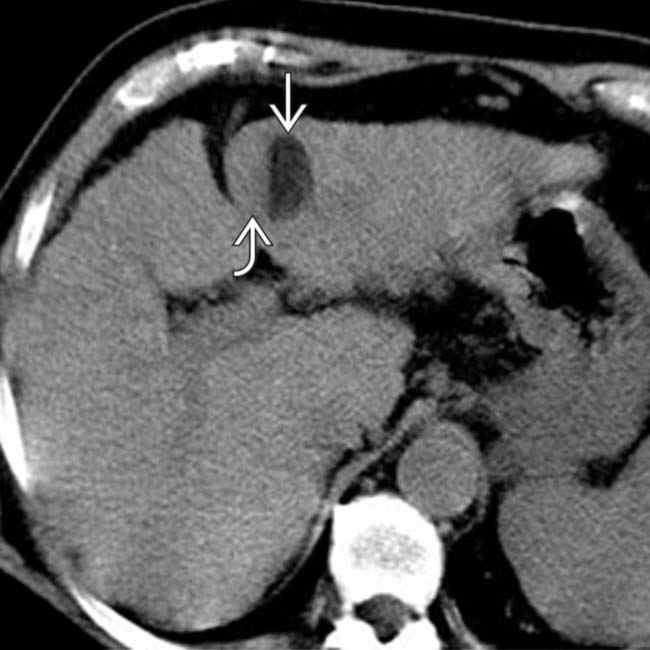
 and a soft tissue-density right half
  .
.
 and only relatively hyperintensity within the right lateral component
  .
.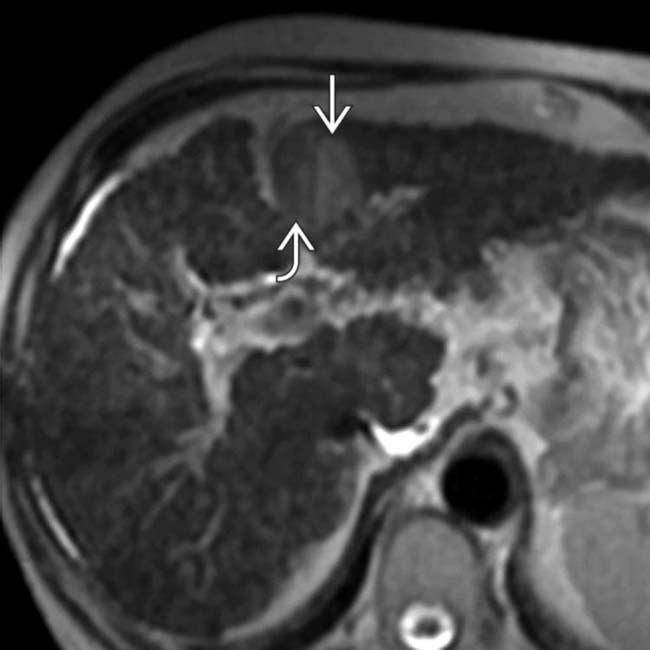
 , while the other portion of the lesion shows relatively bright signal
  on this non-fat-suppressed T2WI.
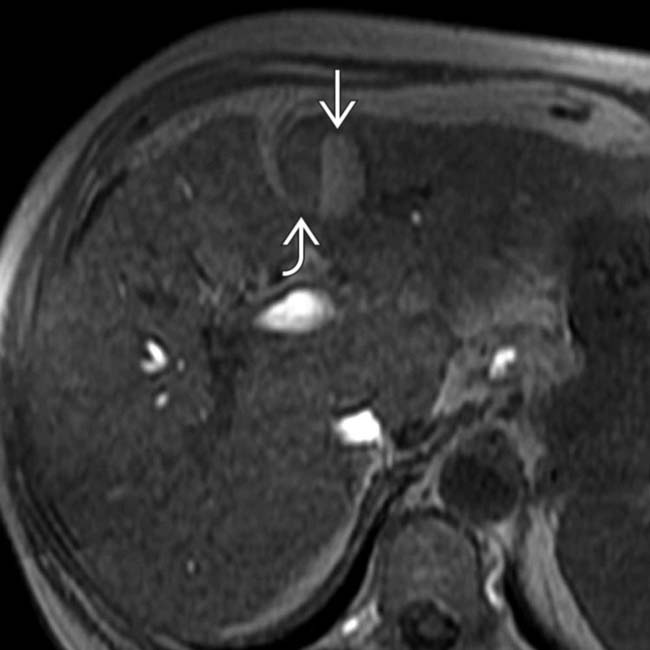
 is hyperintense and represents HCC, while the other half of the nodule is hypointense and is a dysplastic nodule
  .
.
 , which is strongly suggestive of HCC in a cirrhotic liver.
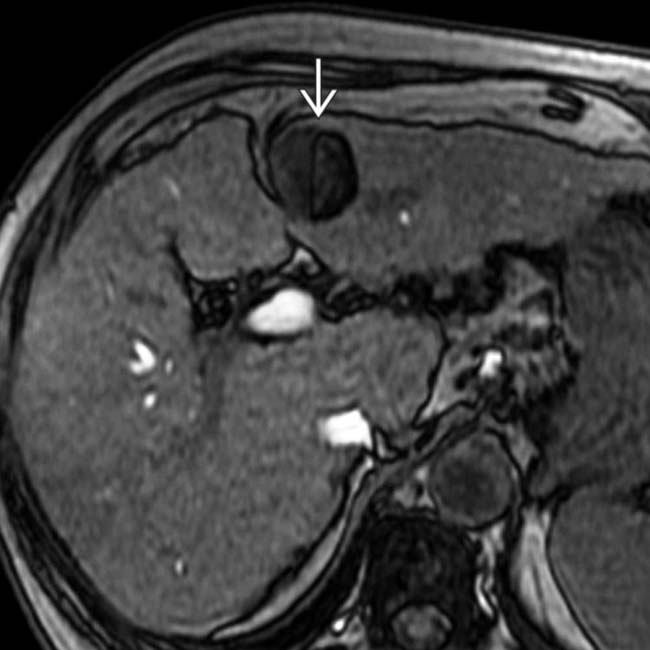
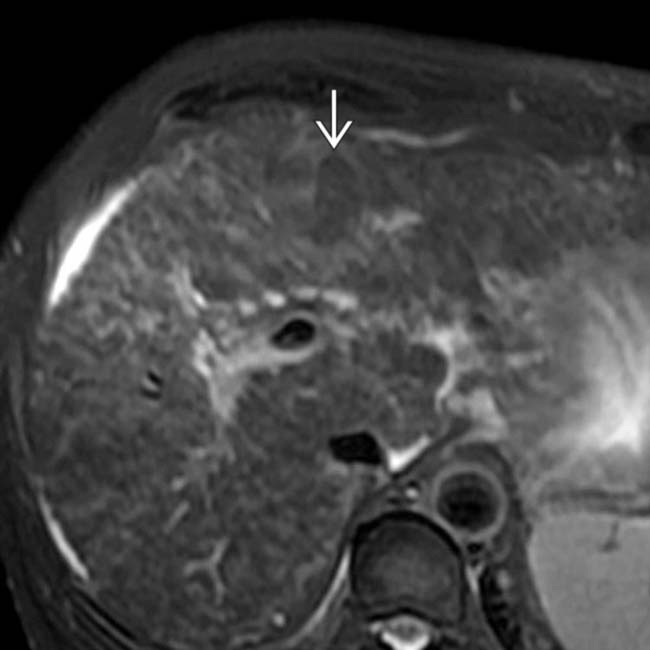
 . At resection, this was an HCC with fatty components within a larger dysplastic nodule. In addition, there are innumerable tiny cirrhotic regenerative nodules that are most evident as tiny hypointense foci on this GRE image.
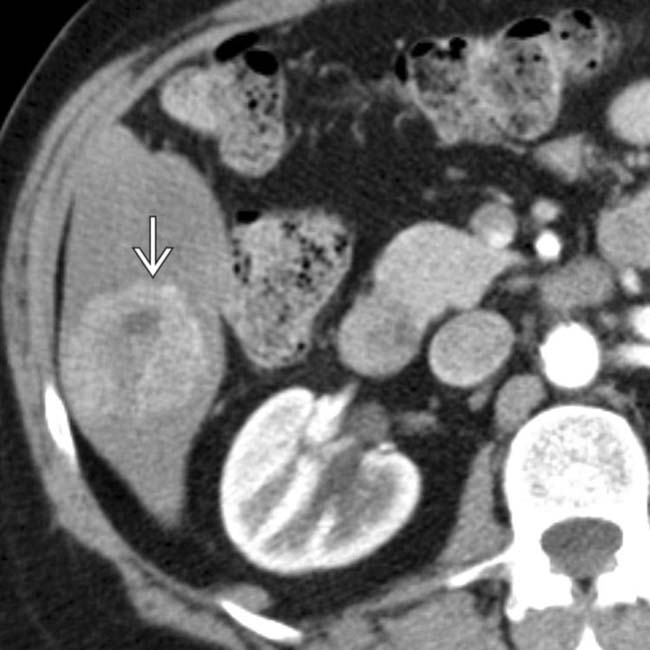
 .
.
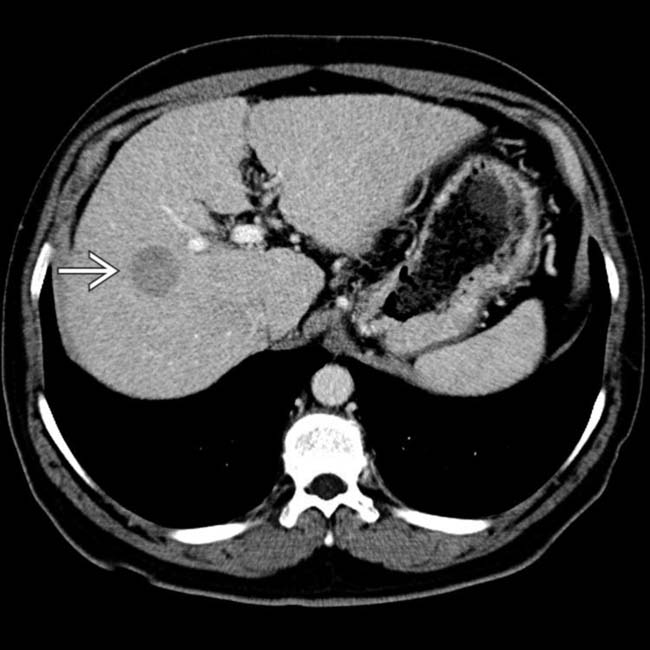
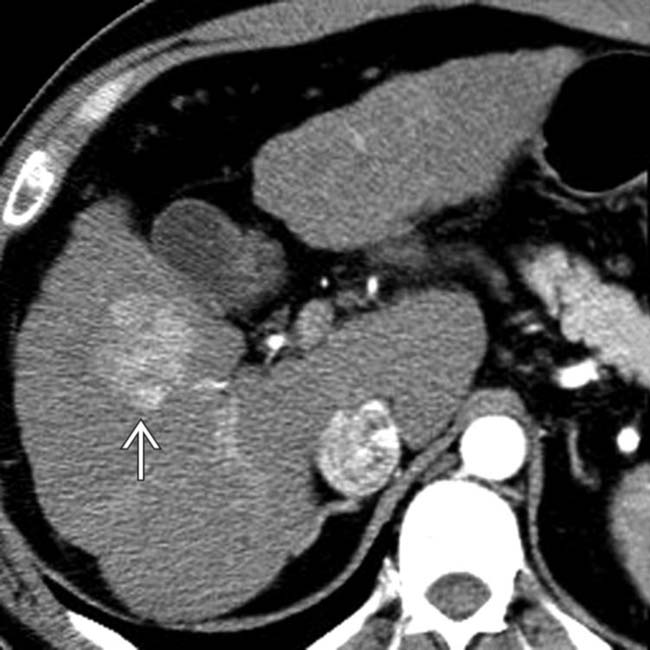
 is iso- to hypodense to the liver. These are typical features of HCC, particularly for a tumor detected as part of a surveillance program for patients with known cirrhosis who are at risk for developing HCC.
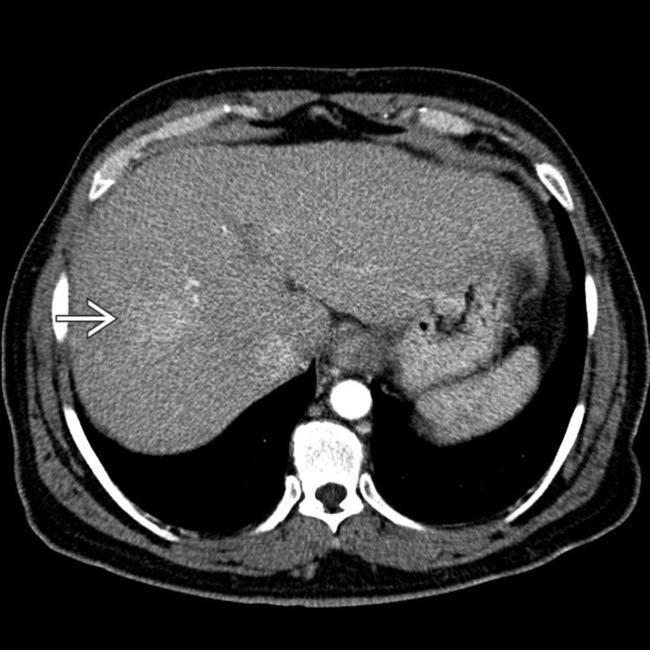
 . This proved to be HCC.
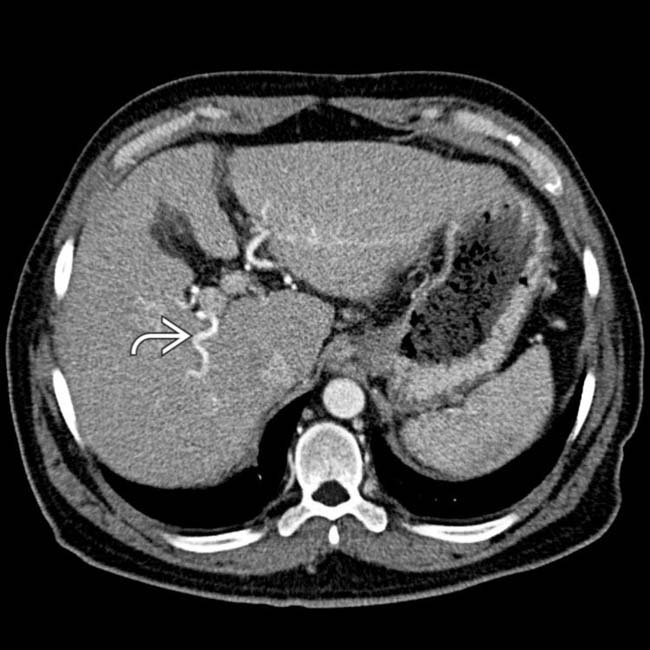
 .
.
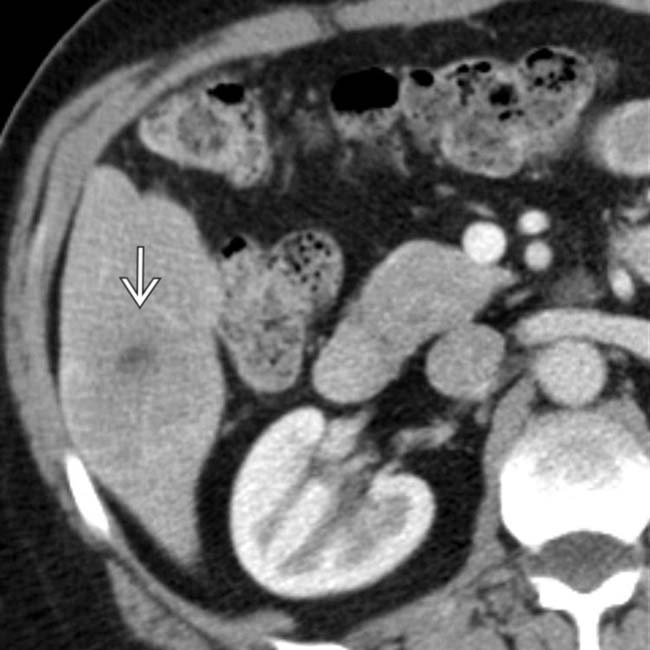
 , an HCC, much more clearly due to washout of contrast medium from the lesion.
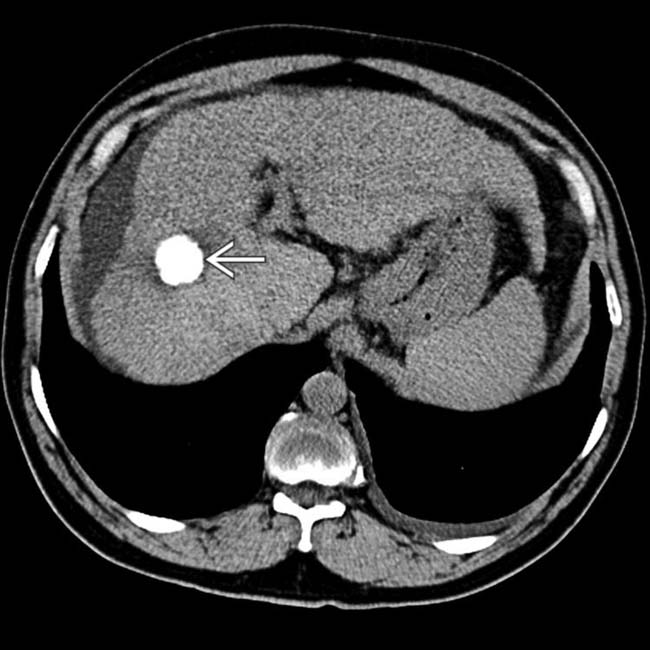
 . The tumor responded well to treatment, but liver function deteriorated, as evidenced by volume loss and development of ascites.
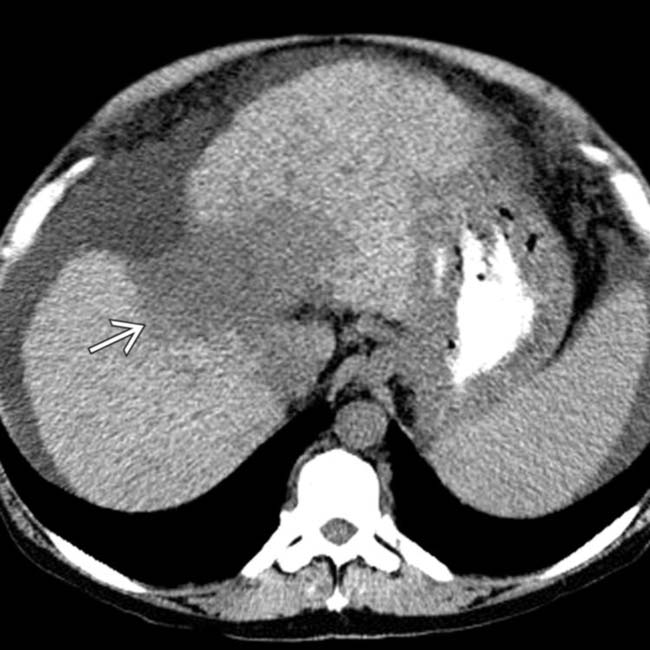
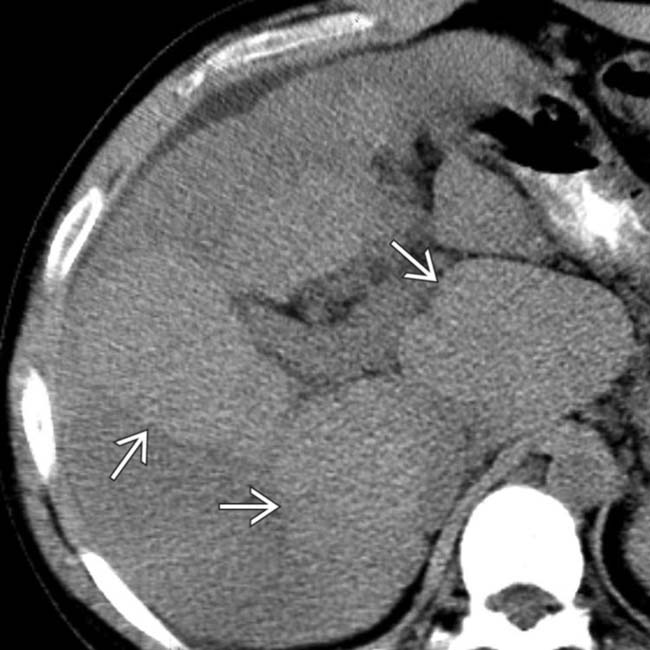
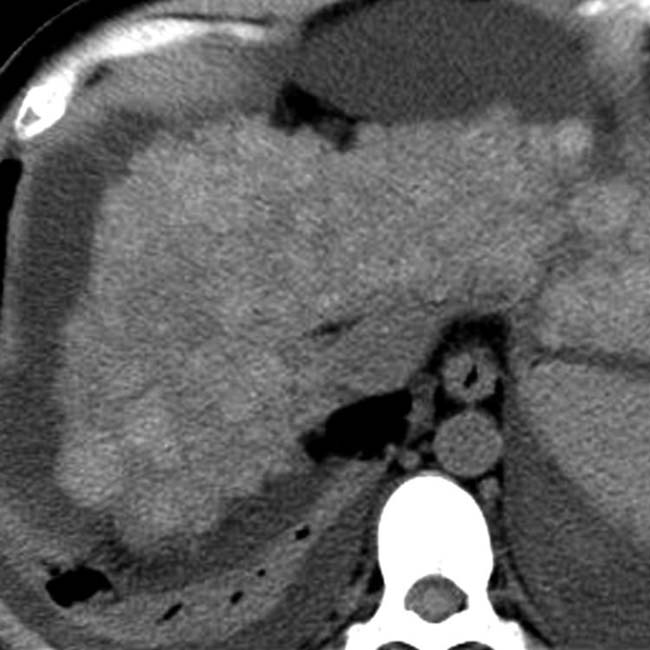
 within the anterior and medial segments; the overlying hepatic capsule is retracted. These findings are characteristic of confluent hepatic fibrosis, which is common in advanced cirrhosis.
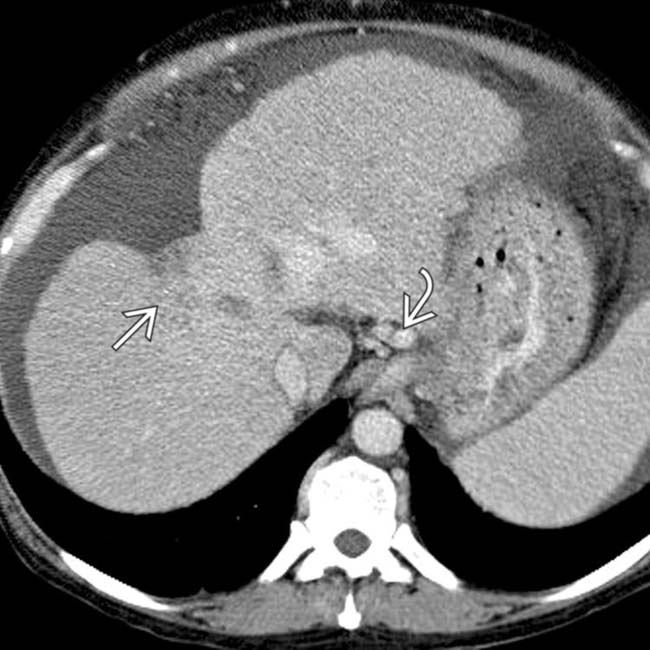
 in the same patient becomes almost isodense to the liver on this portal venous phase CECT. Also evident are varices
  , splenomegaly, and ascites, typical manifestations of portal hypertension.
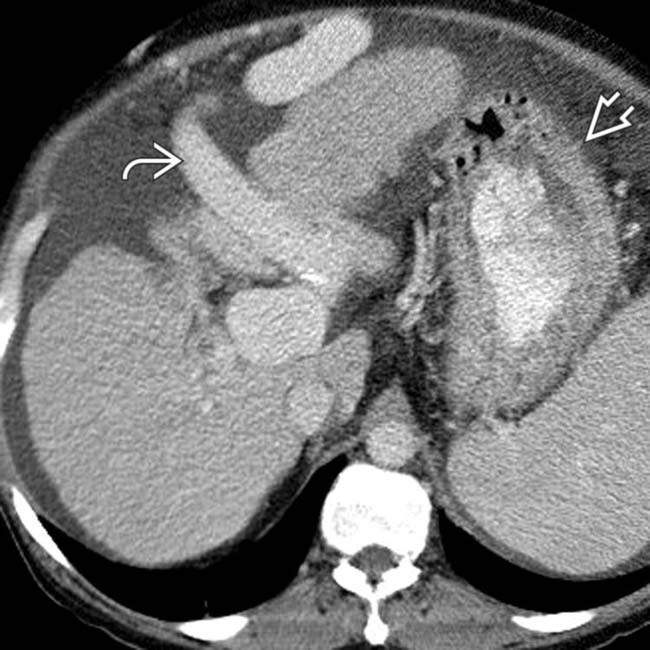
 and a thick-walled stomach
  that might represent portal hypertensive gastropathy.
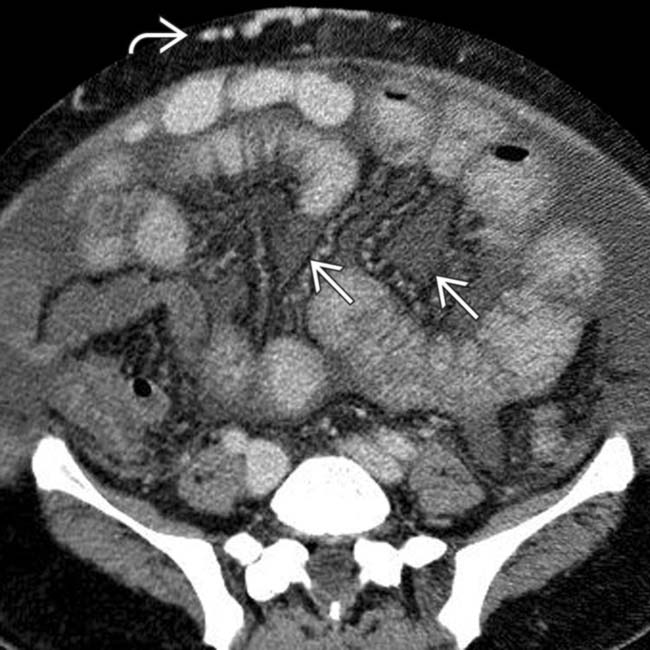
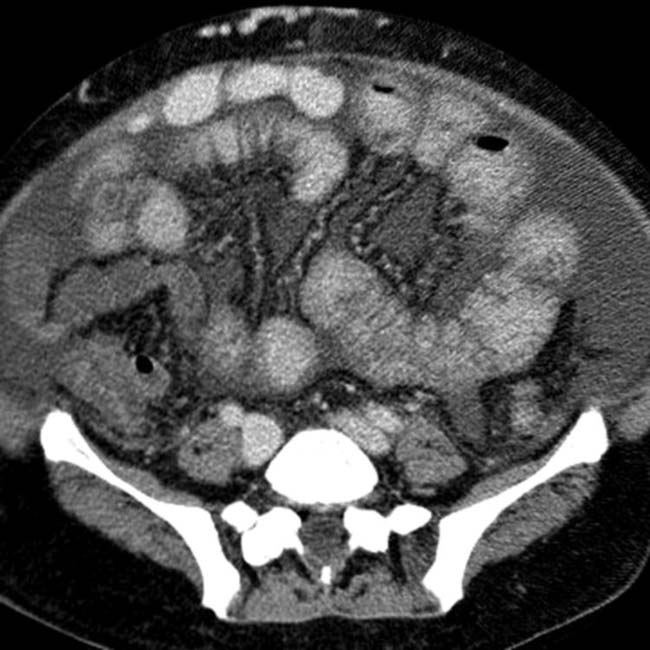
 , ascites, and mesenteric edema
  that accentuates the mesenteric vessels and their enveloping fat.
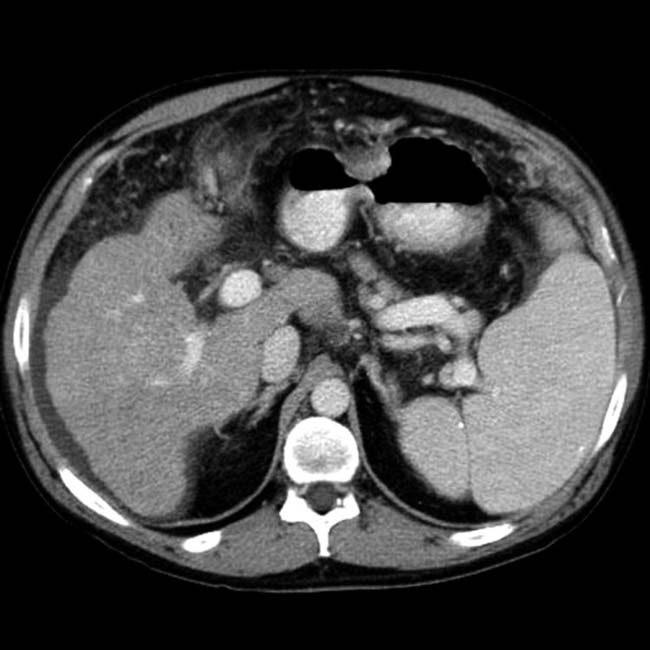
 , which simulates findings seen with colitis. On colonoscopy, there was no mucosal inflammation, only venous engorgement, known as portal hypertensive colopathy.
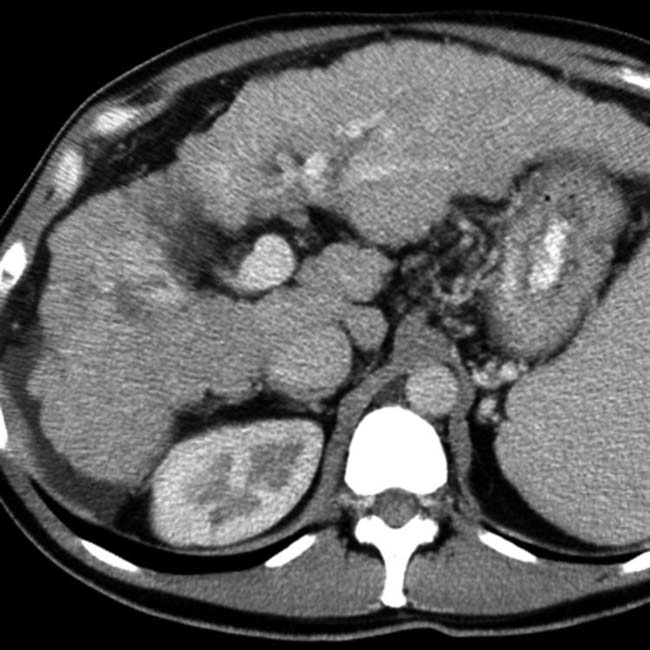
 is hepatocellular carcinoma.
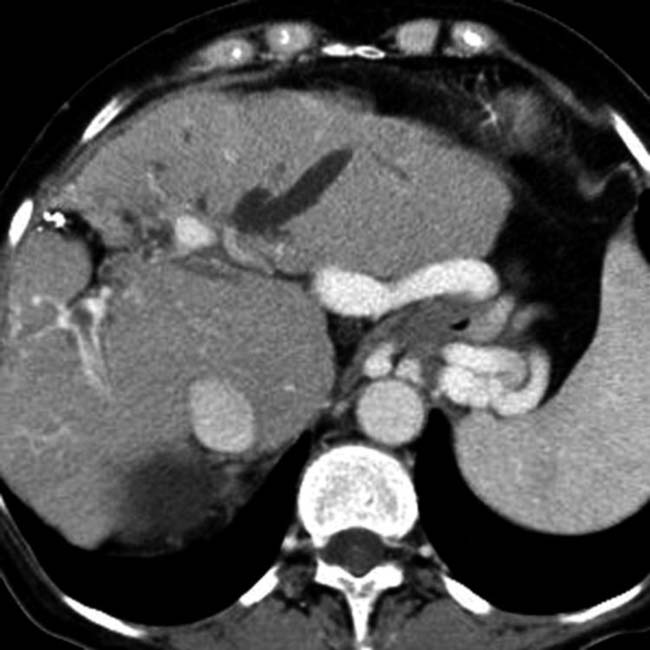
[/level-membership-for-radiology-category][not-level-membership-for-radiology-category] Hyperdense on NECT, isodense on CECT
to the edges of the caudate and right lobes, respectively. Note the bands of fibrosis and ascites.. Note the enlarged caudate lobe , which is as wide as the right lobe, although the caudate lobe is normally no more than 60% of the width of the right lobe., surrounded by lace-like fibrosis., another typical feature of primary biliary cirrhosis, is also noted. Primary biliary cirrhosis is an autoimmune disease that typically affects women in their 5th or 6th decade.IMAGING
General Features
CT Findings
• Vascular derangements
DIFFERENTIAL DIAGNOSIS
Treated Liver Metastases or Lymphoma
Budd-Chiari Syndrome
• Liver damaged but usually no bridging fibrosis
Buy Membership for Radiology Category to continue reading. Learn more here
[/not-level-membership-for-radiology-category]
