[level-membership-for-basic-science-category]
29 Cerebral cortex
Structure
Laminar organization
Cellular laminae of the neocortex (Figure 29.1)
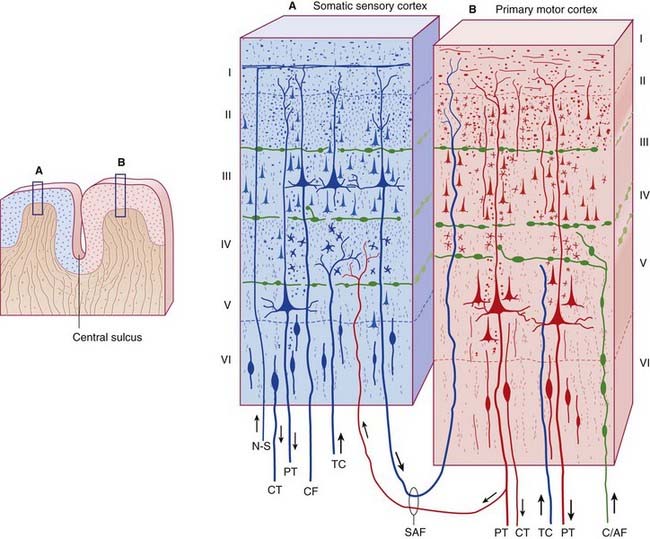
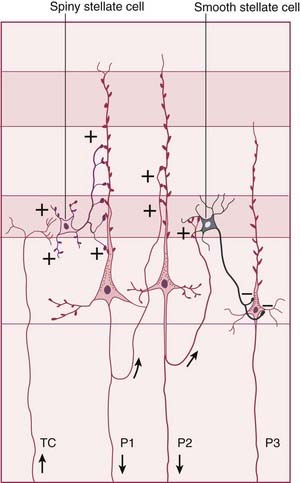
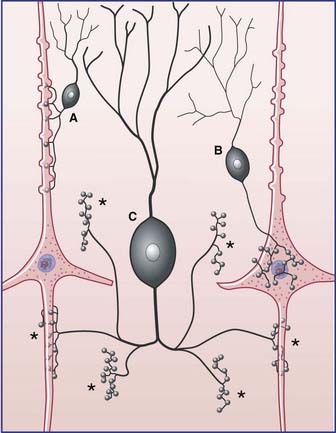
Cell types
The three principal morphological cell types are pyramidal cells, spiny stellate cells, and smooth stellate cells (Figure 29.2).
Afferents
Afferents to a given region of the cortex are derived from five sources:
| •basal forebrain nuclei | acetylcholine |
| •tuberoinfundibular (hypothalamus) | histamine |
| •tegmentum (midbrain) | dopamine |
| •raphe nucleus (midbrain) | serotonin |
| •cerulean nucleus (pons) | norepinephrine |
These five sets of neurons are of particular relevance to psychiatry and are considered in Chapter 34.
Efferents
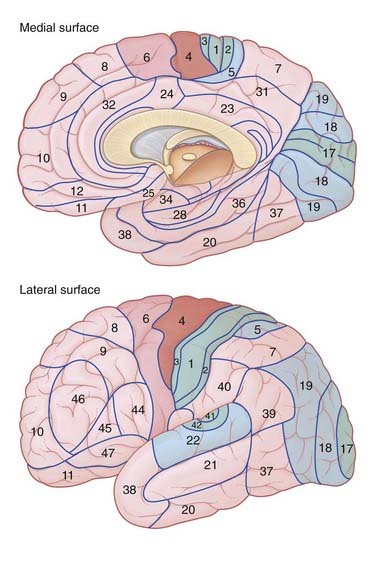
Cortical Areas
The most widely used reference map is that of Brodmann, who divided the cortex into 47 areas on the basis of cytoarchitectural differences. Most of these areas are shown in Figure 29.4. Colored in that figure are the three principal primary sensory areas (somatic, visual, auditory) and the single primary motor area, together with the respective unimodal association areas. The rest of the neocortex comprises multimodal (polymodal) association areas receiving association fibers from more than one unimodal association area (e.g. receiving tactile and visual inputs, or visual and auditory).
Investigating functional anatomy
Positron emission tomography
Image subtraction and image averaging are required for meaningful interpretation of PET studies, as explained in the caption to Figure 29.5.
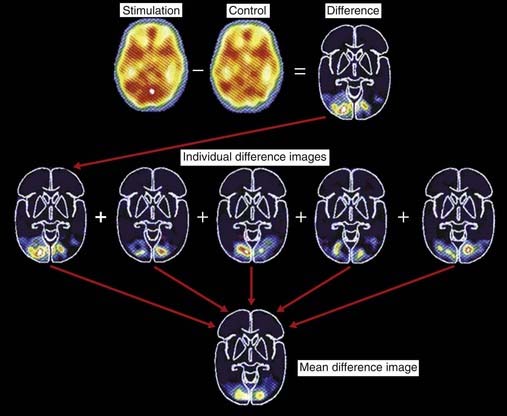
Figure 29.5 Image subtraction and image averaging in PET scans.
(Adapted from Posner and Raichle, Images of Mind, Sci. Amer. Library, 1994, p. 65, with permission.)
For specialized investigations, radiolabeled drugs are used to quantify receptor function, e.g. radiolabeled dopamine in the corpus striatum in relation to Parkinson’s disease (Ch. 33); radiolabeled serotonin in brainstem and cortex in relation to depression (Ch. 26), and radiolabeled acetylcholinesterase in relation to Alzheimer disease (Ch. 34).
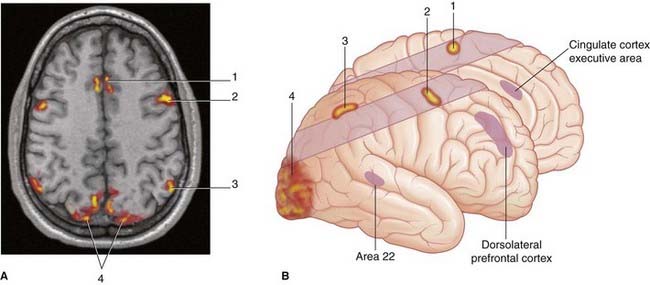
Functional magnetic resonance imaging
Functional magnetic resonance imaging (fMRI) (Figure 29.6) does not require introduction of any extraneous material. It depends upon the different magnetic susceptibility of oxygenated versus deoxygenated blood. As it happens, the local increases in blood flow are more than sufficient to meet oxygen demands, and it is the increase in the ratio of oxyhemoglobin to deoxyhemoglobin that is exploited to generate the MR signal.
Sensory Areas
Somatic sensory cortex (areas 3, 1, 2)
Components
The somatic sensory or somesthetic cortex occupies the entire postcentral gyrus (Figure 29.7). Representation of contralateral body parts is inverted except for the face, and the hand, lips, and tongue have disproportionately large representations. The homunculus diagram shown in Figure 29.7A was intended to be only schematic and ignored the extensive overlap of body part representations.
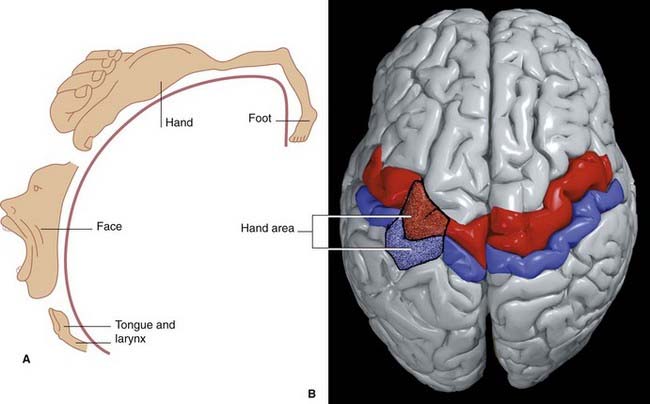
Figure 29.7 (A) Figurine (adapted from Penfield and Rasmussen, 1960) depicting the inverted disposition of the motor homunculus in the left precentral gyrus excepting the face. Overlap among body part representations is not shown.
(Adapted from Kretschmann, H-J. and Weinrich, W. Neurofunctional Systems: 3D Reconstructions with Correlated Neuroimaging: Text and CD-ROM. 1998 New York: Thieme, with permission.)
In vertical sections, represented in Figure 29.8, the somesthetic cortex is divisible into areas 3, 2, and 1. Area 3 is divided into smaller area 3a, in receipt of information relayed from muscle spindles, and a larger area 3b, receiving information relayed from cutaneous receptors. Area 3b is highly granular and is regarded as the true primary somatosensory cortex (S1).
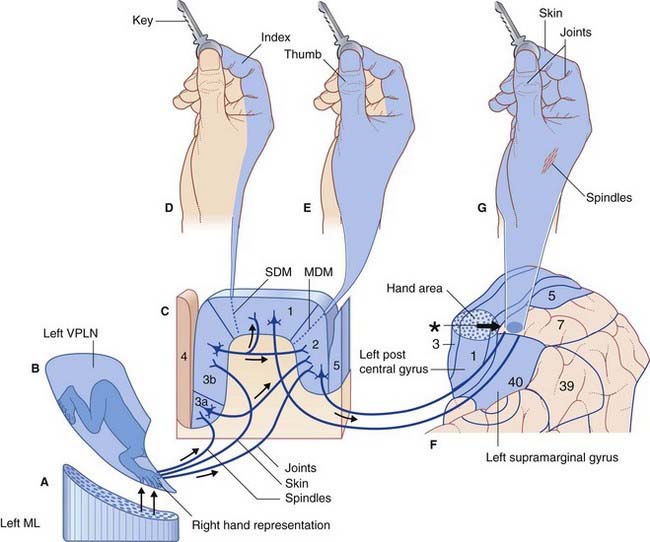
Figure 29.8 Sensory sequence enabling identification of a key by touch alone.
(C)The third-order neurons project to areas 3, 1 (indirectly), and 2 of the somatic sensory cortex.
Modules in area 1 have peripheral receptive fields confined to a single digit (Figure 29.8D). In monkeys, needle electrodes recording from area 1 reveal feature extraction, e.g. some modules are rapidly adapting, some are slowly adapting, some respond only to skin stroking in a specific direction, and some respond only to noxious stimulation of the skin. Modules in area 2 (Figure 29.8C) have multidigit receptive fields and receive from muscles and joint capsules in addition to skin.
Afferents
In addition to thalamic afferents from the ventral posterior nucleus (Figure 29.8B), the somesthetic cortex receives commissural fibers from the opposite somatic sensory cortex through the corpus callosum, and short association fibers from the adjacent primary motor cortex. Many of the fibers from the motor cortex are collaterals of corticospinal fibers traveling to the anterior horn of the spinal cord, and they may contribute to the sense of weight when an object is lifted.
Efferents
Efferents from the somesthetic cortex comprise association, commissural, and projection fibers. Association fibers pass to the ipsilateral motor cortex, to area 5 and to area 40 (the supramarginal gyrus). Commissural fibers pass to the contralateral somesthetic cortex. Projection fibers descend within the posterior part of the pyramidal tract and terminate upon internuncial neurons in sensory relay nuclei, namely the ventral posterior nucleus of the thalamus of the same side, and the posterior column and spinal posterior gray horn of the opposite side. As explained in Chapter 16, sensory transmission in the spinothalamic pathway may be suppressed (via inhibitory internuncials, during vigorous activities such as running, whereas in the posterior column–medial lemniscal pathway, transmission may be enhanced (via excitatory internuncials) during exploratory activities such as palpation of textured surfaces.
Superior parietal lobule
Clinically, the term superior parietal lobule is equated with area 7. The lower part of area 7 receives inputs from areas 1, 2 and 5. Receipt of tactile and proprioceptive information from skin, muscles, and joints causes area 7 to tap into its own memory stores concerning the shapes of objects held in the (opposite) hand, whereby an unseen object can be identified (Figure 29.8). This ability is known as stereognosis, a term signifying ability to perceive objects ‘in the round’.
The upper part of area 7 contains a cell station in the ‘Where’ visual pathway (see later).
Inferior parietal lobule
The inferior parietal lobule comprises areas 39 (angular gyrus) and 40 (supramarginal gyrus). Both are concerned with language, a mainly left hemisphere function described in Chapter 32.
Secondary somatic sensory area
On the medial surface of the parietal operculum of the insula is a small secondary somatic sensory area (SII). It receives a nociceptive projection from the thalamus and it is highlighted during PET scans of the brain during peripheral painful stimulation (Ch. 34). SII also appears to collaborate with SI in aspects of tactile discrimination.
Plasticity of the somatic sensory cortex
Visual cortex (areas 17, 18, 19)
Primary visual cortex (Figure 29.4)
As noted in Chapter 28, the primary visual cortex is the target of the geniculocalcarine tract, which relays information from the ipsilateral halves of both retinas, and therefore from the contralateral visual field. This myelinated tract creates a pale visual stria within the primary visual cortex before synapsing upon spiny stellate cells of the highly granular lamina IV. The visual stria (first noted by medical student Francesco Gennari circa 1775) has provided the alternative name, striate cortex, for area 17.
The spiny stellate cells belong to ocular dominance columns, so named because alternating columns are dominated by inputs from the left and right eyes (Ch. 28). In a surface view of the visual cortex, the columnar arrangement takes the form of whorls, resembling finger prints. The geniculocalcarine projection is so ordered that matching points from the two retinas are registered side by side in contiguous columns. This arrangement is ideal for binocular vision because modules at the edge of a column respond to inputs from both eyes.
The ‘Where?’ visual pathway (Figure 29.9)
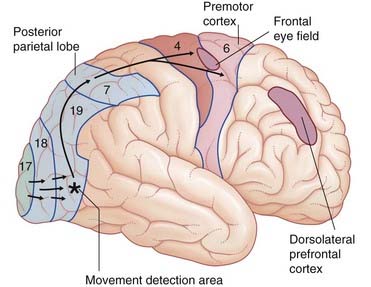
In volunteers, two additional areas of cortex become active when items of special interest appear. Shown in Figure 29.8, and mentioned again later, is the dorsolateral prefrontal cortex (DLPFC), a significant decision-making area, notably in relation to an approach or withdraw decision. Shown in Figure 29.10 is a patch in the cortex of the anterior cingulate gyrus. This area is considered in Chapter 34 but it may be mentioned here that it is activated by the dorsolateral cortex when subjects are paying attention to a visual task.
The ‘What?’ visual pathway (Figure 29.10)
The ventral visual pathway converges onto the anteromedial part of area 19, mainly within the fusiform gyrus part of the occipitotemporal gyrus. This region is concerned with three kinds of visual identification, indicated in Figure 29.10B:
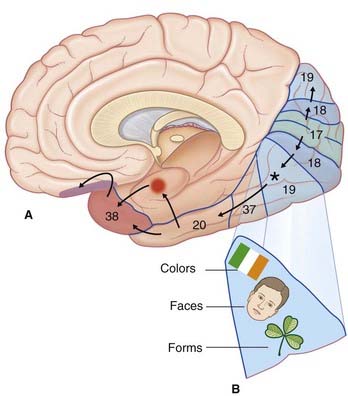
Recognition of individual objects and faces is a function of the anterior part of the ‘What?’ pathway in the inferotemporal cortex (area 20) and in the cortex of the temporal pole (area 38). These two areas are engaged during identification of, for example, Mary’s face or my dog. Failure of facial recognition (prosopagnosia) is a frequent and distressing feature of Alzheimer disease (Ch. 34), where the patient may cease to recognize family members despite retaining the sense of familiarity of common objects.
Threatening sights or faces cause areas 20 and 38 to activate the amygdala, especially in the right (emotional) hemisphere; the right amygdala in turn activates the fear-associated right orbitofrontal cortex (see Ch. 30).
Auditory cortex (areas 41, 42, 22)
The primary auditory cortex occupies the anterior transverse temporal gyrus of Heschl, described in Chapter 20. Heschl’s gyrus corresponds to areas 41 and 42 on the upper surface of the superior temporal gyrus. Columnar organization in the primary auditory cortex takes the form of isofrequency stripes, each stripe responding to a particular tonal frequency. Higher frequencies activate lateral stripes in Heschl’s gyrus, lower frequencies activate medial stripes. Because of incomplete crossover of the central auditory pathway in the brainstem (Ch. 20), each ear is represented bilaterally. In experimental recordings, the primary cortex responds equally well from both ears in response to monaural stimulation but the contralateral cortex is more responsive during simultaneous binaural stimulation.
The auditory association cortex corresponds to area 22, for speech perception (considered in Ch. 32). Visual and auditory data are brought together in the polymodal cortex bordering the superior temporal sulcus (junction of areas 21 and 22).
Motor Areas
Primary motor cortex
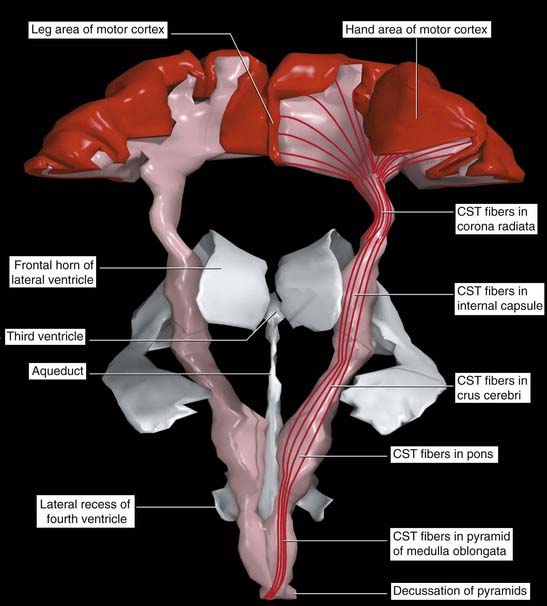
The primary motor cortex (area 4) is a strip of agranular cortex within the precentral gyrus. It gives rise to 60–80% (estimates vary) of the pyramidal tract (PT). The remaining PT fibers originate in the premotor and supplementary motor areas and in the parietal cortex, as illustrated in Chapter 16.
There is an inverted somatotopic representation of contralateral body parts except the face, with relatively large areas devoted to the hand, circumoral region, and tongue (Figure 29.7). The hand area can usually be identified as a backward projecting knob 6–7 cm from the upper margin of the hemisphere.
A computerized graphic reconstruction of the motor cortex and corticospinal tracts from a postmortem brain is shown in Figure 29.11.
Sources of afferents to the primary motor cortex
Premotor cortex
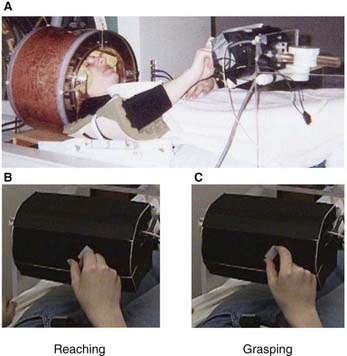
The premotor cortex (PMC, area 6 on the lateral surface of the hemisphere) is about six times larger than the primary motor cortex. It receives cognitive inputs from the frontal lobe in the context of motor intentions, and a rich sensory input from the parietal lobe (area 7) incorporating tactile and visuospatial signals. It is especially active when motor routines are run in response to visual or somatic sensory cues, e.g. reaching for an object in full view or identifying an object out of sight by manipulation. The PMC is usually active bilaterally if at all. One explanation is the need for interhemispheric transfer of motor plans through the corpus callosum. It is also the case that the PMC has a major projection to the brainstem nuclei that give origin to the reticulospinal tracts (and a minor one to the pyramidal tract). Lesions confined to the human PMC are rare, but they are characterized by postural instability of the contralateral shoulder and hip. A significant function of the PMC therefore seems to be that of bilateral postural fixation, e.g. to fixate the shoulders during bimanual tasks and to stabilize the hips during walking. The PMC may contribute to recovery of function in cases of pure motor hemiplegia (Ch. 35) following a vascular lesion confined to the corticospinal tract within the corona radiata. The PMC shows increased activity on PET scans following such a lesion; the corticoreticulospinal pathway descends anterior to the corticospinal tract.
Supplementary motor area
In contrast to the PMC’s responsiveness to external cues, the supplementary motor area (SMA, area 6 on the medial surface of the hemisphere) responds to internal cues. In particular, it is involved in motor planning, as exemplified by the fact that SMA is activated by the frontal lobe (DLPFC) the moment we intend to make a movement, even if the movement is not performed. The principal function of SMA seems to be that of preprogramming movement sequences that have already been built into motor memory. It functions in collaboration with a motor loop passing through the basal ganglia (Ch. 33) and projects to area 4 as well as contributing directly to the pyramidal tract. Unilateral lesions of SMA are associated with akinesia (inability to initiate movement) of the contralateral arm and leg. Bilateral lesions are accompanied by total akinesia, including akinesia for speech initiation.
Cortical eye fields
Figure 29.12 illustrates six cortical eye fields involved in scanning movements (saccades). Their connections and functions are summarized in Table 29.1.
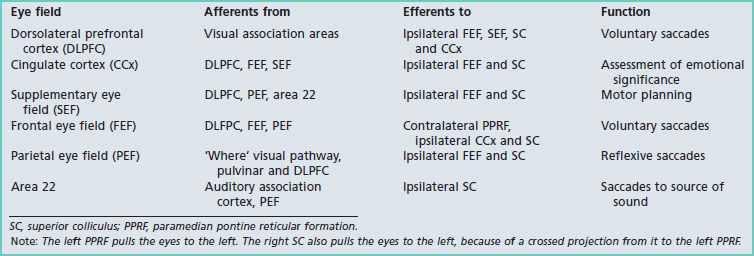
Frontal eye field (FEF)
Barbeau EJ, Taylor MJ, Regis J, et al. Spatiotemporal dynamics of face recognition. Cereb Cortex. 2008;18:997-1009.
Behrmann M, Geng JJ, Shomstein S. Parietal cortex and attention. Curr Opin Neurobiol. 2004;14:210-217.
Burke MR, Barnes GR. Brain and behavior: a task-dependent eye movement study. Cereb Cortex. 2008;18:126-135.
Crowley JC, Katz LC. Ocular dominance development revisited. Curr Opin Neurobiol. 2002;12:104-109.
DeFelipe J. Chandelier cells and epilepsy. Brain. 1999;122:1807-1822.
Edeline J-M. Learning-induced physiological plasticity in the thalamocortical sensory systems. Progr Neurobiol. 1999;57:165-224.
Garoff RJ, Slotnick SD, Shacter DL. Neural origins of specific and general memory: the role of the fusiform cortex. Neuropsychologia. 2005;43:847-859.
Ghose GM. Learning in mammalian sensory cortex. Curr Opin Neurobiol. 2004;14:513-518.
Grefkes C, Fink GR. The functional organization of the intraparietal sulcus in humans and monkeys. J Anat. 2005;207:3-17.
Im K, Lee J-M, Lyttelton O, et al. Brain size and cortical structure in the human brain. Cereb Cortex. 2008;18:2181-2191.
Kretschmann H-J, Weinrich W. Neurofunctional systems: 3D reconstructions with correlated neuroimaging: text and CD-ROM. New York: Thieme; 1998.
Munoz DP. Commentary: saccadic movements: overview of neural circuitry. Neuroreport. 2002;13:2325-2330.
Passingham D, Sakai K. The prefrontal cortex and working memory: physiology and brain imaging. Curr Opin Neurobiol. 2004;14:163-168.
Penfield W, Rasmussen T. The cerebral cortex of man. New York: Hafner; 1960.
Pollen DA. Fundamental requirements for primary visual perception. Cereb Cortex. 2008;18:1191-1198.
Posner MI, Raichle ME. Images of the brain. In: Posner MI, Raichle ME, editors. Images of the mind. New York: Scientific American Library; 1994:57-82.
von Economo G, Koskinas GN, Atlas of cytoarchitectonics of the adult human cerebral cortex, Karger, Basel, 2009.
Zilles K, Palomero-Gallagher N, Schleicher A. Transmitter receptors and functional anatomy of the cerebral cortex. J Anat. 2004;205:417-432.
Zou Q, Long X, Zuo X, Zuo Q, et al. Functional connectivity between the thalamus and visual cortex under eyes closed and eyes open conditions: a resting-state fMRI study. Human brain mapping. 2009;30:3066-3078.
[/level-membership-for-basic-science-category][not-level-membership-for-basic-science-category]
29 Cerebral cortex
Structure
Laminar organization
Cellular laminae of the neocortex (Figure 29.1)
Cell types
The three principal morphological cell types are pyramidal cells, spiny stellate cells, and smooth stellate cells (Figure 29.2).
Afferents
Afferents to a given region of the cortex are derived from five sources:
| •basal forebrain nuclei | acetylcholine |
| •tuberoinfundibular (hypothalamus) | histamine |
| •tegmentum (midbrain) | dopamine |
| •raphe nucleus (midbrain) | serotonin |
| •cerulean nucleus (pons) | norepinephrine |
These five sets of neurons are of particular relevance to psychiatry and are considered in Chapter 34.
Efferents
Cortical Areas
The most widely used reference map is that of Brodmann, who divided the cortex into 47 areas on the basis of cytoarchitectural differences. Most of these areas are shown in Figure 29.4. Colored in that figure are the three principal primary sensory areas (somatic, visual, auditory) and the single primary motor area, together with the respective unimodal association areas. The rest of the neocortex comprises multimodal (polymodal) association areas receiving association fibers from more than one unimodal association area (e.g. receiving tactile and visual inputs, or visual and auditory).
Investigating functional anatomy
Positron emission tomography
Image subtraction and image averaging are required for meaningful interpretation of PET studies, as explained in the caption to Figure 29.5.
Figure 29.5 Image subtraction and image averaging in PET scans.
(Adapted from Posner and Raichle, Images of Mind, Sci. Amer. Library, 1994, p. 65, with permission.)
For specialized investigations, radiolabeled drugs are used to quantify receptor function, e.g. radiolabeled dopamine in the corpus striatum in relation to Parkinson’s disease (Ch. 33); radiolabeled serotonin in brainstem and cortex in relation to depression (Ch. 26), and radiolabeled acetylcholinesterase in relation to Alzheimer disease (Ch. 34).
Functional magnetic resonance imaging
Functional magnetic resonance imaging (fMRI) (Figure 29.6) does not require introduction of any extraneous material. It depends upon the different magnetic susceptibility of oxygenated versus deoxygenated blood. As it happens, the local increases in blood flow are more than sufficient to meet oxygen demands, and it is the increase in the ratio of oxyhemoglobin to deoxyhemoglobin that is exploited to generate the MR signal.
