TOPIC 4 Central nervous system
Assessment of consciousness
Test: Glasgow Coma Scale (GCS)
How it is done
Table 4.1 Glasgow coma scale scores for the three tests, plus variables in children
| Best eye response | |
|---|---|
| Score | Description |
| 4 | Eyes open spontaneously |
| 3 | Eyes open to speech. Do not confuse with arousal of sleeping patient |
| 2 | Eyes open to pain. Try fingernail bed pressure. Supraorbital pressure will cause grimace and eye closure |
| 1 | No eye opening, ensure painful stimulus is adequate |
| Best verbal response | |
|---|---|
| Score | Description |
| 5 | Orientated in time, person and place |
| 4 | Responds to questions but is disorientated and confused |
| 3 | Inappropriate, random words |
| 2 | Incomprehensible sounds and moans but no words |
| 1 | None |
| Verbal response is adjusted in children | ||
|---|---|---|
| Score | Verbal response | Preverbal/grimace response |
| 5 | Appropriate babbles, words or phrases to usual ability | Normal facial oromotor activity |
| 4 | Inappropriate words, or spontaneous irritable cry | Less than usual ability, response only to touch |
| 3 | Cries inappropriately | Vigorous grimace to pain |
| 2 | Grunts to pain, occasional whimpers | Mild grimace to pain |
| 1 | No vocal response | No response to pain |
| Best motor response, test and record in each limb* | |
|---|---|
| Score | Description |
| 6 | Obeys commands |
| 5 | Localizes pain. Hand should cross midline or get above clavicle in attempt to remove the stimulus |
| 4 | Withdraws from pain. Pulls limb away from fingernail bed pressure. Normal flexion observed |
| 3 | Abnormal flexion, decorticate response (spastic wrist flexion) |
| 2 | Extension to pain, decerebrate response (extensor posturing) |
| 1 | No motor response. Ensure adequate painful stimulus and no spinal injury |
* Upper limb responses are more reliable as lower limb responses could be spinal reflexes.
Table 4.2 Severity of acute head injury
| GCS score | Coma |
|---|---|
| ≤8 | Severe |
| 9–12 | Moderate |
| ≤13 | Minor |
Management principles
Limitations and complications
CSF analysis
Test: Lumbar puncture
Indications
Analysis of CSF is required for the diagnosis of the following CNS conditions:
Conditions in which lumbar punctures are commonly undertaken include:
Normal values
| Measure | Normal values |
|---|---|
| Opening pressure | 7–20 cmH2O |
| Cell count | 0–5/mm3, all lymphocytes |
| Protein concentration | 0.15–0.45 g/L |
| Glucose concentration | 2.8–4.2 mmol/L |
| CSF: blood glucose ratio | 65% |
Limitations and complications
Test: CSF appearance (spectrophotometry)
How it is done
Interpretation
Further investigations
Limitations and complications
Test: CSF cell counts
How it is done
Interpretation
Abnormalities
| Characteristics | |
|---|---|
| Bacterial meningitis | Often >1000/mm3, usually PMN |
| Viral meningitis | <100/mm3, usually lymphocytes |
| Seizures | |
| Intracerebral haemorrhage | |
| Malignancy | |
| Guillain-Barré syndrome | <50 monocytes/mm3 |
| Multiple sclerosis | <50 monocytes/mm3 |
| Other inflammatory conditions |
Test: CSF glucose (Table 4.5)
Interpretation
Normal range
| Low CSF glucose | High CSF glucose |
|---|---|
| CNS infections | Hyperglycaemia |
| Chemical meningitis | |
| Subarachnoid haemorrhage | |
| Hypoglycaemia |
Test: CSF microbiology
How it is done
Test: CSF opening pressure
How it is done
Interpretation
Normal data (Table 4.6)
| Age (years) | Pressure (cmH2O) |
|---|---|
| <8 | 1–10 |
| >8 | 6–20 |
| Obese adult | <25 |
Abnormalities
| High pressure (>25 cmH2O) | Low pressure (<6 cmH2O) |
|---|---|
| Intracranial haemorrhage | CSF leak |
| Space-occupying lesions | Previous lumbar puncture |
| Meningitis | Severe dehydration |
| Cerebral oedema | Inadequate production |
| Congestive cardiac failure | Shunt |
| High venous pressure | Obstructive hydrocephalus Excess absorption |
| Idiopathic/benign intracranial hypertension | Drugs: acetazolamide, diuretics |
Test: CSF protein
Interpretation
Abnormalities (Table 4.8)
| Elevated CSF protein | Low CSF protein |
|---|---|
| Infections | Repeated LP |
| Intracranial haemorrhage | Chronic CSF leak |
| Multiple sclerosis | Children 6 months to 2 years |
| Guillain-Barré syndrome | Acute water intoxication |
| Malignancy | |
| Endocrine abnormalities | |
| Drugs |
Electroencephalogram derivatives
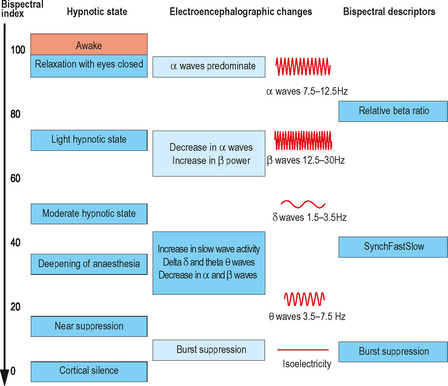
The electroencephalogram (EEG) is produced from the electrical activity in the superficial cerebral cortex. Scalp electrodes are used, the exact location of which has been determined by an international system. Each electrode can detect activity within 2.5 cm. The resulting signal is amplified, filtered and then displayed visually on a plot of amplitude versus time. Computerized Fourier analysis can be undertaken to show amplitude at each frequency, power versus frequency or a compressed spectral array.
Test: Bispectral index (BIS)
How it is done
Interpretation
Management principles
Limitations and complications
Drugs
Clinical conditions
Other limitations
Evoked potentials
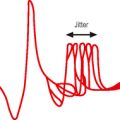
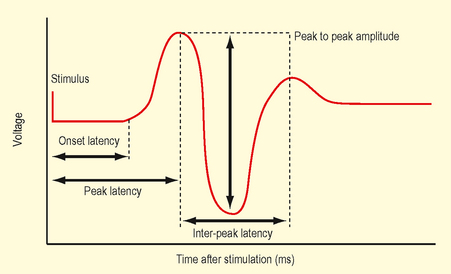
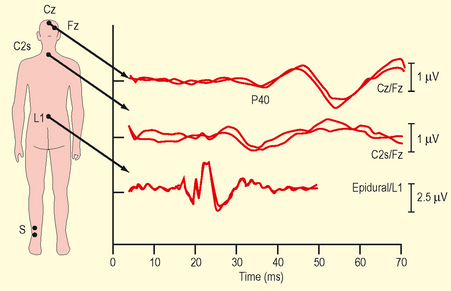
Evoked potentials (EP) measure action potentials that occur in response to a specific stimulus. The recorded potentials test a specific neural tract, sensory or motor, peripheral or central. Evoked potentials are smaller than EEG and require computer averaging to resolve them from background signals (EEG and ECG). The EP waveform (Fig. 4.2) is a plot of voltage versus time. It is described in terms of amplitude, latency and morphology.
Guidelines and standards are available from The International Federation of Clinical Neurophysiology at http://www.ifcn.info/ and The American Clinical Neurophysiology Society at http://www.acns.org/.
Test: Somatosensory evoked potentials (SSEPs)
Indications
How it is done
Interpretation
Physiological principles
Abnormalities
Management principles
Test: Motor evoked potentials (MEPs)
How it is done
Management principles
Test: Auditory evoked potentials (AEPs)
Indications
How it is done
Interpretation
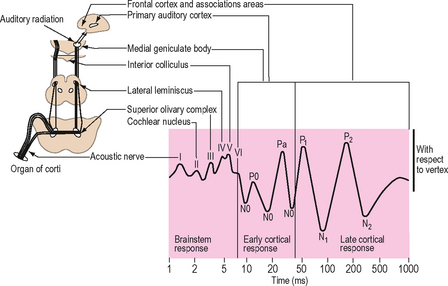
Fig. 4.4 Auditory evoked potential normal range/graph.
(Reproduced with permission from Thornton C, Sharpe RM (1998) Evoked responses in anaesthesia 4. Br J Anaesth 81:771–81, and Kumar A, Bhattacharya A, Makhija N (2000) Evoked potential monitoring in anaesthesia and analgesia. Anaesthesia 55:225–41.)
Physiological principles
The waveform allows anatomical location of a dysfunction along the auditory pathway
Imaging
Test: Computerized tomography (CT) brain
Head injury
NICE guidelines for head injury (http://www.nice.org.uk) were published in 2003 and updated in 2007. The presence of any of the following risk factors requires CT brain imaging following head injury:
For children under two, it is recommended by NICE (2007) that the best evidence currently available is the ‘CHALICE’ rule (see http://www.nice.org.uk for more details).
How it is done
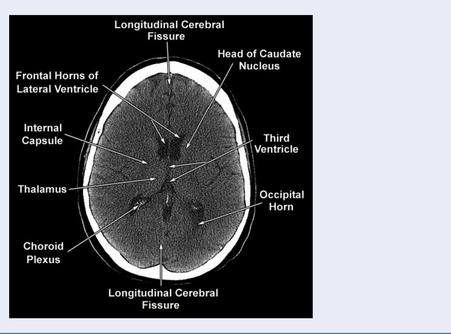
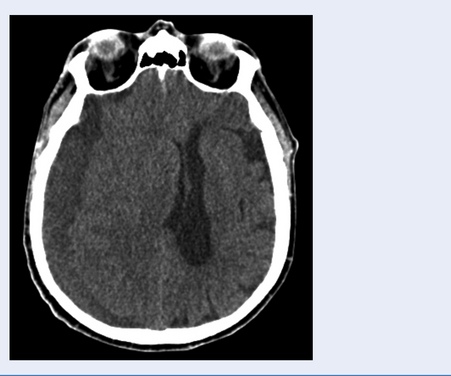
Interpretation
Please see Fig. 4.5 for a normal CT scan.
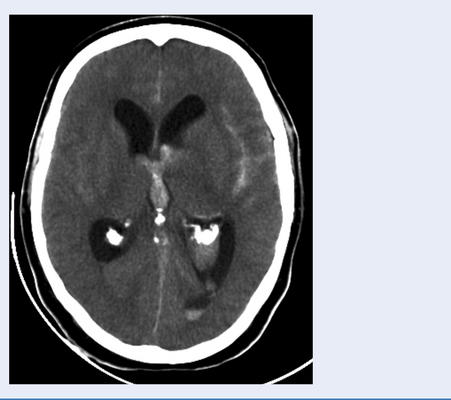
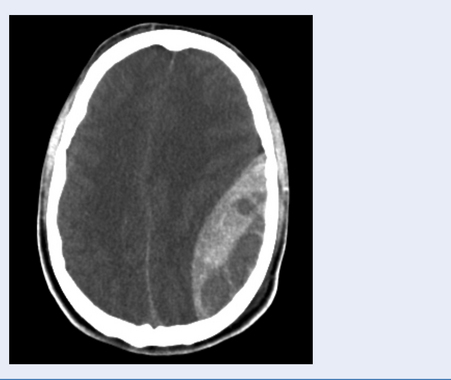
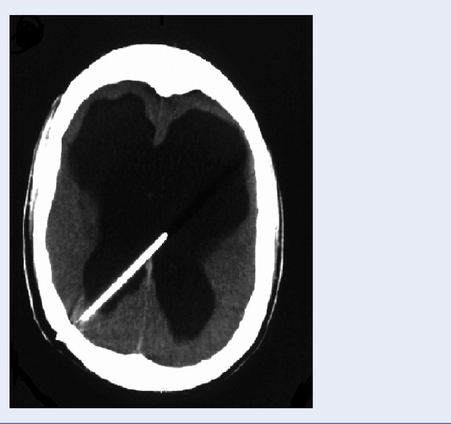
Abnormalities
Cervical spine in trauma
Indications
Multiple guidelines exist to suggest which patients require investigations.
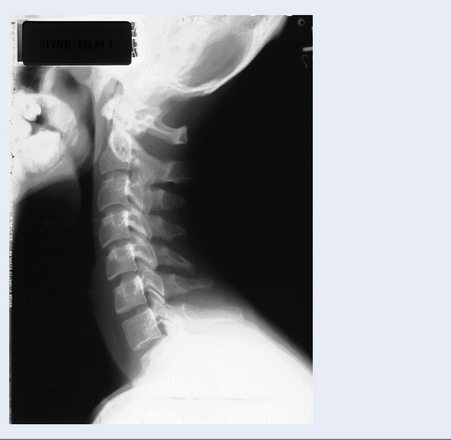
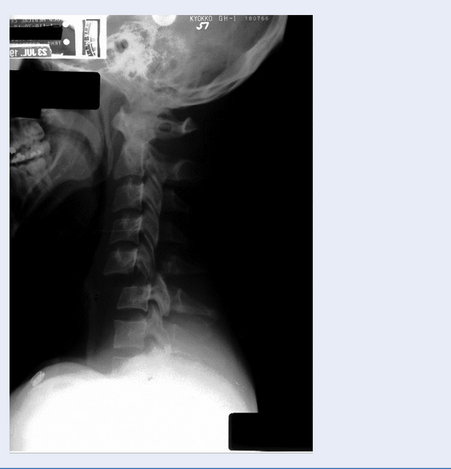
Test: Plain cervical radiographs (Fig. 4.10)
The three standard cervical trauma views are the investigation of choice according to NICE guidelines (see http://www.nice.org.uk). They consist of lateral, AP and open mouth views. The sensitivity of this series ranges from 70% to 90%. In practice this is reduced as films are inadequate in up to 50% of patients. Expert interpretation is essential.
Test: Cervical CT scan
Alternatively CT can be used as a supplement to plain films for:
Limitations
Test: Cervical MRI
Limitations
Further management principles
Intracranial pressure (ICP) monitoring
Indications
An ICP monitor is used in traumatic brain injury when the following apply:
Further indications for ICP monitoring are listed in Table 4.9.
| Condition | Comments |
|---|---|
| Subarachnoid haemorrhage | With associated hydrocephalus to allow CSF drainage |
| Brain tumours | Selected patients at high risk of post op cerebral oedema, e.g. posterior fossa craniotomy |
| Reye’s syndrome | Active treatment decreases mortality |
| Hydrocephalus | Diagnostic tool in complex cases |
| Benign intracranial hypertension | Monitoring via lumbar drain as diagnostic test and treatment response |
| Hypoxic brain swelling | Post drowning, CO poisoning |
| Others | Meningitis, venous sinus thrombosis, hepatic encephalopathy, stroke and craniostenosis |
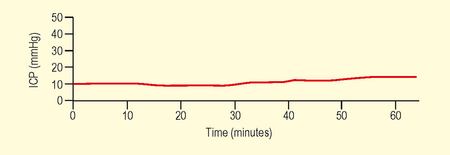
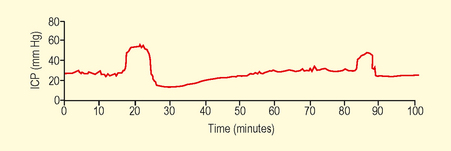
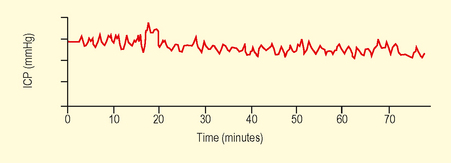
Interpretation
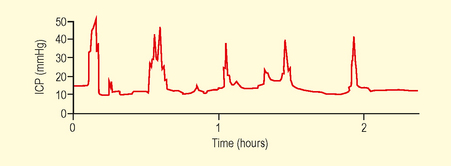
Waveform analysis over 30 minutes should be the minimum as instant CSF measurements may be misleading. Normal range varies with age, posture and clinical conditions. Values in children are not well established (Table 4.10).
| Age group | Normal range (mmHg) |
|---|---|
| Adults | <10–15 |
| Children | 3–7 |
| Term infants | 1.5–6 |
Physiological principles
The Munro Kelly hypothesis states that within the rigid skull the contents are not compressible. Initially intracranial compliance allows compensation for small increases in volume (Fig. 4.11). Once this is exhausted then small increases in volume will cause steep exponential increases in ICP.
Abnormalities
Management principles
Malignant hyperthermia susceptibility
Indications for testing
How it is done
Management principles
Further investigations
Genetic testing
On confirmation of a positive index case, then referral of family members for genetic analysis is appropriate. Mutations of the ryanodine receptor type 1 (RYR1) gene have been discovered in up to 80% of cases. The gene is large, confers autosomal dominant inheritance and is located on chromosome 19 q. Identification of all mutations is difficult due to the considerable locus and allelic heterogeneity.