Chapter 74 Cellular Respiration
In 1920, Haldane was credited with the observation that hypoxemia not only stops the [respiration] machine, but wrecks the [respiration] machinery as well. Indeed, the priorities of pediatric advanced life support are to avoid shock and respiratory failure, and the focus of cardiopulmonary resuscitation is restoration of airway, breathing, and circulation, all targeted to maintain or reestablish oxygen delivery to tissues and cells. During critical illness, marginal oxygen delivery and/or oxygen consumption frequently manifest as the rate-limiting step for efficient energy production in the form of adenosine triphosphate (ATP). Inadequate ATP impairs the translation of cellular structure to cellular function, a defining characteristic of life.1 A working knowledge of cellular respiration basically summarizes the key tenets of critical care medicine. This chapter reviews the metabolism of respiration, summarizes various modalities for monitoring respiration, and provides clinical correlation of alterations in respiration that are addressed by intensive care.
Metabolism of Respiration
Oxygen Chemistry
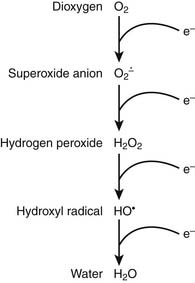
It is appropriate to initiate a discussion of respiration by describing the relevant characteristics of the rate-limiting substrate, namely molecular oxygen, that serves as the terminal electron acceptor in cellular respiration.1 Because of the paramount role of oxygen in facilitating efficient production of ATP, oxygen has played a central role in terms of evolution of complex multicellular life.2 In the biosphere, the concentration of oxygen is carefully regulated by the processes of photosynthesis and respiration, the former producing—and the latter consuming—atmospheric dioxygen. Premolecular oxygen appeared on Earth’s surface approximately 2 billion years ago and now represents the most abundant element on Earth’s crust. At its baseline triplet state, oxygen is a diradical with two unpaired electrons with parallel spin occupying the outer orbital. In its role as the ultimate electron accepter in cellular respiration, molecular oxygen undergoes a four-electron reduction to water. With the benefit of multiple redox electron exchanges, this process permits controlled release of energy from carbohydrate, fat, and protein energy substrates. Successive one-electron additions to molecular oxygen result in the production of superoxide anion, hydrogen peroxide, hydroxyl radical, and water, respectively (Figure 74-1). These partially reduced oxygen compounds are referred to as reactive oxygen species and identify the so-called antagonistic pleiotropy characteristic of oxygen.3
Oxygen toxicity was first predicted by both Priestly and Lavoisier in 1729. It has been estimated that approximately 2 billion molecules of superoxide anion and hydrogen peroxide are produced per cell per day. An antioxidant repertoire that includes superoxide dismutase, catalase, glutathione peroxidase, uric acid, vitamin C, and vitamin E counteracts this oxidant stress to minimize a tendency toward “rust and rancidity.” However, oxidant stress plays an important role in generalized aging as well as inflammation and ischemia-reperfusion pathophysiology. As Fridovich8 has noted, “the aerobic lifestyle offers great advantages but is fraught with danger.”
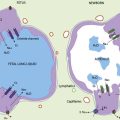
Nitrogen chemistry is also involved in the generation of reactive molecular species. Nitric oxide (NO) is known to be generated from at least four NO synthase isoenzymes, including constitutive, inducible, neuronal, and mitochondrial forms. Figure 74-2 depicts the reaction catalyzed by nitric oxide synthase.9
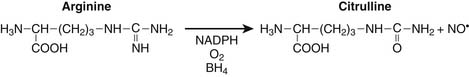
Production of NO is particularly prominent during periods of inflammation. At least in septic patients, intensity of inducible NO production as measured by blood or urine end catabolic products nitrate and nitrite, is directly associated with various measures of illness severity reflecting multiple organ dysfunction syndrome and death. Particularly in the setting of tissue hypoxia, NO is believed to play a role in regulation of mitochondrial respiration through nitrosyl complexes with various iron-sulfur center enzymes as well as direct competition with oxygen for binding at the heme active site of cytochrome oxidase.10,11 Competitive inhibition of NO with oxygen at cytochrome oxidase results in decreased oxygen consumption, decreased binding affinity for oxygen, and reduced ATP production.
Under specific conditions superoxide anion and NO can condense to form the powerful oxidant peroxynitrite with diffusion-limited kinetics: 7 × 10⁹ M−1 × sec−1.12 Behavior of NO, superoxide anion, and peroxynitrite in clinical biochemistry has been characterized as “the good, the bad, and the ugly.”13 For example, nitrotyrosine and dityrosine represent tissue markers of peroxynitrite histopathology.14 Peroxynitrite has been demonstrated to be involved in lipid peroxidation of cell and organelle membranes, damage to various elements of the mitochondrial electron transport chain and ATP synthase, inhibition of glyceraldehyde 3-phosphate dehydrogenase, injury of the sodium-potassium ATPase pump, disruption of plasmalemma sodium channels, production of DNA strand breaks, and activation of the poly-adenosine ribosyl phosphate system.15 Again in reference to cellular respiration, peroxynitrite can mediate irreversible inhibition of the Krebs cycle enzyme aconitase; mitochondrial complexes 1, 2 and 3; cytochrome oxidase; ATP synthase; and creatine kinase as well as increase wasteful proton leakage. Reduced suflhydryls represent another important target of peroxynitrite oxidation, resulting in alteration of protein structure and function.16 Peroxynitrite is known to directly alter pulmonary surfactant and injure human myocardial protein.14,17
Reactive oxygen and nitrogen species are also known to affect intracellular signaling through a number of redox-sensitive transcription factors, notably nuclear factor-κB (NFκB) and activator protein-1 (AP-1).18 For example, as an aspect of the pathophysiology of gram-negative sepsis, interaction of endotoxin, toll-like receptor-4, and NADPH oxidase result in an increased flux of reactive oxygen species and subsequent activation of NFκB associated with transcription activation of a host of proinflammatory mediators.19 In addition, peroxynitrite is known to modulate cell signaling by both phosphorylation as well as oxidation of critical protein tyrosine residues along the mitogen-activated protein kinase pathways.20
Mitochondria
It has been estimated that more than 1 billion years ago some aerobic bacteria invaded and subsequently colonized some form of primordial eukaryotic cells that themselves lacked the ability to use oxygen. At some point a symbiotic relationship developed between the cell and the aerobic bacteria, and this relationship has remained steadfast through evolution.21,22 Evidence for the persistence of this endosymbiotic relationship suggesting that mitochondria have retained many aspects of their bacterial origins includes the observations that mitochondria only arise from other mitochondria; that mitochondria maintain their own genome; that the mitochondrial chromosome is bacteria-like, circular in structure, and without associate histones; that mitochondria synthesize their own proteins; and that these mitochondrial proteins, like bacterial proteins, exhibit N-formyl methionine; and that antibiotics that inhibit protein synthesis in bacteria are also toxic to mitochondria.23
Mitochondria are responsible for the generation of more than 95% of ATP synthesized to support aerobic respiration (Figure 74-3). Enormous oxygen consumption by “power plant” mitochondria represents a double-edged sword, on the one hand permitting efficient production of ATP, but on the other hand a potential source of high quantities of reactive oxygen species. Assuming 388 L of oxygen consumed per day by a normal adult, this would require 2 × 10¹⁹ molecules of cytochrome oxidase. Considering this requirement as well as that of other members of the mitochondrial electron transport chain outlined below, the surface area of mitochondrial cristae inner membrane to scaffold this quantity of respiration elements24 is approximately 14,000 m2.
In addition to their role in facilitating aerobic respiration, mitochondria are also involved in intracellular signaling, intracellular calcium regulation,25 cellular differentiation and growth, and cellular death pathways.26,27 With respect to the latter function, the mitochondria provide close monitoring for a number of cellular “danger signals.” These include loss of transmembrane potential, decreased ATP production, increased influx of reactive oxygen and reactive nitrogen species, leakage of mitochondrial proteins into the cytoplasm via mitochondrial permeability transition pores, activation of hypoxia-responsive genes, and recognition by the cell of mitochondrial proteins with signature N-formyl methionine.23 Mitochondria in cells may undergo cycles of both fusion and fission.28 If the mitochondria “senses” overwhelming cell damage as manifested by excessive reactive oxygen species, DNA damage, denatured protein, ongoing inflammation, hypoxia, or even deprivation of growth factors, the mitochondrial pathway of cellular apoptosis may be initiated.29,30 If apoptosis is initiated by excessive reactive oxygen species, activation of the sphingomyelin/ceramide cycle precedes apoptosis.
Critical mitochondrial damage results in increased mitochondrial permeability, the mitochondrial permeability transition that results in release of proapoptotic proteins, including cytochrome c from the mitochondria into the cytoplasm. This results in activation of various caspase cascades and resultant DNAase activation and DNA dissolution.31 Activation of the apoptotic pathway orchestrating cell death is also governed by the relative concentrations of proteins BCL-2 and BCL-X. Integrity of the mitochondrial transport chain complexes defines a fine line between maintaining mitochondrial homeostasis and efficient respiration versus excessive oxygen free radical production, mitochondrial dysfunction, and mitoptosis. This balance is maintained through multiple feedback signals related to mitochondrial proton and calcium concentrations, reactive oxygen species, overall mitochondrial redox state, mitochondrial membrane potential, and mitochondrial matrix pH, all of which affect the cascade of electron transfer along the mitochondrial transport chain.23 It has been demonstrated that pathologic metabolic downregulation of cytochrome oxidase, such as in the setting of excessive mitochondrial production of reactive nitrogen and oxygen species, manifests as multiple organ dysfunction syndrome.32
Alterations in mitochondrial function in the setting of shock have been extensively scrutinized.33–35 In addition to decreased activity of specific mitochondrial enzymes previously indicated, altered translocase activity and mitochondrial calcium transport are also coincident with actual changes in mitochondrial morphology. In sepsis, increased NO production has been associated with activation of the poly-adenosine ribosyl phosphorylase (PARP) pathway, the former associated with impaired binding of oxygen to cytochrome oxidase and the latter associated with cellular depletion of NADH.36 In various models of multiple organ dysfunction syndrome and sepsis, mitochondrial permeability transition has been shown to result in collapse of the mitochondrial electrochemical gradient and impairment of ATP synthesis coincident with calcium influx into the mitochondria. Sepsis inflammation can induce a vicious cycle of oxidative mitochondrial damage leading to an increased flux of reactive oxygen species that further damage mitochondrial respiration components, resulting in mitochondrial glutathione depletion, enhanced mitochondrial membrane lipid peroxidation and decreased copy number, increased deletions, and decreased messenger RNA transcripts from mitochondrial DNA (Figure 74-4).37
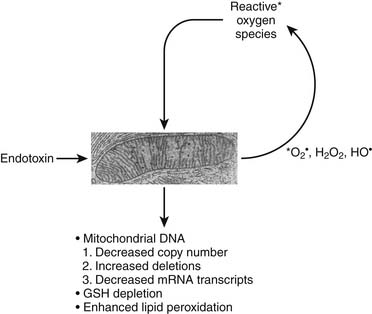
Figure 74–4 Vicious cycle mitochondrial injury in the setting of excessive reactive nitrogen/oxygen species.
The independent mitochondrial genome; located within the mitochondrial matrix, is comprised of double-stranded, circular DNA of 16.6 kb and codes for 37 genes, including proteins involved in various redox reactions, oxidative phosphorylation, ATP synthesis, and enzymes comprising the Krebs cycle, fatty acid beta-oxidation, and pyruvate oxidation.38 Mitochondrial DNA mutations associated with the gene coding for cytochrome oxidase have been clinically linked to Leigh syndrome; mitochondrial myopathy, encephalopathy, lactic acidosis, and stroke (MELAS); encephalomyopathy; lactic acidosis; and mitochondrial proliferation in muscle biopsies, the so-called characteristic histopathology of ragged red fibers.21
Adenosine Triphosphate
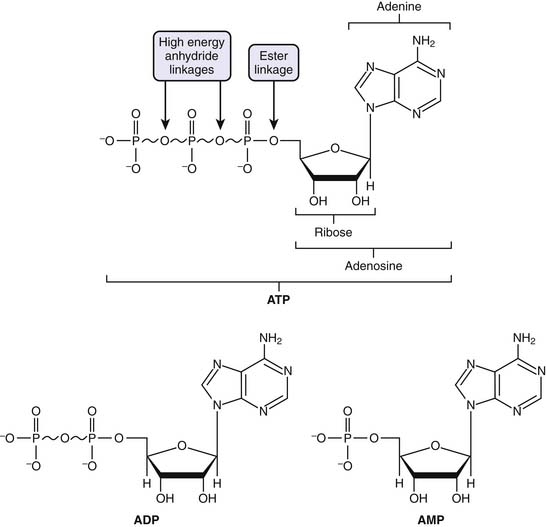
ATP is considered the molecular unit of intracellular energy currency. ATP derives its inherent energy secondary to anhydride bonds connecting adjacent phosphate functional groups. Hydrolysis of ATP energy generates energy for all cellular processes. In addition ATP also serves as a cofactor for signal transduction reactions using a variety of kinases as well as adenyl cyclase. Normally cellular ATP concentration is maintained in the range of 1 to 10 mmol/L, with a normal ratio of ATP/ADP of approximately 1000. Totally quantity of ATP in an adult is approximately 0.10 mol/L. Approximately 100 to 150 mol/L of ATP are required daily, which means that each ATP molecule is recycled some 1000 to 1500 times per day. Basically, the human body turns over its weight in ATP daily.39 Transmembrane proton flux through the mitochondrial ATPase synthase complex occurs at an estimated rate of 3 × 10²¹ protons per second. This corresponds to ATP reformed at a rate of 9 × 10²⁰ molecules/sec, or approximately 65 kg ATP recycled per day in a normal resting adult (Figure 74-5).24
Respiration, Metabolic Pathways
Glycolysis
Acetate coupled to coenzyme A (AcCoA) is derived from carbohydrates, lipids, and proteins. Glucose is transported into cells via glucose transporter (GLUT) receptors and osmotic gradients (see Chapter 77). Ten enzymatic reactions within the cell cytoplasm define the metabolic pathway, termed glycolysis. These initial series of reactions ultimately generate two net molecules of ATP, two molecules of NADH, and two molecules of pyruvate.
The fates of pyruvate is multiple. Under anaerobic conditions, pyruvate may be reduced by NADH to lactate to regenerate NAD+. Alternatively, pyruvate is shuttled to the mitochondria, where it is further metabolized to carbon dioxide (CO2) and AcCoA. Pyruvate transamination yields alanine, whereas pyruvate carboxylase generates oxylacetate (Figure 74-6).
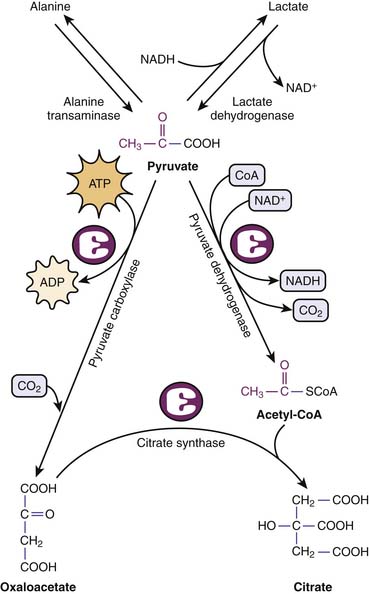
Figure 74–6 Metabolic fates of pyruvate, end product of glycolysis.
(Modified from Baynes JW, Dominiczak MH: Medical biochemistry, New York, 2009, Mosby Elsevier.)
Catabolism of fatty acids by β-oxidation generates one molecule of AcCoA and one molecule each of FADH2 and NADH for each two-carbon fatty acid fragment cycle. These reactions occur in the mitochondria after fatty acid transport by a carnitine transport system. It should be appreciated that generation of AcCoA by fatty acid β-oxidation occurs independent of pyruvate dehydrogenase that can be rate limiting for complete glucose metabolism. Particularly as an aspect of the metabolic stress response mediated by cortisol, catecholamines, and interleukins 6 and 2, protein degradation can occur with release of amino acids. All amino acids may be catabolized to either AcCoA or some Krebs cycle intermediate. Accordingly, amino acids can be mobilized for energy production as well as de novo protein synthesis. Alternatively, amino acids can undergo gluconeogenesis, a costly process that basically requires four ATP molecules plus two GTP molecules and two NADH molecules to regenerate one molecule of glucose from two molecules of pyruvate (see Chapter 77). ATP and GTP for these series of reactions are provided by β-oxidation of fatty acids.
Krebs Cycle
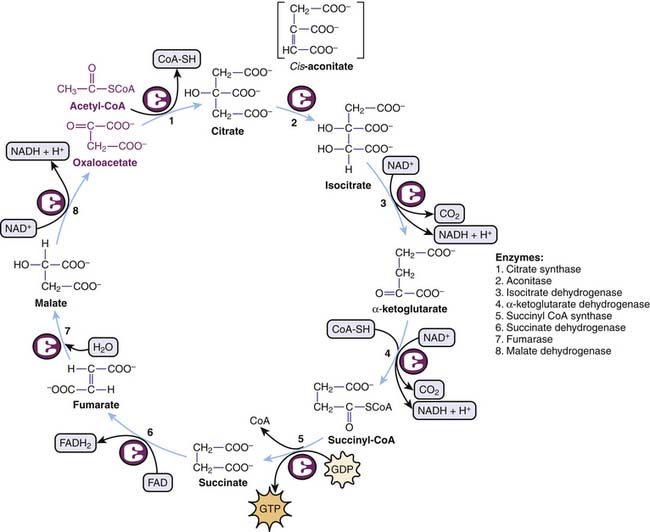
The Krebs cycle summarizes a circular series of reactions in the mitochondria to metabolize AcCoA to two molecules of CO2 with resultant generation of one molecule of GTP, three molecules of NADH, and one molecule of FADH2. GTP is equivalent to ATP in terms of energy charge. Although oxygen itself is not part of the Krebs cycle, its presence at the end of the mitochondrial electron transport chains ensures recycling of NAD+ and FAD required in the Krebs cycle (Figure 74-7).
Electron Transport Chain
Electrons derived from reducing equivalents NADH and FADH2 are shuttled along the mitochondrial electron transport chain, ultimately reducing molecular oxygen to water. Basically, for each pair of electrons involved in one hydride equivalent, three molecules of ATP are produced. Five complexes of proteins and cytochromes comprise the mitochondrial electron transport chain and facilitate a step-down flow of FADH2 and NADH reduction potential along the inner membrane of the mitochondria. These redox reaction complexes include NADH dehydrogenase–ubiquinone oxidoreductase (complex 1), succinate dehydrogenase–ubiquinone oxidoreductase (complex 2), ubiquinone–cytochrome C oxidoreductase (complex 3), cytochrome c oxidase (complex 4), and ATP synthase (complex 5). Electrons in the form of hydride ions from NADH and FADH2 cascade along these protein/cytochrome complexes toward molecular oxygen. Protons generated during these reactions are pumped across the inner mitochondrial membrane matrix into the intermembrane space, generating a proton motive force. The proton electrochemical gradient across the inner mitochondrial membrane drives ATP synthesis by a reaction that has been termed chemiosmosis.41 Energy for ATP synthesis arises from an influx of these protons back into the matrix, literally through the rotary motor of ATP synthase.42
The proton pore involves the c-ring and the a-protein. The rotary component is the coiled-coil γ-subunit, which is bound to the ε-subunit and to the c-ring. The stationary component is the hexameric α3β3 unit and is fixed by the δ, b, and a proteins (Figure 74-8).
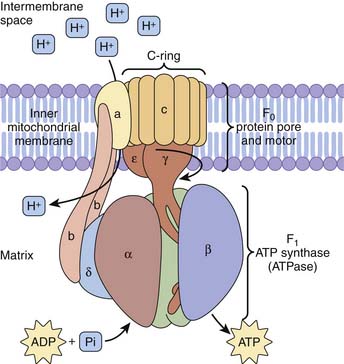
Figure 74–8 ATP synthase complex consists of a motor (proton gradient pore, F0) and generator (ATP synthase, F1).
(Modified from Baynes JW, Dominiczak MH: Medical biochemistry, New York, 2009, Mosby Elsevier.)
Monitoring of Tissue Oxygenation
Blood Lactate Monitoring in Critically Ill Patients
In general, lactic acidosis occurs when there is an imbalance between production and clearance of lactate. Measurement of lactate in human blood was first described in 1843 in a lethal case of fulminant septic shock due to puerperal fever in a young woman.43 Blood lactate monitoring is frequently performed in critically ill patients, usually with the aim of detecting tissue hypoxia44 with resultant anaerobic hyperlactatemia, traditionally termed type A lactic acidosis. However, other processes not related to tissue hypoxia can also result in increased blood lactate levels,45 such as aerobic hyperlactatemia or type B lactic acidosis that complicates clinical interpretation and therapy in cases of elevated lactate concentration. Although lactic acidosis is often associated with a high anion gap and is generally defined as a lactate level greater than 5 mmol/L and a serum pH less than 7.35, the presence of hypoalbuminemia may mask the anion gap and concomitant alkalosis may raise the pH. As originally reported by Huckabee,45a normal arterial blood lactate is approximately 0.620 mmol/L and venous lactate is slightly higher at 0.997 mmol/L.
Anaerobic Hyperlactatemia
During anaerobic conditions, pyruvate derived from the conversion of glucose cannot enter the Krebs cycle via AcCoA to produce energy. Instead, pyruvate is converted into lactate, known as the Pasteur effect. The normal lactate/pyruvate ratio is approximately 20:1, and it rises under hypoxic conditions. The causal relationship between anaerobic hyperlactatemia and tissue hypoxemia has been confirmed by experimental46,47 and clinical44 studies; decreasing systemic oxygen delivery (DO2) until oxygen demand can no longer be met and limiting oxygen consumption by DO2 coincides with a sharp increase in lactate levels. Accordingly, in the early phase of septic shock hyperlactatemia is accompanied by oxygen supply dependency.48 In severe sepsis or septic shock prior to resuscitation, hyperlactatemia coincides with a low central venous oxygen saturation49 and increased lactate/pyruvate ratios,50 whereas increases in DO2 are associated with reductions in lactate.49 No critical level of DO2 or SvO2 could be associated with hyperlactatemia. This could represent regional differences in DO2 and demand.51 However, improving capillary perfusion was shown to correlate with a reduction in lactate levels in patients with septic shock, independent of changes in systemic hemodynamic variables.52 The latter observation illustrates the hypothesis that, in the absence of low systemic DO2 relative to systemic metabolic demand, microcirculatory processes hampering oxygen use at the tissue level may raise lactate levels.
Aerobic Hyperlactatemia
Various studies demonstrate that mechanisms other than tissue hypoxia can account for hyperlactatemia, including (1) mitochondrial dysfunction35,53,54; (2) decreased lactate clearance in liver dysfunction,55,56 status post liver surgery57 and cardiac surgery,58 as well as in sepsis,59,60 where it was shown to predict poor outcome61; (3) increased aerobic glycolysis resulting in amounts of pyruvate exceeding the pyruvate dehydrogenase capacity that can be triggered by cytokine-mediated uptake of glucose62,63 or catecholamine-stimulated increased Na-K pump activity45,64–67; (4) impaired activity of pyruvate dehydrogenase, essential for the conversion of pyruvate into AcCoA, that can be inhibited in sepsis,68,69 as well as in thiamin deficiency (beriberi)70; (5) alkalosis71 by increasing cellular lactate efflux due to an H+-linked lactate carrier mechanism across the cell membrane; (6) acute lung disease55,72; (7) several drugs and intoxications such as epinephrine (by increased glycogenolysis, glycolysis, and stimulation of the Na-K pump),73,74 metformin (particularly in the presence of renal insufficiency), and nucleosidic reverse transcriptase inhibitors for the treatment of HIV (by inducing mitochondrial cytopathy)75–77; and (8) intoxications with methanol, cyanide (by inhibition of oxidative phosphorylation),78 or ethylene glycol (by artifactual reaction of lactate electrodes).79
In summary, during critical illness, the source of lactate is often assumed to be ischemic tissues that use anaerobic metabolism. This is superficially supported by lactate as an adverse prognostic marker.80,81 However, lactate metabolism in critical illness is complex and often does not indicate ischemic tissues.82,83 A common clinical scenario occurs during volume resuscitation of patients (iatrogenic hyperchloremia) or epinephrine infusions, in which a chloride load and type B lactic acidosis are interpreted by the body as “shock,” requiring more fluid and more vasoactive-inotropic support. This scenario may initiate a vicious cycle and potential over-resuscitation.84 It is essential to diagnose this syndrome correctly and adjust management accordingly.
Given the available evidence, patients presenting with hypotension and an elevated lactate level (>5 mmol/L) have a grave prognosis with a high mortality rate (>80%). Likewise, patients who are critically ill and do not clear lactate by 48 hours have a similarly high mortality rate.85 There are no data currently available, however, to suggest that monitoring lactate levels beyond this time frame is prognostically useful. Early goal-directed therapy in severe sepsis is an example of outcome benefit that arguably targets the patient’s primary pathophysiology rather than lactic acidosis per se.49,86 Hence, there are no current data demonstrating that therapeutic maneuvers specifically targeted at decreasing lactate levels are beneficial. The treatment of the patient with lactic acidosis should therefore be aimed at the underlying disease and the maintenance of organ perfusion and not the lactate concentration itself. Accordingly, the routine daily measurement of serum lactate levels in critically ill patients remains controversial.
Continuous Central Venous Oxygen Saturation Monitoring
Monitoring of the mixed venous oxygen saturation (SvO2) is used as a surrogate for quantifying the balance between systemic oxygen delivery and consumption during the treatment of critically ill patients.87 Measurement of SvO2 requires placement of a pulmonary artery catheter with a risk/benefit ratio that is still a matter of controversy in adult patients88–90 and rarely performed in pediatric patients. However, measuring central venous oxygen saturation (ScvO2) only requires a central venous catheter, routinely inserted in critically ill patients, and a fiber optic catheter with a spectrophotometer for continuous ScvO2 assessment. ScvO2 largely reflects the degree of oxygen extraction from the brain and the upper part of the body since the catheter tip usually is located in the superior vena cava. At baseline, ScvO2 is about 2% to 3% less than SvO2 because, overall, the lower body extracts less oxygen than the upper body, resulting in a higher inferior vena cava oxygen saturation. Readings may be taken intermittently by blood sampling and co-oximetry or continuously with a fiberoptic catheter. However, beneficial effects on patient outcome to date49 have only been demonstrated with continuous measurement of ScvO2.
Low values of SvO2 or ScvO2 indicate a mismatch between oxygen delivery and tissue oxygen need.91 Monitoring ScvO2 has been successfully used as a hemodynamic goal in the management of early sepsis. Rivers et al.49 demonstrated in a prospective randomized study in adult patients with severe sepsis and septic shock that, in addition to maintaining central venous pressure in the range of 8 to 12 mm Hg, mean arterial pressure above 65 mm Hg, and urine output higher than 0.5 mL/kg/hr, maintenance of an ScvO2 above 70% resulted in an absolute reduction of mortality by 15%. Thus the guidelines of the Surviving Sepsis Campaign92 stated that the use of SvO2 and ScvO2 is equivalent in the management of adult patients with severe sepsis and septic shock. In pediatric patients with septic shock, directing treatment to the end point of ScvO2 at 70% or greater was also associated with a significant decrease in the 28-day mortality rate from 39.2% to 11.8%.93 ScvO2 goal-directed therapy resulted in more crystalloid, blood product, and inotropic support during the first 6 hours compared with the control group receiving standard resuscitation.
Continuous monitoring of SvO2 is interesting, but clear indications for this technique in children as well as ScvO2 target values remain to be determined. It has been shown that exact numeric values of SvO2 and ScvO2 saturations are not equivalent in various hemodynamic conditions.94 Some authors have therefore argued that ScvO2 cannot be used as surrogate for SvO2 under conditions of circulatory shock.95 However, for clinical purposes, the trends between these values were found to be reliable and clinically valuable.96 Based on the evidence available, the primary indication for the use of central venous oximetry is as part of the early resuscitation in severe septic and septic shock patients. Further research is needed to elucidate the efficacy of venous oximetry in other patient groups as well as to assess whether an intermittent measurement using central venous blood gas analysis is as effective as continuous measurement of ScvO2 using fiberoptic catheters.
Functional Magnetic Resonance Imaging
Functional magnetic resonance imaging (fMRI) is a noninvasive technique for measuring brain activity. It works by detecting the changes in blood oxygenation and flow that occur in response to neural activity. When a brain area is more active, it consumes more oxygen; to meet this increased demand, blood flow increases to the active area.97,98 Hemoglobin is diamagnetic when oxygenated but paramagnetic when deoxygenated. This difference in magnetic properties leads to small differences in the MR signal of blood depending on the degree of oxygenation. Since blood oxygenation varies according to the levels of neural activity, these differences can be used to detect brain activity. This form of MRI is known as blood oxygenation level–dependent (BOLD) imaging, which is the most widely used method of fMRI with T2∗-weighted imaging revealing changes in vascular oxygenation. A limitation is that the technique is also sensitive to changes in hemoglobin concentration that may result from alterations in vascular volume and flow as well as interconversion of oxyhemoglobin and deoxyhemoglobin. Therefore this technique provides qualitative assessment of changes in oxygenation rather than quantitative measurements. Thought to primarily reflect changes in blood flow, BOLD is widely used for functional brain mapping.99–101 BOLD is starting to be applied to tumor studies.102–104 BOLD is particularly responsive to oxygen manipulation accompanying hyperoxic gas breathing as a simple way to ameliorate hypoxia.105,106 This technique may also allow direct estimates of PO2, such as in the superior mesenteric vein or heart of children. A recent study in pediatric patients with complex congenital heart disease showed a strong correlation between oxygen saturations measured in the cardiac catheterization lab and saturations obtained noninvasively by BOLD MRI.107 However, fMRI remains difficult to perform in critically ill unstable patients; consequently, few teams have acquired the equipment and experience necessary to apply this technique.108
Magnetic Resonance Spectroscopy
MRI provides anatomic images and morphometric characterization of disease, whereas magnetic resonance spectroscopy (MRS) provides noninvasive metabolite/biochemical information about tissues in vivo. MRS has been used clinically for more than 2 decades. The major applications of this advanced tool include investigation of neurologic and neurosurgical disorders, including blood vessel distribution and architecture, blood flow velocity, regional perfusion and blood volume, blood and tissue oxygenation, lactate production and intracellular pH, Krebs cycle activity, and mitochondrial oxidative phosphorylation.109 Phosphorus-31 MRS detects compounds involved in energy metabolism such as creatine phosphate, ATP and inorganic phosphate, and certain compounds related to membrane synthesis and degradation. Proton MRS is most commonly used. Four main markers related to O2 metabolism are studied: the peak of N-acetyl-aspartate (NAA), an amino acid present in neurons that reflects the status of neuronal tissue; creatine, found in glia and neurons, that serves as a point of reference because its level is believed to be stable; choline, a constitutive component of cell membranes that reflects glial proliferation or membrane breakdown110; and lactate, a marker of anaerobic metabolism and therefore of ischemia.111 Elevated lactate and decreased NAA are associated with worse neurologic outcome in neonates with asphyxial injury.112,113 Increased lactate may persist up to 1 week after asphyxial injury.114 Compared with positron emission tomography (PET), which is frequently used to evaluate tumor hypoxia but requires injections of radioactive isotopes, multiple acquisitions, and, therefore, extended imaging times, fMRI and MRS have a number of advantages. Both MRI and MRS are currently used primarily for outcome prediction and not minute-to-minute patient management.
Near-Infrared Spectroscopy
Near-infrared spectroscopy (NIRS) enables continuous, noninvasive bed-side monitoring of oxygenation. As with pulse oximetry, it is based on the principle that the oxygen-carrying pigments hemoglobin and cytochrome aa3 have well-defined absorption spectra that are influenced by oxygen binding. NIRS technology thus uses a modification of the Beer-Lambert law, which describes the relationship between absorption of light and the concentration of intravascular (deoxygenated hemoglobin [Hb] and oxygenated hemoglobin [HbO2]) and intracellular (cytochrome aa3) chromophores. Key factors in the Beer-Lambert calculation are the absorption coefficient, tissue concentration of chromophore, distance between sensors, differential path length factor (described below), and scattering losses.115 The distance that the light travels, known as the optical path length, must be determined to obtain quantitative concentration changes from the light absorption data. Path length differs due to variable tissue scattering that is reflected by the differential path length factor (DPF). The DPF is a correction factor that is multiplied by the inter-sensor distance to obtain the true path length. NIRS uses light between the 700 nm and 1000 nm wavelength. Measurement of scaled hemoglobin concentrations, reported as the tissue oxygenation index, is also available.
Clinically, NIRS is mainly accomplished by a continuous-wave spectrometer with the two sensors placed on the patient’s forehead at a fixed distance that emit and detect the near-infrared light. NIRS has a greater tissue penetration than pulse oximetry and provides a global assessment of oxygenation in all vascular compartments (arterial, venous, and capillary).116 Range of baseline cerebral oxygen saturation values is very wide. In healthy children, cerebral oxygen saturations are reported to be 68% ± 10%, whereas in children with cyanotic heart disease, baseline values range from 38% to 57%.117 NIRS technology differs from pulse oximetry in that it does not require a pulse; therefore cerebral NIRS monitoring can be used during cardiopulmonary bypass. Perhaps the most common application of NIRS is in intraoperative neurophysiologic monitoring in children who have undergone repair of a congenital cardiac condition.118 Therapeutic changes as a result of NIRS have lead to decreased rates of neurologic complications.118 Also, NIRS monitoring applied in the first 48 hours after neonatal asphyxia has been shown to be useful in predicting outcome at 3 months.119
In addition to blood flow, evaluation of HbO2 and Hb, NIRS can assess the cytochrome aa3 (cyt-aa3) redox state. cyt-aa3 is the terminal component along the oxygen transport chain that reduces oxygen to water and remains in a reduced state during hypoxemia. The absorption spectrum of cyt-aa3 in its reduced state shows a weak peak at 700 nm, whereas the oxygenated form does not. Therefore monitoring changes in the cyt-aa3 redox state can provide a measure of the adequacy of oxidative metabolism. The use of NIRS in deltoid muscle during resuscitation of severe trauma patients has recently been reported.120,121 A strong association was found between elevated serum lactate levels and an elevated cyt-aa3 redox state during 12 hours of shock resuscitation and the development of multiorgan failure.120 A good relationship was also shown among tissue O2, systemic oxygen delivery, and lactate during and after resuscitation in severely injured patients during the first 24 hours.121
Limitations of NIRS technology include its inability to account for patients’ varying ratios of brain and extracranial tissues and the fact that DPF values vary with age and pathologic state.122,123 Icteric patients exhibit depressed regional cerebral oxygen saturation values, presumably due to absorption of light by bilirubin.124 Ongoing blood loss also is associated with a decrease in regional cerebral oxygen saturation that may indicate that a changing hemoglobin concentration confounds cerebral oximetry measurement.125 Furthermore, in infants the reproducibility of cerebral oxygenation measurements is poor.126 The major limitation is that no target or critical values exist with which to compare NIRS-derived regional oxygen saturations. Poor-to-moderate correlation is seen in comparing regional cerebral oxygen saturations to global cerebral oxygenation measures, such as jugular venous saturation,127 central venous saturation,128,129 and invasively monitored cortical brain tissue PO2.130 However, NIRS measurement of continuous oxygen saturation on the brain surface could theoretically provide relative real-time alterations in brain oxygenation, which can be useful in terms of titration of therapies. A pediatric pilot study reported good agreement between NIRS and jugular venous saturations in the normal pediatric brain.131
Optical Spectroscopy
An extension of NIRS has been developed to allow interrogation of specific anatomic and physiologic compartments of the body. Optical spectroscopy also uses absorption of light by tissues to assess concentration of various analytes of interest. By using an entire spectral region in the visible and/or near-infrared spectral region that includes many (up to hundreds) of wavelengths of light, improved distinction between similar molecules is possible. In particular, oxygenation of myoglobin can be measured distinctly from hemoglobin, even in blood-perfused tissues. Myoglobin is an intracellular protein found in skeletal and cardiac muscle cells and is involved in the transport of oxygen from the cytoplasm to the mitochondria where oxygen is used. Because myoglobin and hemoglobin have very similar absorption spectra, it has generally been held that distinction using optical methods is not possible. Quantification of myoglobin saturation (percentage of total myoglobin bound with oxygen) directly yields intracellular PO2 per the myoglobin oxygen dissociation curve that defines oxygen binding to myoglobin modified by temperature and pH.132
Advances in optical spectroscopy have made it possible to distinguish myoglobin saturation from hemoglobin saturation by using multi-wavelength spectral analysis, despite their very similar absorbance spectra. Measurements of myoglobin saturation in the presence of hemoglobin,133–138 hemoglobin saturation in the presence of myoglobin,139,140 and cytochrome oxidation states,141,142 have been made from optical reflectance spectra acquired from muscle. These advances remove the ambiguity present in conventional near-infrared spectroscopic methods in which hemoglobin and myoglobin absorbances are combined.143,144 Optical spectroscopy thus allows identification of oxygenation in anatomically and physiologically distinct tissue regions: in the vascular space (hemoglobin), at the cellular level (myoglobin), and at the mitochondrial level (cytochromes).
Direct measurement of oxygenation at the cellular level in skeletal muscle, based on distinct myoglobin saturation, has several advantages for metabolic monitoring: it is noninvasive, it facilitates early diagnosis of shock, and it may enhance resuscitation strategies. During shock, blood and oxygen delivery are diverted to the critical organs (brain, heart, and kidneys), whereas blood flow to the physiologically “expendable” tissues (muscle and skin) is sacrificed.145,146 Low muscle cellular oxygenation may be the “canary in the coal mine” for the presence of shock—an early, sensitive indicator of inadequate systemic perfusion. Vital signs are not accurate in early shock assessment because compensatory mechanisms often mask changes in these variables.147 Metabolic indexes such as arterial base deficit and lactate have been found to correlate with the severity of shock.148–150 However, since lactate levels and base deficits are metabolic responses to the presence of shock, these serum values lag changes in cellular oxygenation.
During resuscitation, the optimal therapeutic end points remain unclear.146,151,152 Restoration of blood pressure, heart rate, and urine output alone may result in under-resuscitation because patients may remain in compensated shock after these traditional end points have been achieved.153 Patients with occult hypoperfusion, in whom tissue acidosis persists even after resuscitation appears to have been successful, are at increased risk for multiple organ dysfunction syndrome (MODS), respiratory complications, and death.154 Accurate assessments of cellular oxygenation are needed to refine therapy and decrease the incidence of MODS.
There is a varied and confused literature on the optical measurement of skeletal muscle oxygenation.155–158 The problem with these attempts is that a combination of hemoglobin and myoglobin oxygen saturation was determined, with hemoglobin being the dominant signal.143,144,159 Anything that increases the venous blood volume in the muscle (e.g., venous congestion) may be erroneously recorded as hypoxia. In addition, the intracellular oxygen tension remains unknown. Direct cellular oxygenation measurement by optical spectroscopy distinguishes myoglobin oxygen saturation from hemoglobin saturation and is thus capable of measuring intracellular tissue oxygen tension, independent of changes in blood volume.
Carbomyl Phosphate Synthase—A Marker of Mitochondrial Damage
Mitochondrial damage and dysfunction are thought to play an important role in the pathogenesis of sepsis-induced organ failure. Specific markers of mitochondrial damage in vital organs do not currently exist. Recently, carbomyl phosphate synthase (CPS)-1, a protein localized primarily in liver mitochondria, was found to be present in high concentrations in the plasma of septic humans and could serve as a novel marker of mitochondrial damage in sepsis.160
Clinical Correlations in Altered Cellular Respiration
The role of inadequate oxygen delivery in the pathogenesis of disease has been recognized for more than 80 years. In 1920, Joseph Barcroft wrote in The Lancet about three types of hypoxia: deficient delivery of oxygen to blood, or hypoxic (hypoxemic) hypoxia; deficient oxygen carrying capacity, or anemic hypoxia; and deficient circulatory delivery of oxygen, or stagnant (ischemic) hypoxia.161 Later this century it became recognized that under certain states, even in the presence of normal or supranormal oxygen delivery, there was an apparent inability of cells to appropriately extract or utilize oxygen. This was most apparent in sepsis and certain poisonings. In 1997, Fink coined the term “cytopathic hypoxia” to describe such states.162 In 1997, as the study of oxygen supply and utilization evolved, Robin proposed the general term “dysoxia” to describe abnormal tissue oxygen metabolism, and this is the term used in this chapter.163 Now four classifications are recognized: hypoxemic dysoxia, anemic dysoxia, ischemic dysoxia, and cytopathic dysoxia.
Abnormal tissue oxygenation can be divided into three theoretic thresholds. In the first, cellular oxygen levels are below normal but ATP production matches ATP utilization through cellular adaptation. Cellular metabolism and mitochondrial energy production shift but aerobic metabolism is maintained. In the second level, cellular oxygen levels are so low that ATP production and utilization can only be matched through supplementary production of ATP via anaerobic metabolism. An increased supply of glucose is required, and lactate will be produced. The third level describes a state where ATP production has become oxygen limited. Neither cellular adaptation nor glycolysis is sufficient to provide adequate cellular energy. Without additional oxygen, or an increase in the cell’s ability to utilize oxygen, cellular structure and function will fail. Some researchers have proposed that the third level be referred to as “dysoxia.”164 However, levels one and two represent abnormal cellular states that can generate intracellular and extracellular signals that result in altered physiologic function. Therefore “dysoxia” is used to describe any of the three states.
Substrate Deficiency (Hypoglycemia)
Hypoglycemia is probably more common in the neonatal intensive care unit (NICU) than the PICU. However, it represents the most basic form of altered energy production—inadequate energy substrate—and certainly requires recognition and therapy when it occurs (see Chapter 77). Although the clinical manifestations of acute hypoglycemia are well known to physicians, cellular hypoglycemia is a more complex problem.
As described earlier in this chapter, ATP can be produced from the metabolism of fats, proteins, and carbohydrates. However, carbohydrates represent the dominant energy source in the regular diet of most humans, and the levels of enzymes necessary for conversion of various macronutrients into energy are skewed in favor of glucose metabolism.
There are two primary advantages of carbohydrate when compared with fat as a metabolic fuel. First, carbohydrate metabolism is the only mechanism by which cells can produce ATP in the absence of oxygen, that is, the anaerobic state. The metabolism of glucose to pyruvate yields a net of two molecules of ATP per molecule of glucose. This is obviously important to cells in crisis where oxygen delivery may be impaired. However, it is also important in the normal physiologic state for cells that have lost their mitochondria, such as red blood cells, and to cells that have high energy demands and operate under conditions of low O2 tension even in the healthy state, such as renal tubular medullary cells. A second advantage of carbohydrate as fuel is efficiency. The ratio of ATP production to oxygen consumption is higher with glucose than with fats. Thus glucose is a more efficient fuel for ATP production yielding a 10% to 15% advantage.165 This advantage may seem small but may become quite significant in states of high energy requirement or limited oxygen delivery such as seen in exercise or critical illness.
Besides red blood cells and renal tubular cells, glucose is the preferred energy source for various other tissues in the body, including the central nervous system and the testes. Although the brain can adapt to using ketones as an energy source, this enzymatic transition takes time. Lack of immediate availability of these enzymes is readily seen in the severe central nervous system effects manifested with acute hypoglycemia. In the testes, the metabolism of glucose to lactate is necessary for healthy spermatogenesis.166
The Four Dysoxias
Before reviewing the various dysoxias, a brief review of DO2 and oxygen consumption (VO2) is in order (see Chapter 20). Oxygen delivery is defined as the product of the arterial oxygen content of the blood (CaO2) and the cardiac output (CO) and is often indexed to the body surface area in square meters (BSA):

Given that the amount of dissolved O2 is so small, it is often dropped from the calculation for simplicity. Derivation of cardiac output is described elsewhere in this text (see Chapters 19 through 22).


There is a point, however, at which the oxygen extraction capabilities of the tissues are exceeded. At that point, VO2 becomes dependent on DO2. This biphasic relationship of DO2/VO2 is shown in Figure 74-9.
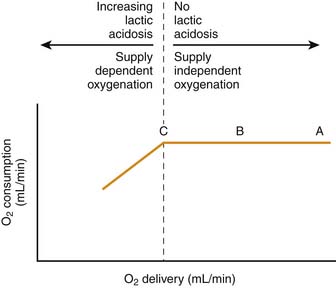
The importance of this concept cannot be overemphasized as it relates to cellular respiration. DO2 and VO2 can be altered in many physiologic and pathologic states. Sleep, exercise, pain, anxiety, and fever are just a few examples. Drugs, too, can have simultaneous effects on VO2 and DO2, such as with catecholamines and shock.167 With certain poisons and with cytopathic dysoxia, oxygen consumption can be directly affected by the tissues’ ability to extract oxygen from the blood and use it as the terminal mitochondrial electron acceptor. In these situations, tissue oxygen extraction, not DO2, represents the limiting factor; DO2 may be normal or even elevated.
Accordingly, a complicated interplay exists among DO2, VO2, and ERO2. Although described in text and graphs in what appear to be straightforward ways—just as with preload, afterload, contractility, and stroke volume—their practical measurement remains exceedingly difficult. Bedside evaluation of DO2 and VO2 would be of great value to the clinician. Unfortunately, most of the methods of calculating VO2 rely on cardiac output (via the Fick principle), which results in a situation where a single measured variable is included in two parts of a regression analysis, so-called mathematical coupling. This dependency leads to amplification of any error in that measurement and may result in an apparent relationship between variables that does not truly exist.168 As in many areas of critical care medicine, when something cannot be measured directly, a surrogate measure must be used.
Anemic Dysoxia
How anemic must a child be to suffer from anemic dysoxia? A clinical scenario is instructive:
Assuming that a normal child, approximately 1 m2, has a VO2 of 200 mL/min and a normal cardiac output of about 4 L/min, the formula for VO2 (Equation 2) may be rearranged to obtain the minimum hemoglobin concentration necessary to deliver that amount of oxygen. An extreme oxygen extraction, 80%, is also assumed (this would reflect an SvO2 of 20%!):

This equates to a hematocrit of just over 15%. Additional manipulation of the numbers reveals that to maintain an SvO2 in the normal range of approximately 70%, CO would have to increase by a factor of 2.7! (It should be appreciated that the increased CO itself increases VO2.)

Notice that the dissolved portion in this patient, 0.27mL/dL, represents less than 4% of the total CaO2. If the same patient were administered 100% FiO2, a PaO2 of approximately 600 mm Hg would be likely. In this case:

Hypoxemic Dysoxia
Another example is outlined below:

If the patient’s hemoglobin oxygen saturations were normal, the 50% increase in her heart rate (assuming a normal of 120 beats/min) would just offset her increased VO2. However, her hypoxemia causes a 25% reduction in CaO2. A quick calculation reveals:

It is immediately apparent in this example that the increase in VO2 has not been offset by the increase in DO2. This generates a state in which the VO2/DO2 curve has shifted, and the threshold at which VO2 becomes limited by DO2 is lowered. The treatment in this case is obvious. Application of supplemental O2 will likely alleviate her hypoxemia, and with her tachycardia, CaO2 will return to a normal or even increased level.

To maintain adequate oxygen delivery in the face of persistent hypoxemia, these patients must increase cardiac output, hemoglobin, or both. It is worth remembering that because CaO2 is a product of hemoglobin concentration, SaO2, and CO, a reduction in one can be fully compensated for by an appropriate increase in the other(s). Some quick math reveals that for a patient whose arterial oxygen saturation is chronically 75%, a cumulative increase in hemoglobin and/or cardiac output of 30% is necessary to equate an SaO2 of 100%. An increase in hemoglobin of 3 to 4 g/dL is obviously less stressful to a system than a chronic increase in CO of 1.0 to 1.5 L/min/m2. This is especially true when one recalls that many of these patients have some element of heart failure and are not capable of long-term significant increases in cardiac output. It should also be recalled that for such patients any increase in CO results in an increase in VO2 assuming that cytopathic dysoxia is not operative. It is obvious why these patients are so fragile. They have a limited ability to increase DO2. Essentially, they live close to point C on the VO2/DO2 curve shown in Figure 74-9. Any illness or acute stressor that results in an increase in VO2 can lead to a state at which VO2 becomes limited by DO2 and cellular respiration begins to suffer.
In summary, although hypoxemia is a common finding in the PICU, patients typically compensate through an increase in cardiac output. For chronically hypoxemic patients, part of their compensation derives from elevated levels of hemoglobin. It is in those patients whose ability to increase cardiac output or whose level of VO2 is significantly elevated that the physician must be most concerned that limited CaO2 will cause an inability to meet VO2 and cellular respiration will fail.
Ischemic Dysoxia
It is obvious that in tissues for which blood supply is eliminated, oxygen delivery will be eliminated and cellular energy production will fail—not only from a lack of oxygen, but also from a deficiency of substrate. This represents the most extreme form of ischemic dysoxia. However, this is less frequently encountered than are situations in which blood supply is merely compromised. At some point (point C on Figure 74-9), the decrease in DO2 may fall below the level of VO2 and cellular respiration will falter.
Ischemic dysoxia can occur on a macroscopic level, and this is how it is usually considered. A patient with severe bradycardia but normal SaO2 suffers from global ischemic dysoxia purely as a result of inadequate cardiac output. DO2 is severely limited and cannot meet VO2. Anaerobic metabolism begins, and if the bradycardia is not reversed, cellular function will begin to fail. In another example, a patient develops a subdural hematoma after a fall. The increased intracranial pressure creates regional ischemia and inadequate DO2 to that area. Draining the hematoma relieves the pressure and DO2 returns to normal or even increased levels. There is, indeed, injury associated with the restoration of DO2, a so-called reperfusion injury (see Chapter 62).
In contrast to the macroscopic examples above, ischemic dysoxia occurs much more frequently on a microscopic level. In many ways, this concept is only on the threshold of understanding. Even in good health, many areas of the body demonstrate “marginal” DO2, with limited oxygen supply relative to metabolic needs. Classic examples include the renal medulla and corticomedullary junction and the centrilobular regions in the liver.169–171
In the kidney, the tubular cells of the medullary region contain a high concentration of mitochondria to provide energy for pumping ions against a strong gradient. However, the cells exist near the end of the peritubular capillaries where DO2 is at or nearly at the limits of VO2. In the liver the centrilobular cells lie at the end of the sinusoids, just proximal to the venous system. In addition, more than half of the liver’s blood supply is provided by the portal vein with its already low oxygen tension. Once again, DO2 hovers close to VO2. In these examples any situation in which blood pressure or cardiac output is compromised can lead to significant insult to these areas; VO2 simply cannot be met, cellular energy production falters, and cell functions fail. Clinically this is reflected as acute renal insufficiency due to acute tubular necrosis or hepatic dysfunction due to ischemic hepatitis—so called “shock liver.”172
The structure of the microcirculation, a network of vessels less than 100 to 150 μm in diameter, is important when considering dysoxia. It is composed of arterioles, capillaries, and venules and represents the functional unit of the circulation, supplying tissues with oxygen and substrates and removing metabolites. It is also important to understand two aspects of the microcirculation as they relate to dysoxia. First, in the classic Krogh model of microcirculation, oxygen exchange occurs in the capillary bed. However, research reveals that a significant amount of oxygen can be lost through the arterioles.173 This is important because it suggests that as blood enters the capillary bed, it may have already released a significant amount of oxygen to the periarteriolar tissues and may be relatively desaturated. Oxygen diffusion from the arteriole toward the capillary may or may not be able to compensate for this. This means that any state of ischemic dysoxia may be complicated by hypoxemic dysoxia at the capillary level.
The second aspect of the microcirculation to note is its overall structure. Progressively smaller vessels supply progressively larger areas of tissue. In addition, precapillary sphincters and thoroughfare channels are present. Accordingly, there exist multiple opportunities for blood to partly or entirely bypass regional capillary beds. Dysregulation of the arterioles or precapillary sphincters shunts blood directly from arteriole to venule. In sepsis, plugging of capillaries due to endothelial swelling, microscopic clots, activated white blood cells, or nondeformable red cells does the same. These scenarios all give rise to microscopic regional ischemia and potentially regional ischemic dysoxia. Much research has been devoted to the microcirculation and its role in critical illness. It is believed by many to be the pathophysiologic basis for MODS, and in sepsis its role is believed by some to be so important as to be deemed the “motor of sepsis.”174–178 Throughout the tissues there seem to be areas in the microcirculation fundamentally vulnerable to ischemic dysoxia; these areas have been termed microvascularly weak units.179,180
Cytopathic Dysoxia
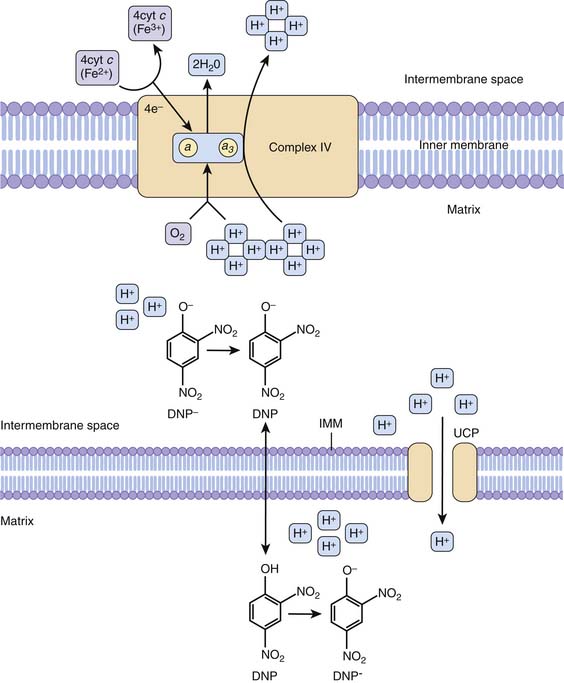
The term cytopathic hypoxia arose just over 10 years ago to describe “diminished production of ATP despite normal (or even supranormal) PO2 values in the vicinity of the mitochondria.”162 This term arose because of increasing evidence that in sepsis there was insufficient energy production in cells despite adequate oxygen delivery. Indeed, this does occur in sepsis, and increasing research points to it as a fundamental cause of the multiple clinical manifestations of sepsis. There are also chemicals and drugs that, despite adequate intracellular oxygen, can lead to cellular energy failure via direct functional inhibition of or damage to the mitochondria. These include cyanide, 2,4-dinitrophenol (DNP), aspirin, and propofol.
Inhibition of pyruvate dehydrogenase complex (PDC) has been implicated in some of the altered cellular metabolism and increased lactate production in sepsis.181,182 Glycolysis is stimulated in many cells during sepsis. For glycolysis to be linked to oxidative phosphorylation and cellular respiration in the mitochondria, glucose must be converted first to pyruvate then irreversibly to AcCoA, which subsequently enters the mitochondria. This conversion of pyruvate to AcCoA is accomplished through the action of PDC. During sepsis, this enzyme complex is inhibited by stimulation of a PDC-kinase. The trigger for this is poorly understood. When pyruvate cannot be converted to AcCoA, energy production in the mitochondria diminishes due to a lack of substrate entering the Krebs cycle. In addition, when pyruvate cannot be converted to AcCoA, its fate is to be converted to lactate via lactate dehydrogenase.
NO and other reactive nitrogen species (RNS) have been demonstrated in several studies to play active roles in the pathogenesis of sepsis.183–185 As previously discussed, NO acts as a reversible inhibitor of cytochrome c oxidase. At increased concentrations, NO reacts to form OONO− (peroxynitrite), NO2, and nitrosothiols. Increased concentrations of NO and these compounds can cause irreversible inhibition of respiratory chain components, uncoupling of oxidative phosphorylation, enhanced permeability of the mitochondrial membrane, and ultimately death of the cell.186 In some research, the degree of mitochondrial dysfunction in sepsis was directly related to extent of NO production.35
A final theory of sepsis-induced mitochondrial dysfunction involves PARP.187,188 This enzyme is involved in various aspects of cellular function, but with respect to sepsis, its most important function involves repair of single-strand breaks in DNA. During sepsis there is an increase flux of reactive oxygen and nitrogen species that mediate induce single-strand breaks in DNA. PARP is activated to repair these breaks. Activation of PARP leads to massive depletion of cellular NAD+/NADH. Because NADH is the primary reducing equivalent transfer molecule used in cellular respiration, its depletion results in marked impairment of aerobic metabolism.
Drug Effects on Cellular Respiration
Aspirin
Salicylates have been used therapeutically since at least the fifth century BCE. Aspirin (acetylsalicylic acid) was synthesized in the mid-nineteenth century and has been manufactured and sold since. Toxicity to cellular respiration from aspirin overdose has been recognized for decades, but the mechanism has remained elusive. Some researchers have demonstrated an uncoupling of oxidative phosphorylation.189 In this mechanism aspirin induces mitochondrial permeability transition (MPT). This transition allows the proton gradient established across the inner mitochondrial membrane to depolarize in a manner not linked to ATP production—hence the “uncoupling.” This energy release manifests as heat. It may be part of the pathophysiology of fever in salicylate toxicity, though effects on hypothalamic function may also play a role. Recently, another mechanism of salicylate toxicity has been elucidated.190 This research demonstrated reversible and irreversible inhibition of α-ketoglutarate dehydrogenase (AKDH) in the Krebs cycle by salicylate and acetylsalicylic acid, respectively, resulting in diminished production of NADH and failure of cellular respiration.
Propofol
Propofol is a frequently used anesthetic in the PICU and the operating room. Although generally considered safe, there have been increasing reports of patients developing metabolic acidosis, rhabdomyolysis, refractory bradycardia and cardiac failure, renal failure, and death from propofol infusion syndrome.191 The pathophysiology of this syndrome remains partially unexplained, but multiple studies show at least some aspects related to propofol’s effects on the mitochondria.142,192–194 Some studies demonstrate leakage of protons across the inner mitochondrial membrane similar to uncoupling of oxidative phosphorylation by DNP and aspirin. Others show inhibition of enzymes along the electron transport chain. Given that propofol infusion syndrome usually occurs in the ICU in critically ill patients, some researchers have looked at the possibility of an interaction between propofol and reactive oxygen and nitrogen species as a potential mechanism.193 Other researchers have suggested that unrecognized mitochondrial disease may predispose patients to this syndrome, though no such association has yet been ascertained.195 Whatever the ultimate pathway is for development of this syndrome, it almost certainly involves the mitochondria on some level. The mechanism of action of DNP, aspirin, and propofol are suggested in Figure 74-10.40
Sepsis and Dysoxia
Historically, sepsis is typically regarded in macroscopic dimensions. Intensivists support blood pressure, perfusion, and oxygenation because correction of these abnormalities has shown improvement in outcome. However, the cellular microscopic milieu constitutes the mechanistic focus for any macroscopic abnormalities. The microcirculation and mitochondria are at the core of organ failure and death in sepsis, although the details remain sketchy. Currently, they also remain far from therapeutic reach. Their increasingly recognized role in the pathogenesis of sepsis has led to the term microcirculatory and mitochondrial distress syndrome (MMDS), a term highlighting the complex interplay between circulation and cellular metabolism in sepsis.175 Studies examining cellular energy, microcirculation, and mitochondria in sepsis have yielded conflicting results regarding the exact mechanisms and contributions each plays in sepsis pathogenesis. As with most areas in medicine, it is likely that the answer overlaps with multiple contributions, with no single element emerging as the definitive problem.
Hibernation Physiology in Sepsis
One final aspect of cellular metabolism and energetics worth mentioning is that of hibernation. Although sepsis often progresses to MODS and death, tissue examination frequently reveals little histologic evidence of cell injury and death.196 Some research indicates a form of cellular hibernation is triggered in sepsis. Energy metabolism is altered to preserve cell life, but physiologic cell function nearly ceases. The exact mechanism is not understood, and its role in sepsis has not been extensively evaluated.32,197 However, it does provide an explanation for extreme organ dysfunction in the absence of cell death and a platform for future study.
References are available online at http://www.expertconsult.com.
1. Thannickal V.J. Oxygen in the evolution of complex life and the price we pay. Am J Respir Cell Mol Biol. 2009;40(5):507-510.
2. Falkowski P.G., Katz M.E., Milligan A.J., et al. The rise of oxygen over the past 205 million years and the evolution of large placental mammals. Science. 2005;309(5744):2202-2204.
3. Lambeth J.D. Nox enzymes, ROS, and chronic disease: an example of antagonistic pleiotropy. Free Radic Biol Med. 2007;43(3):332-347.
4. Chandel N.S., Budinger G.R. The cellular basis for diverse responses to oxygen. Free Radic Biol Med. 2007;42(2):165-174.
5. Nauseef W.M. Biological roles for the NOX family NADPH oxidases. J Biol Chem. 2008;283(25):16961-16965.
6. Harrison R. Physiological roles of xanthine oxidoreductase. Drug Metab Rev. 2004;36(2):363-375.
7. Capdevila J.H., Falck J.R., Harris R.C. Cytochrome P450 and arachidonic acid bioactivation. Molecular and functional properties of the arachidonate monooxygenase. J Lipid Res. 2000;41(2):163-181.
8. Fridovich I. The biology of oxygen radicals. Science. 1978;201(4359):875-880.
9. Marletta M.A. Nitric oxide synthase structure and mechanism. J Biol Chem. 1993;268(17):12231-12234.
10. Brown G.C., Borutaite V. Nitric oxide inhibition of mitochondrial respiration and its role in cell death. Free Radic Biol Med. 2002;33(11):1440-1450.
11. Giulivi C. Characterization and function of mitochondrial nitric-oxide synthase. Free Radic Biol Med. 2003;34(4):397-408.
12. Pryor W.A., Squadrito G.L. The chemistry of peroxynitrite: a product from the reaction of nitric oxide with superoxide. Am J Physiol. 1995;268(5 Pt 1):L699-722.
13. Beckman J.S., Koppenol W.H. Nitric oxide, superoxide, and peroxynitrite: the good, the bad, and ugly. Am J Physiol. 1996;271(5 Pt 1):C1424-1437.
14. Kooy N.W., Lewis S.J., Royall J.A., et al. Extensive tyrosine nitration in human myocardial inflammation: evidence for the presence of peroxynitrite. Crit Care Med. 1997;25(5):812-819.
15. Szabo C. The pathophysiological role of peroxynitrite in shock, inflammation, and ischemia-reperfusion injury. Shock. 1996;6(2):79-88.
16. Radi R., Beckman J.S., Bush K.M., et al. Peroxynitrite oxidation of sulfhydryls. The cytotoxic potential of superoxide and nitric oxide. J Biol Chem. 1991;266(7):4244-4250.
17. Haddad I.Y., Ischiropoulos H., Holm B.A., et al. Mechanisms of peroxynitrite-induced injury to pulmonary surfactants. Am J Physiol. 1993;265(6 Pt 1):L555-564.
18. Bove P.F., van der Vliet A. Nitric oxide and reactive nitrogen species in airway epithelial signaling and inflammation. Free Radic Biol Med. 2006;41(4):515-527.
19. Park H.S., Jung H.Y., Park E.Y., et al. Cutting edge: direct interaction of TLR4 with NAD(P)H oxidase 4 isozyme is essential for lipopolysaccharide-induced production of reactive oxygen species and activation of NF-kappa B. J Immunol. 2004;173(6):3589-3593.
20. Klotz L.O., Schroeder P., Sies H. Peroxynitrite signaling: receptor tyrosine kinases and activation of stress-responsive pathways. Free Radic Biol Med. 2002;33(6):737-743.
21. DiMauro S., Schon E.A. Mitochondrial respiratory-chain diseases. N Engl J Med. 2003;348(26):2656-2668.
22. Gray M.W., Burger G., Lang B.F. Mitochondrial evolution. Science. 1999;283(5407):1476-1481.
23. Hubbard W.J., Bland K.I., Chaudry I.H. The role of the mitochondrion in trauma and shock. Shock. 2004;22(5):395-402.
24. Rich P. Chemiosmotic coupling: the cost of living. Nature. 2003;421(6923):583.
25. Hajnoczky G., Csordas G., Das S., et al. Mitochondrial calcium signalling and cell death: approaches for assessing the role of mitochondrial Ca2+ uptake in apoptosis. Cell Calcium. 2006;40(5-6):553-560.
26. McBride H.M., Neuspiel M., Wasiak S. Mitochondria: more than just a powerhouse. Curr Biol. 2006;16(14):R551-560.
27. Schapira A.H. Mitochondrial disease. Lancet. 2006;368(9529):70-82.
28. Chan D.C. Mitochondrial dynamics in disease. N Engl J Med. 2007;356(17):1707-1709.
29. Hoidal J.R. Reactive oxygen species and cell signaling. Am J Respir Cell Mol Biol. 2001;25(6):661-663.
30. Schwartzman R.A., Cidlowski J.A. Apoptosis: the biochemistry and molecular biology of programmed cell death. Endocr Rev. 1993;14(2):133-151.
31. Hotchkiss R.S., Strasser A., McDunn J.E., et al. Cell death. N Engl J Med. 2009;361(16):1570-1583.
32. Levy R.J. Mitochondrial dysfunction, bioenergetic impairment, and metabolic down-regulation in sepsis. Shock. 2007;28(1):24-28.
33. Singer M. Mitochondrial function in sepsis: acute phase versus multiple organ failure. Crit Care Med. 2007;35(Suppl 9):S441-448.
34. Crouser E.D., Julian M.W., Joshi M.S., et al. Cyclosporin A ameliorates mitochondrial ultrastructural injury in the ileum during acute endotoxemia. Crit Care Med. 2002;30(12):2722-2728.
35. Brealey D., Brand M., Hargreaves I., et al. Association between mitochondrial dysfunction and severity and outcome of septic shock. Lancet. 2002;360(9328):219-223.
36. Boulos M., Astiz M.E., Barua R.S., et al. Impaired mitochondrial function induced by serum from septic shock patients is attenuated by inhibition of nitric oxide synthase and poly(ADP-ribose) synthase. Crit Care Med. 2003;31(2):353-358.
37. Suliman H.B., Carraway M.S., Piantadosi C.A. Postlipopolysaccharide oxidative damage of mitochondrial DNA. Am J Respir Crit Care Med. 2003;167(4):570-579.
38. Anderson S., Bankier A.T., Barrell B.G., et al. Sequence and organization of the human mitochondrial genome. Nature. 1981;290(5806):457-465.
39. Tornroth-Horsefield S., Neutze R. Opening and closing the metabolite gate. Proc Natl Acad Sci U S A. 2008;105(50):19565-19566.
40. Baynes J.W., Dominiczak M.H. Medical biochemistry, ed 3. New York: Mosby Elsevier; 2009.
41. Mitchell P., Moyle J. Chemiosmotic hypothesis of oxidative phosphorylation. Nature. 1967;213(5072):137-139.
42. Noji H., Yoshida M. The rotary machine in the cell, ATP synthase. J Biol Chem. 2001;276(3):1665-1668.
43. Kompanje E.J., Jansen T.C., van der Hoven B., et al. The first demonstration of lactic acid in human blood in shock by Johann Joseph Scherer (1814-1869) in January 1843. Intensive Care Med. 2007;33(11):1967-1971.
44. Ronco J.J., Fenwick J.C., Tweeddale M.G., et al. Identification of the critical oxygen delivery for anaerobic metabolism in critically ill septic and nonseptic humans. JAMA. 1993;270(14):1724-1730.
45. Levy B., Gibot S., Franck P., et al. Relation between muscle Na+K+ ATPase activity and raised lactate concentrations in septic shock: a prospective study. Lancet. 2005;365(9462):871-875.
45a. Huckabee W.E. Relationships of pyruvate and lactate during anaerobic metabolism. I. Effects of infusion of pyruvate or glucose and of hyperventilation. J Clin Invest. 1958;37(2):244-254.
46. Zhang H., Spapen H., Benlabed M., et al. Systemic oxygen extraction can be improved during repeated episodes of cardiac tamponade. J Crit Care. 1993;8(2):93-99.
47. Cain S.M. Oxygen delivery and uptake in dogs during anemic and hypoxic hypoxia. J Appl Physiol. 1977;42(2):228-234.
48. Friedman G., De Backer D., Shahla M., et al. Oxygen supply dependency can characterize septic shock. Intensive Care Med. 1998;24(2):118-123.
49. Rivers E., Nguyen B., Havstad S., et al. Early goal-directed therapy in the treatment of severe sepsis and septic shock. N Engl J Med. 2001;345(19):1368-1377.
50. Levy B., Sadoune L.O., Gelot A.M., et al. Evolution of lactate/pyruvate and arterial ketone body ratios in the early course of catecholamine-treated septic shock. Crit Care Med. 2000;28(1):114-119.
51. Astiz M.E., Rackow E.C., Kaufman B., et al. Relationship of oxygen delivery and mixed venous oxygenation to lactic acidosis in patients with sepsis and acute myocardial infarction. Crit Care Med. 1988;16(7):655-658.
52. De Backer D., Creteur J., Dubois M.J., et al. The effects of dobutamine on microcirculatory alterations in patients with septic shock are independent of its systemic effects. Crit Care Med. 2006;34(2):403-408.
53. Crouser E.D., Julian M.W., Blaho D.V., et al. Endotoxin-induced mitochondrial damage correlates with impaired respiratory activity. Crit Care Med. 2002;30(2):276-284.
54. Fredriksson K., Hammarqvist F., Strigard K., et al. Derangements in mitochondrial metabolism in intercostal and leg muscle of critically ill patients with sepsis-induced multiple organ failure. Am J Physiol Endocrinol Metab. 2006;291(5):E1044-1050.
55. De Backer D., Creteur J., Zhang H., et al. Lactate production by the lungs in acute lung injury. Am J Respir Crit Care Med. 1997;156(4 Pt 1):1099-1104.
56. De Jonghe B., Cheval C., Misset B., et al. Relationship between blood lactate and early hepatic dysfunction in acute circulatory failure. J Crit Care. 1999;14(1):7-11.
57. Chiolero R., Tappy L., Gillet M., et al. Effect of major hepatectomy on glucose and lactate metabolism. Ann Surg. 1999;229(4):505-513.
58. Mustafa I., Roth H., Hanafiah A., et al. Effect of cardiopulmonary bypass on lactate metabolism. Intensive Care Med. 2003;29(8):1279-1285.
59. Levraut J., Ciebiera J.P., Chave S., et al. Mild hyperlactatemia in stable septic patients is due to impaired lactate clearance rather than overproduction. Am J Respir Crit Care Med. 1998;157(4 Pt 1):1021-1026.
60. Chrusch C., Bands C., Bose D., et al. Impaired hepatic extraction and increased splanchnic production contribute to lactic acidosis in canine sepsis. Am J Respir Crit Care Med. 2000;161(2 Pt 1):517-526.
61. Levraut J., Ichai C., Petit I., et al. Low exogenous lactate clearance as an early predictor of mortality in normolactatemic critically ill septic patients. Crit Care Med. 2003;31(3):705-710.
62. Haji-Michael P.G., Ladriere L., Sener A., et al. Leukocyte glycolysis and lactate output in animal sepsis and ex vivo human blood. Metabolism. 1999;48(6):779-785.
63. Meszaros K., Lang C.H., Bagby G.J., et al. Contribution of different organs to increased glucose consumption after endotoxin administration. J Biol Chem. 1987;262(23):10965-10970.
64. Luchette F.A., Friend L.A., Brown C.C., et al. Increased skeletal muscle Na+, K+-ATPase activity as a cause of increased lactate production after hemorrhagic shock. J Trauma. 1998;44(5):796-801.
65. McCarter F.D., James J.H., Luchette F.A., et al. Adrenergic blockade reduces skeletal muscle glycolysis and Na(+), K(+)-ATPase activity during hemorrhage. J Surg Res. 2001;99(2):235-244.
66. McCarter F.D., Nierman S.R., James J.H., et al. Role of skeletal muscle Na+-K+ ATPase activity in increased lactate production in sub-acute sepsis. Life Sci. 2002;70(16):1875-1888.
67. James J.H., Wagner K.R., King J.K., et al. Stimulation of both aerobic glycolysis and Na(+)-K(+)-ATPase activity in skeletal muscle by epinephrine or amylin. Am J Physiol. 1999;277(1 Pt 1):E176-186.
68. Vary T.C., Martin L.F. Potentiation of decreased pyruvate dehydrogenase activity by inflammatory stimuli in sepsis. Circ Shock. 1993;39(4):299-305.
69. Vary T.C. Sepsis-induced alterations in pyruvate dehydrogenase complex activity in rat skeletal muscle: effects on plasma lactate. Shock. 1996;6(2):89-94.
70. Naidoo D.P., Gathiram V., Sadhabiriss A., et al. Clinical diagnosis of cardiac beriberi. South Afr Med J. 1990;77(3):125-127.
71. Druml W., Grimm G., Laggner A.N., et al. Lactic acid kinetics in respiratory alkalosis. Crit Care Med. 1991;19(9):1120-1124.
72. Kellum J.A., Kramer D.J., Mankad S., et al. Release of lactate by the lung in acute lung injury. Adv Exp Med Biol. 1997;411:281-285.
73. Day N.P., Phu N.H., Bethell D.P., et al. The effects of dopamine and adrenaline infusions on acid-base balance and systemic haemodynamics in severe infection. Lancet. 1996;348(9022):219-223.
74. Levy B., Mansart A., Bollaert P.E., et al. Effects of epinephrine and norepinephrine on hemodynamics, oxidative metabolism, and organ energetics in endotoxemic rats. Intensive Care Med. 2003;29(2):292-300.
75. Lonergan J.T., Behling C., Pfander H., et al. Hyperlactatemia and hepatic abnormalities in 10 human immunodeficiency virus-infected patients receiving nucleoside analogue combination regimens. Clin Infect Dis. 2000;31(1):162-166.
76. Claessens Y.E., Cariou A., Monchi M., et al. Detecting life-threatening lactic acidosis related to nucleoside-analog treatment of human immunodeficiency virus-infected patients, and treatment with L-carnitine. Crit Care Med. 2003;31(4):1042-1047.
77. Bonnet F., Bonarek M., Abridj A., et al. Severe lactic acidosis in HIV-infected patients treated with nucleosidic reverse transcriptase analogs: a report of 9 cases. Rev Med Interne. 2003;24(1):11-16.
78. Baud F.J., Borron S.W., Megarbane B., et al. Value of lactic acidosis in the assessment of the severity of acute cyanide poisoning. Crit Care Med. 2002;30(9):2044-2050.
79. Morgan T.J., Clark C., Clague A. Artifactual elevation of measured plasma L-lactate concentration in the presence of glycolate. Crit Care Med. 1999;27(10):2177-2179.
80. Mizock B.A., Falk J.L. Lactic acidosis in critical illness. Crit Care Med. 1992;20(1):80-93.
81. Fall P.J., Szerlip H.M. Lactic acidosis: from sour milk to septic shock. J Intensive Care Med. 2005;20(5):255-271.
82. Fink M.P. Does tissue acidosis in sepsis indicate tissue hypoperfusion? Intensive Care Med. 1996;22(11):1144-1146.
83. Hotchkiss R.S., Karl I.E. Reevaluation of the role of cellular hypoxia and bioenergetic failure in sepsis. JAMA. 1992;267(11):1503-1510.
84. James J.H., Luchette F.A., McCarter F.D., et al. Lactate is an unreliable indicator of tissue hypoxia in injury or sepsis. Lancet. 1999;354(9177):505-508.
85. Englehart M.S., Schreiber M.A. Measurement of acid-base resuscitation endpoints: lactate, base deficit, bicarbonate or what? Curr Opin Crit Care. 2006;12(6):569-574.
86. Otero R.M., Nguyen H.B., Huang D.T., et al. Early goal-directed therapy in severe sepsis and septic shock revisited: concepts, controversies, and contemporary findings. Chest. 2006;130(5):1579-1595.
87. Reinhart K., Bloos F. The value of venous oximetry. Curr Opin Crit Care. 2005;11(3):259-263.
88. Harvey S., Harrison D.A., Singer M., et al. Assessment of the clinical effectiveness of pulmonary artery catheters in management of patients in intensive care (PAC-Man): a randomised controlled trial. Lancet. 2005;366(9484):472-477.
89. Sakr Y., Vincent J.L., Reinhart K., et al. Use of the pulmonary artery catheter is not associated with worse outcome in the ICU. Chest. 2005;128(4):2722-2731.
90. Sandham J.D., Hull R.D., Brant R.F., et al. A randomized, controlled trial of the use of pulmonary-artery catheters in high-risk surgical patients. N Engl J Med. 2003;348(1):5-14.
91. Rivers E.P., Ander D.S., Powell D. Central venous oxygen saturation monitoring in the critically ill patient. Curr Opin Crit Care. 2001;7(3):204-211.
92. Dellinger R.P., Carlet J.M., Masur H., et al. Surviving Sepsis Campaign guidelines for management of severe sepsis and septic shock. Crit Care Med. 2004;32(3):858-873.
93. de Oliveira C.F., de Oliveira D.S., Gottschald A.F., et al. ACCM/PALS haemodynamic support guidelines for paediatric septic shock: an outcomes comparison with and without monitoring central venous oxygen saturation. Intensive Care Med. 2008;34(6):1065-1075.
94. Reinhart K., Kuhn H.J., Hartog C., et al. Continuous central venous and pulmonary artery oxygen saturation monitoring in the critically ill. Intensive Care Med. 2004;30(8):1572-1578.
95. Edwards J.D., Mayall R.M. Importance of the sampling site for measurement of mixed venous oxygen saturation in shock. Crit Care Med. 1998;26(8):1356-1360.
96. Dueck M.H., Klimek M., Appenrodt S., et al. Trends but not individual values of central venous oxygen saturation agree with mixed venous oxygen saturation during varying hemodynamic conditions. Anesthesiology. 2005;103(2):249-257.
97. Ogawa S., Tank D.W., Menon R., et al. Intrinsic signal changes accompanying sensory stimulation: functional brain mapping with magnetic resonance imaging. Proc Natl Acad Sci U S A. 1992;89(13):5951-5955.
98. Kwong K.K., Belliveau J.W., Chesler D.A., et al. Dynamic magnetic resonance imaging of human brain activity during primary sensory stimulation. Proc Natl Acad Sci U S A. 1992;89(12):5675-5679.
99. Raichle M.E. Behind the scenes of functional brain imaging: a historical and physiological perspective. Proc Natl Acad Sci U S A. 1998;95(3):765-772.
100. Kim Y.R., Huang I.J., Lee S.R., et al. Measurements of BOLD/CBV ratio show altered fMRI hemodynamics during stroke recovery in rats. J Cereb Blood Flow Metab. 2005;25(7):820-829.
101. Leontiev O., Buxton R.B. Reproducibility of BOLD, perfusion, and CMRO2 measurements with calibrated-BOLD fMRI. Neuroimage. 2007;35(1):175-184.
102. Hsu Y.Y., Chang C.N., Jung S.M., et al. Blood oxygenation level-dependent MRI of cerebral gliomas during breath holding. J Magn Reson Imaging. 2004;19(2):160-167.
103. Rauscher A., Sedlacik J., Barth M., et al. Nonnvasive assessment of vascular architecture and function during modulated blood oxygenation using susceptibility weighted magnetic resonance imaging. Magn Reson Med. 2005;54(1):87-95.
104. Taylor N.J., Baddeley H., Goodchild K.A., et al. BOLD MRI of human tumor oxygenation during carbogen breathing. J Magn Reson Imaging. 2001;14(2):156-163.
105. Karczmar G.S., Kuperman V.Y., River J.N., et alMagnetic resonance measurement of response to hyperoxia differentiates tumors from normal tissue and may be sensitive to oxygen consumption Invest Radiol 29 1994:Suppl 2;S161-163
106. Jiang L., Zhao D., Constantinescu A., et al. Comparison of BOLD contrast and Gd-DTPA dynamic contrast-enhanced imaging in rat prostate tumor. Magn Reson Med. 2004;51(5):953-960.
107. Nield L.E., Qi X.L., Valsangiacomo E.R., et al. In vivo MRI measurement of blood oxygen saturation in children with congenital heart disease. Pediatr Radiol. 2005;35(2):179-185.
108. Pickard J.D., Hutchinson P.J., Coles J.P., et al. Imaging of cerebral blood flow and metabolism in brain injury in the ICU. Acta Neurochir Suppl. 2005;95:459-464.
109. Carlier P.G., Bertoldi D., Baligand C., et al. Muscle blood flow and oxygenation measured by NMR imaging and spectroscopy. NMR Biomed. 2006;19(7):954-967.
110. Brooks W.M., Friedman S.D., Gasparovic C. Magnetic resonance spectroscopy in traumatic brain injury. J Head Trauma Rehabil. 2001;16(2):149-164.
111. Garnett M.R., Cadoux-Hudson T.A., Styles P. How useful is magnetic resonance imaging in predicting severity and outcome in traumatic brain injury? Curr Opin Neurol. 2001;14(6):753-757.
112. L’Abee C., de Vries L.S., van der Grond J., et al. Early diffusion-weighted MRI and 1H-Magnetic Resonance Spectroscopy in asphyxiated full-term neonates. Biol Neonate. 2005;88(4):306-312.
113. Ashwal S., Holshouser B.A., Tomasi L.G., et al. 1H-magnetic resonance spectroscopy-determined cerebral lactate and poor neurological outcomes in children with central nervous system disease. Ann Neurol. 1997;41(4):470-481.
114. Auld K.L., Ashwal S., Holshouser B.A., et al. Proton magnetic resonance spectroscopy in children with acute central nervous system injury. Pediatr Neurol. 1995;12(4):323-334.
115. Soul J.S., du Plessis A.J. New technologies in pediatric neurology. Near-infrared spectroscopy. Semin Pediatr Neurol. 1999;6(2):101-110.
116. Cohn S.M., Varela J.E., Giannotti G., et al. Splanchnic perfusion evaluation during hemorrhage and resuscitation with gastric near-infrared spectroscopy. J Trauma. 2001;50(4):629-634.
117. Kurth C.D., Steven J.L., Montenegro L.M., et al. Cerebral oxygen saturation before congenital heart surgery. Ann Thorac Surg. 2001;72(1):187-192.
118. Austin E.H.3rd, Edmonds H.L.Jr., Auden S.M., et al. Benefit of neurophysiologic monitoring for pediatric cardiac surgery. J Thorac Cardiovasc Surg. 1997;114(5):707-715.
119. Toet M.C., Lemmers P.M., van Schelven L.J., et al. Cerebral oxygenation and electrical activity after birth asphyxia: their relation to outcome. Pediatrics. 2006;117(2):333-339.
120. Cairns C.B., Moore F.A., Haenel J.B., et al. Evidence for early supply independent mitochondrial dysfunction in patients developing multiple organ failure after trauma. J Trauma. 1997;42(3):532-536.
121. McKinley B.A., Marvin R.G., Cocanour C.S., et al. Tissue hemoglobin O2 saturation during resuscitation of traumatic shock monitored using near infrared spectrometry. J Trauma. 2000;48(4):637-642.
122. Duncan A., Meek J.H., Clemence M., et al. Measurement of cranial optical path length as a function of age using phase resolved near infrared spectroscopy. Pediatr Res. 1996;39(5):889-894.
123. Thavasothy M., Broadhead M., Elwell C., et al. A comparison of cerebral oxygenation as measured by the NIRO 300 and the INVOS 5100 Near-Infrared Spectrophotometers. Anaesthesia. 2002;57(10):999-1006.
124. Madsen P.L., Skak C., Rasmussen A., et al. Interference of cerebral near-infrared oximetry in patients with icterus. Anesth Analg. 2000;90(2):489-493.
125. Zauner A., Doppenberg E.M., Woodward J.J., et al. Continuous monitoring of cerebral substrate delivery and clearance: initial experience in 24 patients with severe acute brain injuries. Neurosurgery. 1997;41(5):1082-1091.
126. Dullenkopf A., Kolarova A., Schulz G., et al. Reproducibility of cerebral oxygenation measurement in neonates and infants in the clinical setting using the NIRO 300 oximeter. Pediatr Crit Care Med. 2005;6(3):344-347.
127. Nagdyman N., Fleck T., Schubert S., et al. Comparison between cerebral tissue oxygenation index measured by near-infrared spectroscopy and venous jugular bulb saturation in children. Intensive Care Med. 2005;31(6):846-850.
128. Tortoriello T.A., Stayer S.A., Mott A.R., et al. A noninvasive estimation of mixed venous oxygen saturation using near-infrared spectroscopy by cerebral oximetry in pediatric cardiac surgery patients. Paediatr Anaesth. 2005;15(6):495-503.
129. Weiss M., Dullenkopf A., Kolarova A., et al. Near-infrared spectroscopic cerebral oxygenation reading in neonates and infants is associated with central venous oxygen saturation. Paediatr Anaesth. 2005;15(2):102-109.
130. Brawanski A., Faltermeier R., Rothoerl R.D., et al. Comparison of near-infrared spectroscopy and tissue p(O2) time series in patients after severe head injury and aneurysmal subarachnoid hemorrhage. J Cereb Blood Flow Metab. 2002;22(5):605-611.
131. Shimizu N., Gilder F., Bissonnette B., et al. Brain tissue oxygenation index measured by near infrared spatially resolved spectroscopy agreed with jugular bulb oxygen saturation in normal pediatric brain: a pilot study. Childs Nerv Syst. 2005;21(3):181-184.
132. Schenkman K.A., Marble D.R., Burns D.H., et al. Myoglobin oxygen dissociation by multiwavelength spectroscopy. J Appl Physiol. 1997;82(1):86-92.
133. Arakaki L.S.L., Burns D.H., Kushmerick M.J. Accurate myoglobin oxygen saturation by optical spectroscopy measured in blood-perfused rat muscle. Appl Spectrosc. 2007;61(9):978-985.
134. Arakaki L.S.L., Burns D.H. Multispectral analysis for quantitative measurements of myoglobin oxygen fractional saturation in the presence of hemoglobin interference. Appl Spectrosc. 1992;46(12):1919-1927.
135. Schenkman K.A., Marble D.R., Burns D.H., et al. Optical spectroscopic method for in vivo measurement of cardiac myoglobin oxygen saturation. Appl Spectrosc. 1999;53(3):332-338.
136. Schenkman K.A., Marble D.R., Feigl E.O., et al. Near-infrared spectroscopic measurement of myoglobin oxygen saturation in the presence of hemoglobin using partial least-squares analysis. Appl Spectrosc. 1999;53(3):325-331.
137. Arakaki L.S.L., Kushmerick M.J., Burns D.H. Myoglobin oxygen saturation measured independently of hemoglobin in scattering media by optical reflectance spectroscopy. Appl Spectrosc. 1996;50(6):697-707.
138. Schenkman K.A., Beard D.A., Ciesielski W.A., et al. Comparison of buffer and red blood cell perfusion of guinea pig heart oxygenation. Am J Physiol Heart Circ Physiol. 2003;285(5):H1819-H1825.
139. Marcinek D.J., Ciesielski W.A., Conley K.E., et al. Oxygen regulation and limitation to cellular respiration in mouse skeletal muscle in vivo. Am J Physiol Heart Circ Physiol. 2003;285(5):H1900-1908.
140. Marcinek D.J., Schenkman K.A., Ciesielski W.A., et al. Mitochondrial coupling in vivo in mouse skeletal muscle. Am J Physiol Cell Physiol. 2004;286(2):C457-C463.
141. Schenkman K.A. Cytochrome c oxidation determined by multiwavelength optical spectral analysis in the isolated perfused heart. Proc SPIE. 2002;4613:278-285.
142. Schenkman K.A., Yan S. Propofol impairment of mitochondrial respiration in isolated perfused guinea pig hearts determined by reflectance spectroscopy. Crit Care Med. 2000;28(1):172-177.
143. Ferrari M., Mottola L., Quaresima V. Principles, techniques, and limitations of near infrared spectroscopy. Can J Appl Physiol. 2004;29(4):463-487.
144. McCully K.K., Hamaoka T. Near-infrared spectroscopy: what can it tell us about oxygen saturation in skeletal muscle? Exerc Sport Sci Rev. 2000;28(3):123-127.
145. Bond R.F., Manley E.S.Jr., Green H.D. Cutaneous and skeletal muscle vascular responses to hemorrhage and irreversible shock. Am J Physiol. 1967;212(2):488-497.
146. Peitzman A.B., Billiar T.R., Harbrecht B.G., et al. Hemorrhagic shock. Curr Probl Surg. 1995;32(11):925-1002.
147. Wo C.C., Shoemaker W.C., Appel P.L., et al. Unreliability of blood pressure and heart rate to evaluate cardiac output in emergency resuscitation and critical illness. Crit Care Med. 1993;21(2):218-223.
148. Dunham C.M., Siegel J.H., Weireter L., et al. Oxygen debt and metabolic acidemia as quantitative predictors of mortality and the severity of the ischemic insult in hemorrhagic shock. Crit Care Med. 1991;19(2):231-243.
149. Rixen D., Raum M., Holzgraefe B., et al. A pig hemorrhagic shock model: oxygen debt and metabolic acidemia as indicators of severity. Shock. 2001;16(3):239-244.
150. Siegel J.H., Fabian M., Smith J.A., et al. Oxygen debt criteria quantify the effectiveness of early partial resuscitation after hypovolemic hemorrhagic shock. J Trauma. 2003;54(5):862-880.
151. Pope A.M. Fluid resuscitation: state of the science for treating combat casualties and civilian injuries. Washington, DC: National Academy Press; 1999.
152. Gutierrez G., Reines H.D., Wulf-Gutierrez M.E. Clinical review: hemorrhagic shock. Crit Care. 2004;8(5):373-381.
153. Porter J.M., Ivatury R.R. In search of the optimal end points of resuscitation in trauma patients: a review. J Trauma. 1998;44(5):908-914.
154. Blow O., Magliore L., Claridge J.A., et al. The golden hour and the silver day: detection and correction of occult hypoperfusion within 24 hours improves outcome from major trauma. J Trauma. 1999;47(5):964-969.
155. Cohn S.M., Nathens A.B., Moore F.A., et al. Tissue oxygen saturation predicts the development of organ dysfunction during traumatic shock resuscitation. J Trauma. 2007;62(1):44-54.
156. McCully K.K., Smith S., Rajaei S., et al. Muscle metabolism with blood flow restriction in chronic fatigue syndrome. J Appl Physiol. 2004;96(3):871-878.
157. Sako T., Hamaoka T., Higuchi H., et al. Validity of NIR spectroscopy for quantitatively measuring muscle oxidative metabolic rate in exercise. J Appl Physiol. 2001;90(1):338-344.
158. Yang Y., Soyemi O.O., Scott P.J., et al. Quantitative measurement of muscle oxygen saturation without influence from skin and fat using continuous-wave near infrared spectroscopy. Opt Express. 2007;15(21):13715-13730.
159. Soller B.R., Ryan K.L., Rickards C.A., et al. Oxygen saturation determined from deep muscle, not thenar tissue, is an early indicator of central hypovolemia in humans. Crit Care Med. 2008;36(1):176-182.
160. Crouser E.D., Julian M.W., Huff J.E., et al. Carbamoyl phosphate synthase-1: a marker of mitochondrial damage and depletion in the liver during sepsis. Crit Care Med. 2006;34(9):2439-2446.
161. Barcroft J. On anoxaemia. Lancet. 1920;196(5062):485-489.
162. Fink M.P. Cytopathic hypoxia in sepsis. Acta Anaesthesiol Scand Suppl. 1997;110:87-95.
163. Robin E.D. Special report: dysoxia. Abnormal tissue oxygen utilization. Arch Intern Med. 1977;137(7):905-910.
164. Connett R.J., Honig C.R., Gayeski T.E., et al. Defining hypoxia: a systems view of VO2, glycolysis, energetics, and intracellular PO2. J Appl Physiol. 1990;68(3):833-842.
165. Brosnan J.T. Comments on metabolic needs for glucose and the role of gluconeogenesis. Eur J Clin Nutr. 1999;53(Suppl 1):S107-111.
166. Gladden L.B. Lactate metabolism: a new paradigm for the third millennium. J Physiol. 2004;558(Pt 1):5-30.
167. Vincent J.L., De Backer D. Oxygen transport-the oxygen delivery controversy. Intensive Care Med. 2004;30(11):1990-1996.
168. De Backer D. VO2/DO2 relationship: how to get rid of methodological pitfalls? Intensive Care Med. 2000;26(12):1719-1722.
169. Legrand M., Mik E.G., Johannes T., et al. Renal hypoxia and dysoxia after reperfusion of the ischemic kidney. Mol Med. 2008;14(7-8):502-516.
170. Raurich J.M., Perez O., Llompart-Pou J.A., et al. Incidence and outcome of ischemic hepatitis complicating septic shock. Hepatol Res. 2009;39(7):700-705.
171. Vollmar B., Menger M.D. The hepatic microcirculation: mechanistic contributions and therapeutic targets in liver injury and repair. Physiol Rev. 2009;89(4):1269-1339.
172. Strassburg C.P. Gastrointestinal disorders of the critically ill. Shock liver. Best Pract Res Clin Gastroenterol. 2003;17(3):369-381.
173. Goldman D. Theoretical models of microvascular oxygen transport to tissue. Microcirculation. 2008;15(8):795-811.
174. Knotzer H., Pajk W., Dunser M.W., et al. Regional microvascular function and vascular reactivity in patients with different degrees of multiple organ dysfunction syndrome. Anesth Analg. 2006;102(4):1187-1193.
175. Ince C.The microcirculation is the motor of sepsis Crit Care 9 2005:Suppl 4;S13-19
176. Lehr H.A., Bittinger F., Kirkpatrick C.J. Microcirculatory dysfunction in sepsis: a pathogenetic basis for therapy? J Pathol. 2000;190(3):373-386.
177. Bateman R.M., Walley K.R.Microvascular resuscitation as a therapeutic goal in severe sepsis Crit Care 2005:9 Suppl 4;S27-32
178. Spronk P.E., Zandstra D.F., Ince C. Bench-to-bedside review: sepsis is a disease of the microcirculation. Crit Care. 2004;8(6):462-468.
179. Ince C., Sinaasappel M. Microcirculatory oxygenation and shunting in sepsis and shock. Crit Care Med. 1999;27(7):1369-1377.
180. Bateman R.M., Sharpe M.D., Ellis C.G. Bench-to-bedside review: microvascular dysfunction in sepsis–hemodynamics, oxygen transport, and nitric oxide. Crit Care. 2003;7(5):359-373.
181. Alamdari N., Constantin-Teodosiu D., Murton A.J., et al. Temporal changes in the involvement of pyruvate dehydrogenase complex in muscle lactate accumulation during lipopolysaccharide infusion in rats. J Physiol. 2008;586(6):1767-1775.
182. Vary T.C., Hazen S. Sepsis alters pyruvate dehydrogenase kinase activity in skeletal muscle. Mol Cell Biochem. 1999;198(1-2):113-118.
183. Vincent J.L., Zhang H., Szabo C., et al. Effects of nitric oxide in septic shock. Am J Respir Crit Care Med. 2000;161(6):1781-1785.
184. Cauwels A. Nitric oxide in shock. Kidney Int. 2007;72(5):557-565.
185. Baumgart K., Radermacher P., Wagner F. Applying gases for microcirculatory and cellular oxygenation in sepsis: effects of nitric oxide, carbon monoxide, and hydrogen sulfide. Curr Opin Anaesthesiol. 2009;22(2):168-176.
186. Cooper C.E., Brown G.C. The inhibition of mitochondrial cytochrome oxidase by the gases carbon monoxide, nitric oxide, hydrogen cyanide and hydrogen sulfide: chemical mechanism and physiological significance. J Bioenerg Biomembr. 2008;40(5):533-539.
187. Kuhnle S., Nicotera P., Wendel A., et al. Prevention of endotoxin-induced lethality, but not of liver apoptosis in poly(ADP-ribose) polymerase-deficient mice. Biochem Biophys Res Commun. 1999;263(2):433-438.
188. Oliver F.J., Menissier-de Murcia J., Nacci C., et al. Resistance to endotoxic shock as a consequence of defective NF-kappaB activation in poly (ADP-ribose) polymerase-1 deficient mice. EMBO J. 1999;18(16):4446-4454.
189. Trost L.C., Lemasters J.J. Role of the mitochondrial permeability transition in salicylate toxicity to cultured rat hepatocytes: implications for the pathogenesis of Reye’s syndrome. Toxicol Appl Pharmacol. 1997;147(2):431-441.
190. Nulton-Persson A.C., Szweda L.I., Sadek H.A. Inhibition of cardiac mitochondrial respiration by salicylic acid and acetylsalicylate. J Cardiovasc Pharmacol. 2004;44(5):591-595.
191. Iyer V.N., Hoel R., Rabinstein A.A. Propofol infusion syndrome in patients with refractory status epilepticus: an 11-year clinical experience. Crit Care Med. 2009;37(12):3024-3030.
192. Branca D., Roberti M.S., Vincenti E., et al. Uncoupling effect of the general anesthetic 2,6-diisopropylphenol in isolated rat liver mitochondria. Arch Biochem Biophys. 1991;290(2):517-521.
193. Stevanato R., Momo F., Marian M., et al. Combined effect of propofol and GSNO on oxidative phosphorylation of isolated rat liver mitochondria. Nitric Oxide. 2001;5(2):158-165.
194. Rigoulet M., Devin A., Averet N., et al. Mechanisms of inhibition and uncoupling of respiration in isolated rat liver mitochondria by the general anesthetic 2,6-diisopropylphenol. Eur J Biochem. 1996;241(1):280-285.
195. Fudickar A., Bein B. Propofol infusion syndrome: update of clinical manifestation and pathophysiology. Minerva Anestesiol. 2009;75(5):339-344.
196. Hotchkiss R.S., Karl I.E. The pathophysiology and treatment of sepsis. N Engl J Med. 2003;348(2):138-150.
197. Harrois A., Huet O., Duranteau J. Alterations of mitochondrial function in sepsis and critical illness. Curr Opin Anaesthesiol. 2009;22(2):143-149.