Chapter 11 Cell Signaling Analysis
 Introduction
Signaling pathways in normal cells consist of growth and controlling messages from the outer surface deep into the nucleus. In the nucleus, the cell cycle clock collects different messages, which are used to determine when the cell should divide. Cancer cells often proliferate excessively because genetic mutations cause induction of stimulatory pathways and issue too many “go ahead” signals, or the inhibitory pathways can no longer control the stimulatory pathways.1
 The Cell Cycle
A scheme of the classic cell cycle is shown in Figure 11-1. The cell cycle compartments are drawn such that their horizontal position reflects their respective DNA content. Cells that contain only one complement of DNA from each parent (2C) are referred to as diploid cells. Cells that have duplicated their genome, and thus have 4C amounts of DNA, are called tetraploid cells.
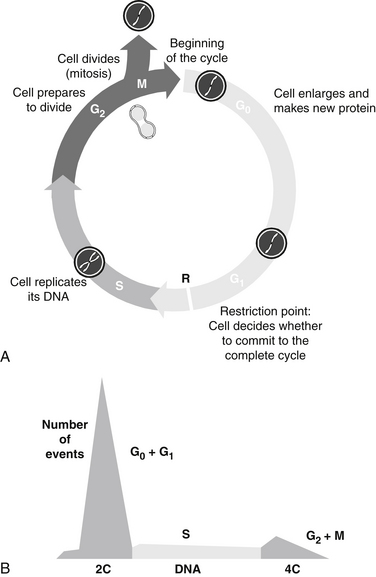
FIGURE 11-1 Stages of cell cycle (G0, G1, S, G2, and M phases) (A) and DNA histogram (B) generated by flow cytometry.
The cell cycle is classically divided into the following phases:
The enlarged parent cell finally reaches the point where it divides in half to produce its two daughters, each of which is endowed with a complete set of chromosomes. The new daughter cells immediately enter G1 and may go through the full cycle again. Alternatively, they may stop cycling temporarily or permanently.2–4 Telomeres, condensed chromatin caps on the ends of chromosomes, dictate the ultimate number of cell divisions that can occur. With each cell division, the telomeres shorten, ultimately to the point that disallows further mitosis. Thus, telomeres are considered to be the “mitotic clock.” Telomere shortening is linked to aging, age-associated diseases, including cancer, coronary artery disease, and heart failure. Cell proliferation capacity, the cellular environment, and epigenetic factors affect telomere length and therefore cells’ mitotic capacity.
Telomere length can be assessed and is available as a clinical test. The telomere length is reported as a telomere score, which is a calculation of the telomere length derived from nucleated white blood cells. This result is then compared with the average telomere length of similar aged sample population. This information can be utilized to prioritize interventions that increase telomere length, such as dietary, stress reduction, antioxidant, and vitamin therapies.5
Another influence on the cell cycle clock is circadian rhythms, or circadian clock. The circadian clock is the result of molecular clocks in each cell, circadian physiology, and ultimately, the suprachiasmatic nuclei in the hypothalamus. The circadian clock regulates the activity and expression of cell cycle check point related proteins and, in turn, these check points regulate circadian clock proteins. This has significant clinical implications, particularly in the area of cancer treatment. Both the toxicity and efficacy of cytotoxic agents can vary by more than 50% as a function of when they are dosed in experimental models.6 The administration of cytotoxic agents in accordance with the circadian induced activity of the target cells is gaining ground as a reasonable therapeutic approach.
 Flow Cytometry to Assess Cell Cycle Status
 Clinical Application
Patients Exposed to Carcinogenic Chemicals and Patients with Chronic Fatigue Syndrome
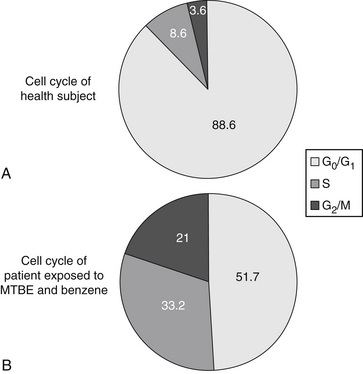
To determine whether peripheral blood lymphocytes (PBLs) isolated from individuals with chronic fatigue syndrome (CFS) and chemically exposed patients represent a discrete block in cell cycle progression, PBLs isolated from CFS and control individuals were cultured, harvested, fixed, stained with propidium iodide, and analyzed by flow cytometry. The nonapoptotic cell population in PBL isolated from CFS individuals consisted of cells arrested in the late S and G2/M boundaries, compared with healthy controls. The arrest was characterized by increased S and G2/M phases of the cell cycle (from 9% to 33% and from 4% to 21%, respectively) (Table 11-1 and Figure 11-2) at the expense of G0/G1. Such an abnormality in cell cycle progression indicates abnormal mitotic cell division in patients who have been exposed to chemicals and who have CFS. From these results, we concluded that PBLs of patients with chemical exposure and CFS grow inappropriately, not only because the signaling pathways in cells are perturbed, but also because the cell cycle clock becomes deranged and stimulatory messages become greater than the inhibitory pathways.7,8
TABLE 11-1 Percentage of Different Phases of Cell Cycle in Healthy Controls and Patients Exposed to Chemicals
| PHASE | HEALTHY CONTROLS | CHEMICALLY EXPOSED |
|---|---|---|
| G0/G1 | 88.6 ± 1.4 | 51.7 ± 2.4 |
| S | 8.6 ± 1.2 | 33.2 ± 4.3 |
| G2/M | 3.6 ± 0.82 | 21.0 ± 2.6 |
However, to limit cell proliferation and avoid cancer, the human body equips cells with certain backup systems that guard against runaway division. One such backup system present in lymphocytes of CFS patients provokes the cell to undergo apoptosis. This programmed cell death occurs if some of the cell’s essential components are deregulated or damaged. For example, injury to chromosomal DNA can trigger apoptosis.1,7,8
1. Weinberg R.A. How cancer arises. Sci Am. 1996;275:62–70.
2. Wheeless L.L., Coon J.S., Cox C., et al. Precision of DNA flow cytometry in inter-institutional analyses. Cytometry. 1991;12:405–412.
3. Wersto R.P., Liblit R.L., Koss L.G. Flow cytometric DNA analysis of human solid tumors: a review of the interpretation of DNA histograms. Hum Pathol. 1991;22:1085–1098.
4. Shankey T.V., Rabinovitch P.S., Bagwell B., et al. Guidelines for implementation of clinical DNA cytometry. Cytometry. 1993;14:472–477.
5. Xu Q., Parks C.G., DeRoo L.A., et al. Multivitamin use and telomere length in women. Am J Clin Nutr. 2009;89(6):1857–1863.
6. Lévi F., Focan C., Karaboué A., et al. Implications of circadian clocks for the rhythmic delivery of cancer therapeutics. Adv Drug Deliv Rev. 2007;59(9-10):1015–1035.
7. Vojdani A., Ghoneum M., Choppa P.C., et al. Elevated apoptotic cell population in patients with chronic fatigue syndrome: the pivotal role of protein kinase RNA. J Intern Med. 1997;242:465–478.
8. Vojdani A., Mordechai E., Brautbar N. Abnormal apoptosis and cell cycle progression in humans exposed to methyl tertiary-butyl ether and benzene contaminating water. Human Exp Toxicol. 1997;16:485–494.
