[level-membership-for-pulmolory-and-respiratory-category]
Cardiovascular System Assessments
After reading this chapter, you will be able to:
• Describe the ECG pattern of a normal cardiac cycle, and include the following:
• Describe the characteristics of the following arrhythmias:
• Premature ventricular contractions
• Asystole (cardiac standstill)
• Describe the noninvasive hemodynamic monitoring assessments, and include the following:
• The definition of hemodynamics
• The evaluation of the patient’s heart rate, cardiac output, blood pressure, and perfusion state
• Describe the basic pathophysiologic mechanisms for the following hemodynamic changes that frequently develop during the acute stages of respiratory disease:
• Increased heart rate (pulse), cardiac output, and blood pressure
• Describe the invasive hemodynamic monitoring assessments, and include the following:
• Pulmonary artery catheter measurements
• Arterial catheter measurements
• Central venous pressure catheter measurements
• Describe how the hypoxemia, acidemia, or pulmonary vascular obstruction associated with respiratory disease alters the hemodynamic status.
• Define key terms and complete self-assessment questions at the end of the chapter and on Evolve.
Because the transport of oxygen to the tissue cells and the delivery of carbon dioxide to the lungs are functions of the cardiovascular system, a basic knowledge and understanding of (1) normal electrocardiogram (ECG) patterns, (2) common heart arrhythmias, (3) noninvasive hemodynamic monitoring assessments, (4) invasive hemodynamic monitoring assessments, and (5) determinants of cardiac output are essential components of patient assessment.*
The Electrocardiogram
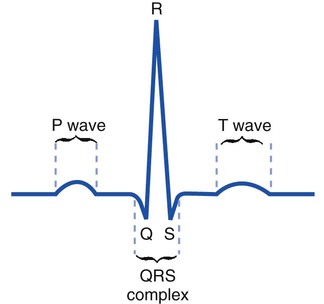
Because the respiratory care practitioner frequently works with critically ill patients who are on cardiac monitors, a basic understanding of normal and common abnormal ECG patterns is important. An ECG monitors, both visually and on recording paper, the electrical activity of the heart. Figure 6-1 illustrates the ECG pattern of a normal cardiac cycle. The P wave reflects depolarization of the atria. The QRS complex represents the depolarization of the ventricles, and the T wave represents ventricular repolarization.
Common Heart Arrhythmias†
Sinus Bradycardia
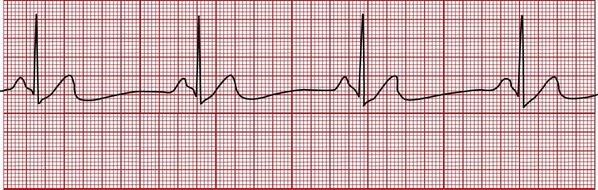
In sinus bradycardia the heart rate is less than 60 bpm. Bradycardia means “slow heart.” Sinus bradycardia has a normal P-QRS-T pattern, and the rhythm is regular (Figure 6-2). Athletes often normally demonstrate this finding because of increased cardiac stroke volume and other poorly understood mechanisms. Common pathologic causes of sinus bradycardia include a weakened or damaged sinoatrial (SA) node, severe or chronic hypoxemia, increased intracranial pressure, obstructive sleep apnea, and certain drugs (most notably the beta-blockers). Sinus bradycardia may lead to decreased cardiac output and blood pressure. In severe cases, sinus bradycardia may lead to a decreased vascular perfusion state and tissue hypoxia. The patient may demonstrate a weak or absent pulse, poor capillary refill, cold and clammy skin, and a depressed sensorium.
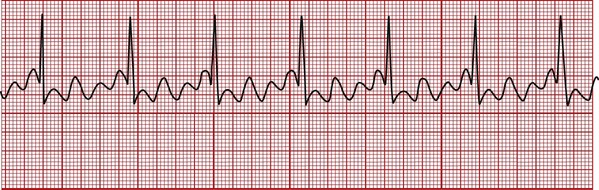
Sinus Tachycardia
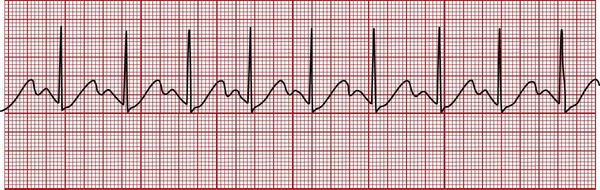
In sinus tachycardia the heart rate is greater than 100 bpm. Tachycardia means “fast heart.” Sinus tachycardia has a normal P-QRS-T pattern, and the rhythm is regular (Figure 6-3). Sinus tachycardia is the normal physiologic response to stress and exercise. Common causes of sinus tachycardia include hypoxemia, severe anemia, hyperthermia, massive hemorrhage, pain, fear, anxiety, hyperthyroidism, and sympathomimetic or parasympatholytic drug administration.
Sinus Arrhythmia
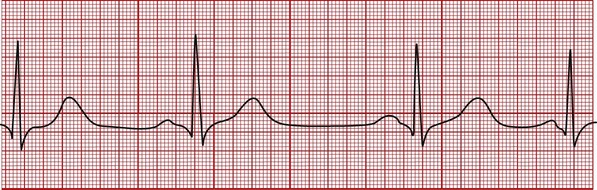
In sinus arrhythmia the heart rate varies by more than 10% from beat to beat. The P-QRS-T pattern is normal (Figure 6-4), but the interval between groups of complexes (i.e., the R-R interval) varies. Sinus arrhythmia is a normal rhythm in children and young adults. The patient’s pulse will often increase during inspiration and decrease during expiration. No treatment is required unless significant alteration occurs in the patient’s arterial blood pressure.
Atrial Flutter
In atrial flutter the normal P wave is absent and replaced by two or more regular sawtooth waves. The QRS complex is normal and the ventricular rate may be regular or irregular, depending on the relationship of the atrial to the ventricular beats. Figure 6-5 shows an atrial flutter with a regular rhythm with a 4 : 1 conduction ratio (i.e., four atrial beats for every ventricular beat). The atrial rate is usually constant, between 250 and 350 bpm, whereas the ventricular rate is in the normal range. Causes of atrial flutter include hypoxemia, a damaged SA node, and congestive heart failure.
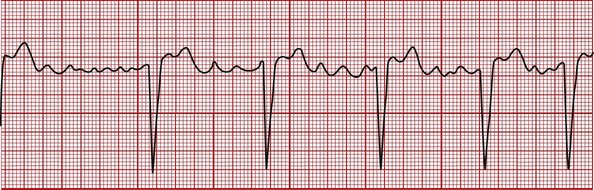
Atrial Fibrillation
In atrial fibrillation the atrial contractions are disorganized and ineffective, and the normal P wave is absent (Figure 6-6). The atrial rate ranges from 350 to 700 bpm. The QRS complex is normal, and the ventricular rate ranges from 100 to 200 bpm. Causes of atrial fibrillation include hypoxemia and a damaged SA node. Atrial fibrillation may reduce the cardiac output by 20% because of a loss of atrial filling (the so-called “atrial kick”).
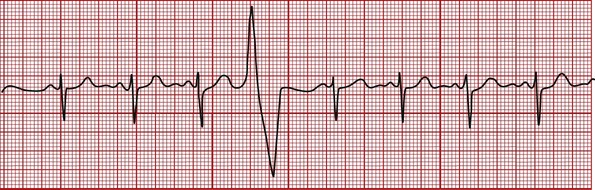
Premature Ventricular Contractions
The premature ventricular contraction (PVC) is not preceded by a P wave. The QRS complex is wide, bizarre, and unlike the normal QRS complex (Figure 6-7). The regular heart rate is altered by the PVC. The heart rhythm may be quite irregular when there are many PVCs. PVCs can occur at any rate. They often occur in pairs, after every normal heartbeat (bigeminal PVCs), and after every two normal heartbeats (trigeminal PVCs). Common causes of PVCs include intrinsic myocardial disease, hypoxemia, acidemia, hypokalemia, and congestive heart failure. PVCs also may be a sign of theophylline or alpha- or beta-agonist toxicity.
Ventricular Tachycardia
In ventricular tachycardia the P wave is generally indiscernible, and the QRS complex is wide and bizarre in appearance (Figure 6-8). The T wave may not be separated from the QRS complex. The ventricular rate ranges from 150 to 250 bpm, and the rate is regular or slightly irregular. The patient’s blood pressure is often decreased during ventricular tachycardia.
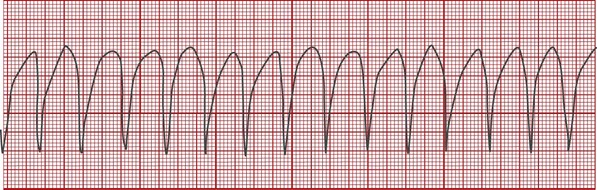
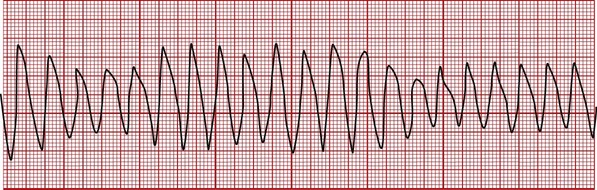
Ventricular Flutter
In ventricular flutter the QRS complex has the appearance of a wide sine wave (regular, smooth, rounded ventricular wave; Figure 6-9). The rhythm is regular or slightly irregular. The rate is 250 to 350 bpm. There is usually no discernible peripheral pulse associated with ventricular flutter.
Ventricular Fibrillation
Ventricular fibrillation is characterized by chaotic electrical activity and cardiac activity. The ventricles literally quiver out of control with no perfusion beat-producing rhythm (Figure 6-10). During ventricular fibrillation, there is no cardiac output or blood pressure, and the patient will die in minutes without treatment.
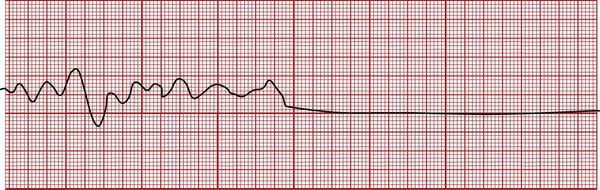
Asystole (Cardiac Standstill)
Asystole (cardiac standstill) is the complete absence of electrical and mechanical activity. As a result the cardiac output stops and the blood pressure falls to zero. The ECG tracing appears as a flat line and indicates severe damage to the heart’s electrical conduction system (see Figure 6-10). Occasionally, periods of disorganized electrical and mechanical activity may be generated during long periods of asystole; this is referred to as an agonal rhythm or a dying heart.
Invasive Hemodynamic Monitoring Assessments
Pulmonary Artery Catheter
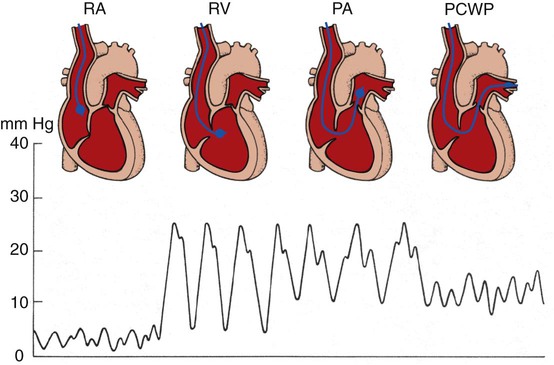
The pulmonary artery catheter (Swan-Ganz catheter) is a balloon-tipped, flow-directed catheter that is inserted at the patient’s bedside; the respiratory care professional monitors the pressure waveform as the catheter, with the balloon inflated, is guided by blood flow through the right atrium and right ventricle into the pulmonary artery (Figure 6-11). The pulmonary artery catheter is used directly to measure the right atrial pressure (via the proximal port), pulmonary artery pressure (via the distal port), left atrial pressure (indirectly via the pulmonary capillary wedge pressure), and cardiac output (via the thermodilution technique).
Central Venous Pressure Catheter
Table 6-1 summarizes the hemodynamic parameters that can be measured directly. Table 6-2 lists the hemodynamic parameters that can be calculated from results obtained from the direct measurements.
Table 6-1
Hemodynamic Values Measured Directly
| Hemodynamic Value | Abbreviation | Normal Range |
| Central venous pressure | CVP | 0-8 mm Hg |
| Right atrial pressure | RAP | 0-8 mm Hg |
| Mean pulmonary artery pressure |  |
10-20 mm Hg |
| Pulmonary capillary wedge pressure (also called pulmonary artery wedge; pulmonary artery occlusion) | PCWP | 4-12 mm Hg |
| PAW | ||
| PAO | ||
| Cardiac output | CO | 4-6 L/min |
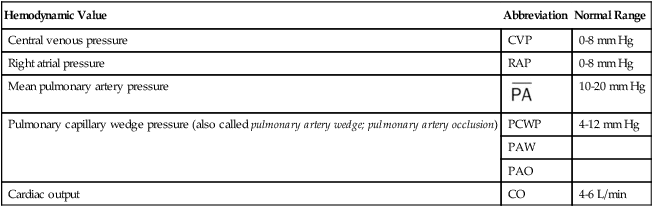
Table 6-2
Hemodynamic Values Calculated from Direct Hemodynamic Measurements
| Hemodynamic Value | Abbreviation | Normal Range |
| Stroke volume | SV | 40-80 ml |
| Stroke volume index | SVI | 40 ± ml/beat/m2 |
| Cardiac index | CI | 3.0 ± 0.5 L/min/m2 |
| Right ventricular stroke work index | RVSWI | 7-12 g/m2 |
| Left ventricular stroke work index | LVSWI | 40-60 g/m2 |
| Pulmonary vascular resistance | PVR | 50-150 dynes × sec × cm−5 |
| Systemic vascular resistance | SVR | 800-1500 dynes × sec × cm−5 |
Hemodynamic Monitoring in Respiratory Diseases
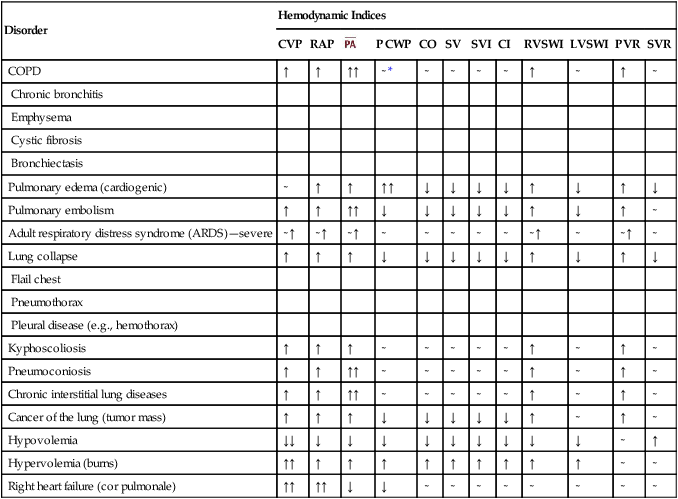
Because respiratory disorders can have a profound effect on the structure and function of the pulmonary vascular bed, right side of the heart, left side of the heart, or a combination of all three, the data generated by the previously described invasive hemodynamic monitors are commonly used in the assessment and treatment of these patients. For example, respiratory diseases associated with severe or chronic hypoxemia, acidemia, or pulmonary vascular obstruction can increase the pulmonary vascular resistance (PVR) significantly. An increased PVR, in turn, can lead to a variety of secondary hemodynamic changes such as increased CVP, RAP,  , RVSWI, and decreased CO, SV, SVI, CI, and LVSWI (see Tables 6-1 and 6-2 for abbreviation definitions). Table 6-3 lists common hemodynamic changes seen in pulmonary diseases known to alter the patient’s hemodynamic status.
Table 6-3
Hemodynamic Changes Commonly Seen in Respiratory Diseases
| Disorder | Hemodynamic Indices | |||||||||||
| CVP | RAP |  |
PCWP | CO | SV | SVI | CI | RVSWI | LVSWI | PVR | SVR | |
| COPD | ↑ | ↑ | ↑↑ | ∼* | ∼ | ∼ | ∼ | ∼ | ↑ | ∼ | ↑ | ∼ |
| Chronic bronchitis | ||||||||||||
| Emphysema | ||||||||||||
| Cystic fibrosis | ||||||||||||
| Bronchiectasis | ||||||||||||
| Pulmonary edema (cardiogenic) | ∼ | ↑ | ↑ | ↑↑ | ↓ | ↓ | ↓ | ↓ | ↑ | ↓ | ↑ | ↓ |
| Pulmonary embolism | ↑ | ↑ | ↑↑ | ↓ | ↓ | ↓ | ↓ | ↓ | ↑ | ↓ | ↑ | ∼ |
| Adult respiratory distress syndrome (ARDS)—severe | ∼↑ | ∼↑ | ∼↑ | ∼ | ∼ | ∼ | ∼ | ∼ | ∼↑ | ∼ | ∼↑ | ∼ |
| Lung collapse | ↑ | ↑ | ↑ | ↓ | ↓ | ↓ | ↓ | ↓ | ↑ | ↓ | ↑ | ↓ |
| Flail chest | ||||||||||||
| Pneumothorax | ||||||||||||
| Pleural disease (e.g., hemothorax) | ||||||||||||
| Kyphoscoliosis | ↑ | ↑ | ↑ | ∼ | ∼ | ∼ | ∼ | ∼ | ↑ | ∼ | ↑ | ∼ |
| Pneumoconiosis | ↑ | ↑ | ↑↑ | ∼ | ∼ | ∼ | ∼ | ∼ | ↑ | ∼ | ↑ | ∼ |
| Chronic interstitial lung diseases | ↑ | ↑ | ↑↑ | ∼ | ∼ | ∼ | ∼ | ∼ | ↑ | ∼ | ↑ | ∼ |
| Cancer of the lung (tumor mass) | ↑ | ↑ | ↑ | ↓ | ↓ | ↓ | ↓ | ↓ | ↑ | ∼ | ↑ | ∼ |
| Hypovolemia | ↓↓ | ↓ | ↓ | ↓ | ↓ | ↓ | ↓ | ↓ | ↓ | ↓ | ∼ | ↑ |
| Hypervolemia (burns) | ↑↑ | ↑ | ↑ | ↑ | ↑ | ↑ | ↑ | ↑ | ↑ | ↑ | ∼ | ∼ |
| Right heart failure (cor pulmonale) | ↑↑ | ↑↑ | ↓ | ↓ | ∼ | ∼ | ∼ | ∼ | ∼ | ∼ | ∼ | ∼ |
*See Appendix XV for an example of a cardiopulmonary profile sheet used to monitor the hemodynamic status of the critically ill patient.
†For a complete review of common heart arrhythmias see Des Jardins T: Cardiopulmonary anatomy and physiology: essentials of respiratory care, ed 5, 2008, Cengage/Delmar Learning.
[/level-membership-for-pulmolory-and-respiratory-category][not-level-membership-for-pulmolory-and-respiratory-category]
Cardiovascular System Assessments
After reading this chapter, you will be able to:
• Describe the ECG pattern of a normal cardiac cycle, and include the following:
• Describe the characteristics of the following arrhythmias:
• Premature ventricular contractions
• Asystole (cardiac standstill)
• Describe the noninvasive hemodynamic monitoring assessments, and include the following:
• The definition of hemodynamics
• The evaluation of the patient’s heart rate, cardiac output, blood pressure, and perfusion state
• Describe the basic pathophysiologic mechanisms for the following hemodynamic changes that frequently develop during the acute stages of respiratory disease:
• Increased heart rate (pulse), cardiac output, and blood pressure
• Describe the invasive hemodynamic monitoring assessments, and include the following:
• Pulmonary artery catheter measurements
• Arterial catheter measurements
• Central venous pressure catheter measurements
• Describe how the hypoxemia, acidemia, or pulmonary vascular obstruction associated with respiratory disease alters the hemodynamic status.
• Define key terms and complete self-assessment questions at the end of the chapter and on Evolve.
Because the transport of oxygen to the tissue cells and the delivery of carbon dioxide to the lungs are functions of the cardiovascular system, a basic knowledge and understanding of (1) normal electrocardiogram (ECG) patterns, (2) common heart arrhythmias, (3) noninvasive hemodynamic monitoring assessments, (4) invasive hemodynamic monitoring assessments, and (5) determinants of cardiac output are essential components of patient assessment.*
The Electrocardiogram
Because the respiratory care practitioner frequently works with critically ill patients who are on cardiac monitors, a basic understanding of normal and common abnormal ECG patterns is important. An ECG monitors, both visually and on recording paper, the electrical activity of the heart. Figure 6-1 illustrates the ECG pattern of a normal cardiac cycle. The P wave reflects depolarization of the atria. The QRS complex represents the depolarization of the ventricles, and the T wave represents ventricular repolarization.
Common Heart Arrhythmias†
Sinus Bradycardia
In sinus bradycardia the heart rate is less than 60 bpm. Bradycardia means “slow heart.” Sinus bradycardia has a normal P-QRS-T pattern, and the rhythm is regular (Figure 6-2). Athletes often normally demonstrate this finding because of increased cardiac stroke volume and other poorly understood mechanisms. Common pathologic causes of sinus bradycardia include a weakened or damaged sinoatrial (SA) node, severe or chronic hypoxemia, increased intracranial pressure, obstructive sleep apnea, and certain drugs (most notably the beta-blockers). Sinus bradycardia may lead to decreased cardiac output and blood pressure. In severe cases, sinus bradycardia may lead to a decreased vascular perfusion state and tissue hypoxia. The patient may demonstrate a weak or absent pulse, poor capillary refill, cold and clammy skin, and a depressed sensorium.
Sinus Tachycardia
In sinus tachycardia the heart rate is greater than 100 bpm. Tachycardia means “fast heart.” Sinus tachycardia has a normal P-QRS-T pattern, and the rhythm is regular (Figure 6-3). Sinus tachycardia is the normal physiologic response to stress and exercise. Common causes of sinus tachycardia include hypoxemia, severe anemia, hyperthermia, massive hemorrhage, pain, fear, anxiety, hyperthyroidism, and sympathomimetic or parasympatholytic drug administration.
Sinus Arrhythmia
In sinus arrhythmia the heart rate varies by more than 10% from beat to beat. The P-QRS-T pattern is normal (Figure 6-4), but the interval between groups of complexes (i.e., the R-R interval) varies. Sinus arrhythmia is a normal rhythm in children and young adults. The patient’s pulse will often increase during inspiration and decrease during expiration. No treatment is required unless significant alteration occurs in the patient’s arterial blood pressure.
Atrial Flutter
In atrial flutter the normal P wave is absent and replaced by two or more regular sawtooth waves. The QRS complex is normal and the ventricular rate may be regular or irregular, depending on the relationship of the atrial to the ventricular beats. Figure 6-5 shows an atrial flutter with a regular rhythm with a 4 : 1 conduction ratio (i.e., four atrial beats for every ventricular beat). The atrial rate is usually constant, between 250 and 350 bpm, whereas the ventricular rate is in the normal range. Causes of atrial flutter include hypoxemia, a damaged SA node, and congestive heart failure.
Atrial Fibrillation
In atrial fibrillation the atrial contractions are disorganized and ineffective, and the normal P wave is absent (Figure 6-6). The atrial rate ranges from 350 to 700 bpm. The QRS complex is normal, and the ventricular rate ranges from 100 to 200 bpm. Causes of atrial fibrillation include hypoxemia and a damaged SA node. Atrial fibrillation may reduce the cardiac output by 20% because of a loss of atrial filling (the so-called “atrial kick”).
Premature Ventricular Contractions
The premature ventricular contraction (PVC) is not preceded by a P wave. The QRS complex is wide, bizarre, and unlike the normal QRS complex (Figure 6-7). The regular heart rate is altered by the PVC. The heart rhythm may be quite irregular when there are many PVCs. PVCs can occur at any rate. They often occur in pairs, after every normal heartbeat (bigeminal PVCs), and after every two normal heartbeats (trigeminal PVCs). Common causes of PVCs include intrinsic myocardial disease, hypoxemia, acidemia, hypokalemia, and congestive heart failure. PVCs also may be a sign of theophylline or alpha- or beta-agonist toxicity.
Ventricular Tachycardia
In ventricular tachycardia the P wave is generally indiscernible, and the QRS complex is wide and bizarre in appearance (Figure 6-8). The T wave may not be separated from the QRS complex. The ventricular rate ranges from 150 to 250 bpm, and the rate is regular or slightly irregular. The patient’s blood pressure is often decreased during ventricular tachycardia.
[/not-level-membership-for-pulmolory-and-respiratory-category]
