CHAPTER 4 CARDIOVASCULAR SYSTEM
SHOCK
Clinical features
 Hyperdynamic shock: Warm, pink, vasodilated, a tachycardia, with high cardiac output and hypotension. (typical of septic shock, see p. 33)
 Hypodynamic shock: Cold, grey, sweaty, vasoconstricted, peripherally shut down with low cardiac output, blood pressure may be relatively well maintained (typical of cardiac shock, see p. 108).
Other features of shock may include an increased or decreased core temperature, hypoventilation or hyperventilation, renal and hepatic dysfunction, disseminated intravascular coagulation, and altered mental status. (See Systemic inflammatory response syndrome, p. 326 and Multiorgan dysfunction syndrome, p. 327.) The young fit patient with an adequate cardiac reserve may well be able to initially compensate for the pathophysiological disturbances leading to shock. Consequently, shock occurring in an otherwise fit young person often represents a greater physiological disturbance or a later stage of illness as compared with the situation in an elderly patient, in whom conditions such as fixed cardiac output, peripheral and coronary artery disease and reduced organ function reduce the ‘physiological reserve’.
Aetiology
The aetiology of shock is frequently multifactorial. Typical causes are listed in Table 4.1. Although all causes of shock are seen on the ICU, the commonest in practice is septic shock (see Septic shock, p. 331).
| Classification | Underlying cause |
|---|---|
| Hypovolaemia | Dehydration Haemorrhage Burns Sepsis Increased capillary permeability |
| Cardiogenic | Myocardial infarction/ischaemia Valve disruption Myocardial rupture (e.g. VSD) |
| Mechanical/obstructive | Pulmonary embolism Cardiac tamponade Tension pneumothorax |
| Altered systemic vascular resistance | Sepsis Severe anaemia Anaphylaxis Addisonian crisis |
* Note, more than one cause may be present in an individual patient.


OXYGEN DELIVERY AND OXYGEN CONSUMPTION

Oxygen consumption (VO2)
 O2).
O2).
If cardiac index is used in the above calculations (see below), then oxygen delivery and oxygen consumption can also be expressed as an index relative to body surface area. Typical normal values are shown in Table 4.2.
TABLE 4.2 Typical adult values for oxygen delivery and oxygen consumption
| Oxygen delivery | 1000 mL / min |
| Oxygen delivery index DO2I | 550 mL / min / m2 |
| Oxygen consumption VO2 | 250 mL / min |
| Oxygen consumption index VO2I | 150 mL / min / m2 |
Optimizing oxygen delivery
From the formula for oxygen delivery above, it follows that oxygen delivery can be improved by:


Optimizing haemoglobin
Since haemoglobin (Hb) carries oxygen to the tissues, one might assume that raising a patient’s Hb to 15 g / dL might provide optimal oxygen delivery. However, clinical studies have not confirmed that raising the haemoglobin concentration improves outcome and indeed, the opposite is likely to be true. Evidence from the Canadian Multicentre Clinical Trials Group suggests that restrictive transfusion strategies produce the best outcome in critically ill patients and that the optimal level in most cases is a Hb of 8–10 g / dL. (See Indications for blood transfusion, p. 246.) This study excluded patients, however, with significant coronary artery and vascular disease, who may benefit from a higher Hb. If in doubt about optimal haemoglobin for an individual patient, seek senior advice.
 O2)
O2) cO2) has been shown to correlate with the true S
 O2 sufficiently closely to be used almost interchangeably in clinical practice.
 O2 or S
 cO2 has been shown to improve outcome by reducing the severity of organ failure and the duration of intensive care. Normal S
 O2 is 55–75%. Values below this imply inadequate oxygen delivery. Values above this imply either supranormal oxygen delivery or reduced oxygen consumption. Conditions that may result in impaired oxygen consumption include sepsis, metabolic poisoning and widespread cellular death.
 Despite apparently optimal oxygen delivery, guided by S
 O2 or S
 cO2 differences in regional perfusion may still result in some tissues receiving inadequate perfusion and oxygen delivery. The splanchnic circulation is, for example, at particular risk of hypoperfusion.
CARDIAC OUTPUT

In order to take account of patient size, cardiac output is usually expressed as cardiac index (CI), which is the CO divided by the patient’s body surface area (BSA). BSA can be derived from a patient’s height and weight using nomograms. In practice, however, height and weight are usually entered directly into monitoring systems and all necessary calculations performed automatically. Typical values are shown in Table 4.3.
| Cardiac output (CO) | 4–6 L/min |
| Cardiac index (CI) | 2.5–3.5 L / min / m2 |
The factors that affect cardiac output are discussed below.
Stroke volume (SV)
Preload
This is defined as the ventricular wall tension at the end of diastole. In simple terms preload refers to the degree of ventricular filling. According to the Frank–Starling law of the heart, the greater the degree of ventricular filling, the greater the force of myocardial contraction and thus SV. Above a certain point, however, the ventricle becomes over-stretched and further filling may result in a fall in SV. Heart failure and pulmonary oedema may then develop (see Fig. 4.1).
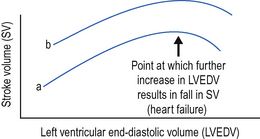
Contractility
This represents the ability of the heart to work independent of the preload and afterload. Increased contractility, as, for example produced by inotropes, results in increased SV for the same preload (see Fig. 4.1). Decreased contractility may result from intrinsic heart disease, or from the myocardial depressant effects of acidosis, hypoxia and disease processes, e.g. sepsis.
Pressure–volume–flow loops
A more recent approach to understanding the interdependency of preload contractility and afterload and the effects thereof, on cardiac output and stroke volume, is to consider pressure–volume–flow loops of the left ventricle (see Fig. 4.2).
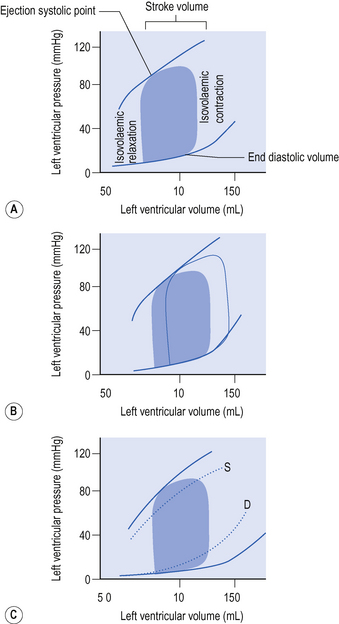
Assuming contractility is unchanged, the ejection systolic point at the end of any heart beat will fall along a curve. Changes in contractility will shift the position of this curve (Fig. 4.2). Increased contractility for example as a result of inotropic drugs, shifts the curve upwards and to the left, so that the same ejection systolic pressure is associated with an increased ejection fraction, greater stroke volume and reduced end systolic volume. Reduced contractility, for example resulting from intrinsic heart disease, or from the myocardial depressant effects of acidosis, hypoxia or sepsis shifts the curve to the right and flattens it. The same systolic blood pressure is associated with a reduced ejection fraction and stroke volume and a much greater end systolic volume.
MONITORING HAEMODYNAMIC STATUS
Although considerable information on the cardiovascular status of a patient can be obtained from simple clinical examination (pulse, blood pressure, core peripheral temperature gradient, urine output etc.) additional information obtained from invasive monitoring is useful, particularly when assessing the response to changes in therapy.
Pulmonary artery catheterization
Pulmonary artery (PA) catheterization has for a number of years been the gold standard cardiovascular monitoring tool in ICU. This technique enables the measurement of pulmonary artery pressure, pulmonary artery occlusion pressure (PAOP) and CO, and also allows many other haemodynamic variables to be calculated or derived. Typical values are given in Table 4.4.
TABLE 4.4 Normal values of common haemodynamic variables derived from PA catheterization
| Central venous pressure (CVP) | 4–10 mmHg |
| Pulmonary artery occlusion pressure (PAOP) | 5–15 mmHg |
| Cardiac output (CO) | 4–6 L / min |
| Cardiac index (CI) | 2.5–3.5 L min−1 m−2 |
| Stroke volume (SV) | 60–90 mL / beat |
| Stroke volume index (SVI) | 33–47 mL / beat per m2 |
| Systemic vascular resistance (SVR) | 900–1200 dyne.s / cm5 |
| Systemic vascular resistance index (SVRI) | 1700–2400 dyne.s / cm5 per m2 |
| Pulmonary vascular resistance (PVR) | <250 dyne.s / cm5 |
| Pulmonary vascular resistance index (PVRI) | 255–285 dyne.s / cm5 per m2 |
These ‘normal values’ provide a guide only. They may not be achievable or appropriate for all critically ill patients (See Goal directed therapy, p. 78).
Pulse contour analysis
Currently, systems based on pulse contour analysis are perhaps the most likely to enter widespread use. In general terms these require venous access (peripheral or central) and an arterial line with a sensor either built in or attached. To calibrate the system an indicator is injected into the venous catheter and is detected by the arterial line producing a standard dilutional CO measurement. From this the systems are able to provide continuous CO, SV and systemic vascular resistance by analysis of the pulse waveform. To maintain accuracy they must be calibrated every 8–12 h or whenever there is a significant change in cardiovascular status. A popular device using this technique is the Picco system, which combines pulse contour analysis with intermittent calibration by thermodilution. The thermodilution calibration curves can also be used to estimate thermal volumes of distribution in the chest, providing a reasonably well validated measure of global end diastolic volume (a surrogate for filling) and extra vascular lung water, useful in resuscitation and the management of acute lung injury.
Pulse power analysis
A related approach is an analysis of the area under the curve of the arterial waveform. This is known as ‘pulse power analysis’ and has some theoretical advantages over pulse contour analysis. In particular, it does not require proximal arterial cannulation and should in theory be slightly more robust under conditions of damping. It is used commercially in the LiDCO system. This device combines pulse power analysis with calibration using lithium dilution every 12–24 h. An injection of a very low dose of lithium into a vein (not necessarily a central vein) is accompanied by measurement of a dilation curve in an artery. Blood is pumped from the arterial line across an electrode calibrated to measure monovalent cations. In theory, the only such ion whose concentration varies in the time course of the measurement is lithium. Injection of other charged substances at the same time invalidate the measurement. In practice, the only common confounding factor is recent injection of atracurium (a positively charged quaternary nitrogen compound).
 All of these monitoring systems have advantages and disadvantages. The key to their successful utilization is in careful interpretation of the information provided. If any of these systems are in use in your unit, you should seek instruction on their use.
Echocardiography
Transthoracic echocardiography is minimally invasive and can be repeated at short intervals to assess cardiac function and response to therapy. The key information available from echocardiography is shown in Table 4.5.
| Structure | Anatomical abnormalities (e.g. congenital heart disease) |
| Filling | Assessment of end diastolic volume of RA / RV / LA / LV |
| Function | Assessment of contractility Identification of areas of dyskinesia (suggestive of ischaemia) Presence of dilated chambers Valve function |
| Pericardium | Presence of pericardial effusions Evidence of tamponade |
There is increasing availability of bedside, transthoracic and to a lesser extent transoesophageal, echocardiography in intensive care, for use by suitably trained intensive care staff, as opposed to cardiologists or sonographers. Abbreviated training packages have been developed for this purpose, which enable individuals to undertake focused examinations (e.g. FATE). All these packages accept the limitations of examinations by non-specialists and emphasize the need for formal referral to echocardiography where there is doubt about the findings. Nevertheless it seems likely that echocardiography will increasingly become an extension of the traditional clinical examination of patients in ICU. All patients will be likely to receive a focused echocardiography examination on admission and at intervals and the findings used to guide haemodynamic therapy.
OPTIMIZATION OF HAEMODYNAMIC STATUS
Goal directed therapy
The availability of so many measured haemodynamic variables (above) led to attempts to improve the outcome of critically ill patients by manipulation of the variables to achieve ‘standard goals’. Shoemaker, for example, compared measured variables in trauma survivors and non-survivors and suggested that outcome could be improved by manipulating haemodynamics to achieve supranormal values of cardiac index (4.5 L / min / m2), oxygen delivery index (650 mL / min / m2) and oxygen consumption index (165 mL/min/m2). There is little evidence, however, that this approach improves outcome in the general population of critically ill patients.
Rational approach to optimization of haemodynamic status
Avoid aiming to achieve absolute numbers for CO and other variables. Use ‘normal values’ only as a guide and think in terms of achieving adequate haemodynamic performance for the individual patient. A rational approach is to optimize fluid (filling) status first and then to add an inotrope or vasoconstrictor as required. Figure 4.3 provides a simple algorithm for optimizing haemodynamic status and the management of shock regardless of the underlying cause.
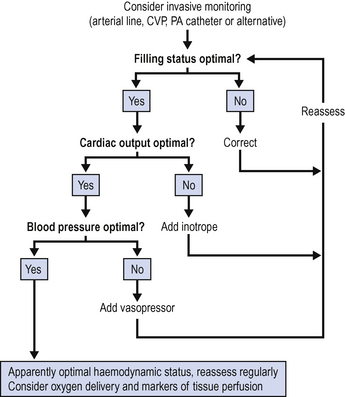
 For many patients in the ICU the primary problem will be sepsis, which typically produces a high CO, low pressure state. Following the algorithm, if CO is adequate, attention moves directly to perfusion pressure. It is important, however, to assess the adequacy of cardiac output early in the management of shock to avoid missing cardiogenic causes.
Use of vasoactive drugs
There is a tendency to refer to all vasoactive drugs as inotropes. This is not only incorrect but can lead to confusion when deciding which agent to choose in any given circumstance. By classifying the available agents according to their receptor pharmacology and actions, a rational approach to their use can be achieved. Table 4.6 shows the effects of agonists at various receptors.
| Receptor | Effects |
|---|---|
| α1 | Vasoconstriction |
| β1 | Increased myocardial contractility and heart rate |
| β2 | Vasodilatation (and bronchodilatation) |
| DA | Splanchnic and renal vasodilatation |
OPTIMIZATION OF FILLING STATUS
The optimal filling status for a patient is that which achieves the maximal CO while at the same time avoiding any deterioration in gas exchange due to the development of pulmonary oedema. If this cannot be achieved, then assisted ventilation may be required.


Volumetric haemodynamic monitoring
Increased recognition that the concept of using ‘filling pressure’ (CVP or PAOP) as a measure of ventricular filling status is flawed has led to the development of monitoring systems capable of directly measuring (estimating) volume status. Detailed description is beyond the scope of this book. A guide to normal values for volume indices is given in Table 4.7.
TABLE 4.7 Typical values of volumetric haemodynamic variables
| Right ventricular ejection fraction (RVEF) | 35–45% |
| Right ventricular end diastolic volume (RVEDV) | 100–160 mL |
| Right ventricular end diastolic volume index (RVEDVI) | 60–100 mL / m2 |
| Intrathoracic blood volume index (ITBVI) | 850–1000 mL / m2 |
| Extravascular lung water index (EVLWI) | 3–7 mL / kg |
There is currently no consensus as to which of these variables is the most useful in assessing volume status. As with other haemodynamic variables, it is the trend and response to therapy which is more important than the absolute values obtained. If volumetric monitoring is available in your unit seek senior advice on interpretation of the information provided. If volumetric monitoring is not available, echocardiography can also be used to provide useful information about filling status.
OPTIMIZATION OF CARDIAC OUTPUT
Inotropes
If despite optimal filling CO remains inadequate, inotropes may be added to improve cardiac performance (Fig. 4.2). The rational use of inotropes requires an understanding of the receptor pharmacology of the commonly used agents. These are summarized in Table 4.8.
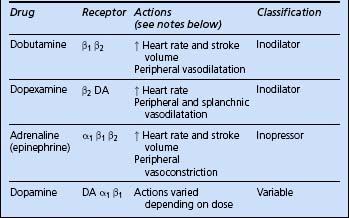
Dobutamine (1–20 μg / kg / min)
Increases CO and causes a variable degree of peripheral vasodilatation. It is useful in low CO states when vasomotor tone and mean arterial pressure are reasonably well maintained.
Dopamine (2.5–5 μg / kg / min)
Dopamine acts on α1 and β1 adrenoceptors and DA receptors and releases noradrenaline (norepinephrine) from adrenergic nerves. The actions of dopamine therefore vary depending on the dose. At low doses, up to 5 μg / kg / min, the primary action is said to be on DA receptors, resulting in increased splanchnic and renal perfusion. Dopamine may therefore be useful to help maintain renal blood flow and promote urine output, although the evidence for this is poor. At doses above 5 μg / kg / min vasoconstrictor and cardiac effects predominate (see Oliguria, p. 188).
Choice of inotrope
 If despite low CO mean arterial blood pressure is well maintained, use dobutamine or dopexamine to increase CO, reduce afterload and improve perfusion.

Phosphodiesterase inhibitors
Enoximone and milrinone are examples of phosphodiesterase inhibitors. These agents act by inhibiting myocardial phosphodiesterase, thereby prolonging the action of cyclic AMP. This amplifies the effect of β-receptor stimulation, and results in increased myocardial cytosolic calcium release and hence contractility. They are very effective at increasing cardiac output, but cause profound systemic vasodilatation which can lead to hypotension. They are relatively long-acting. Introduce cautiously. Avoid loading doses. Start low dose infusions and increase gradually.
OPTIMIZATION OF PERFUSION PRESSURE
If, despite adequate filling and CO, the mean arterial pressure remains low, then vasoconstrictors should be used. The commonly available agents are shown in Table 4.9.


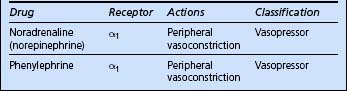
 Vasopressors should be titrated against the blood pressure and not systemic vascular resistance (SVR) or any other derived haemodynamic variable. SVR is mathmatically derived from cardiac output and blood pressure and is not a directly measured, independent variable.
Vasopressin
There is increasing evidence that in profound shock states vasopressin or antidiuretic hormone (ADH), which is normally secreted by the posterior pituitary, becomes depleted. Replacement at physiological rather than pharmacological doses, by infusion of vasopressin at 0.1–0.4 μg / kg / min, may help to restore vascular reactivity and tone. It is usually used as a second line agent in combination with other vasopressor agents. Bolus doses of terlipressin, which is a longer acting agent in this class, can also be used.
RATIONAL USE OF INOTROPES AND VASOPRESSORS
No response to inotropes / vasoconstrictors
 Check that arterial and other monitoring lines are functioning correctly (check blood pressure with a cuff) and that transducers are appropriately zeroed and at the correct level.


HYPOTENSION
(See Optimizing haemodynamic status, p. 48.)
Assess the patient


Optimize filling status
 Unless there is evidence of fluid overload or myocardial failure, give a fluid challenge to optimize cardiac filling, even if measured CVP is apparently adequate (e.g. 100–500 mL colloid). If there is no response (particularly if there is no rise in measured filling pressures), consider a further fluid bolus.


HYPERTENSION
Although hypotension is more of a problem in intensive care, hypertension can also occur. This may be a manifestation of pre-existing essential hypertension, but is frequently secondary to other factors. Typical causes are shown in Box 4.1.
Box 4.1 Common causes of hypertension in ICU
Pre-existing hypertension / vascular disease
Management
In intensive care short periods of hypertension, for example during weaning from ventilation, are not uncommon and do not generally result in any harm unless there is associated myocardial, cerebral or vascular disease. Therefore:


Young hypertensive patients
The young patient with unexplained sustained hypertension, particularly if associated with end organ damage, for example left ventricular hypertrophy, warrants further investigation. Consider other causes such as renal artery stenosis and phaeochromocytoma. Seek advice on appropriate treatment. (See Phaeochromocytoma, p. 221.)
 Avoid the use of β-blockers as first line treatment in young hypertensive patients unless phaeochromcytoma has been excluded. Use of β-blockers can result in unopposed α activity, profound increases in blood pressure and potential death.
DISTURBANCES OF CARDIAC RHYTHM
Disturbances in cardiac rhythm are common in the ICU, and this highlights the need for careful monitoring of all patients. Dysrhythmias may result from underlying heart disease, e.g. ischaemic heart disease, cardiomyopathy or valve lesions. Other factors which predispose to tachycardia and dysrhythmias are listed in Box 4.2.
Box 4.2 Factors predisposing to tachycardia and dysrhythmias
Pain and anxiety (inadequate analgesia and sedation)
Increased catecholamine levels (endogenous or from inotrope infusions)
Electrolyte disturbance (hypokalaemia, hyperkalaemia, hypomagnesaemia)
Sinus tachycardia
This is common and generally represents an appropriate response to a clinical stress. Management is, therefore, correction of the underlying cause(s).
 Do not give β-blockers to control sinus tachycardia. This may result in profound decompensation and even cardiac arrest. Sinus tachycardia will usually resolve when the underlying conditon improves.
Bradycardia
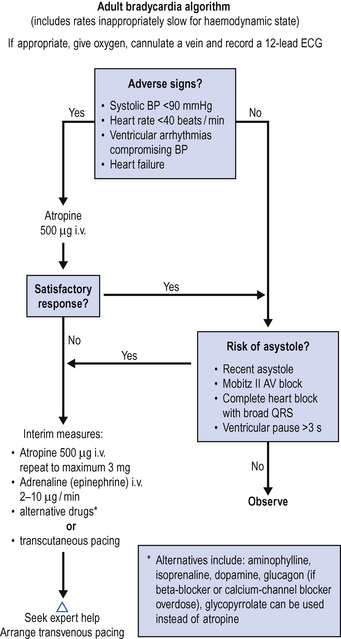
Bradycardia frequently reflects intrinsic disease of pacemaker tissue or the conducting system. It may be precipitated by increased vagal tone, hypoxia (particularly in children) and the myocardial depressant effect of drugs. Potentially important / reversible causes are shown in Box 4.3.
Box 4.3 Causes of bradycardia
Increased vagal tone (e.g response to suctioning)
Conduction defects / heart block
Heart transplant (denervated heart)
The algorithm for the management of bradycardia is shown in Fig. 4.4.
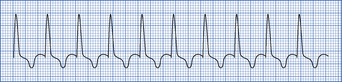
Supraventricular tachycardia (SVT)
SVT encompasses all forms of tachydysrhythmia originating above the ventricles. In practice it is useful to distinguish atrial fibrillation and atrial flutter from other forms of SVT. In SVT the QRS complexes are always narrow (narrow complex tachycardia) unless there is an associated conduction defect (Fig. 4.5).
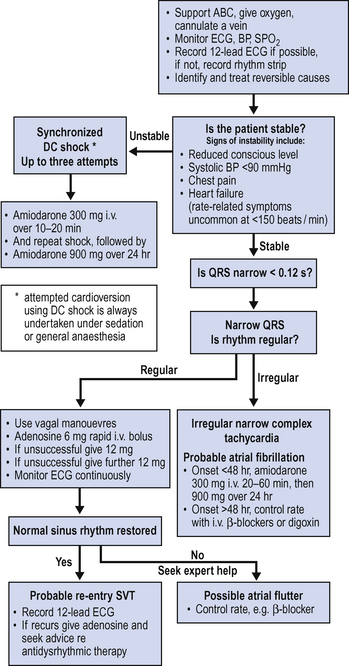
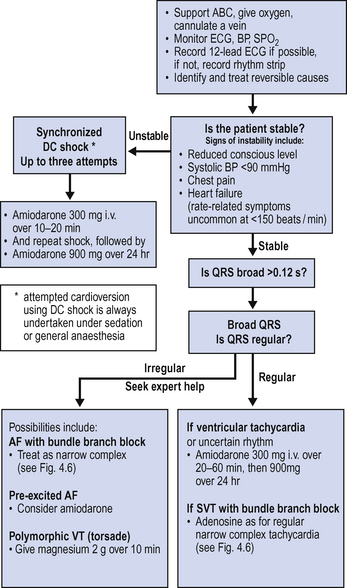
The management of SVT depends on the degree of haemodynamic disturbance and likely origin. As shown in Fig. 4.6, DC cardioversion is indicated if there is associated shock. Adenosine may terminate a re-entry tachycardia. Amiodarone may be the drug of choice for the treatment of persistent SVT not associated with haemodynamic compromise. Atrial fibrillation is considered separately (see below).
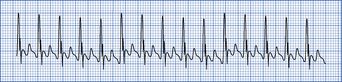
Atrial fibrillation (AF)
This is the commonest dysrhythmia seen in the ICU (Fig. 4.7), particularly in the elderly patient with ischaemic heart disease, intercurrent sepsis, electrolyte disturbance or inotrope dependency. AF may not settle until the patient’s general condition improves. Consider the underlying causes of dysrhythmia above.
Treatment depends on the ventricular rate and the degree of associated haemodynamic disturbance as shown in Fig. 4.6. When sudden in onset, restoration of sinus rhythm (where possible) should be attempted. Synchronized DC cardioversion is indicated for sudden onset atrial fibrillation associated with rapid ventricular rate and significant haemodynamic compromise. Amiodarone is the agent of choice for most patients with lower ventricular rates and without haemodynamic compromise.

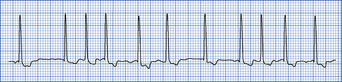
Atrial flutter
In atrial flutter, the atrial rate is about 300 beats per minute and the P waves have a saw tooth appearance The AV node cannot conduct all the P waves to the ventricle and there is often associated 2:1 AV block (Fig. 4.8). Suspect if the ventricular rate is 150. Use a 12-lead ECG to identify flutter waves: Treatment is synchronized DC cardioversion or control of rate with β-blockers. Seek advice.


Broad complex tachycardia
Broad complex tachycardia (Fig. 4.9) is usually ventricular in origin, but may occasionally be supraventricular if there is an associated conduction defect, e.g. bundle branch block. Haemodynamic status is a poor guide to the underlying rhythm. An ECG may help to distinguish between the two. ECG features of ventricular tachycardia are shown in Box 4.4.
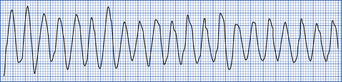
If in doubt, broad complex tachycardia should be assumed to be ventricular in origin until proved otherwise. Management of broad complex tachycardia is shown in Fig. 4.10.
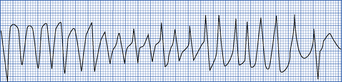
Polymorphic ventricular tachycardia (torsade de pointes)
Torsade de pointes (Fig. 4.11) is a form of VT in which the complexes have a pointed shape, vary from beat to beat and the axis of the rhythm constantly changes. It is usually self-limiting, but may give rise to VF. Hypokalaemia, prolonged QT interval, bradycardia and antidysrhythmic drugs may be causes. Seek expert help.


CONDUCTION DEFECTS
2nd degree heart block


Treatment of heart block


Indications for temporary cardiac pacing are given in Box 4.5.
Pacemakers
Patients with permanent indwelling pacemakers are normally seen in pacemaker clinic regularly and should carry a card indicating the type of pacemaker that has been fitted. These are described using a coding system as shown in Table 4.10.
| Chamber paced | V = ventricle, A = atrium, D = dual |
| Chamber sensed | V = ventricle, A = atrium, D = dual |
| Mode of response | T = triggered, I = inhibited, D = dual, O = none |
| Programmable functions | P = simple, M = multiple, C = communicating, O = none |
| Antitachydysrhythmia functions | B = bursts, N = normal rate competition, S = scanning, E = externally activated |
Traditional VVI pacemakers could be switched from demand to fixed rate by use of a magnet. Pacemaker technology has advanced dramatically over recent years and many pacemakers are now complicated programmable microprocessors. Automatic implanted cardiac defibrillators (AICD) are also common in patients with refractory or potentially life threatening dysrhythmias. These devices can usually be electronically interrogated to determine status and the function can be temporarily altered or suspended if necessary depending on circumstances. Do not attempt this yourself. Always seek cardiology advice regarding patients with pacemakers and AICD.


ACUTE CORONARY SYNDROMES
ECG changes
The following ECG changes are typical of acute myocardial infarction:
 ST segment elevation > 1 mm in precordial leads or > 2 mm in limb leads which persists for more than 24 h. Usually returns to normal within 2 weeks. (Persistent ST elevation at 1 month suggests development of left ventricular aneurysm.)


The location of these changes on the ECG identifies the region of the infarction (Table 4.11).
| Area of infarction | ECG leads |
|---|---|
| Inferior | aVF, II and III |
| Anteroseptal | VI–V4 |
| Anterior | V3–V4 |
| Anterolateral | V3–V6 |
| Posterior | V1 |
Biomarkers
Biomarkers are used to indicate the extent, if any, of muscle damage sustained during an acute myocardial ischaemic event. Previously enzymes released from damaged cardiac muscles were used for this purpose but these have now been largely superseded by the use of troponin assays. Cardiac troponin (troponin I) is a protein released by damaged myocardial cells and is a sensitive indicator of the extent of cellular damage. The measured level in fit and healthy people is normally less than 0.1 μg / L. Values above this usually indicate an acute myocardial ischaemic event or infarction.
 Troponins and other cardiac enzymes may be raised after blunt chest trauma or cardiac compressions during resuscitation.
Patterns of acute coronary syndrome
Based on the interpretation of ECG findings and biomarkers, three principle patterns of acute coronary syndrome can be described as shown in Table 4.12.
| ECG changes | Biomarkers (indicative of infarction) | Acute coronary syndrome |
|---|---|---|
| Ischaemic changes No ST elevation |
Negative | Unstable angina |
| Ischaemic changes No ST elevation |
Positive | Non-ST segment elevation Myocardial infarction (non-STEMI) |
| Ischaemic changes ST elevation |
Positive | ST segment elevation Myocardial Infarction (STEMI) |
 All patients with acute coronary syndrome should be referred urgently to a cardiologist for advice. Patients with ST segment elevation and others at high risk may benefit from urgent percutaneous coronary interventions (angioplasty, stenting) or thrombolysis.
Unstable angina and NSTEMI


Patients who continue to have chest pain, or who have persistent ECG changes or in whom troponin levels are raised will require coronary angiography. Seek urgent cardiology advice.
Acute myocardial infarction (STEMI)


 Consider GTN infusion to reduce preload and reduce myocardial work; 1–2 mg / h. Titrate to response.
Thrombolysis


Thrombolysis is only indicated if there is irrefutable ECG evidence of acute infarction and should be started as soon as possible, preferably within 6 h of the onset of chest pain. Many patients in intensive care will, however, have a contraindication to thrombolysis (Box 4.6). Always seek advice from a cardiologist.
CARDIAC FAILURE


Right heart failure and pulmonary hypertension
Both mitral valve disease and chronic pulmonary disease may result in pulmonary hypertension and subsequent right heart failure. This is a very difficult condition to manage. When pulmonary artery and right ventricular pressures are high, any fall in systemic pressure will impair perfusion of the right ventricle. This results in worsening right ventricular performance and rapid deterioration.
 Maintain systemic arterial blood pressure. Avoid drugs that lower systemic arterial pressure. Vasoconstrictors may be necessary to maintain systemic blood pressure and right ventricular perfusion. Consider intra-aortic balloon counter pulsation pumps to maintain systemic diastolic pressure. (See Cardiogenic shock below.)


CARDIOGENIC SHOCK
 Ventilate with high inspired oxygen concentration and correct any dysrhythmias (non-invasive ventilation may be appropriate).

 Rationalize inotropes. In the first instance adrenaline (epinephrine) infusion may be a reasonable choice. This will increase CO and maintain some degree of peripheral vasoconstriction. Once invasive monitoring is established, inodilator drugs such as dopexamine and dobutamine may be more appropriate.


PULMONARY EMBOLISM
Pulmonary thromboembolism is common in immobile, critically ill, traumatized and postoperative patients. The effects range from mild discomfort and shortness of breath to sudden profound collapse and cardiac arrest. It is regularly found as an unexpected finding in post mortem studies of critically ill patients. Typical clinical features are shown in Box 4.7.


PERICARDIAL EFFUSION AND CARDIAC TAMPONADE
The haemodynamic consequences of a pericardial effusion depend on the size and speed of accumulation. Large, rapidly formed collections typically compress the right atrium and ventricle, preventing filling and impairing CO. The clinical signs include tachycardia, elevated central venous pressures, hypotension, pulsus paradoxus, and muffled heart sounds. This may progress to profound collapse and PEA (pulseless electrical activity) arrest.
CARDIAC ARREST
Most deaths in the ICU are expected. Sudden unexpected cardiac arrest is actually infrequent. If patients suffer a cardiac arrest, despite optimal intensive care management, then unless the problem is one of transient ventricular dysrhythmia or another reversible pathology, it is unlikely that the outcome will be favourable. Most well staffed units do not call the hospital cardiac arrest team unless medical staff are busy elsewhere in the hospital. Follow the advanced life support algorithm for the management of cardiac arrest in adults (Fig. 4.12).
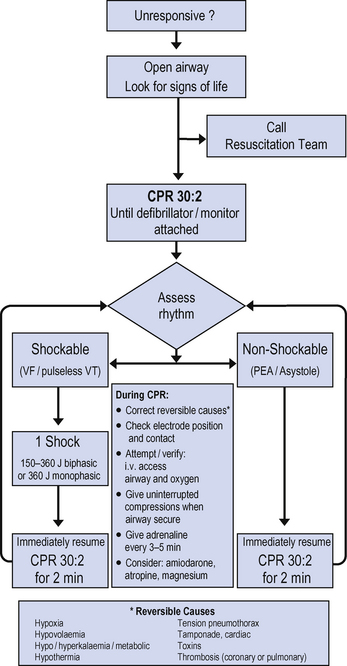
Fig. 4.12 Adult advanced life support guidelines.
(from Resuscitation Council UK 2005, with permission)
Management of patients following cardiac arrest
Patients who are resuscitated from cardiac arrest outside the ICU frequently require admission to intensive care. This may be because of failure to regain adequate conscious level, or inadequate cardiac, respiratory or renal function. The management of these patients depends upon the underlying clinical condition, the type of arrest and the timing and adequacy of the initial resuscitation measures [see the Intensive Care Society’s Standards for the management of patients after cardiac arrest 2008 (www.ics.ac.uk) and Resuscitation council UK’s guidelines 2005 (www.resus.org.uk)].


ADULT PATIENT WITH CONGENITAL HEART DISEASE
Increasing numbers of patients are surviving into adult life with corrected/uncorrected congenital heart disease. They may present with complications of their structural heart problems like endocarditis, cardiac failure, Eisenmenger’s syndrome or with unrelated problems. The cardiac physiology in these patients is often complex and the ability to resuscitate stabilize and or manipulate the haemodynamic status requires understanding of the anatomy, any corrective procedures and the consequences thereof. Always seek advice from a cardiologist, cardiothoracic surgeon or anaesthetist with an interest in this area as the effects of drugs and other interventions may be very different from the normal population.