TOPIC 3 Cardiovascular system
Perioperative cardiac risk assessment
Test: Risk assessment scoring
In 1977 Goldman and colleagues developed a preoperative cardiac risk index (Table 3.1) based on nine clinical factors to give a cumulative risk score, predicting outcome after noncardiac surgery.
| Risk factor | Score | |
|---|---|---|
| Third heart sound (S3) | 11 |
In 1986 this was modified by Detsky (Table 3.2) to include angina, suspected aortic valve disease and pulmonary oedema. Based on this model patients are stratified as low, intermediate or high risk for a cardiac event.
Table 3.2 Detsky’s modified cardiac risk index
| Factor | Risk |
|---|---|
| Age older than 70 years | 5 |
| Myocardial infection within 6 months | 10 |
| Myocardial infection after 6 months | 5 |
| Canadian Cardiovascular Society Angina Classification* | |
| Class III | 10 |
| Class IV | 20 |
| Unstable angina within 6 months | 10 |
| Alveolar pulmonary oedema | |
| Within 1 week | 10 |
| Any history of pulmonary oedema | 5 |
| Suspected critical aortic stenosis | 20 |
| Arrhythmia | |
| Rhythm other than sinus plus atrial premature beats | 5 |
| More than five premature ventricular beats | 5 |
| Emergency operation | 10 |
| Poor general medical status | 5 |
| Class | Points | Cardiac risk |
|---|---|---|
| I | 0–15 | Low |
| II | 20–30 | |
| III | 31+ | High |
* The Canadian Cardiovascular Society Angina Grading Scale is commonly used for the classification of severity of angina: Class I – angina only during strenuous or prolonged physical activity; Class II – slight limitation, with angina only during vigorous physical activity; Class III – symptoms with everyday living activities, i.e., moderate limitation; Class IV – inability to perform any activity without angina or angina at rest, i.e., severe limitation.
Metabolic equivalent task (MET)
METs are a measure of functional capacity, which estimate the energy requirement to carry out activities of daily living (Table 3.3). One MET is defined as the average resting oxygen uptake for a 70-kg male and is equal to approximately 3.5 mL/kg/min. Assessment predicts a patient’s exercise capacity, which may contribute to patient risk assessment.
| No of METs | Activity |
|---|---|
| 2 METs | Eat, dress or use the toilet. Walk indoors around the house. Walk on level ground at 2–3 mph or 3.2–4.8 km/h |
| 4 METs | Light work around the house like dusting or washing dishes. Climb a flight of stairs or walk up a hill. Walk on level ground at 4 mph or 6.4 km/h. Participate in moderate recreational activities like golf, bowling |
| >10 METs | Participate in strenuous sports like swimming, singles tennis, football, basketball or skiing |
Adapted from the Duke Activity Status Index and AHA Exercise Standards.
Test: Cardiopulmonary exercise testing (CPEX)
Indications
Interpretation
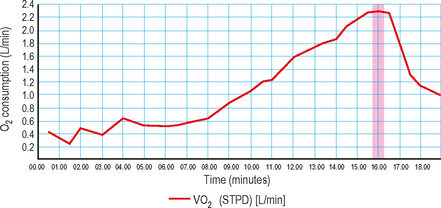
VO2max (Fig. 3.1): Represents maximal oxygen uptake during exercise of increasing intensity. Expressed in mL/kg/min, VO2max is a function of both the maximal cardiac output and the maximal tissue extraction of O2. Under exercise conditions, oxygen consumption becomes a linear function of cardiac output. This measurement is therefore an indirect measure of ventricular function.
Anaerobic threshold (AT) (Figs 3.2 and 3.3): This is the point during exercise at which anaerobic metabolism is used to supplement aerobic metabolism as a source of energy. In exercise, when lactate is produced it is buffered by bicarbonate, leading to increased production of CO2. This causes a rise in VCO2, which exceeds the rise in VO2, therefore the VCO2/VO2 ratio increases.
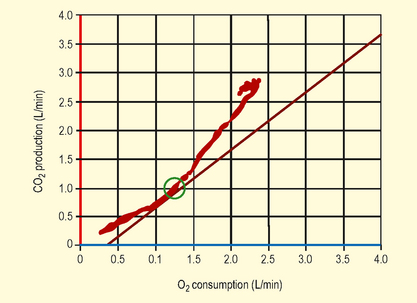
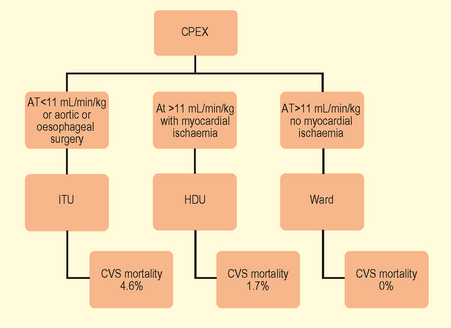
Fig. 3.3 Implications of anaerobic threshold (AT) with respect to perioperative cardiovascular risk.
(Adapted from Older P et al. Chest 1999. 116(2) 355–62 Cardiopulmonary exercise testing as a screening test for perioperative management of major surgery in the elderly.)
An AT of >11 mL/min/kg predicted postoperative survival with a high sensitivity and specificity. Cardiovascular death was virtually confined to patients with an AT <11 mL/min/kg. Older P. Chest 1999. 116(2)355–62
Test: Electrocardiogram (ECG)
Interpretation
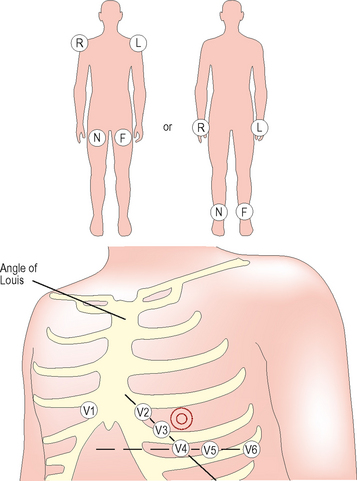
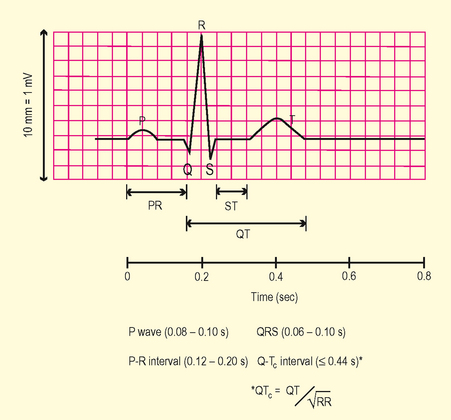
Review morphology of ECG waveforms and complexes (Fig. 3.5)
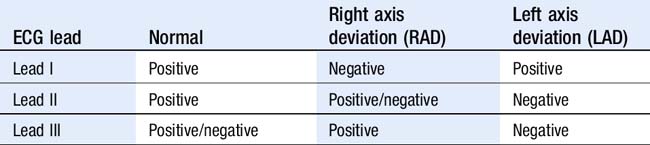
Assess axis
Left ventricular hypertrophy (Box 3.1)
Consider aortic stenosis, hypertension, hypertrophic cardiomyopathy.
Myocardial ischaemia
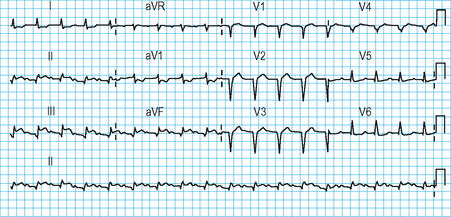
ST–elevation myocardial infarct (STEMI)
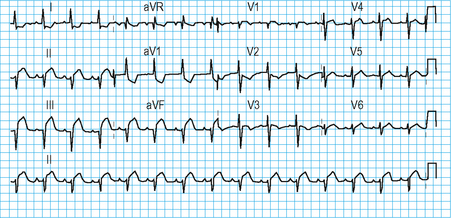
Defined by chest pain with ECG features as listed in Box 3.2 (see Fig. 3.6). In STEMI, ST elevation morphology evolves over time. Initially there are hyperacute ST changes, followed by the development of Q waves and T wave changes over days (Fig. 3.7).
Non-STEMI
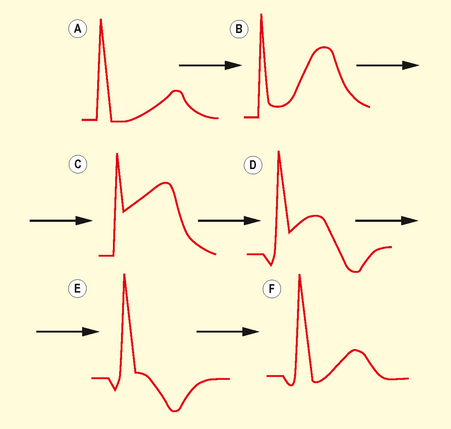
May result in ST segment depression (Fig. 3.8), transient ST elevation or T wave inversion. T wave changes are sensitive for ischaemia but less specific. T waves may become tall, flattened, inverted or biphasic.
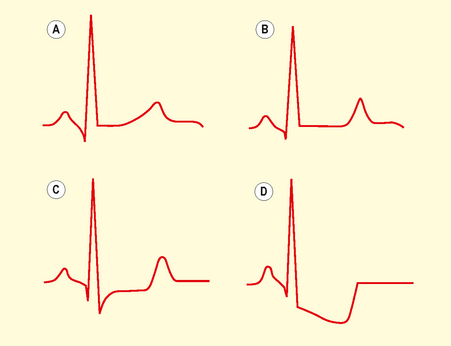
Fig. 3.8 The various forms of ST depression: normal (A), flattened (B), planar (C) and downsloping (D).
Inverted T waves are normal in leads III, aVR and V1, in association with a predominantly negative QRS complex. T waves that are deep and symmetrically inverted strongly suggest myocardial ischaemia.
Q waves (Fig. 3.9) are pathological/abnormal if:
They represent old MI/scar if in contiguous lead territories (see below).
Test: Exercise tolerance test (ETT)
Indications
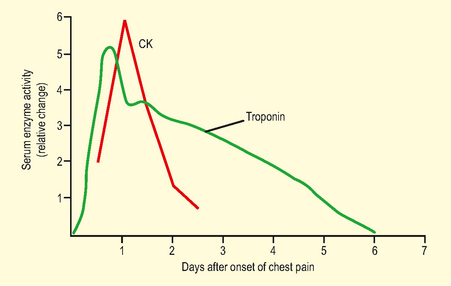
Test: Biochemical markers of myocardial ischaemia
Echocardiography
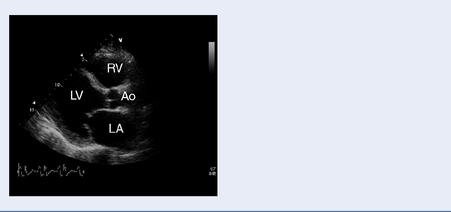
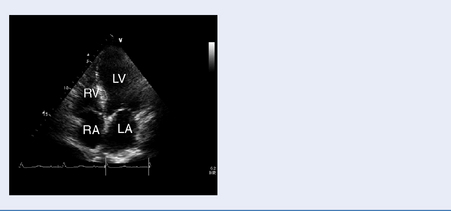
Test: Transthoracic echocardiography (TTE) and transoesophageal echocardiography (TOE)
Indications
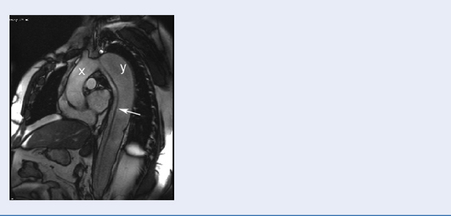
Structural and functional assessment of the heart and great vessels (Table 3.6).
| Normal values | Comment |
|---|---|
| Left atrial diameter 3–4 cm | Atrial dilatation can be due to atrioventricular valvular pathology, diastolic dysfunction, interatrial shunts (consider if ventricular function is normal) |
| Left ventricular (LV) internal diameter (cm): diastole 3.5–5.9, systole 2.4–4.0 | LV diastolic dimensions are increased if there is volume loading e.g AR, MR or cardiomyopathy. |
| LV thickness (cm): septum 0.8–1.3 males, 0.7–1.0 females | Septal thickening is seen in hypertrophic cardiomyopathy (usually 4–6 mm thicker) |
| LV ejection fraction ≥65% | 50–65% mild impairment, 40–50% moderate impairment, <35% severe impairment |
| Fractional shortening 28–44% | Another quantitative assessment of contractility. |
Physical principles
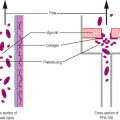
High-frequency vibration (1–10 MHz) emitted and received from a probe containing a series of piezo-electric crystals. Wave reflection occurs at interfaces between tissues of varying acoustic density and as the speed of ultrasound waves is known, the depth to the reflected surface can be calculated, when the time delay between emission and reception is known. This is displayed as a point on a screen, the magnitude of the point reflecting the strength of reflected signal and is known as B-mode scanning.
Assessment of valve function
Aortic stenosis: Assessed by CW Doppler and flow velocity across aortic valve (Table 3.7)
Table 3.7 Severity of aortic valve disease based on valve pressure gradient
| Normal | Peak AVG <16 mmHg | nil |
| Mild | Peak AVG 20–30 mmHg | Mean F AVG <20 mmHg |
| Moderate | Peak AVG 31–50 mmHg | Mean AVG 20–30 mmHg |
| Severe | Peak AVG >70 mmHg | Mean AVG 40 mmHg |
AVG, aortic valve gradient.
Mitral stenosis (Table 3.8)
Based on calculation of mitral valve gradient (MVG mmHg) or mitral valve area (MVA cm2).
Table 3.8 Severity of mitral valve disease based on valve pressure gradient
| Mild | Mean MVG <5 mmHg |
| Moderate | Mean MVG 5–10 mmHg |
| Severe | Mean MVG >10 mmHg |
MVG, mitral valve gradient.
Mitral regurgitation (Table 3.9)
Based on analysis of colour flow Doppler (CFD) and Continuous wave Doppler (CWD) profile. Graded from 1 (mild) to 4 (severe). Please see Table 3.9.
Table 3.9 Grading of regurgitation for mitral and aortic valve
| 0/4 | None | No regurgitation |
| 1/4 | Mild | Regurgitant flow limited to immediately around the valve area |
| 2/4 | Moderate | Regurgitant flow occupies up to a third of the chamber |
| 3/4 | Moderate to severe | Regurgitant flow occupies up to 2/3 of the chamber |
| 4/4 | Severe | Regurgitant flow in most of the receiving chamber and flow reversal in pulmonary veins |
Limitations (Table 3.10)
| Clinical indication | TTE useful | TOE useful |
|---|---|---|
| Atria and ventricle size, shape and function | + | + |
| Pericardial effusion | − | + |
| Myocardial thickness | + | + |
| Valve structure and function | + | ++ |
| Aortic arch | + | Limited |
| Left atrial appendage | − | + |
| Superior vena cava | Limited | + |
| Thoracic aorta | − | + |
| Clinical utility | ||
| Noninvasive | + | − |
| Image quality operator dependent | + | − |
| Can be performed in sitting position | + | − |
| Sedation required | − | + |
Cardiac catheterization
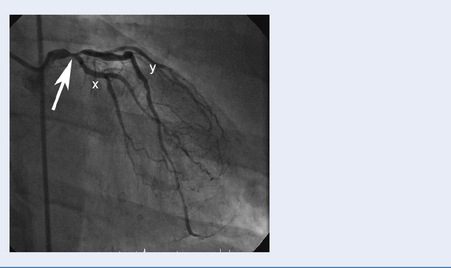
Test: Coronary angiography
Data presented as
Images capture flow of contrast in coronary circulation and significant atheromatous narrowings in the arteries may be seen (Fig. 3.13).
Management principles
Test: Right heart catheterization
Indications
How it is done
Antegrade catheterization via inferior or superior vena cava. Percutaneous entry is achieved via the femoral (particularly if a left heart catheter is being done at the same time), subclavian, jugular or antecubital vein. Balloon flotation catheters or fluoroscopic guidance is used to position catheters (see Chapter 9).
Nuclear imaging
Test: Thallium/technetium scan (Fig. 3.15)
Indication
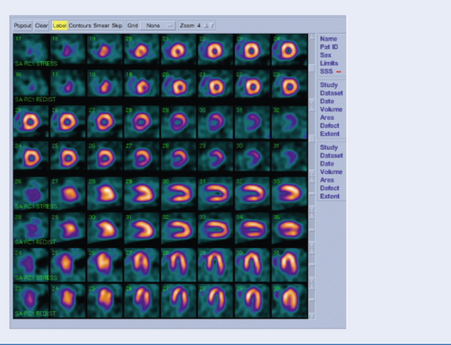
Interpretation
Areas of ischaemia or infarction take up less thallium. Between 2 and 24 hours post injection, cardiac myocytes contain a comparable concentration (the thallium redistributes in areas with viable myocardium). Images at this time show dark areas where the myocardium has infarcted, but normal density in ischaemic areas. By comparing the early and late images one can predict whether an ischaemic area of myocardium contains enough viable tissue to warrant intervention.