2 Cardiovascular Imaging
Basic Principles and Instrumentation
 Myocardial Nuclear Scintigraphy
 Cardiac Computed Tomography
CCT utilizes ionizing radiation for the production of images. Concern over excessive medical radiation exposure has been raised in recent years. Although several techniques, such as prospective electrocardiogram (ECG)-gated acquisition, may be implemented1–3 to reduce radiation dose, a risk-benefit assessment must be done for the selection of patients who have appropriate indications for CCT. The patient’s heart rate must be lowered to less than 65 beats/min to achieve adequate results imaging the coronaries with CCT. This usually requires the administration of oral or intravenous β-blockers. After the scan has been completed, images are reconstructed at different intervals of the cardiac cycles and analyzed in a computer workstation.
 Cardiovascular Magnetic Resonance Imaging
Cardiovascular magnetic resonance is a robust and versatile imaging modality. It is able to evaluate multiple elements of cardiac status: function, morphology, flow, tissue characterization, perfusion, angiography, and/or metabolism. CMR is able to do this using its unique ability to distinguish morphology by taking advantage of the different molecular properties of tissues. This is achieved without the use of any radiation, by using the influence of magnetic fields on the abundance of hydrogen atoms in the human body. This is one of the main advantages of CMR over other imaging modalities. Multicontrast CMR uses the intrinsic properties of organs and takes advantage of the three imaging contrasts: T1, T2, and proton density without the need for gadolinium contrast. T1-weighted imaging is utilized for the imaging of lipid content and fat deposition appears bright or hyperintense. T2-weighted imaging is used for the evaluation of edema4 and fibrous tissue,5 which also appears hyperintense. Dynamic contrast-enhanced CMR uses the paramagnetic contrast agent gadolinium, which enhances the magnetization (T1) of protons of nearby water and creates a stronger signal. In addition, gadolinium contrast permeates through the intercellular space in necrotic or fibrotic myocardium, which is the basis for myocardial scar detection seen on late gadolinium enhancement.
CMR is able to evaluate both ventricular and valvular function. It also can evaluate atherosclerosis6 in large vessels and is capable of imaging morphology and distinguishing between different elements of atherosclerotic plaque composition including fibrous tissue, lipid core, calcification, and hemorrhage.7 In addition to vascular plaque assessment, CMR may be used for the evaluation of ischemia after the administration of gadolinium contrast agents. First-pass perfusion is evaluated at rest and after the administration of a pharmacologic stressor such as adenosine or dobutamine for the evaluation of myocardial infarction and ischemia.
 Vascular Ultrasound
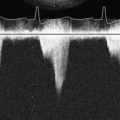
Vascular ultrasound is composed of several techniques or modes, which include grayscale imaging (also known as B-mode), pulsed- and continuous-wave Doppler imaging, and color Doppler imaging. Each of these provides different information. Duplex ultrasound uses both B-mode and pulsed-wave Doppler to acquire vessel anatomy, as well as hemodynamic data. This includes peak and mean velocities of blood flow in addition to pressure gradients caused by stenosis. Duplex is also used for the evaluation of aneurysms and dissections. Color-flow Doppler allows for the visualization and direction of blood flow through vessels. Typically, the color scale is from red (flow toward transducer) to blue (flow away from transducer; see Chapter 12). Many times it aids in the localization and identification of vessels when duplex is inadequate. Vascular ultrasound is used for the evaluation of the aorta; carotid, renal, celiac, and mesenteric arteries; the lower extremity arterial system; and the peripheral venous system. More recently, it also has come into clinical use for the evaluation of atherosclerosis by measuring carotid intima-media thickness.
Evaluation of cardiac function
 Left Ventricular Systolic Function
Perhaps the most important factor that contributes to surgical outcome is cardiac function, specifically left ventricular (LV) systolic function. Systolic dysfunction is directly related to patient outcome after surgery. Preoperative knowledge of LV systolic dysfunction is crucial for the anesthesiologist to prepare and anticipate perioperative and postoperative complications. Patients with systolic dysfunction who undergo coronary artery bypass graft (CABG) surgery require more inotropic support after cardiopulmonary bypass (CPB).8,9 In addition, systolic dysfunction is a good prognosticator for postsurgical mortality.10–12 In patients who are known to have CAD and are scheduled to have CABG surgery, the cause of systolic dysfunction is, most often than not, ischemic heart disease. In patients who are scheduled to have elective noncardiac surgery and are found to have newly diagnosed systolic dysfunction, it is important to do further testing to find the cause and exclude critical coronary stenosis and ischemia.
Transthoracic echocardiography (TTE) is the most widely used modality for this evaluation because it is inexpensive, portable, and readily available. However, limited acoustic windows may limit the accuracy of echocardiographic assessment of global and regional LV function in a significant number of patients.13
Gated images can be acquired at both rest and after stress; however, rest images typically have less radiation dose and the images may be noisy. In most institutions, gated imaging is done using poststress images because of the higher radioisotope dose and, thus, less noise. This does have its limitation for accurate LV systolic analysis in the circumstance of stress-induced ischemia, in which myocardial stunning can transiently reduce the LVEF. Another limitation of ECG-gated SPECT or PET is arrhythmias, specifically frequent premature ventricular contractions (PVCs) or atrial fibrillation.14 In patients who have extensive myocardial infarction, assessment of LV function also may be inaccurate because there is absence of isotope in the scar regions; thus, the endocardial border cannot be defined. Gated-blood pool scans (multiple gated acquisition; MUGA) image the cardiac “blood pool” with high resolution during the cardiac cycle. Ventricular function, as well as various temporal parameters, can be measured using this technique.15 There is good correlation between echocardiography and MUGA for the evaluation of LVEF. However, MUGA has demonstrated better intraobserver and interobserver reproducibility than echocardiography.16
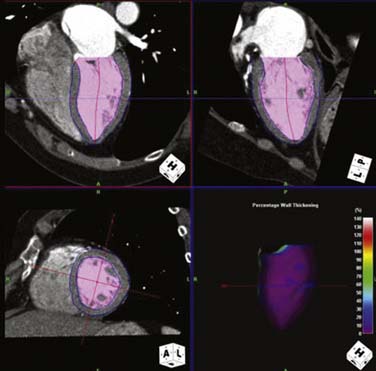
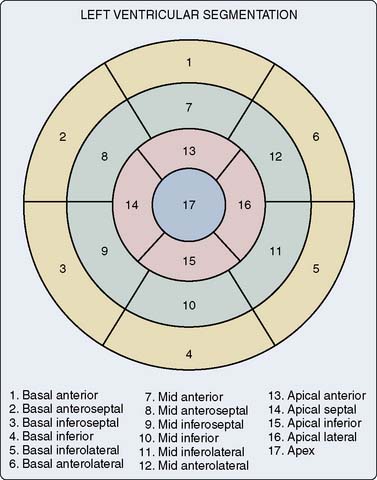
CCT, with its excellent spatial and temporal resolution, allows for an accurate assessment of LV function when compared with echocardiography, invasive ventriculography, and cardiac MRI.17–19 CCT also uses real three-dimensional volumes to calculate the LV systolic function. Functional analysis can be evaluated only when retrospective scanning is used because the entire cardiac cycle (both systole and diastole) is necessary. The raw dataset must be reconstructed in intervals or cardiac phases of 10%, from 0% (early systole) to 90% (late diastole). Advanced computer workstations allow cine images to be reconstructed and displayed in multiple planes (Figure 2-1). Segmental wall motion analysis may be performed using the 17-segment model recommended by the American Heart Association/American College of Cardiology (AHA/ACC)20 (Figure 2-2).
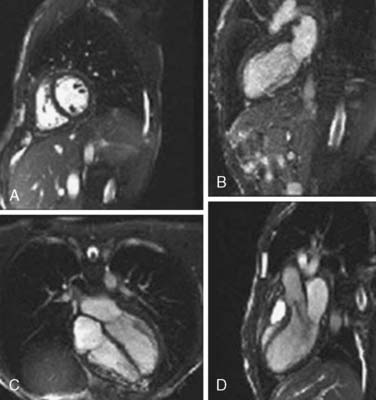
CMR is considered the gold standard for the quantitative assessment of biventricular volumes, EF, and mass, whereas also offering excellent reproducibility.21 CMR also has excellent spatial and temporal resolution allowing for cine imaging. Typically, a stack of 10 to 14 contiguous two-dimensional slices are acquired and used for LV functional analysis.22 The acquisition of each of these images generally requires a breath-hold of at least 10 to 20 seconds. In a computer workstation, the endocardial and epicardial contours of the LV can be traced in each short-axis slice at the phases of maximal and minimal ventricular dimensions. The software then calculates the volume of ventricular cavity per slice as the product of the area enclosed within the endocardial contour multiplied by the slice thickness. The data are then combined to calculate EDV and ESV and EF. In addition, cine images may be acquired in the four-, three-, and two-chamber views for LV segmental wall analysis (Figure 2-3).
 Left Ventricular Diastolic Function
Diastolic dysfunction is the most common abnormality found in patients with cardiovascular disease.23,24 Patients with diastolic dysfunction may be asymptomatic25 or may have exercise-induced dyspnea or overt heart failure.26 Until recently, the profound impact of diastolic dysfunction on perioperative management and postoperative outcome has been underestimated. In fact, the prevalence of diastolic dysfunction in patients undergoing surgery is significant. A recent study demonstrated that in more than 61% of patients with normal LV systolic function undergoing surgery, diastolic filling abnormalities were present.27 This is critical information for the anesthesiologist because patients with diastolic dysfunction who undergo CABG require more time on CPB, as well as more inotropic support up to 12 hours after surgery.28 This may be because of deterioration of diastolic dysfunction after CABG, which may persist for several hours.29–31 Taking all this into account, diastolic dysfunction increases the risk for perioperative morbidity and mortality.32
In 85% of patients with diastolic dysfunction, hypertension is the primary cause. Diastolic function requires a complex balance among several hemodynamic parameters that interact with each other to maintain LV filling with low atrial pressure, including LV relaxation, LV stiffness, aortic elasticity, atrioventricular and intraventricular electrical conduction, left atrial contractility, pericardial constraint, and neurohormonal activation. Changes in preload, afterload, stroke volume, and heart rate can upset this delicate balance.33–35
LV diastolic function is most easily and commonly assessed with echocardiography; however, different aspects of diastolic function also can be evaluated by SPECT and CMR. At least 16 phases of the cardiac cycle need to be acquired to evaluate diastolic dysfunction using SPECT. This is because diastolic functional analysis, as opposed to systolic function, is dependent on heart rate changes during acquisition and processing. The two main parameters that can be measured by SPECT are LV peak filling rate and time to peak filling rate. It is measured in EDV/sec, and is normally more than 2.5. The normal time to peak filling rate is less than 180 milliseconds. Heart rate, cardiovascular medications, and adrenergic state may alter these parameters.36
Velocity-encoded (phase-contrast) cine-CMR is capable of measuring intraventricular blood flow accurately and is able to quantify mitral valve (MV) and pulmonary vein flow, which are hemodynamic parameters of diastolic function. It has been shown that in patients with amyloidosis, echocardiography and velocity-encoded cine imaging correlate significantly in estimating pulmonary vein systole/diastole ratios, LV filling E/A ratio, and E deceleration times, which are all diastolic functional indices.37 In addition to measuring blood flow and velocity through the MV and pulmonary vein, CMR-tagging is able to measure myocardial velocities of the walls and MV similar to strain rate and tissue Doppler in echocardiography. CMR-delayed enhancement imaging also is used for the diagnosis of diastolic dysfunction. The presence and severity of fibrosis seen on delayed-enhancement imaging correlate significantly with severity of diastolic dysfunction.38
 Right Ventricular Function
In preoperative evaluation, knowledge of right ventricular (RV) dysfunction is critical for intraoperative management of the patient. RV dysfunction is an independent risk factor for clinical outcomes in patients with cardiovascular disease.39–41 Patients with RV dysfunction in the presence of LV ischemic cardiomyopathy who undergo CABG surgery have increased risk for postoperative and long-term morbidity and mortality.42 Patients with RV dysfunction often require postoperative inotropic and mechanical support, resulting in longer surgical intensive care unit and hospital stays.42 In patients who undergo mitral and mitral/aortic valve surgery, RV dysfunction is a strong predictor of perioperative mortality.43 In addition, RV dysfunction is associated with postoperative circulatory failure.44 If RV dysfunction is detected before or after surgery, further evaluation is necessary. In the case of preoperative RV dysfunction, pulmonary hypertension (PH) is a common cause that negatively impacts perioperative and postoperative outcome. PH significantly increases morbidity and mortality in patients undergoing both cardiac45,46 and noncardiac surgery.47,48 Patients with acute onset of RV dysfunction without an explained cause must be evaluated for pulmonary emboli. Recent studies have demonstrated that the incidence rate of pulmonary emboli after CABG surgery can be as high as 3.9%.49–51
CMR is the most accurate method for the assessment of RVEF and volumes.52,53 The RV is evaluated in a similar manner to the LV by CMR, where short-axis cine slices from ventricular base to apex are obtained and measured in a computer workstation. CMR is the gold standard for the diagnosis of RV dysplasia, providing assessment of global and regional function, as well as detecting the presence of myocardial fat infiltration and scarring.54,55
Global and segmental RV function also may be evaluated using first-pass radionuclide angiography (FPRNA). RVEF obtained by FPRNA has been shown to have good correlation with CMR.56
CCT also is very accurate for RV functional assessment when compared with CMR.57,58 The protocol used to acquire RV data is different from that used for coronary artery evaluation. A biphasic contrast injection is used to opacify the RV. In addition, retrospective ECG gating must be utilized to acquire the entire cardiac cycle for functional evaluation. CCT is, therefore, not frequently used primarily for RV functional assessment because the radiation dose is generally higher than for FPRNA and CMR.
Evaluation of myocardial perfusion
 Exercise versus Pharmacologic Testing
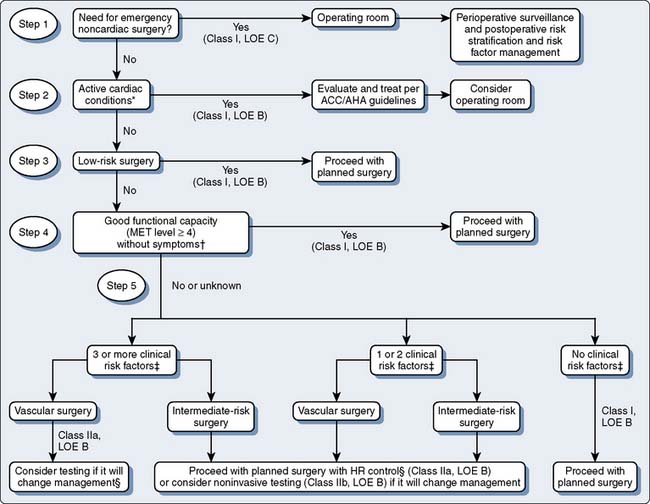
Preoperative assessment for ischemic burden in patients with CAD or those at risk for CAD who are to have elective noncardiac surgery is important. Figure 2-4 indicates the ACC/AHA algorithm for preoperative cardiac evaluation and care before noncardiac surgery. Nuclear myocardial perfusion imaging is the most common test used in the United States for preoperative evaluation. Patients can be stressed using exercise or pharmacologic agents. The preferred modality is exercise, which is most often done on a treadmill and less commonly on a stationary bike.59 For an exercise stress test to be adequate, a patient must exercise for at least 6 minutes and reach at least 85% of their maximum predicted heart rate (MPHR) adjusted for their age (MPHR= 220 − age). Uniform treadmill protocols are used to compare with peers and serial testing. The most common protocols used are Bruce and modified Bruce. In addition, exercise stress tests are symptom limited. Exercise as a stressor has robust prognostic data for the risk for future cardiac events. There are several types of scores that predict a patient’s risk for cardiovascular disease. The most commonly used score is known as the Duke treadmill score, which uses exercise time in minutes, maximum ST-segment deviation on the ECG, and anginal symptoms during exercise. Heart rate recovery to baseline after exercise is also a strong predictor for cardiovascular disease. In general, exercise stress testing is safe as long as testing guidelines are followed carefully. The risk for a major complication is 1 in 10,000.
Pharmacologic stress testing is a negative prognosticator in itself because patients who, for one reason or another, are not able to do sufficient physical activity to attempt an exercise stress test have greater incidences of cardiovascular disease and other comorbidities. Pharmacologic stress testing is also preferred in patients with a left bundle branch block, Wolf-Parkinson-White (WPW) pattern, and ventricular pacing on ECG. There are two types of pharmacologic agents available on the market today: vasodilators that include dipyridamole, adenosine, and regadenoson; and the chronotropic agent, dobutamine. They each have their advantages and disadvantages. Dipyridamole was the original stressor used for myocardial perfusion imaging. It is an indirect coronary vasodilator that prevents the breakdown and increases intravascular concentration of adenosine. It is contraindicated in those patients with asthma and those with chronic obstructive pulmonary disease (COPD) who have active wheezing. Adenosine is used more widely now because it produces fewer side effects compared with dipyridamole. It induces coronary vasodilation directly by binding to the A2A receptor. Adenosine has similar contraindications to dipyridamole. Known side effects include bronchospasm, as well as high-degree AV block; however, because the half-life is seconds, it is usually enough just to discontinue the adenosine infusion and symptoms resolve without further treatment. If the patient is able to walk slowly on the treadmill, adenosine is given while the patient walks at a constant slow pace to alleviate the severity of potential side effects. In addition, image quality is improved with low-level exercise because there is less tracer uptake in the gastrointestinal system. Regadenoson is a relatively new agent to the market. It is a selective adenosine analog. It is given as a single intravenous (IV) bolus and has less incidence of significant AV block. However, it also may cause bronchospasm in patients with asthma or active COPD.60
 Single-Photon Emission Computed Tomography versus Positron Emission Tomography Myocardial Perfusion Imaging
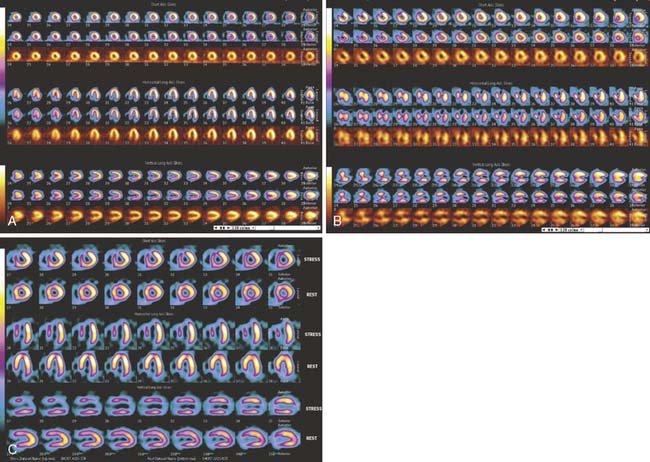
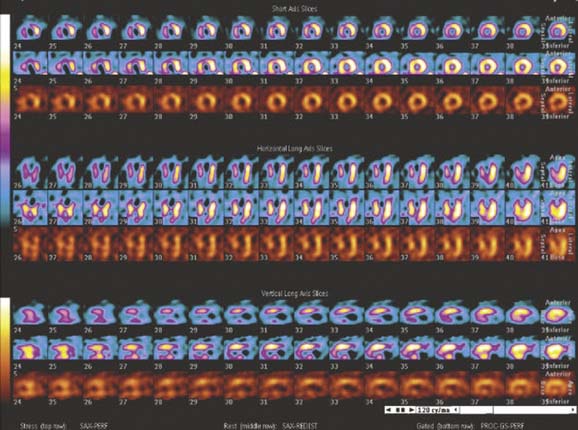
Myocardial perfusion imaging can be performed using both SPECT and PET. They are based on LV myocardial uptake of the radioisotope at rest and after stress. Myocardial uptake will be reduced after stress in corresponding myocardial regions where significant coronary artery stenosis is present. The images are displayed in three different orientations for proper LV wall-segment analysis. The three LV orientations are short-axis, horizontal long-axis, and vertical long-axis, with the stress images to the corresponding rest images directly above. Resting images are acquired to differentiate between normal myocardium and infarcted myocardium (Figure 2-5). PET scanners have inherently less attenuation and higher resolution, making them more desirable than SPECT.61 PET myocardial perfusion tests usually use pharmacologic stressors because of the very short half-life of PET radioisotopes. The sensitivity and specificity of SPECT for the detection of obstructive CAD is 91% and 72%, respectively. The use of PET improves the specificity of diagnosing obstructive CAD to 90%.61 Patients with normal SPECT and Rb PET have less than 1% and 0.4% probability of annual cardiac events, respectively. The use of myocardial perfusion tests is recommended in those patients with an intermediate risk based on CAD risk factors.
Once the patient has completed the examination, a decision must be made about what to do with the results. If the stress test is normal, then the risk for cardiovascular events is low and the patient is considered ready for surgery. If the stress test demonstrates ischemia, but the patient requires nonelective surgery, data support better outcomes with medical management. Several trials have examined the benefit of revascularization compared with medical management in patients with CAD who require noncardiac surgery. The Coronary Artery Revascularization Prophylaxis (CARP) trial evaluated more than 500 patients with significant but stable CAD who were undergoing major elective vascular disease. Percutaneous intervention was performed in 59% and CABG in 41% of the revascularization group. At 30 days after surgery, there were no differences in postoperative myocardial infarction, death, or length of hospital stay between the revascularization group and the medical management group. At 2.7 years, there was still no difference in mortality between both groups.62 The DECREASE-V study showed similar results. In this study, 430 high-risk patients were enrolled to undergo revascularization versus medical management before high-risk vascular surgery. Among the high-risk patients, 23% had extensive myocardial ischemia on stress testing. Again at 30 days and at 1 year, there were no differences in postoperative myocardial infarction or mortality between the revascularization and medical management groups.63
With respect to the use of perioperative β-blockers, they should be continued in those patients who are already taking them. In those patients who are at high risk because of known CAD or have ischemia on preoperative testing, β-blockers may be started and titrated to blood pressure and heart rate, while avoiding bradycardia and hypotension.64,65
 Magnetic Resonance Perfusion Imaging
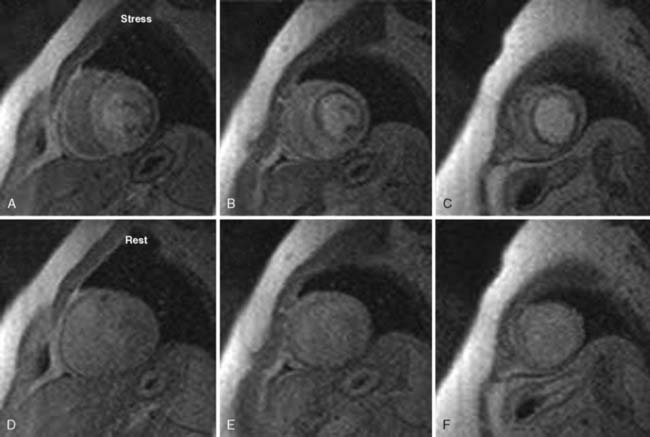
CMR perfusion imaging is evaluated by the first pass of IV gadolinium contrast through the myocardium. ECG-gated images are acquired generally using three LV short-axis slices (base, mid, and apical) and, possibly, a four-chamber image depending on the heart rate. As the contrast is being injected, it is being tracked through the right side of the heart and, subsequently, the LV cavity and the LV myocardium. The assessment of perfusion requires imaging during several consecutive heartbeats during which the contrast bolus completes its first pass through the myocardium. This is done during a breath-hold. First-pass perfusion images are acquired at rest, then repeated during adenosine infusion. The same slice positions (between 3 or 4) are used for both rest and stress for comparison (Figure 2-6). Perfusion defects appear as areas of delayed and/or decreased myocardial enhancement and are interpreted visually.
The accuracy of stress MRI perfusion has been validated in several trials. In one trial, which evaluated 147 consecutive women with chest pain or other symptoms suggestive of CAD, MRI perfusion was compared with invasive angiography. The CMR perfusion stress test had a sensitivity, specificity, and accuracy of 84%, 88%, and 87%, respectively.66 Another study comparing stress perfusion MRI to invasive angiography examined 102 subjects. CMR demonstrated a sensitivity of 88% and specificity of 82% for the diagnosis of significant flow- limiting stenosis.67 A negative MRI perfusion stress test also confers significant prognostic information. Patients with a normal stress MRI have a 3-year event-free survival rate of 99.2%.68
Evaluation of myocardial metabolism
 Stunned and Hibernating Myocardium
Myocardial stunning occurs during acute ischemic injury in which the cardiac myocytes that are on the border of the myocardial infarction are underperfused and sustain temporary loss of function. In theory, function to these myocytes returns once the acute phase of injury resolves; however, this depends on duration of ischemic injury and time to recovery of blood flow to the artery. On rest perfusion imaging, this area would be normal.69 If blood flow is not returned to normal levels or if repetitive stunning occurs, the myocardium enters a chronic state of hibernation. About 24% to 82% of hibernating myocardial segments can recover function after target-vessel revascularization; in different series, anywhere between 38% and 88% of patients with hibernating myocardium experience improvement in LVEF.69,70 Several studies indicate meaningful improvement of LV systolic function occurs; at least 20% to 30% of the myocardium should be hibernating or ischemic.
Thallium-201 is used frequently for viability assessment with SPECT imaging, taking advantage of this isotope’s long half-life (73 hours). Thallium uptake is dependent on several physiologic factors, including blood flow and sarcolemmal intercellular integrity. Thallium is taken up in a short time in normal myocardium, but may take up to 24 hours in hibernating myocardium that still has metabolic activity. Patients are injected with thallium radioisotope and imaged the same day for baseline images. They are brought back after 24 hours without any further injection and reimaged. Baseline images are compared with the 24-hour images. Defects that are present at baseline and fill in at 24 hours represent viability (Figure 2-7). Technetium radioisotopes also can be used for the evaluation of viable myocardium using different protocols.
PET imaging is more sensitive than SPECT and is considered by many experts as the gold standard for assessment of viability. PET has the ability to identify the presence of preserved metabolic activity in areas of decreased perfusion using 18-fluorodeoxyglucose (FDG). PET imaging uses both FDG and either rubidium or ammonia radioisotopes for quantification of energy utilization by the myocardium, as well as for evaluating patterns of blood flow. Areas with reduced blood flow and reduced FDG uptake are considered scar and infarcted. Areas with reduced blood flow (> 50%) and normal FDG uptake are considered viable.69 A recent meta-analysis analyzing more than 750 patients demonstrated a sensitivity of 92% and specificity of 63% for regional functional recovery with positive and negative predictive values of 74% and 87%.71 When viable myocardium is detected by PET, it is important to revascularize as soon as possible because recovery of function decreases as revascularization is delayed.72,73
 Myocardial Scar Imaging
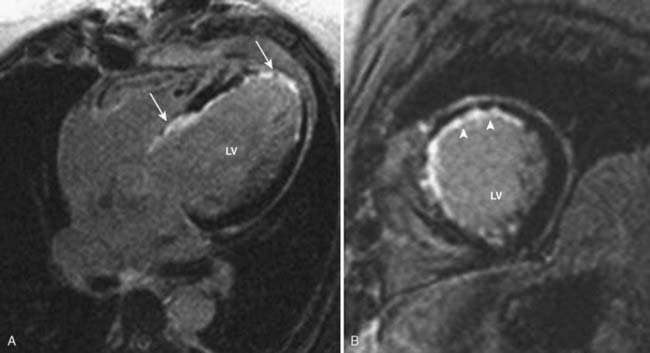
CMR has taken over as the gold standard for evaluation of myocardial scarring. Delayed-enhancement (DE) imaging is achieved by administering gadolinium contrast intravenously and imaging 5 to 10 minutes later. Gadolinium contrast accumulates extracellularly; however, in normal myocardium, there is not sufficient space for gadolinium deposition. In the setting of chronic scar, the volume of gadolinium distribution increases because of an enlarged interstitium in the presence of extensive fibrosis.74 Hence, normal or viable myocardium appears as nulled or dark, whereas scar appears bright (Figure 2-8). The advantage of delayed enhancement imaging is that it allows for the assessment of transmural extent of the scar. The percentage of scar-to-wall thickness is the basis for prognosis of viability and segmental functional recovery. Generally, identical LV short-axis images used for function are acquired for DE imaging. This allows for side-by-side comparison of function and DE evaluation. DE imaging is analyzed visually, and the thickness of scarring is quantified as percentages (none, 1–25%, 26–50%, 51–75%, 75–100%). A wall segment is considered to be viable and has a high probability of functional recovery if the scar thickness is ≤ 50% of the wall.75
 Autonomic Innervation
Myocardial infarction causes denervation of the scar and subsequent interruption of sympathetic nerves induces denervation of adjacent viable myocardium.76,77 Sympathetic nerves are very sensitive to ischemia and usually become dysfunctional after repeated episodes of ischemia that do not result in irreversible myocyte injury.78,79 Matsunari et al.80 demonstrated that the area of denervation is larger than the area of scar and corresponds to the area at risk for ischemia. In addition, Bulow et al.81 showed that denervation of myocytes occurs in the absence of previous infarction. Myocyte sympathetic innervation is measured by PET using the radioisotope 11C-hydroxyephedrine (HED). This is compared with PET resting perfusion to determine the area of the scar. Areas of normal resting perfusion and reduced HED retention indicate viable myocardium. In addition, SPECT imaging of myocardial uptake of 123I-mIBG, which is an analog of the sympathetic neurotransmitter norepinephrine, provides an assessment of β-receptor density. Reduced 123I-mIBG uptake is associated with adverse outcomes in patients with heart failure and has been proposed as a marker of response to treatment.82
Valvular heart disease
 Aortic Valve Disease
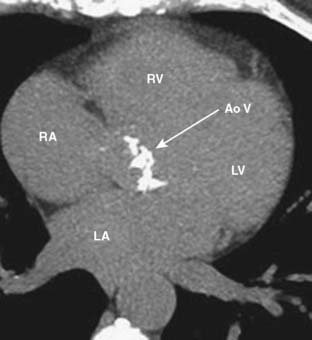
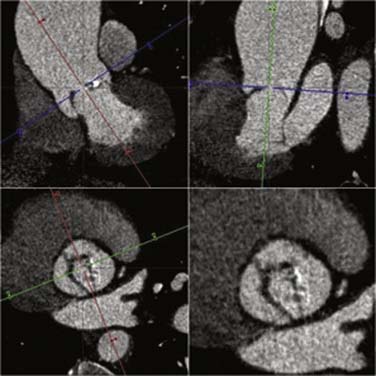
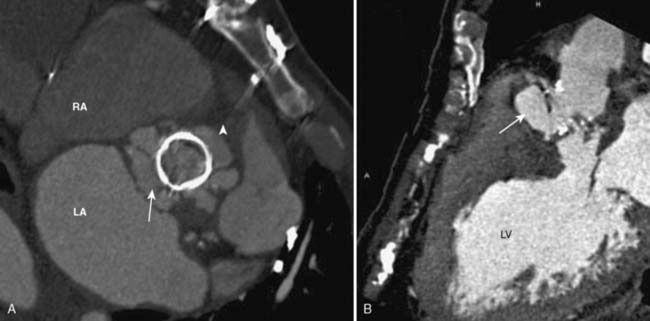
Transthoracic and transesophageal echocardiography (TEE) are the principal imaging modalities for valvular heart disease; however, on several occasions, additional imaging adds important information. Aortic stenosis (AS) is a common cause for valve replacement. There are several different mechanisms for AS. For patients younger than 75, congenital bicuspid aortic valve (BAV) is the most common cause. They have a high incidence of calcification and stenosis. In patients older than 75, senile degenerative calcification of the aortic valve is the leading cause, which is most frequently seen in men.83 Patients with degenerative aortic valve disease typically have concurrent CAD because they both have common risk factors including hypertension, active tobacco smoking, increased low-density lipoprotein (LDL), and lipoprotein (a) levels. In addition, patients with metabolic syndrome have increased incidence of aortic calcification.84 Aortic calcification is directly related to the development of AS. CCT is an excellent tool for the evaluation of aortic valve calcification (Figure 2-9). This can be achieved by noncontrast CCT using the same protocol as calcium scoring of the coronary arteries. Coronary artery calcium is measured using the Agatston method. An aortic valve calcium score of ≥ 1100 has a 93% sensitivity and 82% specificity for severe AS.85 Contrast-enhanced CCT allows for excellent visualization of the aortic valve and accurately differentiates between bicuspid and tricuspid aortic valves86 (Figure 2-10). Aortic valve area (AVA) also can be evaluated by CCT using planimetry. AVAs measured by CCT have a strong correlation with valve areas and transvalvular gradients obtained by echocardiography.87–91
Regurgitant orifice areas measured by CCT have an excellent correlation to AR severity parameters, including vena contracta width and regurgitant/left ventricular outflow tract (LVOT) height ratio obtained by TTE.92,93
CMR, like CCT, allows for excellent evaluation of valvular morphology, but it also has advantages over CCT including blood-flow analysis, as well as no radiation exposure. CMR allows for differentiation between BAV and TAV using cine imaging. AS severity can be quantified using phase-encoding imaging. Similarly to echocardiography, phase-encoding imaging allows for the measurement of velocities through the AV, which, in turn, can be used to derive mean and peak AV gradients by implementing the modified Bernoulli equation (ΔP = 4V2). The effective AVA also can be obtained by measuring the LVOT area and using the continuity equation: Areavalve = AreaLVOT [VTILVOT/VTIvalve].94 Another approach to calculation of the AVA is by direct planimetry of the AV using cine images95 (Figure 2-11).
CMR also uses phase-encoded imaging for the evaluation of AR. Phase-encoded imaging is acquired just above the AV, and the velocity and the volume of blood per heartbeat are measured in the forward and reverse directions. This allows for measurement of the exact amount of blood that exits the AV, as well as the amount of blood that regurgitates back through the valve. From this the regurgitant amount and regurgitant fraction are obtained (Table 2-1).
TABLE 2-1 Aortic and Mitral Valve Regurgitant Fractions and Corresponding Severity
| Regurgitant Fraction (%) | Severity of Regurgitation |
|---|---|
| ≤ 15 | Mild |
| 16–25 | Moderate |
| 26–48 | Moderate-to-severe |
| > 48 | Severe |
 Mitral Valve Disease
The most common cause of mitral stenosis (MS) worldwide continues to be rheumatic heart disease. In the United States, it rarely is seen except for in the immigrant population. Visualization of the valvular apparatus in rheumatic valvular disease demonstrates retraction, thickening, and calcification of the mitral leaflets, chordae, and, occasionally, papillary muscles. Accurate assessment of MV morphology is performed by examining cine imaging using ECG-gated, contrast-enhanced CCT.96,97 Calcium scoring of the MV also is possible, but it has lower reproducibility than for the AV.98 The degree of MV calcification correlates significantly with the severity of stenosis seen on TTE.99 MV areas obtained by planimetry also correlate significantly with TTE data of MS.100
Severity of the mitral regurgitation using CCT can be assessed by planimetry of the regurgitant orifice, which in a recent study has been shown to correlate with TEE.101 In addition, the presence of calcification of the MV annulus and leaflets will determine whether the valve can be repaired or needs to be replaced.
 Tricuspid Valve Disease
 Pulmonic Valve Disease
 Prosthetic Valves
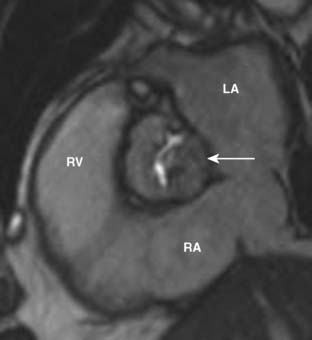
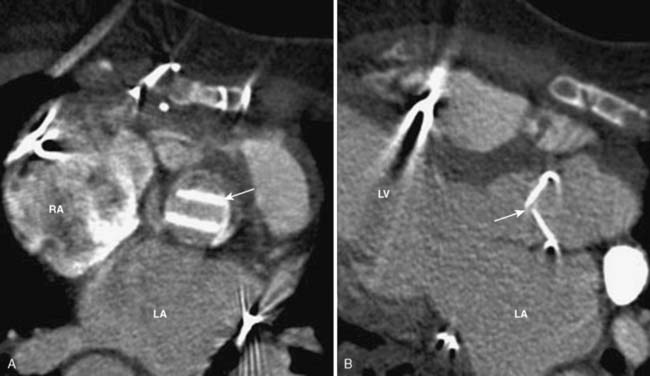
The visualization of mechanical prosthetic valves is difficult with TTE and TEE because of metal-related artifacts. CCT has the ability to clearly depict the mechanical prosthesis and detect any abnormality including valve thrombosis. This is done by using retrospective scanning and acquiring the entire cardiac cycle to play the cine movie and visualize the leaflets through systole and diastole. The mechanical valves that are used today consist of two disks that open symmetrically (Figure 2-12). The valve function of the two-disk prosthesis, as well as opening and closing angles, was evaluated by CCT and then compared with fluoroscopy and echocardiography. CCT correlated significantly with both imaging modalities for two-disk mechanical valves.102 The role of CT in the assessment of bioprosthetic valves is similar because the metallic ring causes artifact on echo and often is difficult to assess.
In general, echocardiography is the gold standard for imaging valvular disease; however, when TTE or TEE is technically difficult or there are discrepancies between tests, advanced imaging is recommended. CMR offers more functional data than CCT; however, CCT may be used when further anatomic information about a valve is required. For evaluating prosthetic valves, CCT is usually superior to CMR because of metallic artifact from the valve, which is seen on CMR (see Chapters 12, 13, and 19).
 Infective Endocarditis
Bacterial endocarditis is a cause for valve replacement of native and prosthetic valves and is a life-threatening disease. Valvular endocarditis is associated with a mortality of up to 40%.103 Diagnosis is usually made by visualization of vegetations by TEE, which is the gold standard for diagnosis. In severe cases of endocarditis, perivalvular abscesses are present and are an indication for valve replacement. CCT is excellent for the diagnosis of abscesses. They appear as perivalvular fluid-filled collections on CCT and are imaged by acquiring a delayed scan approximately 1 minute after contrast is given. Contrast is retained within the abscess after the contrast washes out of the circulation104 (Figure 2-13). A recent study comparing multidetector computed tomography (MDCT) with intraoperative TEE for the detection of suspected infective endocarditis and abscesses demonstrated excellent correlation. CCT correctly identified 96% of patients with valvular vegetations and 100% of patients with abscesses. In addition, CCT performed better than TEE in the characterization of abscesses.105
 Preoperative Coronary Evaluation before Valve Surgery
Coronary computed tomography angiography (CCTA) has been used in many centers for the evaluation of CAD in patients with low-to-intermediate CAD risk before valve surgery to avoid invasive testing. CCTA has been well-studied in the diagnosis of CAD in patients without known ischemic heart disease, demonstrating a sensitivity of 94% and a negative predictive value of 99%106 (Figure 2-14). Several studies have examined the use of CCTA for preoperative evaluation before valve surgery. One such study used 64-slice MDCT in 50 patients, who had a mean age of 54 years, undergoing valve replacement for AR. CCTA demonstrated a sensitivity of 100%, specificity of 95%, and a negative predictive value of 100%, respectively, when compared with invasive catheterization. In addition, it was determined that 70% of the patients could have avoided invasive catheterization.107 Two further studies used preoperative 16- and 64-slice CCTA in patients with AS. The mean ages of the patients were 68 and 70 years, respectively. Both the sensitivity and negative predictive value for each study were 100% for the detection of significant stenosis.108,109 These studies show that preoperative coronary evaluation with CCTA is safe and accurate. It is important that only patients with no known CAD or those with low-to-intermediate risk are referred for CCTA. In general, patients with degenerative AS are older and have greater risk for CAD.110 Patients who undergo valve surgery for mitral regurgitation because of MV prolapse are usually younger and are excellent candidates for CCTA (Table 2-2).
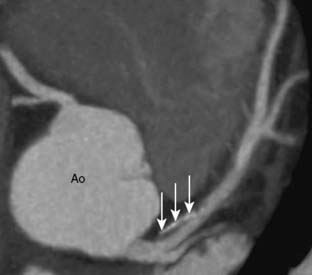
TABLE 2-2 Appropriate Indications for the Use of Computed Tomography Angiography141
CAD, coronary artery disease.
Vascular disease
 Carotid Artery Stenosis
Stroke is a severely debilitating disease, and extracranial atherosclerotic disease, specifically carotid artery stenosis, is the major cause. Atherosclerotic plaques most often form in the proximal internal carotid artery; however, the common carotid artery is also the culprit at times. In patients who have had a carotid endarterectomy, the distal common carotid artery is a frequent location for plaque formation. Generally, stroke occurs as the first symptom of the disease, and often a carotid bruit is the only sign that can be seen on physical examination. The two main predictors for stroke are previous symptoms (transient ischemic attack and recent stroke) and severity of stenotic lesions.111 For this reason, diagnosis is critical for the prevention of stroke. Several imaging modalities can be used for diagnosis. CTA has excellent spatial and contrast resolution for plaque detection, as well as morphology. It is able to detect plaque at the bifurcation of the internal and external carotid arteries, and is used to define vascular anatomy proximal and distal to a stenotic plaque.
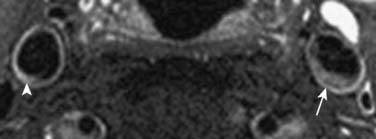
Magnetic resonance angiography (MRA) is another tool for carotid artery assessment. It is more expensive than the previous two modalities, but it is relatively safe and provides anatomy, as well as plaque morphology. “Black-blood” imaging is a magnetic resonance sequence in which blood is black and vessel walls are enhanced to highlight and define plaque morphology (Figure 2-15). Angiography can be performed without gadolinium contrast by using “time-of-flight” sequence, which provides high-intensity signals for flowing blood. In addition, PC imaging also can give blood flow velocity pressure information across stenotic lesions. In general, CT and MRI are used only in the cases in which vascular ultrasound is limited or when a patient requires carotid endarterectomy for carotid artery stenosis.
 Aortic Aneurysm and Dissection
The aorta is composed of three different layers: the intima, which is a thin delicate inner layer; the media, which is a thick middle layer; and the adventitia, which is a thin outer layer. Aortic aneurysm is a dilatation of a segment or various segments of the aorta. Aneurysm refers to a dilatation of more than 1.5 times the normal size. Ascending aortic aneurysms usually occur because of cystic medial degeneration. These aneurysms frequently involve the aortic root and cause AR. There are also several connective tissue diseases that predispose a patient to aortic aneurysms, including Marfan and Ehler–Danlos syndromes; in addition, patients with Turner syndrome or congenital BAV are also at greater risk (see Chapter 21).112
Aortic dissection is one of the true emergencies and needs to be diagnosed and treated surgically when it involves the ascending or aortic arch. In aortic dissections there is a tear in the intima that forms a communication with the aortic true lumen. The media is exposed to blood flow and a false lumen typically forms, and the dissection extends antegradely or retrogradely.113,114
 Renal Artery Stenosis
Renal artery stenosis (RAS) is the most common cause of secondary hypertension. It can be caused by atherosclerosis, fibromuscular dysplasia, or systemic disease, which affects the renal arteries. Atherosclerosis is responsible for approximately 90% of all RAS cases.115,116 Fibromuscular dysplasia is the most common cause in young and middle-aged women and is responsible for 10% of all cases. Atherosclerotic RAS is associated with similar CAD risk factors including diabetes, hypertension, and dyslipidemia. The clinical presentation can appear as renal involvement or extrarenal involvement. RAS can cause renovascular hypertension in addition to systemic hypertension and causes renal damage, renal atrophy, and the creatinine level to increase. Extrarenal effects range from angina, myocardial infarction, to hypertension-induced stroke and flash pulmonary edema.
MRA is an excellent tool for the diagnosis of RAS. Using multicontrast and contrast-enhanced magnetic resonance, the sensitivity and specificity for the diagnosis of RAS are 100% and 99%, respectively.117–124 In addition, the renal artery assessment, anatomic, and perfusion evaluation of the kidneys are also performed.
 Peripheral Arterial Disease
Peripheral arterial disease (PAD) refers to noncoronary atherosclerosis but is considered a CAD equivalent. Cerebrovascular and renovascular disease are generally considered separate entities, and PAD usually refers to lower extremity disease. Because atherosclerosis is a systemic disease, patients with coronary atherosclerosis should be assumed to have PAD as well and vice versa. However, a history of cigarette smoking confers two to three times more risk for PAD than CAD.125 Eighty percent of all patients with PAD are active smokers or have smoked cigarettes in the past.126,127 In the PARTNERS study, almost 7000 patients were evaluated for the prevalence of PAD. Ankle–brachial indices (ABIs) were used for PAD diagnosis. The study included subjects older than 70 years of age or subjects between the age of 50 and 69 with either history of tobacco smoking or diabetes. PAD was found in 29% of this population.128 PAD most often is asymptomatic, with a relatively small percentage of patients experiencing intermittent claudication.129–131
CTA and MRA may be the preferred modalities in the cases in which percutaneous or surgical intervention is planned. CTA because of its excellent spatial resolution has a sensitivity and specificity of greater than 92.9% and greater than 96.2%, respectively, for the detection of obstructions greater than 50%.132,133
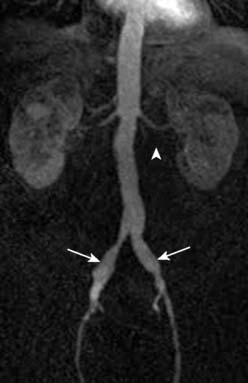
MRA also is accurate for the detection of PAD (Figure 2-16). It has a sensitivity and specificity between 90% and 100% for the detection of greater than 50% stenosis when compared with conventional angiography.134 When MRA is compared with CTA, MRA demonstrates greater interobserver agreement.135,136
 Pulmonary Arterial Disease
Pulmonary arterial disease is important for preoperative evaluation and postoperative care. The two principal entities are PH and pulmonary embolus (PE). PH is a very complex disease and increases the risk for perioperative morbidity and mortality. It is defined as a chronic elevation of mean pulmonary arterial pressure to greater than 25 mm Hg at rest or greater than 30 mm Hg with exercise. Patients who require CABG are increasingly sicker people who often have several comorbidities including significant PH. It commonly is diagnosed by echocardiography or by invasive right-heart catheterization. CTA also can evaluate signs of PH by analyzing RV function, RV and RA volumes, RV hypertrophy, enlarged proximal pulmonary vessels, and pruning of distal ones. ECG-gated CTA is required to assess RV function and volumes. CMR is the gold standard for RV functional analysis; however, 64-MDCT was recently compared with CMR for RV function and RV volumes and was found to have excellent correlation.137 CMR, in addition to its analysis of the RV, PC imaging of the PA can be used to evaluate severity of PH. This is performed by measuring the velocity of blood in the PA, as well as the elasticity of the PA.
PE is usually caused by migration of a deep venous thrombosis (DVT) to the pulmonary arterial system. DVTs occur more frequently after surgery, and 80% of the time PEs are caused from lower extremity DVTs. In the United States, 2.5 million cases of DVT occur annually. Approximately 25% of all untreated DVTs will embolize and cause a PE. Vascular ultrasound is the imaging modality of choice for the diagnosis of DVT. The sensitivity and specificity for the detection of lower extremity DVTs are 90.6% and 94.6%, respectively.138
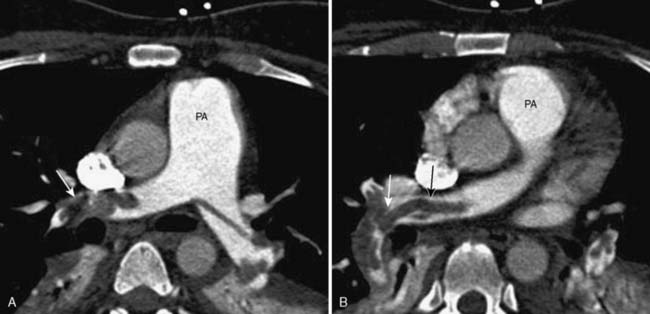
The test of choice for the diagnosis of PE is MDCT angiography (Figure 2-17). It has a sensitivity and specificity of 83% and 96%, respectively, for the detection of acute PE. Including a lower extremity CT venogram increased the sensitivity and specificity for PE diagnosis to 90% and 95%, respectively. However, this is accompanied by a much higher level of ionizing radiation exposure139 (see Chapter 24).
 Peripheral Venous Insufficiency
Chronic venous insufficiency includes a large array of symptoms. It occurs more often with increased age and also has a greater incidence in women than men. Common clinical symptoms include limb pain, swelling, stasis skin changes, itching, restless legs, nocturnal leg cramps, and ulceration. In general, most cases of deep venous disease have either a nonthrombotic or post-thrombotic cause. Both types can involve reflux, obstruction, or a combination. Vascular inflammation, most notably by way of several cytokine mechanisms, causes tissue damage and, thus, chronic venous insufficiency.140 Vascular ultrasound is commonly used for diagnosis of venous disease. In addition to previously mentioned DVT diagnosis, it also is accurate for the detection of venous post-thrombotic changes, patterns of obstructive flow, and reflux.
Summary
Echocardiography and invasive angiography remain the most widely used modalities for evaluation of LV function, valvular and ischemic heart disease. CCTA and CMR are increasingly utilized when there are conflicting results or when further information is required in the patient evaluated before surgery.142–144 It is important for the anesthesiologist to understand the advantages and limitations of all these imaging modalities and to use them to complement each other for the overall benefit of the patient; taking into account accuracy, cost, time, and potential radiation exposure, whose long-term effects are still not clearly understood.
1 Shuman W.P., Branch K.R., May J.M., et al. Prospective versus retrospective ECG gating for 64-detector CT of the coronary arteries: Comparison of image quality and patient radiation dose. Radiology. 2008;248:431-437.
2 Scheffel H., Alkadhi H., Leschka S., et al. Low-dose CT coronary angiography in the step-and-shoot mode: Diagnostic performance. Heart. 2008;94:1132-1137.
3 Hirai N., Horiguchi J., Fujioka C., et al. Prospective versus retrospective ECG-gated 64-detector coronary CT angiography: Assessment of image quality, stenosis, and radiation dose. Radiology. 2008;248:424-430.
4 Aletras A.H., Tilak G.S., Natanzon A., et al. Retrospective determination of the area at risk for reperfused acute myocardial infarction with T2-weighted cardiac magnetic resonance imaging: Histopathological and displacement encoding with stimulated echoes (DENSE) functional validations. Circulation. 2006;113:1865-1870.
5 Larose E., Yeghiazarians Y., Libby P., et al. Characterization of human atherosclerotic plaques by intravascular magnetic resonance imaging. Circulation. 2005;112:2324-2331.
6 Fayad Z.A., Fuster V., Fallon J.T., et al. Noninvasive in vivo human coronary artery lumen and wall imaging using black-blood magnetic resonance imaging. Circulation. 2000;102:506-510.
7 Fayad Z.A., Fuster V. Characterization of atherosclerotic plaques by magnetic resonance imaging. Ann N Y Acad Sci. 2000;902:173-186.
8 Royster R.L., Butterworth JFt, Prough D.S., et al. Preoperative and intraoperative predictors of inotropic support and long-term outcome in patients having coronary artery bypass grafting. Anesth Analg. 1991;72:729-736.
9 Lewis K.P. Early intervention of inotropic support in facilitating weaning from cardiopulmonary bypass: The New England Deaconess Hospital experience. J Cardiothorac Vasc Anesth. 1993;7:40-45.
10 Winkel E., Piccione W. Coronary artery bypass surgery in patients with left ventricular dysfunction: Candidate selection and perioperative care. J Heart Lung Transplant. 1997;16:S19-S24.
11 Higgins T.L., Yared J.P., Ryan T. Immediate postoperative care of cardiac surgical patients. J Cardiothorac Vasc Anesth. 1996;10:643-658.
12 Rao V., Ivanov J., Weisel R.D., et al. Predictors of low cardiac output syndrome after coronary artery bypass. J Thorac Cardiovasc Surg. 1996;112:38-51.
13 Bellenger N.G., Burgess M.I., Ray S.G., et al. Comparison of left ventricular ejection fraction and volumes in heart failure by echocardiography, radionuclide ventriculography and cardiovascular magnetic resonance; are they interchangeable? Eur Heart J. 2000;21:1387-1396.
14 Germano G.B. Nuclear Cardiac Imaging: Principles and Applications, ed 3. New York: Oxford University Press, 2003.
15 Green M.V., Ostrow H.G., Douglas M.A., et al. High temporal resolution ECG-gated scintigraphic angiocardiography. J Nucl Med. 1975;16:95-98.
16 van Royen N., Jaffe C.C., Krumholz H.M., et al. Comparison and reproducibility of visual echocardiographic and quantitative radionuclide left ventricular ejection fractions. Am J Cardiol. 1996;77:843-850.
17 Henneman M.M., Schuijf J.D., Jukema J.W., et al. Assessment of global and regional left ventricular function and volumes with 64-slice MSCT: A comparison with 2D echocardiography. J Nucl Cardiol. 2006;13:480-487.
18 Hundt W., Siebert K., Wintersperger B.J., et al. Assessment of global left ventricular function: Comparison of cardiac multidetector-row computed tomography with angiocardiography. J Comput Assist Tomogr. 2005;29:373-381.
19 Wu Y.W., Tadamura E., Yamamuro M., et al. Estimation of global and regional cardiac function using 64-slice computed tomography: A comparison study with echocardiography, gated-SPECT and cardiovascular magnetic resonance. Int J Cardiol. 2008;128:69-76.
20 Cerqueira M.D., Weissman N.J., Dilsizian V., et al. Standardized myocardial segmentation and nomenclature for tomographic imaging of the heart: A statement for healthcare professionals from the Cardiac Imaging Committee of the Council on Clinical Cardiology of the American Heart Association. Circulation. 2002;105:539-542.
21 Pujadas S., Reddy G.P., Weber O., et al. MR imaging assessment of cardiac function. J Magn Reson Imaging. 2004;19:789-799.
22 Roussakis A., Baras P., Seimenis I., et al. Relationship of number of phases per cardiac cycle and accuracy of measurement of left ventricular volumes, ejection fraction, and mass. J Cardiovasc Magn Reson. 2004;6:837-844.
23 Fischer M., Baessler A., Hense H.W., et al. Prevalence of left ventricular diastolic dysfunction in the community. Results from a Doppler echocardiographic-based survey of a population sample. Eur Heart J. 2003;24:320-328.
24 Kuznetsova T., Herbots L., Lopez B., et al. Prevalence of left ventricular diastolic dysfunction in a general population. Circ Heart Fail. 2009;2:105-112.
25 Yturralde R.F., Gaasch W.H. Diagnostic criteria for diastolic heart failure. Prog Cardiovasc Dis. 2005;47:314-319.
26 Aurigemma G.P., Gaasch W.H. Clinical practice. Diastolic heart failure. N Engl J Med. 2004;351:1097-1105.
27 Phillip B., Pastor D., Bellows W., Leung J.M. The prevalence of preoperative diastolic filling abnormalities in geriatric surgical patients. Anesth Analg. 2003;97:1214-1221.
28 Bernard F., Denault A., Babin D., et al. Diastolic dysfunction is predictive of difficult weaning from cardiopulmonary bypass. Anesth Analg. 2001;92:291-298.
29 McKenney P.A., Apstein C.S., Mendes L.A., et al. Increased left ventricular diastolic chamber stiffness immediately after coronary artery bypass surgery. J Am Coll Cardiol. 1994;24:1189-1194.
30 Ekery D.L., Davidoff R., Orlandi Q.G., et al. Imaging and diagnostic testing: Diastolic dysfunction after coronary artery bypass grafting: A frequent finding of clinical significance not influenced by intravenous calcium. Am Heart J. 2003;145:896-902.
31 Skarvan K., Filipovic M., Wang J., et al. Use of myocardial tissue Doppler imaging for intraoperative monitoring of left ventricular function. Br J Anaesth. 2003;91:473-480.
32 Apostolakis E.E., Baikoussis N.G., Parissis H., et al. Left ventricular diastolic dysfunction of the cardiac surgery patient; a point of view for the cardiac surgeon and cardio-anesthesiologist. J Cardiothorac Surg. 2009;4:67.
33 Gaasch W.H., LeWinter M.M. Left Ventricular Diastolic Dysfunction and Heart Failure. Philadelphia: Lea & Febiger, 1994.
34 Katz A.M. Physiology of the Heart. New York: Raven Press, 1992.
35 Grossman W. Diastolic Relaxation of the Heart. Boston: Martinez Nijhoff, 1988.
36 Arrighi J.A., Soufer R. Left ventricular diastolic function: Physiology, methods of assessment, and clinical significance. J Nucl Cardiol. 1995;2:525-543.
37 Rubinshtein R., Glockner J.F., Feng D., et al. Comparison of magnetic resonance imaging versus Doppler echocardiography for the evaluation of left ventricular diastolic function in patients with cardiac amyloidosis. Am J Cardiol. 2009;103:718-723.
38 Moreo A., Ambrosio G., De Chiara B., et al. Influence of myocardial fibrosis on left ventricular diastolic function: Noninvasive assessment by cardiac magnetic resonance and echo. Circ Cardiovasc Imaging. 2009;2:437-443.
39 Polak J.F., Holman B.L., Wynne J., Colucci W.S. Right ventricular ejection fraction: An indicator of increased mortality in patients with congestive heart failure associated with coronary artery disease. J Am Coll Cardiol. 1983;2:217-224.
40 de Groote P., Millaire A., Foucher-Hossein C., et al. Right ventricular ejection fraction is an independent predictor of survival in patients with moderate heart failure. J Am Coll Cardiol. 1998;32:948-954.
41 Mehta S.R., Eikelboom J.W., Natarajan M.K., et al. Impact of right ventricular involvement on mortality and morbidity in patients with inferior myocardial infarction. J Am Coll Cardiol. 2001;37:37-43.
42 Maslow A.D., Regan M.M., Panzica P., et al. Precardiopulmonary bypass right ventricular function is associated with poor outcome after coronary artery bypass grafting in patients with severe left ventricular systolic dysfunction. Anesth Analg. 2002;95:1507-1518. table of contents
43 Pinzani A., de Gevigney G., Pinzani V., et al. [Pre- and postoperative right cardiac insufficiency in patients with mitral or mitral-aortic valve diseases]. Arch Mal Coeur Vaiss. 1993;86:27-34.
44 Haddad F., Denault A.Y., Couture P., et al. Right ventricular myocardial performance index predicts perioperative mortality or circulatory failure in high-risk valvular surgery. J Am Soc Echocardiogr. 2007;20:1065-1072.
45 Bernstein A.D., Parsonnet V. Bedside estimation of risk as an aid for decision-making in cardiac surgery. Ann Thorac Surg. 2000;69:823-828.
46 Nashef S.A., Roques F., Michel P., et al. European system for cardiac operative risk evaluation (EuroSCORE). Eur J Cardiothorac Surg. 1999;16:9-13.
47 Yeo T.C., Dujardin K.S., Tei C., et al. Value of a Doppler-derived index combining systolic and diastolic time intervals in predicting outcome in primary pulmonary hypertension. Am J Cardiol. 1998;81:1157-1161.
48 Ramakrishna G., Sprung J., Ravi B.S., et al. Impact of pulmonary hypertension on the outcomes of noncardiac surgery: Predictors of perioperative morbidity and mortality. J Am Coll Cardiol. 2005;45:1691-1699.
49 Josa M., Siouffi S.Y., Silverman A.B., et al. Pulmonary embolism after cardiac surgery. J Am Coll Cardiol. 1993;21:990-996.
50 Goldhaber S.Z., Hirsch D.R., MacDougall R.C., et al. Prevention of venous thrombosis after coronary artery bypass surgery (a randomized trial comparing two mechanical prophylaxis strategies). Am J Cardiol. 1995;76:993-996.
51 Pouplard C., May M.A., Iochmann S., et al. Antibodies to platelet factor 4-heparin after cardiopulmonary bypass in patients anticoagulated with unfractionated heparin or a low-molecular-weight heparin: Clinical implications for heparin-induced thrombocytopenia. Circulation. 1999;99:2530-2536.
52 Mogelvang J., Stubgaard M., Thomsen C., Henriksen O. Evaluation of right ventricular volumes measured by magnetic resonance imaging. Eur Heart J. 1988;9:529-533.
53 Grothues F., Moon J.C., Bellenger N.G., et al. Interstudy reproducibility of right ventricular volumes, function, and mass with cardiovascular magnetic resonance. Am Heart J. 2004;147:218-223.
54 Tandri H., Saranathan M., Rodriguez E.R., et al. Noninvasive detection of myocardial fibrosis in arrhythmogenic right ventricular cardiomyopathy using delayed-enhancement magnetic resonance imaging. J Am Coll Cardiol. 2005;45:98-103.
55 Hunold P., Wieneke H., Bruder O., et al. Late enhancement: A new feature in MRI of arrhythmogenic right ventricular cardiomyopathy? J Cardiovasc Magn Reson. 2005;7:649-655.
56 Johnson L.L., Lawson M.A., Blackwell G.G., et al. Optimizing the method to calculate right ventricular ejection fraction from first-pass data acquired with a multicrystal camera. J Nucl Cardiol. 1995;2:372-379.
57 Lembcke A., Dohmen P.M., Dewey M., et al. Multislice computed tomography for preoperative evaluation of right ventricular volumes and function: Comparison with magnetic resonance imaging. Ann Thorac Surg. 2005;79:1344-1351.
58 Koch K., Oellig F., Oberholzer K., et al. Assessment of right ventricular function by 16-detector-row CT: Comparison with magnetic resonance imaging. Eur Radiol. 2005;15:312-318.
59 Gibbons R.J., Balady G.J., Bricker J.T., et al. ACC/AHA 2002 guideline update for exercise testing: summary article: A report of the American College of Cardiology/American Heart Association Task Force on Practice Guidelines (Committee to Update the 1997 Exercise Testing Guidelines). Circulation. 2002;106:1883-1892.
60 Iskandrian A.E., Bateman T.M., Belardinelli L., et al. Adenosine versus regadenoson comparative evaluation in myocardial perfusion imaging: Results of the ADVANCE phase 3 multicenter international trial. J Nucl Cardiol. 2007;14:645-658.
61 Vesely M.R., Dilsizian V. Nuclear cardiac stress testing in the era of molecular medicine. J Nucl Med. 2008;49:399-413.
62 McFalls E.O., Ward H.B., Moritz T.E., et al. Coronary-artery revascularization before elective major vascular surgery. N Engl J Med. 2004;351:2795-2804.
63 Poldermans D., Schouten O., Vidakovic R., et al. A clinical randomized trial to evaluate the safety of a noninvasive approach in high-risk patients undergoing major vascular surgery: The DECREASE-V Pilot Study. J Am Coll Cardiol. 2007;49:1763-1769.
64 Poldermans D., Boersma E., Bax J.J., et al. The effect of bisoprolol on perioperative mortality and myocardial infarction in high-risk patients undergoing vascular surgery. Dutch Echocardiographic Cardiac Risk Evaluation Applying Stress Echocardiography Study Group. N Engl J Med. 1999;341:1789-1794.
65 Boersma E., Poldermans D., Bax J.J., et al. Predictors of cardiac events after major vascular surgery: Role of clinical characteristics, dobutamine echocardiography, and beta-blocker therapy. JAMA. 2001;285:1865-1873.
66 Klem I., Greulich S., Heitner J.F., et al. Value of cardiovascular magnetic resonance stress perfusion testing for the detection of coronary artery disease in women. JACC Cardiovasc Imaging. 2008;1:436-445.
67 Plein S., Radjenovic A., Ridgway J.P., et al. Coronary artery disease: Myocardial perfusion MR imaging with sensitivity encoding versus conventional angiography. Radiology. 2005;235:423-430.
68 Jahnke C., Nagel E., Gebker R., et al. Prognostic value of cardiac magnetic resonance stress tests: Adenosine stress perfusion and dobutamine stress wall motion imaging. Circulation. 2007;115:1769-1776.
69 Camici P.G., Prasad S.K., Rimoldi O.E. Stunning, hibernation, and assessment of myocardial viability. Circulation. 2008;117:103-114.
70 Wijns W., Vatner S.F., Camici P.G. Hibernating myocardium. N Engl J Med. 1998;339:173-181.
71 Schinkel A.F., Bax J.J., Poldermans D., et al. Hibernating myocardium: Diagnosis and patient outcomes. Curr Probl Cardiol. 2007;32:375-410.
72 Beanlands R.S., Hendry P.J., Masters R.G., et al. Delay in revascularization is associated with increased mortality rate in patients with severe left ventricular dysfunction and viable myocardium on fluorine 18-fluorodeoxyglucose positron emission tomography imaging. Circulation. 1998;98:II51-II56.
73 Tarakji K.G., Brunken R., McCarthy P.M., et al. Myocardial viability testing and the effect of early intervention in patients with advanced left ventricular systolic dysfunction. Circulation. 2006;113:230-237.
74 Mahrholdt H., Wagner A., Judd R.M., Sechtem U. Assessment of myocardial viability by cardiovascular magnetic resonance imaging. Eur Heart J. 2002;23:602-619.
75 Bondarenko O., Beek A.M., Nijveldt R., et al. Functional outcome after revascularization in patients with chronic ischemic heart disease: A quantitative late gadolinium enhancement CMR study evaluating transmural scar extent, wall thickness and periprocedural necrosis. J Cardiovasc Magn Reson. 2007;9:815-821.
76 Barber M.J., Mueller T.M., Henry D.P., et al. Transmural myocardial infarction in the dog produces sympathectomy in noninfarcted myocardium. Circulation. 1983;67:787-796.
77 Kramer C.M., Nicol P.D., Rogers W.J., et al. Reduced sympathetic innervation underlies adjacent noninfarcted region dysfunction during left ventricular remodeling. J Am Coll Cardiol. 1997;30:1079-1085.
78 Gutterman D.D., Morgan D.A., Miller F.J. Effect of brief myocardial ischemia on sympathetic coronary vasoconstriction. Circ Res. 1992;71:960-969.
79 Pettersen M.D., Abe T., Morgan D.A., Gutterman D.D. Role of adenosine in postischemic dysfunction of coronary innervation. Circ Res. 1995;76:95-101.
80 Matsunari I., Schricke U., Bengel F.M., et al. Extent of cardiac sympathetic neuronal damage is determined by the area of ischemia in patients with acute coronary syndromes. Circulation. 2000;101:2579-2585.
81 Bulow H.P., Stahl F., Lauer B., et al. Alterations of myocardial presynaptic sympathetic innervation in patients with multi-vessel coronary artery disease but without history of myocardial infarction. Nucl Med Commun. 2003;24:233-239.
82 Merlet P., Pouillart F., Dubois-Rande J.L., et al. Sympathetic nerve alterations assessed with 123I-MIBG in the failing human heart. J Nucl Med. 1999;40:224-231.
83 Stewart B.F., Siscovick D., Lind B.K., et al. Clinical factors associated with calcific aortic valve disease. Cardiovascular Health Study. J Am Coll Cardiol. 1997;29:630-634.
84 Katz R., Budoff M.J., Takasu J., et al. Relationship of metabolic syndrome with incident aortic valve calcium and aortic valve calcium progression: The Multi-Ethnic Study of Atherosclerosis (MESA). Diabetes. 2009;58:813-819.
85 Messika-Zeitoun D., Aubry M.C., Detaint D., et al. Evaluation and clinical implications of aortic valve calcification measured by electron-beam computed tomography. Circulation. 2004;110:356-362.
86 Pouleur A.C., le Polain, de Waroux J.B., Pasquet A., et al. Aortic valve area assessment: Multidetector CT compared with cine MR imaging and transthoracic and transesophageal echocardiography. Radiology. 2007;244:745-754.
87 Feuchtner G.M., Dichtl W., Friedrich G.J., et al. Multislice computed tomography for detection of patients with aortic valve stenosis and quantification of severity. J Am Coll Cardiol. 2006;47:1410-1417.
88 Alkadhi H., Wildermuth S., Plass A., et al. Aortic stenosis: Comparative evaluation of 16-detector row CT and echocardiography. Radiology. 2006;240:47-55.
89 Bouvier E., Logeart D., Sablayrolles J.L., et al. Diagnosis of aortic valvular stenosis by multislice cardiac computed tomography. Eur Heart J. 2006;27:3033-3038.
90 Piers L.H., Dikkers R., Tio R.A., et al. A comparison of echocardiographic and electron beam computed tomographic assessment of aortic valve area in patients with valvular aortic stenosis. Int J Cardiovasc Imaging. 2007;23:781-788.
91 Feuchtner G.M., Muller S., Bonatti J., et al. Sixty-four slice CT evaluation of aortic stenosis using planimetry of the aortic valve area. AJR Am J Roentgenol. 2007;189:197-203.
92 Alkadhi H., Desbiolles L., Husmann L., et al. Aortic regurgitation: Assessment with 64-section CT. Radiology. 2007;245:111-121.
93 Jassal DS, Shapiro MD, Neilan TG, et-al: 64-slice multidetector computed tomography (MDCT) for detection of aortic regurgitation and quantification of severity, Invest Radiol 42:507–512.
94 Caruthers S.D., Lin S.J., Brown P., et al. Practical value of cardiac magnetic resonance imaging for clinical quantification of aortic valve stenosis: Comparison with echocardiography. Circulation. 2003;108:2236-2243.
95 Kupfahl C., Honold M., Meinhardt G., et al. Evaluation of aortic stenosis by cardiovascular magnetic resonance imaging: Comparison with established routine clinical techniques. Heart. 2004;90:893-901.
96 Alkadhi H., Bettex D., Wildermuth S., et al. Dynamic cine imaging of the mitral valve with 16-MDCT: A feasibility study. AJR Am J Roentgenol. 2005;185:636-646.
97 Willmann J.K., Kobza R., Roos J.E., et al. ECG-gated multi-detector row CT for assessment of mitral valve disease: Initial experience. Eur Radiol. 2002;12:2662-2669.
98 Budoff M.J., Takasu J., Katz R., et al. Reproducibility of CT measurements of aortic valve calcification, mitral annulus calcification, and aortic wall calcification in the multi-ethnic study of atherosclerosis. Acad Radiol. 2006;13:166-172.
99 Nkomo V.T., Gardin J.M., Skelton T.N., et al. Burden of valvular heart diseases: A population-based study. Lancet. 2006;368:1005-1011.
100 Messika-Zeitoun D., Serfaty J.M., Laissy J.P., et al. Assessment of the mitral valve area in patients with mitral stenosis by multislice computed tomography. J Am Coll Cardiol. 2006;48:411-413.
101 Alkadhi H., Wildermuth S., Bettex D.A., et al. Mitral regurgitation: Quantification with 16-detector row CT—initial experience. Radiology. 2006;238:454-463.
102 Konen E., Goitein O., Feinberg M.S., et al. The role of ECG-gated MDCT in the evaluation of aortic and mitral mechanical valves: Initial experience. AJR Am J Roentgenol. 2008;191:26-31.
103 Bashore T.M., Cabell C., Fowler V.Jr. Update on infective endocarditis. Curr Probl Cardiol. 2006;31:274-352.
104 Gilkeson R.C., Markowitz A.H., Balgude A., Sachs P.B. MDCT evaluation of aortic valvular disease. AJR Am J Roentgenol. 2006;186:350-360.
105 Feuchtner G.M., Stolzmann P., Dichtl W., et al. Multislice computed tomography in infective endocarditis: Comparison with transesophageal echocardiography and intraoperative findings. J Am Coll Cardiol. 2009;53:436-444.
106 Budoff M.J., Dowe D., Jollis J.G., et al. Diagnostic performance of 64-multidetector row coronary computed tomographic angiography for evaluation of coronary artery stenosis in individuals without known coronary artery disease: Results from the prospective multicenter ACCURACY (Assessment by Coronary Computed Tomographic Angiography of Individuals Undergoing Invasive Coronary Angiography) trial. J Am Coll Cardiol. 2008;52:1724-1732.
107 Scheffel H., Leschka S., Plass A., et al. Accuracy of 64-slice computed tomography for the preoperative detection of coronary artery disease in patients with chronic aortic regurgitation. Am J Cardiol. 2007;100:701-706.
108 Gilard M., Cornily J.C., Pennec P.Y., et al. Accuracy of multislice computed tomography in the preoperative assessment of coronary disease in patients with aortic valve stenosis. J Am Coll Cardiol. 2006;47:2020-2024.
109 Meijboom W.B., Mollet N.R., Van Mieghem C.A., et al. Pre-operative computed tomography coronary angiography to detect significant coronary artery disease in patients referred for cardiac valve surgery. J Am Coll Cardiol. 2006;48:1658-1665.
110 Bonow R.O., Carabello B.A., Chatterjee K., et al. 2008 Focused update incorporated into the ACC/AHA 2006 guidelines for the management of patients with valvular heart disease: A report of the American College of Cardiology/American Heart Association Task Force on Practice Guidelines (Writing Committee to Revise the 1998 Guidelines for the Management of Patients with Valvular Heart Disease): Endorsed by the Society of Cardiovascular Anesthesiologists, Society for Cardiovascular Angiography and Interventions, and Society of Thoracic Surgeons. Circulation. 2008;118:e523-e661.
111 Inzitari D., Eliasziw M., Gates P., et al. The causes and risk of stroke in patients with asymptomatic internal-carotid-artery stenosis. North American Symptomatic Carotid Endarterectomy Trial Collaborators. N Engl J Med. 2000;342:1693-1700.
112 Nistri S., Sorbo M.D., Marin M., et al. Aortic root dilatation in young men with normally functioning bicuspid aortic valves. Heart. 1999;82:19-22.
113 Baumgartner D., Baumgartner C., Matyas G., et al. Diagnostic power of aortic elastic properties in young patients with Marfan syndrome. J Thorac Cardiovasc Surg. 2005;129:730-739.
114 Rousseau H., Verhoye J-P, Heautot J-F. Thoracic Aortic Diseases. Berlin: Springer, 2006.
115 McLaughlin K., Jardine A.G., Moss J.G. ABC of arterial and venous disease. Renal artery stenosis. BMJ. 2000;320:1124-1127.
116 Safian R.D., Textor S.C. Renal-artery stenosis. N Engl J Med. 2001;344:431-442.
117 Bakker J., Beek F.J., Beutler J.J., et al. Renal artery stenosis and accessory renal arteries: Accuracy of detection and visualization with gadolinium-enhanced breath-hold MR angiography. Radiology. 1998;207:497-504.
118 De Cobelli F., Vanzulli A., Sironi S., et al. Renal artery stenosis: Evaluation with breath-hold, three-dimensional, dynamic, gadolinium-enhanced versus three-dimensional, phase-contrast MR angiography. Radiology. 1997;205:689-695.
119 Fain S.B., King B.F., Breen J.F., et al. High-spatial-resolution contrast-enhanced MR angiography of the renal arteries: A prospective comparison with digital subtraction angiography. Radiology. 2001;218:481-490.
120 Hany T.F., Debatin J.F., Leung D.A., Pfammatter T. Evaluation of the aortoiliac and renal arteries: Comparison of breath-hold, contrast-enhanced, three-dimensional MR angiography with conventional catheter angiography. Radiology. 1997;204:357-362.
121 Rieumont M.J., Kaufman J.A., Geller S.C., et al. Evaluation of renal artery stenosis with dynamic gadolinium-enhanced MR angiography. AJR Am J Roentgenol. 1997;169:39-44.
122 Tello R., Thomson K.R., Witte D., et al. Standard dose Gd-DTPA dynamic MR of renal arteries. J Magn Reson Imaging. 1998;8:421-426.
123 Thornton J., O’Callaghan J., Walshe J., et al. Comparison of digital subtraction angiography with gadolinium-enhanced magnetic resonance angiography in the diagnosis of renal artery stenosis. Eur Radiol. 1999;9:930-934.
124 Volk M., Strotzer M., Lenhart M., et al. Time-resolved contrast-enhanced MR angiography of renal artery stenosis: Diagnostic accuracy and interobserver variability. AJR Am J Roentgenol. 2000;174:1583-1588.
125 Price J.F., Mowbray P.I., Lee A.J., et al. Relationship between smoking and cardiovascular risk factors in the development of peripheral arterial disease and coronary artery disease: Edinburgh Artery Study. Eur Heart J. 1999;20:344-353.
126 Meijer W.T., Hoes A.W., Rutgers D., et al. Peripheral arterial disease in the elderly: The Rotterdam Study. Arterioscler Thromb Vasc Biol. 1998;18:185-192.
127 Smith G.D., Shipley M.J., Rose G. Intermittent claudication, heart disease risk factors, and mortality. The Whitehall Study. Circulation. 1990;82:1925-1931.
128 Hirsch A.T., Criqui M.H., Treat-Jacobson D., et al. Peripheral arterial disease detection, awareness, and treatment in primary care. JAMA. 2001;286:1317-1324.
129 Criqui M.H., Fronek A., Barrett-Connor E., et al. The prevalence of peripheral arterial disease in a defined population. Circulation. 1985;71:510-515.
130 Hiatt W.R., Marshall J.A., Baxter J., et al. Diagnostic methods for peripheral arterial disease in the San Luis Valley Diabetes Study. J Clin Epidemiol. 1990;43:597-606.
131 Fowkes F.G., Housley E., Macintyre C.C., et al. Reproducibility of reactive hyperaemia test in the measurement of peripheral arterial disease. Br J Surg. 1988;75:743-746.
132 Lawrence J.A., Kim D., Kent K.C., et al. Lower extremity spiral CT angiography versus catheter angiography. Radiology. 1995;194:903-908.
133 Rieker O., Duber C., Schmiedt W., et al. Prospective comparison of CT angiography of the legs with intraarterial digital subtraction angiography. AJR Am J Roentgenol. 1996;166:269-276.
134 Nelemans P.J., Leiner T., de Vet H.C., van Engelshoven J.M. Peripheral arterial disease: Meta-analysis of the diagnostic performance of MR angiography. Radiology. 2000;217:105-114.
135 Ouwendijk R., de Vries M., Pattynama P.M., et al. Imaging peripheral arterial disease: A randomized controlled trial comparing contrast-enhanced MR angiography and multi-detector row CT angiography. Radiology. 2005;236:1094-1103.
136 Ouwendijk R., Kock M.C., Visser K., et al. Interobserver agreement for the interpretation of contrast-enhanced 3D MR angiography and MDCT angiography in peripheral arterial disease. AJR Am J Roentgenol. 2005;185:1261-1267.
137 Plumhans C., Muhlenbruch G., Rapaee A., et al. Assessment of global right ventricular function on 64-MDCT compared with MRI. AJR Am J Roentgenol. 2008;190:1358-1361.
138 Wartski M., Collignon M.A. Incomplete recovery of lung perfusion after 3 months in patients with acute pulmonary embolism treated with antithrombotic agents. THESEE Study Group. Tinzaparin ou Heparin Standard: Evaluation dans l’Embolie Pulmonaire Study. J Nucl Med. 2000;41:1043-1048.
139 Stein P.D., Fowler S.E., Goodman L.R., et al. Multidetector computed tomography for acute pulmonary embolism. N Engl J Med. 2006;354:2317-2327.
140 Bergan J.J., Schmid-Schonbein G.W., Smith P.D., et al. Chronic venous disease. N Engl J Med. 2006;355:488-498.
141 Hendel R.C., Patel M.R., Kramer C.M., et al. ACCF/ACR/SCCT/SCMR/ASNC/NASCI/SCAI/SIR 2006 appropriateness criteria for cardiac computed tomography and cardiac magnetic resonance imaging: A report of the American College of Cardiology Foundation Quality Strategic Directions Committee Appropriateness Criteria Working Group, American College of Radiology, Society of Cardiovascular Computed Tomography, Society for Cardiovascular Magnetic Resonance, American Society of Nuclear Cardiology, North American Society for Cardiac Imaging, Society for Cardiovascular Angiography and Interventions, and Society of Interventional Radiology. J Am Coll Cardiol. 2006;48:1475-1497.
142 Min J., Shaw L., Berman D. The present state of coronary computed tomography angiography. J Am Coll Cardiol. 2010;55:957-965.
143 Mark D., Kong D. Cardiac computed tomographic angiography: What is the prognosis? J Am Coll Cardiol. 2010;55:1029-1031.
144 Kato S., Kitagawa K., Ishida N., et al. Assessment of coronary artery disease using magnetic resonance coronary angiography. J Am Coll Cardiol. 2010;56:983-991.