8 Cardiovascular Disorders
 Be sure to check out the supplementary content available at
 Etiologies of chd: noninherited and genetic factors
Congenital heart disease (CHD) encompasses many structural defects or disorders of the heart that are present at birth; they may be diagnosed in utero, at birth, or later in life. Although the general population risk for any birth defect is 4%,567 the risk of a congenital heart defect is 0.4% to 1%,264 making the heart the most common organ to be affected by a birth anomaly. Approximately 25% of the children with congenital heart disease, as well as 70% of spontaneous abortions and stillborn fetuses with CHD also have at least one extracardiac anomaly.506
In the past quarter century, two population studies, the New England Regional Infant Cardiac Program290 and the Baltimore-Washington Infant Study,263,264 increased understanding of the incidence and etiology of CHD. Recent years have brought the human genome project, advances in molecular biology, and expanded capabilities for chromosomal analysis. Small chromosome deletions and duplications can be identified through fluorescence in situ hybridization (FISH) and, more recently, array comparative genomic hybridization (A-CGH), which opens the door to identification of a greater number of genetic diagnoses. All of these factors combined with the epidemiologic results of the population studies mentioned above are contributing to the identification of genes that cause syndromes as well as isolated congenital heart defects, classification of the pathologic processes of embryology that are triggered by genetic abnormalities, and correlation between genotypes and various phenotypes (the characteristic features).265,657,699 These methods are enabling identification of chromosome anomalies and gene abnormalities that are a result of new or inherited mutations. These and other new developments are leading to better genetic testing, improved diagnostic and prognostic capabilities, future research opportunities, and enhanced care planning and counseling.932
Whether the triggering event is a teratogen, a genetic abnormality, or unknown, the pathogenesis of congenital heart defects follow six mechanisms as proposed by Clark181,182,506,747:
I. Ectomesenchymal tissue migration or neural crest abnormalities, resulting in conotruncal (ventricular outflow) and aortic arch anomalies;
II. Abnormalities of intracardiac blood flow, resulting in hypoplasia of structures through which flow was diminished or absent;
III. Cell death abnormalities, resulting in Ebstein malformation and muscular ventricular septal defects;
IV. Extracellular matrix abnormalities, resulting in anomalous formation of the endocardial cushions (atrioventricular septal and canal defects);
V. Abnormal targeted growth, resulting in anomalies of pulmonary venous and left atrium formation; and
VI. Abnormal situs and looping, resulting in malposition of organs, structures, and vascular connections.
Exploration of anomalies in terms of a common pathogenetic mechanism allows researchers to learn more about familial patterns. As more information about the interaction of genes, environment, and proteins involved in developmental pathways is available, our understanding of the biologic basis of normal and abnormal cardiovascular embryologic development (morphogenesis) will be refined.506 Further information on cardiovascular morphogenesis is provided in the section, Fetal Development of the Heart and Great Vessels.
Although most congenital heart disease was previously believed to be of multifactorial etiology (a combination of a number of genetic factors from both parents, environmental influences, and random events), new information has led to the belief that most human CHDs result from single gene defects506 and some from exposure to teratogens. Nevertheless, at this point, for most patients with CHD there is not a precise identifiable cause.506 Congenital heart defects are thought to be related to teratogens in 2% to 4%, genetics in 10% (although this is probably underestimated), and unknown in 85% to 90%.190,277 As discoveries continue, the percentage with unknown cause should decrease.
Noninherited Risk Factors for CHD (Many Potentially Modifiable)
Maternal Disorders or Biologic Teratogens
Maternal disorders or biologic teratogens associated with increased incidence of CHD include phenylketonuria (PKU), diabetes, infections, obesity, systemic lupus erythematosus, and epilepsy.277 When a mother has untreated PKU during pregnancy, the fetus may have growth and mental retardation and has a 20% to 25% incidence of CHD. Maternal control of blood phenylalanine concentration and adequate maternal nutrition before and throughout the pregnancy must occur to reduce the risk. All babies conceived when the mother was receiving inadequate nutrition should have an echocardiogram.558 The most frequently associated defects are tetralogy of Fallot, ventricular septal defect (VSDs), patent ductus arteriosus (PDA), and single ventricle.414
Maternal pregestational insulin dependent diabetes increases fetal risk of CHD. The most common defects are malformations with laterality or embryologic heart tube looping defects, transposition of the great arteries, conotruncal defects (e.g., tetralogy of Fallot, interrupted aortic arch, truncus arteriosus), VSDs, atrioventricular septal (AV canal) defects, hypoplastic left heart syndrome, outflow tract defects, PDA, and hypertrophic cardiomyopathy (which may resolve).414 Less frequently, gestational diabetes also has been associated with CHDs, and these cases may represent women who have undetected type 2 diabetes. Adequate blood sugar control before and during pregnancy does reduce the risk.414,795
Maternal infections have long been associated with CHD. Maternal rubella has been associated with PDA, pulmonary valve abnormalities, peripheral pulmonary stenosis, and VSDs. Immunization of women against rubella can eliminate this risk. More recently other maternal febrile illnesses (such as influenza) in the first trimester have been associated with a variety of heart defects, but it is unknown whether the fever, infectious agent, or medication to treat the fever and infection cause the effect.190,414 Although HIV infection in utero increases the risk of dilated cardiomyopathy and left ventricular hypertrophy, it has not been associated with structural cardiac defects.414
Maternal obesity before pregnancy has been associated with CHD, but findings are inconsistent. The many complex variables with obesity and nutrition make this a difficult area for drawing conclusions.414 Connective tissue disorders such as systemic lupus erythematosus in women are associated with congenital heart block in infant offspring. Maternal connective tissue disorders have not been associated with structural cardiac malformations.414
Maternal epilepsy is associated with increased incidence of CHD. The therapy of anticonvulsant drugs and their potential impact on folate metabolism—rather than the seizures themselves—may increase the risk.414
Maternal Drug Exposure (Chemical Teratogens)
Of note, use of maternal multivitamins and folic acid in the periconceptual period may reduce the risk of CHDs, but the evidence is not yet conclusive. These supplements may reduce the risk of CHD when used with some other agents that are associated with an increased risk of CHD, for example maternal febrile illness. Further studies are needed.414
Exposure to chemical agents can alter cellular development, and the timing of such exposure can influence the effect on risk. Identification of timing related to fetal vulnerability could help ensure counseling about treatment options to avoid critical exposures for a susceptible embryo.190,277,414 Many therapeutic drugs used preconceptually or during pregnancy have been linked with possible associated risk of congenital heart disease. (The interested reader can find a list on the Evolve Website. Please see Evolve Box 8-1 in the Chapter 8 Supplement on the Evolve Website.) Because much of the evidence is inconclusive and there are always reports from new studies, research and caution is urged before use of any therapeutic drugs during the periconceptual period and pregnancy.
Nontherapeutic drugs used preconceptually and/or during pregnancy that have been associated with increased risk of CHD include: alcohol, cocaine, marijuana, cigarette smoking, and vitamin A in high doses. Again, the evidence is often inconclusive, so actual risks can be difficult to determine. Many other agents have been studied but the data are insufficient to determine risks for cardiac defects.414,754
Environmental Exposures (Chemical, Biologic, and Physical Teratogens) and Influences
Increased risk of a variety of CHDs has been associated with maternal occupational exposure to organic solvents (compositions of solvents can include degreasers, dyes, lacquers, paints, glycol ethers, and mineral oil products); heavy metals; herbicides, pesticides, and rodenticides associated with maternal employment in the agriculture industry; air quality (increased levels of ambient carbon monoxide, ozone, and dioxide); and parental exposure to groundwater contamination with trichloroethylene. There are other environmental exposures, such as hazardous waste sites and occupational exposure to ionized radiation, but no consistent association with CHD has been found.414,866
Evaluation of maternal sociodemographic characteristics has shown that maternal age is not associated with nongenetic CHDs as a group. Some specific defects are more likely with advanced maternal age, and young maternal age is associated with tricuspid atresia.414 Some studies have shown disparity of incidence between white and black infants, with many defects being more prevalent in white infants, whereas pulmonary stenosis is more prevalent in black infants. Other studies have not shown variations in prevalence of birth defects in general among white, black, and Hispanic infants.414 Reproductive problems (miscarriage, stillbirth, or preterm birth) have been associated with increased incidence of tetralogy of Fallot, nonchromosomal atrioventricular canal defects, ASDs, and Ebstein’s anomaly, where the association could represent exposure to teratogens or an inherent susceptibility.414 Maternal stress associated with job loss, divorce, separation, or death of a close relative or friend, especially in mothers who were not high school graduates, was found to be associated with a greater prevalence of conotruncal heart defects.414
Paternal exposures and factors may also play a role in noninherited cardiac defects. Older fathers have been associated with Marfan syndrome. Studies have suggested that increasing paternal age is associated with ASDs, VSDs, PDA, and tetralogy of Fallot, whereas children of men less than 20 years of age were also at higher risk for septal defects.414 Other paternal exposures have been investigated in a limited number of studies, with the suggestion or trend toward increased risk of CHD associated with paternal exposure to marijuana, cocaine, cigarette smoking, and alcohol.414
A unique environmental influence may be present for some monochorionic twins. The smaller twin is more often affected with CHD, which may result from abnormal cord insertion.373
Prevention of some CHDs may be accomplished by following these recommendations for mothers who wish to become pregnant: Take a multivitamin with folic acid daily, obtain prenatal and preconceptual care for management of maternal disorders associated with increased risk of CHD, discuss use of any drugs with the healthcare provider, avoid contact with people who have the flu or other febrile illnesses, avoid exposure to organic solvents,414 and follow any employer guidelines established to avoid exposures that may increase risks.
Genetic Factors Associated with CHD
New findings with molecular genetic studies indicate that the genetic contribution to the etiology of CHD has been underestimated. With the rapid changes in this field it is certain that our understanding will be evolving and the identifiable genetic etiologies of CHD will continue to expand.700 Review of current literature will always be necessary to have an accurate understanding of these factors.
Humans normally have 46 chromosomes (23 pairs). The first 22 pairs are autosomal (non-sex) chromosomes and the 23rd pair determines gender (XX = female, XY = male). Each chromosome has two arms held together by a centromere—a short arm (p) and a long arm (q). There are more than 35,000 pairs of genes on our chromosomes,190 and each gene is composed of hundreds or thousands of base pairs. An abnormality in a single base pair can cause a malfunction. Changes in the deoxyribonucleic acid (DNA) sequence (a mutation) in a single gene changes the path of a protein, which is like changing one part of a recipe. (The results can range from asymptomatic to disastrous malformations.) Mutations may occur de novo (a new mutation that is not inherited from a parent) or may result from autosomal-dominant or -negative inheritance. Many gene mutations associated with cardiovascular malformations are now being identified.190,277,700
Before advanced cytogenetic tests were available, chromosome abnormalities were found in approximately 8% to 13% of neonates with CHD,263 but with new testing the prevalence of chromosome aberrations is now estimated to be much higher.700 These abnormalities can be aneuploidies (abnormal number of chromosomes) such as trisomies (an extra chromosome), or tetrasomies. Other chromosome abnormalities are caused by deletions (a missing piece), duplications (extra genetic material on chromosome), or translocations (genetic material transferred from one chromosome to another).190,277 Single gene defects have been thought to account for about 3% to 5% of those CHDs with a genetic etiology, but new findings indicate that this range substantially underestimated the problem. Any genetic defect can start an embryonic chain reaction, which can create mild to severe phenotypic expression of the abnormality.803
Cardiovascular malformations can occur as a part of a group or pattern of anomalies. A syndrome, a combination of multiple anomalies occurring together resulting from a single cause (the cause is often a genetic error but the cause may be unknown), is thought to cause about 5% of the CHD. More than 400 genetic syndromes list CHD as a possible manifestation.651,803 Associations, a group of anomalies that occur in a recurrent pattern, may also involve CHDs. There may be no known genetic basis for an association. Inherited metabolic diseases have a variety of genetic etiologies and may include cardiovascular problems.
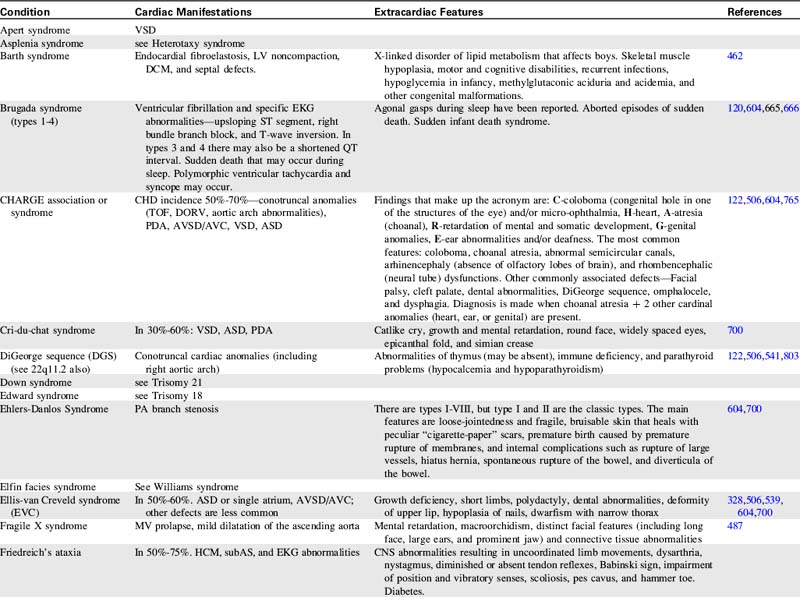
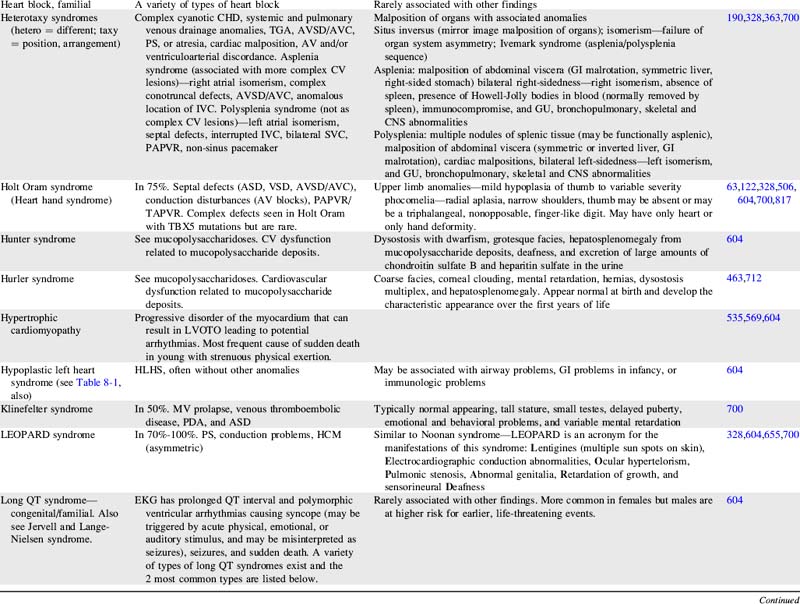
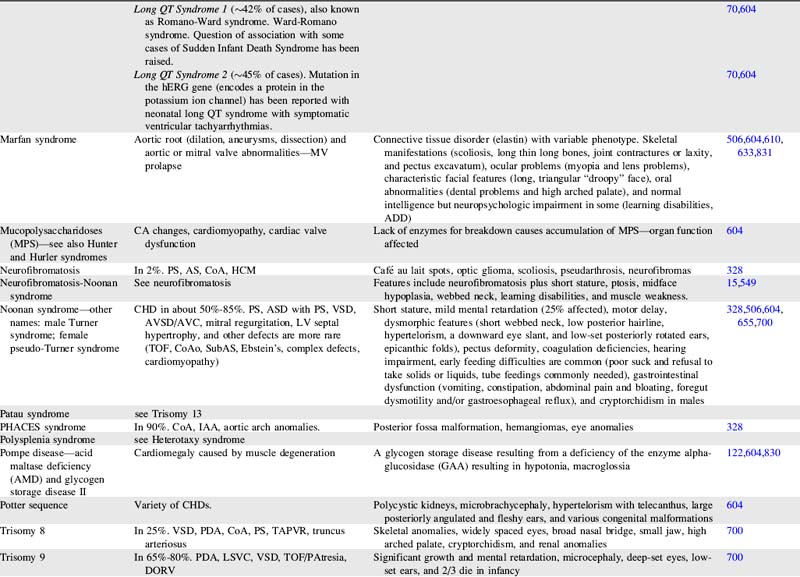
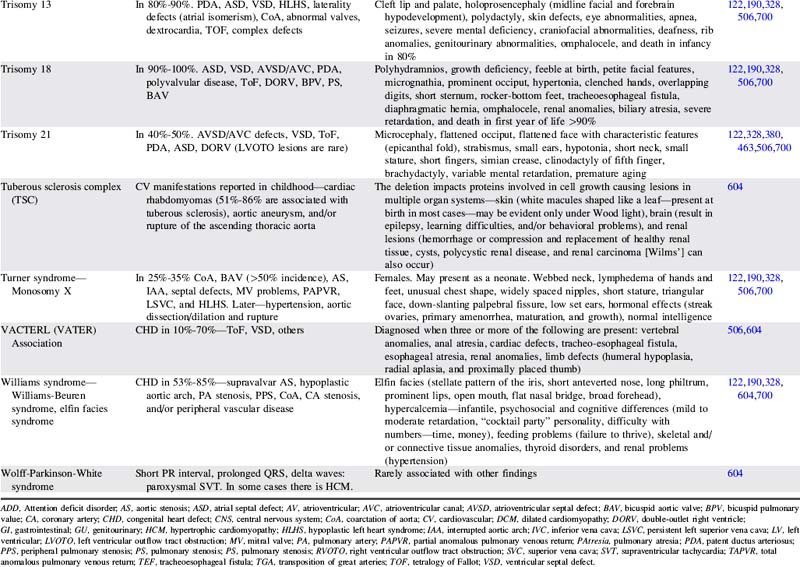
For more information on characteristics and etiologies of specific defects and conditions see Tables 8-1 and 8-2. There are hundreds of syndromes and conditions with multiple manifestations that involve cardiovascular malformations. Table 8-2 includes an abbreviated table, and a more comprehensive table with genetic associations is provided in Evolve Table 8-1 in the Chapter 8 Supplement on the Evolve Website.
Table 8-1 Cardiac Defects and Associated Genetics, Teratogens, and Exposures328,414,700,871,932
| Cardiac Defect | Associated Genetics, Teratogens, and Exposures |
| Any congenital heart defect | Maternal PKU, pregestational diabetes, febrile illness, influenza, rubella, epilepsy, anticonvulsants, NSAIDS/Ibuprofen, sulfasalazine (antiinflammatory), thalidomide, trimethoprim-sulfonamide, and vitamin A congeners/retinoids. Many illnesses, medical and substance exposures, as well as sociodemographic factors have been studied, but there have been insufficient data to determine risks for CHD with these. Somatic mutations (occur after fertilization and therefore only affect some cells or tissues) are hypothesized to be an important cause of isolated CHDs. |
| Aortic atresia | See HLHS |
| Coarctation of the aorta | Turner syndrome. Familial left-sided obstructive heart defects. Deletion of chromosome locus 18p. Duplications in chromosome 4p, 4q, 6q, or 10p. Trisomy 8 or 9. Maternal exposure to organic solvents. |
| Supravalvular aortic stenosis | Williams-Beuren syndrome. Deletion or translocation (rare) in chromosome locus 7q11. Elastin gene mutations. |
| Aortic valve or LV outflow tract obstruction | Deletion of chromosome locus 11q or 10q. Trisomy 13 or 18. Duplications of chromosome locus 1q, 2p, 2q, 6q, or 11q. NOTCH 1 gene mutations. Noonan, Turner, or Jacobsen syndromes. Pregestational diabetes. Maternal vitamin A exposure. |
| Atrial septal abnormalities | Holt Oram, Ellis-van Creveld, Noonan, Rubinstein-Taybi, Kabuki, Williams, Goldenhar, thrombocytopenia-absent radius, Klinefelter, or (rare) Marfan syndrome. Mutations of TBX5 gene on chromosome 12q24.1, NKX2.5 gene on chromosome 5, EVC gene on chromosome 4p16.1, MYH6 gene, or GATA 4 gene. Deletions on chromosome 1, 4, 4p, 5p, 6, 10p, 11,13,17,18, or 22. Trisomy 18 or 21. Pregestational diabetes. Familial ASDs with AV conduction disturbances without extracardiac manifestations (may also have VSD, TOF, and others) has been associated with mutations of NKX2.5 on chromosome 5. Familial ASD without AV conduction disturbances without extracardiac manifestations (may also have VSD and/or PS) has been associated with mutations of GATA 4 gene with variable expression and autosomal dominant inheritance. This condition has also been associated with mutations of NKX2.5 on chromosome 5. |
| Atrioventricular septal abnormalities/atrioventricular canal/endocardial cushion defects | Trisomy 21, 13 or 18. Deletions of chromosome 3p25, 8p2, or 22q. Duplications of chromosome 10q, 11q, 22q. Holt-Oram, Noonan, Smith-Lemli-Opitz, or Ellis-van Creveld syndrome. Mutation of gene on chromosome 1p21-p31. CRELD1 gene mutations. Chondrodysplasias. Pregestational diabetes. Maternal exposure to organic solvents. Familial AVSD (partial or complete) without extracardiac manifestations has been associated with gene locus on 1p21-p31 mutation with autosomal dominant inheritance. |
| Bicuspid aortic valve | Turner syndrome. Familial left-sided obstructive heart defects. Deletion of chromosome locus 10p. Duplications in chromosome 6q. Trisomy 13 or 18. BAV without extracardiac manifestations may be associated with other CHDs (especially CoA) and ascending aortic aneurysm is associated with Notch1 gene mutations with autosomal dominant inheritance. |
| Conotruncal defects (tetralogy of Fallot, truncus arteriosus, interrupted aortic arch and others) | Deletion of chromosome 22q11.2. Mutations of NKX2.5 and 2.6. Pregestational diabetes. Maternal exposure to organic solvents. |
| Double-outlet right ventricle | Trisomy 9, 13, or 18. Duplications on chromosome 2p or 12p. Deletion of 22q11 (rare). |
| Ebstein anomaly | Most cases are sporadic. Chromosome abnormalities are rare. Has been reported with Trisomy 21, abnormalities of 11q with renal malformation, and Pierre Robin sequence. Familial occurrences are rare but are associated with family members with mitral valve abnormalities or with familial atrial conduction problems. Animal studies are suggestive of a genetic connection with genes on chromosome 17q. Maternal marijuana. Maternal exposure to organic solvents. |
| Heterotaxy syndromes with complex CHD—laterality and looping abnormalities | Chromosome locus 2 (CFC1 gene encoding CRYPTIC protein), 6q (HTX3 gene), LEFTY A gene, or X-linked q26.2 or Xq24-47 (ZIC3 gene). Pregestational diabetes. |
| Hypoplastic left heart syndrome | Deletion of chromosome locus 11q (Jacobsen syndrome). Turner or Wolf-Hirschhorn (deletion of 4p) syndromes. Trisomy 13 or 18. Familial left-sided obstructive heart defects. Pregestational diabetes. Maternal exposure to organic solvents. |
| Interrupted aortic arch | Deletion 22q11. |
| Left-sided obstructive heart disease—familial—CoA, aortic atresia/HLHS, BAV | Increased occurrence of these lesions in first-degree relatives. Inheritance patterns may be multifactorial, autosomal dominant with reduced penetrance, or autosomal recessive. |
| Left superior vena cava persistence | 60% have other anomalies, 87% have other CHD, and 42% syndromes or other conditions (VACTERL, Down’s syndrome, CHARGE). |
| Patent ductus arteriosus | Char syndrome. Mutations of TFAP2B. Pregestational diabetes. Indomethacin tocolysis. |
| PA branch stenosis | Alagille, congenital rubella, Ehlers-Danlos, Noonan, Costello, Cardiofaciocutaneous, LEOPARD, or Williams-Beuren syndromes. Deletions in chromosome locus 20p12. JAG1 gene mutation. Pregestational diabetes. Maternal vitamin A exposure. Maternal exposure to organic solvents. |
| Pulmonary Valve Obstruction | Noonan, Alagille, Costello, or LEOPARD syndromes. Mutations of PTPN11, KRAS, SOS1, and HRAS genes. Chromosome deletions of 1p, 8p, 10p, or 22q. Chromosome duplications of 6q, 15q, or 19q. Trisomy 8. Maternal vitamin A exposure. Maternal exposure to organic solvents. Maternal rubella. |
| Tetralogy of Fallot | Deletion of 22q11, 5p or many other chromosomes. Duplication on chromosome 22 and many other chromosomes. Alagille (JAG1 gene), Noonan (PTNP11), Cat-eye, and nearly 50 other syndromes. Trisomy 18 or 21. Partial trisomy 8q. Translocation 1p36. Maternal exposure to organic solvents. Isolated TOF is associated with NKX2.5 mutations. |
| Total anomalous pulmonary venous return | Most cases are sporadic. Trisomy 8. Familial cases have been reported with familial scimitar syndrome and a chromosome 4p13-q12 abnormality with autosomal dominant inheritance and variable expression (a large Utah-Idaho family). Maternal exposure to organic solvents. |
| Transposition of great arteries | Rarely associated with chromosome abnormalities or syndromes. Pregestational diabetes. Maternal exposure to organic solvents. |
| Tricuspid atresia | Most cases are sporadic. Chromosome abnormalities are rare with tricuspid atresia, but deletions of 22q11 and 4p and duplications of chromosome 22 have been reported. Familial occurrences are rare but have been reported. A gene mutation has been associated in mice, which suggests a genetic basis for this disease. |
| Truncus arteriosus | Deletion on chromosome 22q11 or 10p. Trisomy 8. An autosomal recessive form has been mapped to chromosome 8p21. |
| Ventricular septal abnormalities | Holt Oram, Rubinstein-Taybi, Goldenhar, Costello, Williams, Kabuki, Cornelia de Lange, Apert, or Carpenter syndrome. VACTERL association. Familial ASD with or without AV conduction disturbances. TBX5 or GATA 4 mutation. Deletions or duplications of many chromosomes. Trisomy 13, 18, or 21. Pregestational diabetes. Maternal marijuana. Maternal exposure to organic solvents. Septal defects without extracardiac manifestations are associated with mutations in MYH6 and CITED2 genes. |
ADD, Attention deficit disorder; AS, aortic stenosis; ASD, atrial septal defect; AV, atrioventricular; AVC, atrioventricular canal; AVSD, atrioventricular septal defect; BAV, bicuspid aortic valve; CA, coronary artery; CHD, congenital heart defect; CNS, central nervous system; CoA, coarctation of aorta; CV, cardiovascular; DCM, dilated cardiomyopathy; DORV, double-outlet right ventricle; GI, gastrointestinal; GU, genitourinary; HCM, hypertrophic cardiomyopathy; HLHS, hypoplastic left heart syndrome; IAA, interrupted aortic arch; IVC, inferior vena cava; LSVC, persistent left superior vena cava; LV, left ventricular; LVOTO, left ventricular outflow tract obstruction; MV, mitral valve; NSAIDs, nonsteroidal antiinflammatory drugs; PA, pulmonary artery; PAPVR, partial anomalous pulmonary venous return; PAtresia, pulmonary atresia; PDA, patent ductus arteriosus; PKU, phenylketonuria; PPS, peripheral pulmonary stenosis; PS, pulmonary stenosis; RVOTO, right ventricular outflow tract obstruction; SVC, superior vena cava; SVT, supraventricular tachycardia; TAPVR, total anomalous pulmonary venous return; TEF, tracheoesophageal fistula; TGA, transposition of great arteries; TOF, tetralogy of Fallot; VSD, ventricular septal defect.
See Table 8-2 for more information on specific genes, syndromes, and conditions.
Genetic Testing, Counseling, and Nursing Implications
Genetic testing can reveal important genetic patterns that are critical for identifying other important organ system involvement; gaining prognostic information; learning important reproductive risks for the family; and considering the appropriate testing of other family members.700 Genetic testing can be performed on blood lymphocytes, cord blood, skin, amniotic fluid, chorionic villi, and bone marrow. Current genetic tests available to be used in assessing CHD include:
• Standard chromosome analysis—reveals standard karyotype and is used to identify many chromosomal disorders, especially those in which there is an abnormal number of chromosomes.700
• High resolution banding—better defines chromosomal structure abnormalities such as duplications, deletions, and translocations of genetic material.700
• Fluorescence in situ hybridization (FISH)—specific DNA probes can be used to diagnose more subtle structural abnormalities such as microdeletions, tiny duplications, and/or subtle translocations.700
• Array comparative genomic hybridization (A-CGH)—even more sensitive than FISH for testing for tiny structural abnormalities of chromosomes.868
• Gene discovery—cloning techniques are used to identify genes that produce a protein associated with cardiogenic gene mutations.700
• DNA mutation analysis—identifies changes in the coding sequence of a gene to find small deletions, duplications, or substitutions that alter the resulting protein structure. Once a change is found, it must be determined if it constitutes a disease-causing mutation.700
As more etiologic genes are identified, progress can be made in determining mechanisms and interactions that cause various phenotypes. That may lead to the development of targeted therapies for patients and fetuses.871
Genetic counseling is warranted when there is one major or two minor birth defects and may be employed to attempt to determine exact causes of anomalies in individual situations. Testing must be accurately ordered to direct the proper studies to obtain complete results. Simply ordering a karyotype will not achieve the targeted exploration that can be achieved with FISH or A-CGH studies. Information gathered enables practitioners to counsel the family on problems associated with a condition, allowing them to be proactive in their child’s care. Discussions with the family should be informative but not directive so that parents may make their own decisions.190,651
Recurrence risks for chromosomal trisomies are low if there are no other birth defects in the family and maternal age is not advanced. For a parent with an autosomal dominant genetic anomaly, there is a 50% risk of recurrence. In parents who have an autosomal negative genetic anomaly (without the evidence of the problem), both parents must have the anomaly to cause the resulting disorder. In these cases the recurrence risk for the couple is 25%. In X-linked recessive anomalies, the risk is 50% for a male to be affected and 50% for a female to be a carrier. In cases of unknown etiology (possibly multifactorial inheritance), if no other child in the family is affected the recurrence risk is presumed to be 3% to 5%, but this changes if a subsequent sibling is affected.190,651
Information about genetic conditions is widely available via websites and targeted support groups and associations (e.g., Online Mendelian Inheritance in Man, www.ncbi.nlm.nih.gov/Omim/). Web-based databases and support groups that provide valuable information are provided in the Chapter 8 Supplement on the Evolve Website.
The nursing implications of genetics involvement in congenital heart defects are significant. Nurses who are familiar with the patterns of anomalies can have a heightened index of suspicion when a single malformation is noted and findings can be unmasked. Nursing knowledge can be enhanced by familiarity with the most current scientific statements from the American Heart Association Congenital Heart Defects Committee, Council on Cardiovascular Disease in the Young on both the genetic basis and the noninherited risk factors for congenital heart disease.414,700
This quote from Joey’s Journey: Our Life with Lissencephaly, at http://lfurlotte.tripod.com expresses how parents may feel when they begin a journey with a child affected by anomalies and the support others can provide: “Life will never be the same again. However, with a little different perspective, life does go on and happiness does return.”415
Fetal development of the heart and great vessels
Formation of the Heart Tube: Day 22
The cardiovascular system is the first system to function in the embryo. The critical period of cardiovascular growth begins at 15 to 18 days of gestation and is initiated by a period of rapid cell proliferation. During this period, the developing heart is most susceptible to teratogens (factors that can be harmful). Early development of the cardiovascular system is necessary because of the increasing need for nutritional and oxygen requirements by the rapidly growing embryo and for elimination of carbon dioxide and waste products. Moore et al.,627 Ransom and Srivastava,723 and Sander et al.,764 describe heart development as involving five primary steps:
1. Migration of precardiac cells from the primitive streak and assembly of paired cardiac crescents at the myocardial plate
2. Coalescence of the cardiac crescents to form the primitive heart tube, an event that establishes the definitive heart
3. Cardiac looping, a complex process that assures proper alignment of the future cardiac chambers
4. Septation and heart chamber formation
5. Development of the cardiac conduction system and coronary vasculature
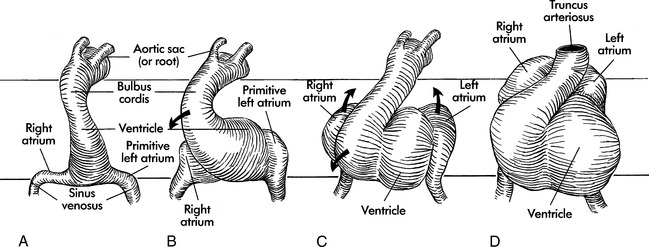
The primordial heart and vascular system appear in the middle of the third week. The cardiovascular system is primarily derived from embryonic mesoderm and neural crest cells. The precardiac stem cells (mesoderm) migrate to form the cardiac crescents that fuse to form the single heart tube at 22 days (Fig. 8-1).627,723,764,902
At this time (22 days), circulation begins with ebb-and-flow blood flow from the venous to arterial poles. Premyocardial cells and neural crest cells continue to migrate into the region of the heart tube. The regulation of the mesoderm is partially controlled by retinoids, isoforms of vitamin A, that bind to specific nuclear receptors and regulate gene transcription and by extracellular matrix proteins, such as fibronectin, that direct cellular migration. The teratogenic effects caused by interaction of retinoid-like drugs on cell receptors are seen clinically (see Noninherited Risk Factors).79
Formation of the Heart Loop: Day 22 to 28
Before and during the looping process, sections of the single heart tube begin to develop specialized cells that will ultimately become the chambers of the mature heart. A cascade of genes is expressed in the anterior (ventricular) and the posterior (atrial) portions of the tube. These genes regulate the cellular processes that transform the heart tube into a four-chambered heart. This transformation occurs through a balance of cell growth, cell differentiation, and cell death (apoptosis). Disruptions in these genetic mechanisms and specific cellular signaling processes result in cardiac malformations seen in congenital heart disease. Problems include defects in cardiac looping, septation, and chamber formation.764
The endocardial heart tube begins to expand and elongate and develops areas of dilation: the bulbus cordis (including the truncus arteriosus, conus arteriosus, and conus cordis), ventricle, atrium, and sinus venosus. This expansion and elongation results in coiling of the heart tube anteriorly and to the right (this is referred to as “dextral,” or “D-looping”), with creation of a bulboventricular loop (see Fig. 8-1, B and C).
Because the venous and arterial poles of the heart tube are fixed during this time of coiling, torsion occurs within the anterior portion of the loop, the truncus arteriosus. This torsion will later contribute to the formation of a spiral septum within the truncus. By the 26th day of gestation, a truncus arteriosus is visible in the center of the anterior portion of the heart, and a common atrium and ventricle are recognizable (see Fig. 8-1, D). By day 28 the looping process is complete.
The embryonic heart begins to contract by day 26 to 28, with cycles that are similar to those in mature hearts.72 In this “in-series circulation,” blood flows from the morphologically right atrium to the morphologically left atrium, left ventricle, right ventricle and then the truncus arteriosus.902
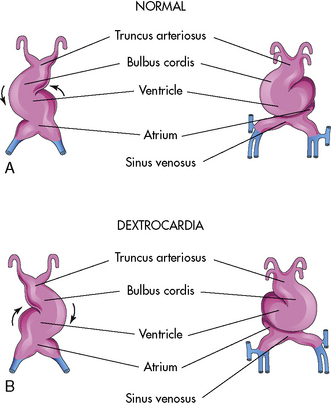
Malrotation during the formation of the ventricular loop may cause various cardiac malpositions (such as dextrocardia) and malformations. As noted, the normal direction for the ventricular loop is to the right, or D-looping. If the ventricles loop to the left instead, L-looping has occurred, so the morphologic left ventricle is located to the right, and the morphologic right ventricle is on the left (Fig. 8-2).
Formation of Cardiovascular Septation: Day 26 to 49
Cardiac septation occurs after the looping process is complete. During the septation process, septae are formed that ultimately close the ostium primum, the central atrioventricular canal, and the interventricular foramen. At the end of this period, the in-series circulation becomes two parallel circulations.902
Endocardial Cushion Development: Day 26 to 40
Septation begins on day 26 with the ingrowth of large tissue masses, the endocardial cushions. These cushions form on the dorsal and ventral walls of the atrioventricular (AV) canal separating the primordial atrium from the primordial ventricle.627 These cushions contain mesenchymal cells, derived from endocardium, and cardiac jelly, derived from endothelium. The endothelial cells line the atrioventricular canal and conotruncal segments. Neural crest cells migrate into the pharyngeal arches and then to the endocardial cushions, where they play a role in the septation of the cardiac chambers, outflow tracts, and heart valves. From the endocardial cushions, the neural crest cells then invade the myocardium.
Genetic disruptions in neural crest cell development are not fully understood, but patients with DiGeorge, Alagille, and Noonan syndrome have congenital heart defects that are influenced by cardiac neural crest cells.764
Atrial Septation: Day 30 to 35
Septation of the atria begins around day 30. Two septae develop and are modified to form a flapped orifice, the foramen ovale as illustrated in Fig. 8-3. The first septum to form is the septum primum, which grows from the anterior, superior portion of the atrium and extends toward the center of the heart. The development of the septum primum leaves a gap, the ostium primum, in the inferior portion of the atrial wall; this gap normally is closed by the fusion of the endocardial cushions. As the ostium primum is closing, perforations produced by apoptosis begin to form in the central portion of the septum primum. These perforations coalesce to create the ostium secundum (see Fig. 8-3, C and D).627
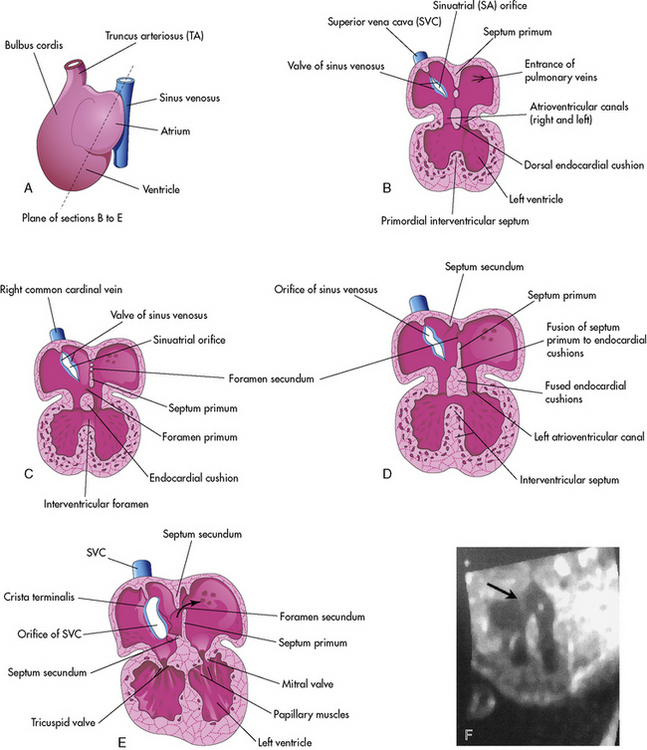
The septum secundum is the second septum to form within the atria. It is a thick crescent-shaped muscular fold that grows immediately adjacent to the septum primum. As it grows, it overlaps the foramen secundum in the septum primum. The atrial partition is incomplete, forming an oval foramen (in Latin, the foramen ovale).627
The portion of the septum primum that is attached to the cranial portion of the atrium gradually disappears. The remaining portion of the primum septum that is attached to the fused endocardial cushions forms the flap of tissue called the valve of the oval foramen.627
Before birth the foramen ovale allows the oxygenated blood from the placenta entering the right atrium via the inferior vena cava to flow to the left atrium and to the fetal brain. (See section, Fetal Circulation that follows.) The flap of the oval foramen normally prevents flow in the opposite direction.627
Atrial septal defects occur when the primum septum or the secundum septum or both do not completely form. Atrial septal defects include an ostium primum, secundum atrial septal defect, or common atrium. An ostium primum atrial septal defect is located near the atrioventricular valves. This defect will not close spontaneously. An ostium secundum atrial septal defect is thought to result from excessive apoptosis of the septum primum, so that a large defect is present in the area of the foramen ovale. Some secundum defects decrease in size and some undergo spontaneous closure.723
Ventricular Septation: Day 25 to 49
Septation of the ventricles begins around day 25 with protrusions from the inlet (primitive ventricle) and outlet (bulbus cordis) segments of the primordial heart. The muscular intraventricular septum initially grows from the apex of the ventricle and increases with dilation of both ventricles. With rapid proliferation of the myoblasts in the septum, the muscular septum extends toward the center of the heart.79,627 At first there is a crescent-shaped intraventricular foramen between the septum and endocardial cushions. The right and left bulbar ridges and the fused endocardial cushions join with the intraventricular muscular septum to form the membranous septum, obliterating the intraventricular foramen (refer again to Fig. 8-3, B-E).
As the ventricular cavities develop, the walls form a sponge work of muscular bundles. Some of the bundles become the papillary muscles and the tendinous cords (Latin, chordae tendineae) of the atrioventricular valves.627 Ventricular septal defects can occur in any location in the developing ventricular septum. Some muscular defects will close spontaneously.723
Septation of the Truncus Arteriosus: Day 26 to 42
Active proliferation of the mesenchymal cells in the walls of the bulbus cordis form the conotruncal or bulbar ridges. Similar ridges form in the truncus arteriosus (Fig. 8-4).
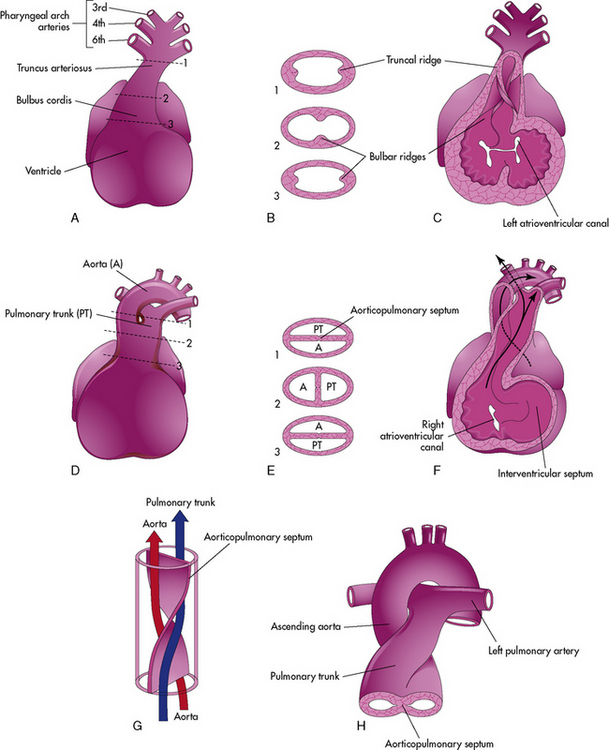
The mesenchymal cells in these ridges are primarily from neural crest cells. As cell proliferation occurs, the truncal and bulbar ridges create a 180-degree spiraling. This spiraling may be enhanced by the streaming of blood from the ventricles, as illustrated, or may result from passive untwisting as the pulmonary artery passes from the anterior pulmonary valve to the posterior pulmonary bifurcation.902
The spiraling of the conotruncal septum aligns the future pulmonary artery to the anterior and rightward right ventricle, where it joins with the outflow tract (infundibulum) created by incorporation of the bulbus cordis into the right ventricle. The future aorta communicates with the posterior and leftward left ventricle at the aortic vestibule created by incorporation of the bulbus cordis below the aortic valve.627 Differences in cell growth create a separation between the tricuspid and pulmonary valve. Disappearance of this segment below the aortic valve provides fibrous continuity between the mitral and aortic valve.79
Defects in the conotruncal and aortic arch development do not close spontaneously. Congenital heart defects that result from defective conotruncal development include: truncus arteriosus, tetralogy of Fallot, pulmonary atresia, double-outlet right ventricle, interrupted aortic arch, and aortopulmonary window. These defects are often associated with genetic deletions of chromosome 22q11 (see section, Genetic Factors Associated with CHD).627,723 Failure of appropriate conal reabsorption of the subaortic conus is thought to produce improper truncal rotation and result in d-transposition of the great vessels.
Formation of the Cardiac Valves: Day 34 to 42
The semilunar valves form when truncal septation is nearly complete. They develop from three swellings of subendocardial tissue around the openings of both the aortic and pulmonary trunks. The signaled transformation of endocardial cells to mesenchymal cells creates the differentiation of fibrous valve tissue.30 This fibrous tissue is hollowed out and reshaped to form three thin-walled cusps for each valve.627 Congenital heart defects that result during valve formation include pulmonary valve stenosis or atresia, pulmonary infundibular stenosis, a bicuspid aortic valve, and aortic stenosis.
The atrioventricular valves develop from localized proliferation of tissue around the atrioventricular canals.627 Most of the atrioventricular valve tissue comes from the ventricular myocardium in a process that involves undermining the ventricular walls. This process is asymmetric and positions the tricuspid valve annulus closer to the apex of the heart than the mitral valve annulus. Physical separation of these two valves creates the atrioventricular septum. Absence of this septum is the common defect in children with atrioventricular septal defects. Ebstein anomaly is thought to result from incomplete undermining of the ventricular wall.79
Classification of Complex Cardiac Malpositions and Malformations
Complex cardiac malformations and malpositions can be described according to a labeling system proposed by Van Praagh.902 This classification included 10 cardiac segments, but three were used most often. The positions of the viscera, the ventricular loop, and the great arteries are all labeled separately, using three letters within curved brackets, such as {A, B, C}.
The cardiac chambers and organ segments are identified by morphology (i.e., structure and appearance); the segments then can be referred to as concordant (consistent in position), or discordant (inconsistent in position). Although this segmental description of congenital heart defects is not used for the most common forms of defects, it is used in the classification of cardiac malpositions (e.g., dextrocardia or dextroversion) and complex transpositions. A variation of the Van Praagh segmental classification has been published recently343 using six segments (systemic and pulmonary veins, atrial situs, atrioventricular connection, ventricles and infundibulum, ventricle to artery connection, and great arteries and the ductus arteriosus). The following section identifies the three most commonly used segments for identification.
Position of the Abdominal Viscera and Atria (S, I, or A)
The atria can be labeled definitively during cardiac surgery, when characteristic atrial morphology can be identified. When the atrial and visceral positions are normal (S, for situs solitus), the morphologic right atrium is on the right side; it is identifiable because it is joined to the suprahepatic portion of the inferior vena cava.903 In addition, the abdominal viscera are in typical position; the liver is on the right and the stomach and spleen are on the left.
Description of the Ventricular Loop (D or L)
Position of the Great Vessels (d– or l-Normal, or d– or l-Transposition)
As noted, the position of the great vessels is determined by the relationship of the semilunar valves. Normal (dextral) position of the great vessels is present if the aortic valve is posterior and to the right of the pulmonic valve; this position also is occasionally referred to as the situs position of the great vessels. Abnormal position of the great vessels may be indicated by the letters d or l. Abnormal dextral or d-position of the great vessels is present if the vessels are located abnormally and the aortic valve is located to the right but anterior to the pulmonic valve. The great vessels are labeled as position l (levo or leftward) if the aortic valve is to the left of the pulmonic valve. Since dextral position may be either normal or associated with great vessel malposition, the letters d or l (capital letters are not used here) are usually modified by the terms “normal” or “transposition”29 to indicate the relationship between the great vessels and the ventricles.
Corrected transposition (l-transposition) with normally related abdominal viscera would be labeled TGA (S, L, l-transposition): situs solitus is present, a left ventricular loop has occurred, and the aortic valve lies to the left of the pulmonic valve.903 The aorta arises from the morphologic right ventricle.
Development of the Aortic Arch: Day 28 to 49
Two large arteries form at the distal end of the truncus arteriosus during the fourth and fifth weeks of fetal development. Although these original arteries ultimately disappear, they give rise to six pairs of arteries, the six aortic arches. By the end of the fourth week the first two pairs and the fifth pair of aortic arches have disappeared, and the sixth pair of arches now is joined to the pulmonary trunk and contributes to the development of the ductus arteriosus. Ultimately the third aortic arch will form the common carotid artery, the external carotid artery, and part of the internal carotid artery. The fourth aortic arch forms part of the final aortic arch and the proximal portion of the right subclavian artery. The sixth aortic arch provides the proximal segment of both pulmonary arteries and the ductus arteriosus, and a branch develops with the lung buds to provide pulmonary blood flow (see Evolve Fig. 8-1 in the Chapter 8 Supplement on the Evolve Website). Abnormalities in formation of the aortic arches can result in an interrupted aortic arch, aortic atresia, patent ductus arteriosus, vascular rings (including double aortic arches), and aberrant origin of the right subclavian artery.
Development of the Ventricular Myocardium, Conduction System, and Coronary Circulation
After the neural crest cells enter the endocardial cushions, they migrate to the myocardium. The myocardium then develops into a working myocardium and the cardiac conduction system. Originally the atrium acts as the pacemaker of the heart. The sinoatrial node develops during the fifth week. Additional cells from the right atrial wall join with cells from the atrioventricular region to form the atrioventricular node and His bundle located just above the endocardial cushions. Bundle branches are found throughout the ventricular myocardium.627
Additional cells develop from a small, transient organ, the proepicardium, on the dorsal thoracic wall. The proepicardial cells contain mesothelial cells that migrate to the heart and form the epicardium that lines the heart. These cells migrate further and differentiate to form the coronary vasculature and cardiac fibroblasts.764
In prenatal life myocardial cells undergo significant changes to increase in number (hyperplasia) and size (hypertrophy). The myocardial cells also change shape from round to cylindrical, become more regular in the orientation of the myofibrils (the contractile element), and have increasing proportions of myofibrils. Developmental changes are also seen in the sarcolemma (plasma membrane) and sarcoplasmic reticulum. Both control the ion channels and transmembrane receptors that regulate cardiac function, depolarization, and repolarization. Maturation of these cells and functions continues into the neonatal period.79
Fetal Circulation
Fetal circulation differs anatomically and physiologically from postnatal circulation in several important ways. In the fetus, oxygenation of the blood occurs in the placenta, which is a relatively inefficient oxygenator. The fetus is hypoxemic, with an aortic arterial oxygen tension of approximately 20 to 30 mm Hg; the saturation of fetal hemoglobin is higher at this oxygen tension than is normal hemoglobin, so oxygen saturation is approximately 60% to 70%. The fact that the oxygen tension is normally much lower in the fetus than postnatally may account for the ability of the neonate to tolerate cyanotic heart disease.278 Despite this arterial hypoxemia, the fetus does not have tissue hypoxia because fetal cardiac output is higher than at any other time in life, averaging approximately 400 to 500 mL/kg per minute. Approximately 20% of the normal fetal oxygen consumption of 8 mL/kg per minute is required to develop new tissue.278 Fetal cardiac output is constant (at approximately 400 to 500 mL/kg per minute) at a heart rate greater than 120 to 180/min. Changes in preload result in very little change in cardiac output, and changes in afterload are not well tolerated.278
Fetal circulation is designed to deliver the best-oxygenated and nutrient rich blood from the placenta to the fetal brain and heart (Fig. 8-5). This blood enters the fetus through the umbilical vein. The blood flow splits in the liver with almost half going through the hepatic veins and portal system of the liver and the rest through the ductus venosus, where it joins the inferior vena cava near its junction with the right atrium. In the right atrium the blood from the inferior vena cava (with a PO2 of 32 to 35 mm Hg and an oxygen saturation of 70%—the highest fetal PO2) is divided into two streams. About 40% of this blood passes through the foramen ovale into the left atrium, where it joins the small amount of blood from pulmonary venous return. It then passes through the mitral valve to the left ventricle and then to the ascending aorta where it supplies the coronary, carotid, and subclavian arteries. The preferential streaming of this blood results in an ascending aortic arterial oxygen tension (PaO2) of 26 to 28 mm Hg and an oxygen saturation of 65%.278,686 Ten percent of the blood flow from the left ventricle passes through the aortic arch into the descending aorta, where it joins 90% of the blood leaving the right ventricle. The fetal right ventricle pumps more than two thirds of the combined ventricular output, so the right ventricle is relatively muscular.
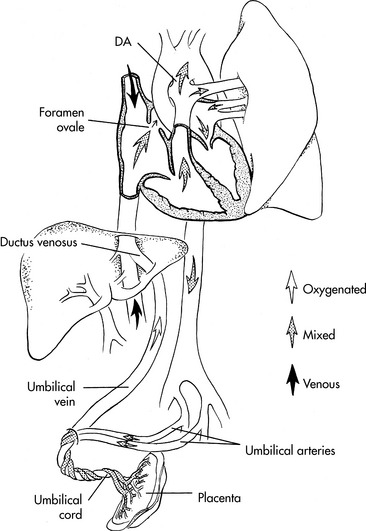
Most blood from the right ventricle bypasses the lungs because pulmonary vascular resistance is high; it passes through the ductus arteriosus into the descending aorta. (It provides less resistance to flow than pulmonary vascular resistance.) Only 10% to 15% of the right ventricular blood flow goes to the pulmonary arteries.278,627 The descending aortic arterial oxygen tension is 20 to 22 mm Hg with an oxygen saturation of 50% to 55%.278,681,686
Normal perinatal circulatory changes
Elimination of the placenta causes an immediate fall in the blood pressure in the inferior vena cava and right atrium. Lung expansion with air that includes oxygen causes a dramatic rise in alveolar oxygenation and a fall in the pulmonary vascular resistance. With the decrease in pulmonary vascular resistance, pulmonary artery pressure falls, and blood flow through the ductus arteriosus is reversed. A rise in arterial oxygen tension and perivascular PO2 causes vasoconstriction of the ductus arteriosus. This increases pulmonary blood flow, resulting in more pulmonary venous return to the left atrium. This rise in pulmonary venous return increases the left atrial pressure above the inferior vena cava and right atrial pressure and functionally closes the foramen ovale with the flap of the primum septum. Blood pressure increases in the aorta and systemic circulation with removal of the low-resistance placenta from the circulation.278,385,627,686
Right ventricular output is reduced to half of the combined ventricular output.278 The increased workload of the right ventricle during fetal life produced a thickened right ventricular wall that is reflected in the increased RV forces on the neonatal electrocardiogram. The thickness of the right ventricular wall regresses over the first postnatal month because the workload of the right ventricle is reduced. With the reverse in workload and increased systemic vascular resistance, the wall of the left ventricle thickens.627
Normal Postnatal Changes in Pulmonary Vascular Resistance
At sea level, pulmonary vascular resistance falls immediately after birth by approximately 80% and normally reaches near-adult levels during the first weeks of life. Normal pulmonary vascular resistance index (normalized to body surface area) is approximately 7 to 10 Wood units × m2 body surface area during the first week of life, but falls to 1 to 3 Wood units × m2 body surface area within a few weeks in patients at sea level (Table 8-3). Within 24 hours after birth, mean pulmonary artery pressure has fallen to approximately one half of mean systemic pressure, if the ductus arteriosus has constricted normally. This fall in pulmonary vascular resistance results in a parallel fall in right ventricular systolic and end-diastolic pressure.
 |
||
 |
||
| Note: This equation yields the PVR in Wood Units (units). Normal values are listed below. To convert these units to units of absolute physical resistance (dynes-sec-cm−5), multiply the Wood Units by 80. | ||
| To normalize PVR for body surface area, Pulmonary Vascular Resistance INDEX Units (PVRI) are calculated. The above equation is utilized, with the substitution of Cardiac Index (L/min per m2 BSA). In effect, the PVRI is the PVR (in Wood Units) multiplied by the child’s body surface area. Normal values are listed below. | ||
| Age | Absolute PVR (Wood Units)* | PVR Index* |
| Newborn infant | 25-40 Units | 7-10 Index units |
| Child | 0.5-4 Units | 1-3 Index units |
* To convert these units to dynes-s-cm−5, multiply by 80.
The presence of alveolar hypoxia during the first days of life may delay or prevent the normal fall in pulmonary vascular resistance, because the hypoxia stimulates pulmonary vasoconstriction. Alveolar hypoxia is present in premature neonates with severe respiratory distress syndrome; this may delay the perinatal fall in pulmonary vascular resistance. As long as pulmonary vascular resistance remains high, increased pulmonary blood flow through the ductus arteriosus is prevented. Typically the pulmonary vascular resistance falls when the pulmonary disease resolves. This fall in pulmonary vascular resistance often is heralded by symptoms of a large left-to-right shunt through a patent ductus arteriosus. Other factors that may contribute to pulmonary vasodilation and pulmonary vasoconstriction are listed in Box 8-1.
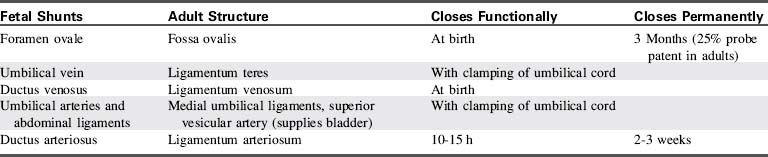
Closure of Fetal Shunts
Constriction of the ductal medial smooth muscle thickens the ductal wall and shortens the ductus, resulting in an infolding of the intima within the ductal lumen. These changes generally produce functional closure of the ductus within 10 to 24 hours following a full-term birth. The ductus then is converted to the ligamentum arteriosus through fibrous infiltration (Fig. 8-6).
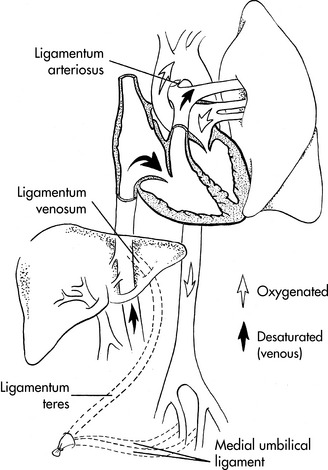
In most individuals the foramen ovale becomes sealed permanently by deposition of fibrin and cell products during the first months of life; this is referred to as anatomic closure of the foramen ovale. In approximately 25% of the population, however, the foramen ovale is not sealed anatomically and remains probe-patent beyond adolescence, so that a catheter can be passed from the right to the left atrium during cardiac catheterization or surgery. Table 8-4 provides a summary of the timing of the closure of the fetal shunts.
Normal Postnatal Changes in Systemic Vascular Resistance
With separation of the placenta from the circulation the neonate’s systemic vascular resistance begins to rise, and continues to increase during childhood. Normal systemic vascular resistance index is approximately 10 to 15 Wood units × m2 body surface area in the young infant, and is approximately 15 to 30 Wood units × m2 body surface area in the child and adult (Table 8-5).
 |
||
 |
||
| Note: This equation yields the SVR in Wood Units (units). Normal values are listed below. To convert these units to units of absolute physical resistance (dynes-sec-cm−5), multiply the Wood Units by 80. | ||
| To normalize SVR for body surface area, Systemic Vascular Resistance INDEX Units (SVRI) are calculated. The above equation is utilized, with the substitution of Cardiac Index (L/min per m2 BSA). In effect, the SVRI is the SVR (in Wood Units) multiplied by the child’s body surface area. Normal values are listed below. | ||
| Age | Absolute SVR (Wood Units)* | SVR Index* |
| Infant | 35-50 Units | 10-15 Index units |
| Toddler | 25-35 Units | 20 Index units |
| Child | 15-25 Units | 15-30 Index units |
Normal cardiac function
The Cardiac Cycle
Systemic venous return enters the right atrium through the superior and inferior vena cavae. Oxygen saturation of superior vena caval blood is approximately 70%, which is slightly lower than the saturation of blood in the inferior vena cava (75%). Coronary sinus blood, with an oxygen saturation of approximately 30% to 40%, is then added to this venous return, so the mixed venous saturation (best obtained in the pulmonary artery after mixing is complete) usually is approximately 70% to 75%. This corresponds to a mixed venous oxygen tension (PvO2) of 38 to 40 mm Hg (Fig. 8-7).
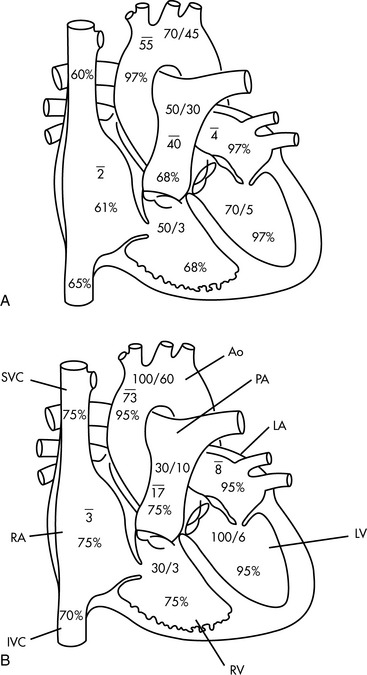
Fig. 8-7 Normal pressures (in mm Hg) and oxygen saturations in the neonatal A, and pediatric B, heart.
During atrial and ventricular diastole the tricuspid valve is open and systemic venous blood flows passively into the right ventricle. Approximately 70% of ventricular filling occurs during this period. Mean right atrial pressure is equal to right ventricular end-diastolic pressure in the absence of tricuspid valve disease. Mean right atrial pressure in spontaneously breathing infants beyond the neonatal period is approximately 0 to 4 mm Hg; mean right atrial pressure in older children during spontaneous breathing is 2 to 6 mm Hg.752
The right ventricle fills rapidly at the beginning of ventricular diastole; subsequent ventricular filling is slower until atrial systole occurs (Fig. 8-8, #1). Immediately after atrial contraction, ventricular contraction begins. Initially, ventricular contraction produces only a rise in ventricular pressure (without ejection of blood); this period is called the isovolumetric phase of ventricular systole (see Fig. 8-8, #2).
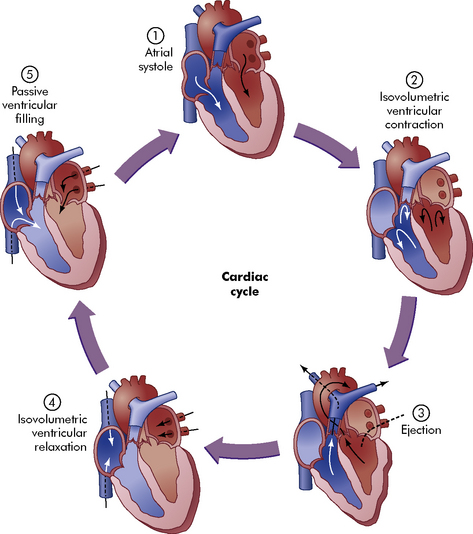
When right ventricular pressure exceeds right atrial pressure, the tricuspid valve closes and ventricular pressure rises rapidly. Once right ventricular pressure exceeds pulmonary artery pressure, the pulmonary valve opens and blood is ejected into the pulmonary artery. This ejection phase of ventricular contraction is called the isotonic phase of contraction (see Fig. 8-8, #3). Right ventricular systolic pressure is approximately 15 to 25 mm Hg in normal children and adults; it is typically higher in neonates and young infants. Pulmonary artery diastolic pressure is approximately 4 to 12 mm Hg.752
Because there are no valves between the precapillary pulmonary artery and the left atrium, the pulmonary artery wedge or occlusion pressure (obtained using an end-hole, balloon-tipped, flow-directed pulmonary artery catheter) is roughly equivalent to the left atrial pressure. This assumes that the catheter is placed in a posterior, inferior pulmonary artery branch; the monitoring system is zeroed, leveled, and calibrated correctly; alveolar pressure does not exceed pulmonary end-diastolic pressure (for further information, refer to Chapters 6 and 21); and there is no pulmonary venous constriction or obstruction.
As with the right ventricle, left ventricular filling occurs largely during atrial and ventricular diastole (see Fig. 8-8, #5). Left atrial contraction contributes the final 30% of ventricular filling (refer to Fig. 8-8, #1). Immediately after left atrial contraction the left ventricle begins to contract. When left ventricular pressure exceeds left atrial pressure the mitral valve closes; this initial phase of contraction is called isovolumetric contraction (see Fig. 8-8, #2). When left ventricular pressure exceeds aortic pressure the aortic valve opens and blood flows into the aorta and systemic circulation (isotonic contraction occurs; see Fig. 8-8, #3). Left ventricular systolic pressure is approximately equal to the child’s systemic arterial pressure unless left ventricular outflow tract obstruction is present.
The Coronary Circulation
Unlike adults, pediatric patients rarely suffer from anatomic compromise of coronary artery diameter and flow. An example of compromised flow is caused by congenital anomalous origin of the coronary artery from the pulmonary artery. In this case the “stealing” of myocardial blood flow results when blood from the normal coronary artery (arising from the aorta) flows through a fistula, then retrograde through the anomalous coronary artery and into the pulmonary artery. This creates a shunt from the aorta to the pulmonary artery and prevents effective perfusion of the coronary circulation (see Coronary Artery Anomalies).
Cellular Physiology
Membrane and Action Potentials
In all tissues of the body there is a difference between intracellular and extracellular concentrations of electrolytes, particularly sodium and potassium. In nerve and muscle cells there is also a difference in electrical charge between the inside and the outside of the cell; the inside of the cell is negatively charged with respect to the outside of the cell (and the outside of the cell is positively charged with respect to the inside of the cell). This difference in electrical charge across the cell membrane is called a membrane potential or a transmembrane potential (see Fig. 8-9).
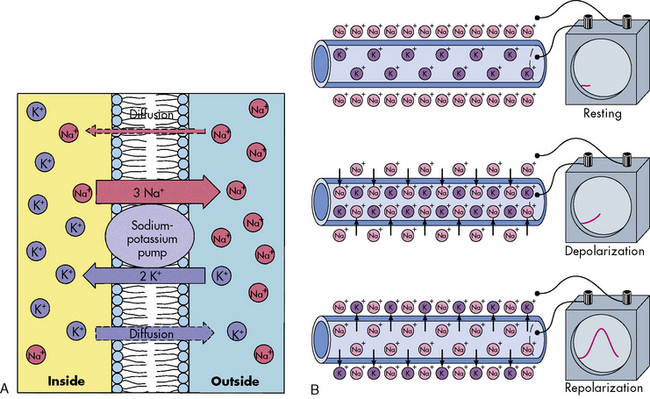
The cardiac resting membrane potential results from concentration gradients for potassium and sodium across the cell membrane, as well as from the relative differences in membrane permeabilities to sodium and potassium (Fig. 8-9, B, top). Changes in membrane permeability to sodium and potassium ions are responsible for the generation of an action potential, a change in electrical charge that occurs when sufficient change in transmembrane potential develops and depolarization of the cell results.
At rest the concentration of potassium is high inside the cell and low outside of the cell; in contrast, the concentration of sodium is low inside the cell and high outside of the cell. Thus, there is a high concentration gradient for potassium to move to the outside of the cell and a concentration gradient for sodium to move to the inside of the cell. An active (energy-requiring) pump moves sodium ions out of the cell and potassium ions into the cell. The hydrolysis of adenosine triphosphate (ATP) provides energy for the pump. For every three sodium ions that are transported out of the cell, two potassium ions are moved into the cell (refer again to Fig. 8-9, A); this active pump generates a current (a net positive charge moves out of the cell). Under resting conditions, sodium moved outside the cell remains outside the cell because the sarcolemma is relatively impermeable to sodium.
Excitation of the myocardium results in altered sarcolemma permeability to sodium, calcium, and potassium and produces a change in intracellular electrical charge (i.e., an action potential). For an action potential to develop, the cell must be stimulated sufficiently to increase membrane permeability to sodium. At the same time, membrane permeability to potassium is decreased temporarily. Once the cell is stimulated sufficiently to threshold potential (the transmembrane voltage at which an action potential will occur), gating proteins allow sodium ions to enter the cell rapidly through fast channels, producing a current, or flow of electrons (depicted in Fig. 8-9, B, middle). The inside of the cell rapidly becomes positively charged with respect to the outside of the cell. This sodium influx, then, depolarizes the cell.
The cardiac action potential is a graphic representation over time of changes in the myocardial transmembrane potential of a single myocyte following stimulation. The myocardial action potential is divided into five phases: Phase 0, Phase 1, Phase 2, Phase 3, and Phase 4 (see Fig. 8-10, A), which are related to the changes in the transmembrane ion flow discussed in the preceding paragraphs.77,78,863
Phase 0. Fast channels are opened, and sodium rushes into the cell. The intracellular charge becomes progressively less negative, then positive with respect to the outside of the cell. Once the transmembrane potential reaches approximately −30 to −40 mV, slow calcium channels also open, perpetuating the action potential.
Phase 1. A short phase of rapid partial repolarization occurs as the fast channels are closed abruptly. These gates cannot reopen until the cell is repolarized partially during Phase 3, so the cell will be refractory to further excitation until that time. Slow calcium channels remain open at this time.
Phase 2. This plateau is produced when the slow calcium channels remain open, allowing continued diffusion of calcium ions into the cell. This plateau is unique to myocardial cells (it is not a feature of the action potential of skeletal muscle); because it delays repolarization, the plateau lengthens the refractory period of the myocardium, so myocardial tetany cannot occur.
Slow calcium channels not only affect myocardial excitation, they also deliver calcium to the myocardium for contraction and stimulate the sarcoplasmic reticulum to release additional calcium into the intracellular compartment, facilitating contraction. Calcium channels are blocked by specific inhibitor drugs such as verapamil, nifedipine, and diltiazem, and they are activated by sympathomimetic drugs.
Phase 3. Repolarization occurs rapidly when the slow calcium channels close; membrane permeability to potassium is restored. This permeability results in a significant potassium efflux to the outside of the cell.
Phase 4. The resting membrane potential is restored by the sodium-potassium pump and continued potassium efflux from the cell. This phase is the period between two action potentials. In the heart, Phase 4 is characterized by a slow reduction in the magnitude of the transmembrane potential caused by sodium influx; this influx creates prepotential. The prepotential ultimately can bring the transmembrane potential to threshold, so depolarization again occurs. The rate of this Phase 4 depolarization determines the intrinsic pacemaker capacity of the cell (see the following section).
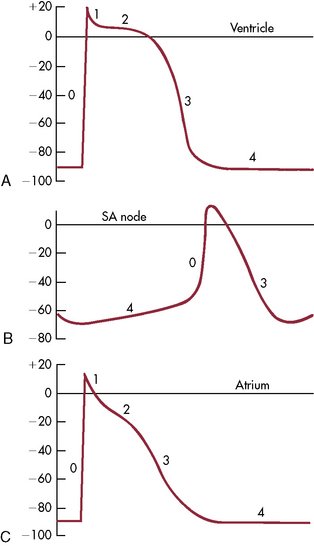
Pacemaker Cells and Pacemaker Potentials
Pacemaker cells spontaneously depolarize at a more rapid rate than typical myocardial cells. The action potential of the pacemaker cells is also different in appearance than the action potential of myocardial cells (Fig. 8-10, B). Pacemaker action potentials can be recognized by the gradual depolarization during Phase 4 (this may be called a prepotential), and the absence of a plateau in Phase 2. The gradual depolarization during Phase 4 allows spontaneous pacemaker excitation, and the absence of a plateau ensures that the cell can be depolarized again within a short period of time.
Myocardial Contraction
The myocardium consists of a woven mesh of interconnected myocardial cells or myocytes. Each myocyte is surrounded by a semipermeable membrane, the sarcolemma. The myocyte contains myofibrils, and the myofibrils, in turn, each contain groups of sarcomeres. The sarcomere is the contractile element of a myocardial cell that contains thin overlapping protein filaments of actin and thicker myosin filaments (Fig. 8-11, A). Coupling of these filaments occurs when intracellular ionized calcium is increased.
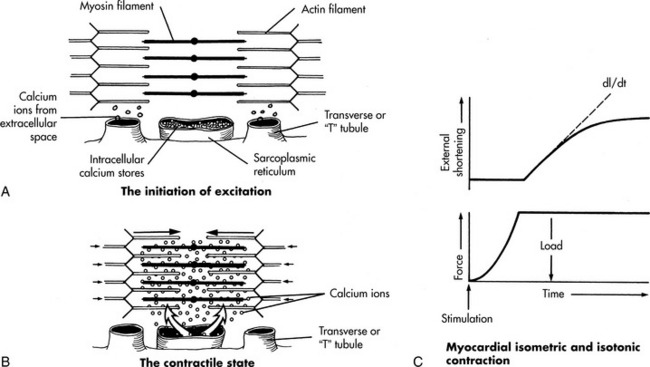
During depolarization of the myocardium, transcellular calcium influx occurs; calcium enters the cell through calcium channels in the sarcolemma and through invaginations in the sarcolemma, called T-tubules (refer, again, to Fig. 8-11, A and B). This calcium entry into the sarcoplasm stimulates further calcium release from the sarcoplasmic reticulum. The free cytoplasmic calcium reacts with troponin, with the resulting formation of cross-linkages between the actin and myosin filaments. As a result of these linkages, the filaments are pulled together, causing shortening of the myocardial fiber (contraction), so the fibers generate tension. Myocardial relaxation results when calcium uptake by the sarcoplasmic reticulum occurs by means of an energy-requiring pump. Exchange of sodium for calcium ions also occurs during diastole.
Tension generated by the myocardium and velocity of myocardial contraction (or shortening) are inversely related. If the myocardium is restrained, isometric contraction will result—the fiber will not shorten, but it will develop tension. If the myocardial fiber is unrestrained, it shortens, or contracts (see Fig. 8-11, B), but it will not develop further tension—this form of contraction is called isotonic contraction. During ventricular systole, both isometric and isotonic contractions occur. Isometric contraction occurs before the opening of the semilunar valves, and isotonic contraction occurs after the semilunar valves open. Stroke volume is determined by the amount of isotonic contraction (or ventricular fiber shortening) that occurs after sufficient tension is developed to overcome resistance to ejection (afterload).77,78,863
Factors influencing normal ventricular function
The intracellular sodium concentration influences free calcium levels in the myocyte because these ions share storage sites and compete for space in the exchange pump. If the intracellular sodium concentration is increased (such as occurs during digitalis therapy), sodium occupies space in the exchange pump, so calcium will accumulate in the myocardial cell. The result is that cardiac contractility is enhanced (see further discussion in the Common Clinical Conditions section, under Congestive Heart Failure).
Three terms have been borrowed from the physiology laboratory to describe factors that influence ventricular stroke volume. These terms—preload, contractility, and afterload—have been defined precisely in the laboratory setting using isolated myocardial muscle strips. However, they are described only generally in the clinical setting with an intact heart, where it usually is impossible to isolate single variables. Therefore a brief review of the clinical interpretation of these factors is provided. This information is also presented in Chapter 6.
Ventricular Preload
The Frank-Starling Law of the Heart
Preload is the amount of myocardial fiber stretch that is present before contraction. Howell (in 1894), Frank (in 1894), and Starling (in 1914) performed experiments using isolated normal myocardial muscle preparations, and observed that normal myocardium generates greater tension during contraction if it is stretched before contraction. The increase in the force of contraction optimizes overlap between actin and myosin filaments in the sarcomere. Their observations became known as the Frank-Starling law of the heart, which states that an increase in ventricular end-diastolic myocardial fiber length (manipulated by increasing ventricular end-diastolic pressure) will produce an increase in ventricular work, systolic tension, and stroke volume. The graphic representation of the relationship between ventricular end-diastolic pressure and stroke volume is the Frank-Starling curve, which is a ventricular (myocardial) function curve (Fig. 8-12).77,78,863
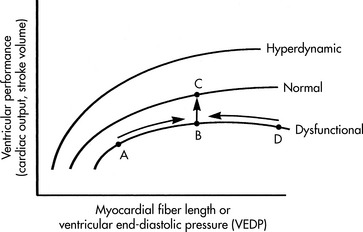
A goal of the treatment of any patient with cardiovascular dysfunction is to maximize stroke volume and cardiac output, while minimizing adverse effects of fluid administration (such as pulmonary edema). An increase in stroke volume and cardiac output can be achieved by moving the patient to the highest point of an individual ventricular function curve (see Fig. 8-12, A to B); this movement may be achieved by judicious fluid administration. Improvement in stroke volume and cardiac output also can be achieved by altering the ventricular compliance, using vasodilator therapy. An increase in stroke volume and cardiac output also can be achieved through improvement in cardiac contractility; this raises the ventricular function curve (see Fig. 8-12, B to C). Such an improvement may be attained by elimination of factors that normally depress myocardial function, or through administration of inotropic agents or vasodilators (see section, Afterload).
Clinical Evaluation of Ventricular Preload
A left atrial catheter or pulmonary artery catheter must be inserted to measure LVEDP, because this pressure cannot reliably be estimated from clinical examination. In the absence of pulmonary venous constriction or obstruction, a pulmonary artery wedge pressure will approximate left atrial pressure; in the absence of mitral valve disease or extreme tachycardia, left atrial pressure should reflect left ventricular end-diastolic pressure. However, the pulmonary artery catheter must be placed appropriately and the transducer must be zeroed, leveled, and calibrated correctly with appropriate consideration of intrapulmonary pressure. (For information about potential errors in use of pulmonary artery catheters, refer to Chapter 21.)
Ventricular Compliance
Ventricular compliance refers to the distensibility of the ventricle. It is defined as the change in ventricular volume (in mL) for a given change in pressure (in mm Hg), or ΔV/ΔP, and can be depicted graphically by a ventricular compliance curve (see Fig. 6-3). The opposite of compliance is stiffness (ΔP/ΔV).
If the ventricle is extremely compliant a large volume of fluid may be administered without producing a significant increase in VEDP (see Fig. 6-3, curve B). In contrast, if the ventricle is dysfunctional (as occurs with restrictive cardiomyopathy) or hypertrophied, ventricular compliance usually is reduced (see Fig. 6-3, curve C). In this case, even a small volume of administered intravenous fluids will produce a significant rise in VEDP. The more dysfunctional and noncompliant the ventricle, the higher will be the resting VEDP and the VEDP needed to optimize stroke volume and ventricular performance.
Vasodilator therapy will improve ventricular compliance. When these drugs are administered the compliance curve is altered, so a greater end-diastolic volume may be present without a substantial increase in ventricular end-diastolic pressure (see Fig. 6-3). Stroke volume may then be increased without a rise in VEDP.
Compliance also is affected by ventricular size, pericardial space, and heart rate.141 Infants have very small and relatively noncompliant ventricles, so the infant’s VEDP may rise sharply with even small fluid volume administration. If the same volume (on a per kilogram basis) is administered to the older child a smaller change in VEDP will result, because the ventricles are larger and more compliant in the older child.
Contractility
Clinical Evaluation of Contractility
Although contractility can be measured in the laboratory it is not easily isolated and measured in the clinical setting. The most common method of evaluating contractility at the bedside is echocardiographic evaluation of fiber-shortening times and measurement of the shortening fraction of left ventricular diameter. Shortening fraction is calculated by determining the difference between the end-diastolic and end-systolic dimensions; this difference is then divided by the end-diastolic dimension (see Box 8-2); the normal shortening fraction is approximately 28% to 44%.

If a thermodilution cardiac output pulmonary artery catheter is in place, or if reliable Doppler or other noninvasive cardiac output estimations can be obtained (see Chapters 6 and 21), the nurse may create a ventricular function curve (see Fig. 8-12). If cardiac output improves with no change in VEDP, ventricular contractility or compliance has probably improved.
The ventricular pressure curve also may provide information regarding ventricular contractility. This ventricular pressure usually must be examined in the cardiac catheterization laboratory; however, the intraarterial pressure curve may be utilized if the catheter is widely patent and vasoconstriction is not present. The area under the pressure curve correlates with stroke volume. If stroke volume and contractility are good, the slope of the systolic upstroke of the waveform will be steep, and a dicrotic notch clearly visible. If contractility is poor and stroke volume is reduced, the waveform will appear dampened, and the slope of the systolic upstroke of the waveform more horizontal (see Chapter 6).
Afterload
Definition
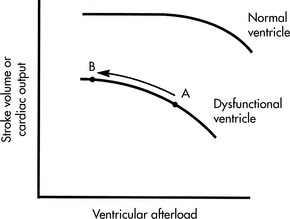
Because fiber shortening (isotonic contraction) occurs only when the ventricle has generated sufficient tension to equal its afterload, an increase in ventricular afterload reduces the isotonic contraction time and thus the stroke volume of the ventricle. Even a normal afterload may be excessive when myocardial function is poor. With any increase in afterload, oxygen consumption and the work of the ventricle increase (Fig. 8-13).
A simplification of Poiseuille’s law states that pressure is a product of flow and resistance:

The major determinants of afterload or wall stress are: (1) ventricular lumen radius; (2) the thickness of the ventricular wall (hypertrophy decreases afterload); and (3) the ventricular ejection pressure (intracavitary pressure), as indicated in Box 8-3. In the normal patient, left ventricular ejection pressure is equal to systemic arterial pressure, and right ventricular ejection pressure is equal to pulmonary artery pressure; systemic and pulmonary artery pressures, in turn, are determined by blood flow and resistance (Poiseuille’s law). Therefore, in the absence of ventricular outflow tract obstruction or significant alterations in ventricular size or wall thickness, afterload is determined primarily by the impedance provided by the pulmonary and systemic arterial circulations (respectively, the pulmonary and systemic vascular resistances).

Clinical Evaluation of Afterload

*Blood flow can be indexed to Body Surface Area (Cardiac Index instead of Output)
The equations for calculation of pulmonary and systemic vascular resistances are provided in Tables 8-3 and 8-5 (in Normal Perinatal Circulatory Changes). Because calculated or estimated cardiac output is in the denominator of these equations, any error in cardiac output determination results in significant error in calculated resistances. In addition, changes in cardiac output affect calculated resistances. When flow (cardiac output) increases, pressure and calculated resistances in the systemic and pulmonary vascular beds increase, unless dilation of vessels occurs. If cardiac output falls dramatically and blood pressure is unchanged, the calculated SVR and PVR may rise sharply, even in the absence of active vessel constriction. These formulas do not allow determination of cause and effect (i.e., did the cardiac output fall because vascular resistances rose, or did the calculated resistances rise because cardiac output fell?).
Maturational Changes in Response to Alterations in Ventricular Afterload
The pediatric ventricle usually can adapt to increases in ventricular afterload provided the increases are not severe or acute. Adaptation may, in fact, be superior to the response of the adult myocardium. For example, if, in the patient with moderate aortic stenosis the left ventricular muscle thickness increases and the diameter of the left ventricular chamber is reduced, wall stress (afterload) may be normalized (refer again to Box 8-3).
Pulmonary vascular resistance is elevated in the neonate and any child with pulmonary vascular disease. Children with elevated PVR or those with a reactive pulmonary vascular bed may demonstrate pulmonary hypertensive “crises.” These crises seem to be associated with pulmonary vasoconstriction, an acute rise in right ventricular afterload, and sudden deterioration in cardiac output and systemic perfusion. Factors associated with pediatric hypoxic pulmonary vasoconstriction include alveolar hypoxia, acidosis, alveolar overdistention (by high airway pressures), and hypothermia (refer as needed to Box 8-1). These factors may be avoided through administration of supplementary oxygen as needed to prevent alveolar hypoxia, maintenance of a mild serum alkalosis, prevention of excessive airway pressures, and sedation. (For further information the reader is referred to the sections Postnatal Changes in Pulmonary and Systemic; Vascular Resistances earlier in the chapter and the section on Common Clinical Conditions, Pulmonary Hypertension, later in the chapter.)
Oxygen transport, cardiac output, and oxygen consumption
Oxygen Content
Factors Affecting Arterial Oxygen Content
The oxyhemoglobin saturation will decrease in the presence of an intrapulmonary shunt or a right-to-left intracardiac shunt (cyanotic heart disease); this decrease in saturation will produce a fall in arterial oxygen content and may reduce systemic oxygen transport. If an intrapulmonary shunt is causing hypoxemia, arterial oxygen content can be increased through the administration of supplementary oxygen. Mechanical ventilation with the judicious use of positive end-expiratory pressure also can increase oxyhemoglobin saturation, arterial oxygen content, and oxygen delivery (see Chapter 9).
If a right-to-left (cyanotic) intracardiac shunt produces mild or moderate arterial oxygen desaturation and hypoxemia (i.e., oxyhemoglobin saturation of 85% to 90% and PaO2 <50 mm Hg), administration of supplementary inspired oxygen is not likely to be beneficial. Oxygen content in these children increases most effectively when hemoglobin concentration increases and pulmonary blood flow and intracardiac mixing improve (refer to the section, Common Clinical Conditions, Hypoxemia).
Clinical Evaluation of Arterial Oxygen Content
The most accurate method of determining arterial oxygen content is through measurement of hemoglobin concentration and its saturation, and arterial oxygen tension. The oxygen content is the product of the hemoglobin concentration, its saturation, and the 1.34 mL (or 1.36 mL according to some sources) of oxygen carried by each gram of saturated hemoglobin per deciliter (see Box 8-4). In addition, a small amount of oxygen is dissolved in the blood; this amount (mL O2/dL of blood) is calculated by multiplying 0.003 and the arterial oxygen tension (PaO2). The dissolved oxygen in the blood usually contributes an inconsequential amount to the oxygen content. However, when severe anemia is present this dissolved oxygen may be very important. Normal arterial oxygen content is approximately 18 to 20 mL O2/dL blood.

Cardiac Output
Cardiac output is the volume of the blood ejected by the heart in 1 min; it is the product of heart rate and stroke volume. Cardiac output often is recorded in L/min or mL/min, although it may be normalized to body weight (mL/kg body weight per min) or to body surface area (mL/m2 body surface area per min). The normal cardiac output averages approximately 200 mL/kg per minute during infancy, 150 mL/kg per minute during childhood, and 100 mL/kg per minute in the adolescent.752 Although the cardiac output/kg body weight decreases during childhood, the absolute cardiac output increases as the child grows.
Factors Affecting Cardiac Output
Ventricular stroke volume averages approximately 1.5 mL/kg; stroke volume in the 3 kg neonate is approximately 5 mL, and stroke volume in the 50 kg adolescent is approximately 75 mL. Stroke volume is determined by ventricular preload, contractility, and afterload. These factors have been described in the preceding sections. Trends in normal cardiac output and index with age can be found in Chapter 6, Table 6-1.
Clinical Evaluation of Cardiac Output
When cardiac output is inadequate to maintain oxygen and substrate delivery to the tissues, signs of poor systemic perfusion usually are present. Hypotension may not be observed unless acute severe blood loss has occurred or cardiovascular collapse is imminent (see Chapter 6).
The child’s cardiac output may be estimated using Doppler studies of flow through the aorta (Box 8-5), or may be calculated using an artoerial/venous oxygen content difference combined with measured or estimated oxygen consumption (the Fick principle), or with thermodilution techniques. Each of these methods involves the application of physiologic principles to biologic systems, so each has potential sources of error that must be eliminated or at least standardized so the techniques can be used to evaluate trends in the patient’s condition.
Doppler Echocardiography
Doppler studies use sound waves reflected from red blood cells to evaluate flow velocity; Doppler cardiac output determinations measure the velocity of red blood cells as they pass through the ascending aorta. The diameter of the thoracic aorta is then calculated based on echocardiographic measurement or normative tables. The cardiac output is the product of the mean red blood cell velocity and the area of the aorta (see Box 8-5). Because the diameter is used to determine the radius (radius = 1/2 measured diameter), and the radius is squared to determine the area of the aorta, any error in the measurement of diameter will be magnified in the ultimate cardiac output determination.
Fick Cardiac Output Calculation
Calculation of cardiac output using the Fick principle requires calculation, measurement, or estimation of oxygen consumption, careful, simultaneous sampling of arterial and mixed venous blood, and accurate calculation of the arterial and mixed venous oxygen contents (Box 8-6). If the child’s cardiorespiratory function is relatively stable and Fick calculations of cardiac output are used for determining trends, the oxygen consumption can be estimated and assumed to remain constant. However, oxygen consumption may vary widely during the clinical course of the child with cardiorespiratory failure, so such estimations may introduce significant error in the cardiac output calculation.
 *† *† |
| To convert the Fick cardiac output to cardiac index |
 |
| Most likely sources of error in Fick cardiac output determination |
| Determination or estimation of oxygen consumption If right atrial sample used for mixed venous sample, preferential sampling of SVC, IVC, or coronary sinus blood may yield erroneous results Mathematical error Intracardiac or great vessel shunt—a left-to-right shunt can raise the mixed venous oxygen saturation and result in falsely high cardiac output calculation |
| To add dissolved oxygen to these figures, multiply 0.003 × PaO2 and add to arterial oxygen content and multiply 0.003 × PvO2 and add to mixed venous oxygen content |
* Determination of oxygen consumption:
• Estimation: 5-8 mL/kg per minute OR 150-160 mL/min per m2 for child (and 120-130 mL/min per m2 for the young neonate). Child must be in steady state.
† Calculation of arterial and venous oxygen content:


The venous sample must be representative of mixed systemic venous blood; because the oxygen content varies in the superior and inferior vena cavae and coronary sinus, a central venous or right atrial sample is not ideal for use in this calculation. (Coronary sinus blood has low oxygen content, and inferior vena caval blood has higher oxygen content than superior vena caval blood.) A true mixed venous sample should be obtained from the pulmonary artery. If a central venous or right atrial sample is used consistently for the venous sample, the potential error introduced must be considered. Any intracardiac or great vessel shunt also introduces significant error into the determination of the true mixed venous oxygen content. (A case study demonstration of the Fick cardiac output calculation is included in Evolve Box 8-3 in the Chapter 8 Supplement on the Evolve Website.)
Mixed Venous Oxygen Saturation
Continuous monitoring of mixed venous oxygen saturation is possible using an oximeter placed in the pulmonary artery. These systems analyze the amount of light reflected from hemoglobin (as compared with pulse oximeters, which measure the light actually absorbed by hemoglobin). The SvO2 falls in the presence of decreased oxygen transport produced by either decreased cardiac output or reduced arterial oxygenation, so the SvO2 frequently falls despite the presence of a stable cardiac output (see Chapter 21). The superior vena caval (SVC) oxygen saturation (ScvO2) may be sampled as a surrogate for the mixed venous oxygen saturation level. However, it is important to note that the mixed venous oxygen saturation (normally approximately 75%) obtained in the pulmonary artery reflects the mixture of superior vena caval blood (oxygen saturation about 70% to 75%), inferior vena caval blood (oxygen saturation about 80% to 85%) and coronary sinus blood (oxygen saturation typically less than 50%). ScvO2 is, therefore, approximately equal to the mixed venous oxygen saturation, but the location of the catheter tip can alter the venous blood sampled and the saturation obtained.
Thermodilution Cardiac Output Calculation
The thermodilution cardiac output calculation is a form of indicator-dilution calculation. This calculation requires insertion of a pulmonary artery catheter containing a thermistor bead. Cold fluid is injected into the right atrium and acts as a thermal indicator. This cold fluid mixes with right ventricular output and is ejected into the pulmonary artery. A thermistor records the temperature change over time in the pulmonary artery, and a computer calculates the area under the time-temperature curve (Box 8-7).
Oxygen Consumption
When oxygen delivery is reduced, oxygen consumption may be maintained through an increase in tissue oxygen extraction. If oxygen delivery falls precipitously, however, oxygen consumption also falls. At this point, oxygen consumption becomes transport- or delivery-dependent (for further information, see Chapter 6 and Fig. 6-5).
Clinical Evaluation of Oxygen Consumption
To calculate oxygen consumption the cardiac output and arterial and mixed venous oxygen saturations must be known. Oxygen consumption is the product of the cardiac output and the difference between arterial and venous oxygen content (Box 8-8). A true mixed-venous oxygen content is determined from a sample of pulmonary artery blood rather than from a central venous or right atrial sample. Normal arteriovenous oxygen content difference is approximately 3 to 5 mL/dL; this is approximately 25% of the total 18 to 20 mL O2/dL arterial oxygen content.

Because oxygen consumption is maintained at a fairly constant level over a broad range of clinical conditions, cardiac output is usually inversely proportional to the arteriovenous oxygen difference. When cardiac output is high, little oxygen is extracted from the tissues and the arteriovenous O2 difference is small. If cardiac output falls a large amount of oxygen must be extracted from each milliliter of blood, so the arteriovenous O2 difference widens. Frequently the arteriovenous O2 difference is evaluated on a regular basis to evaluate trends in cardiac output. However, conditions such as sepsis or malignant hyperthermia can alter this relationship (refer to Shock in Common Clinical Conditions in this chapter and Mixed Venous Oxygen Saturation in Chapter 8).
Oxygen consumption also can be estimated from normative data. Oxygen consumption in normal children averages 5 to 8 mL/kg per minute, or 150 to 160 mL/min per m2 of body surface area. Oxygen consumption in normal infants less than 2 to 3 weeks of age is approximately 120 to 130 mL/min per m2 body surface area.752
Autonomic nervous system
Sympathetic Nervous System
Adrenergic Receptors
Neurotransmitters and exogenous (administered) catecholamines stimulate the effector organs by binding with receptors. Adrenergic receptors are glycoproteins associated with cell membranes. They have high specificity and binding affinity for specific catecholamines.968 Activation of the adrenergic receptor alters intracellular function. Effects of adrenergic receptor activation will be determined by both the type of receptor activated and by the density of receptors on the cell surface. Adrenergic receptors generally are divided into alpha, beta, and dopaminergic (DA) types.
Dopaminergic Receptors
Dopamine also produces noncardiovascular effects. Administration of exogenous dopamine results in decreased aldosterone secretion, inhibition of thyroid stimulating hormone, and reduction in insulin secretion.968 These effects must be considered when dopamine is administered to critically ill patients.
Modulation of Adrenergic Receptor Activation
The density of adrenergic receptors on the cell surface is not static; it is affected by a variety of disease states and conditions. Downregulation of a receptor means that there is a decrease in the number of that type of receptor on the cell surface. For example, downregulation of beta-adrenergic myocardial receptors occurs with chronic severe congestive heart failure, myocardial ischemia, and hypothyroidism. Alpha-adrenergic receptors are downregulated when sepsis is present.969 When a beta- or alpha-receptor is down-regulated the cell will be less capable of responding to, respectively, beta- or alpha-adrenergic stimulation from endogenous or exogenous catecholamines.
Common clinical conditions
Congestive heart failure
Etiology
Congenital heart defects that most commonly cause congestive heart failure during the newborn period include severe left ventricular outflow tract obstruction (such as hypoplastic left heart, interrupted aortic arch, critical aortic stenosis, or coarctation of the aorta), large arteriovenous fistula, or combined shunt lesions (such as a ventricular septal defect and patent ductus arteriosus). A large patent ductus arteriosus will produce heart failure in the extremely premature neonate. Isolated septal defects (such as a ventricular septal defect) usually do not produce signs of congestive heart failure until pulmonary vascular resistance falls at approximately 2 to 9 weeks of age,597 and hemoglobin concentration falls.214a
Low output congestive heart failure typically is seen in children with severe left heart or aortic obstruction (such as critical aortic stenosis or hypoplastic left heart), cardiomyopathy, or tachyarrhythmias.841 These children demonstrate signs of decreased left ventricular function and poor systemic perfusion. Low cardiac output also may be present in children with severe congestive heart failure and an extremely large left-to-right shunt. The increased work of breathing in children with congestive heart failure (CHF) results in increased blood flow to respiratory muscles, which effectively “steals” systemic blood flow and may contribute to low cardiac output.
Low output congestive heart failure also may be seen in children with elevated pulmonary artery pressures following a Fontan-type correction of tricuspid atresia, hypoplastic left heart, or other single ventricle lesions (see section, Specific Diseases, Single Functioning Ventricle). In these patients, systemic venous return is routed directly into the pulmonary arteries, flowing passively through the lungs to return to the systemic ventricle to be circulated to the body. High pulmonary or systemic venous pressure may be present for days (or longer) following performance of a Fontan-type procedure. In these patients, low cardiac output is exacerbated by mechanical ventilation with high levels of positive end-expiratory pressure (PEEP) or increased pulmonary vascular resistance.935
Pathophysiology
Biochemical Alterations
Many primary and secondary genetic and biochemical abnormalities have been described in association with impaired ventricular contractility.261 In many cases, the final common pathway results in impaired binding or release of calcium or impaired calcium entry into the sarcolemma. These changes lead to abnormalities of excitation-contraction coupling.438,841 If oxygen demand increases in the presence of limited myocardial oxygen delivery (particularly in children with aortic stenosis, tachyarrhythmias, or other causes of limited myocardial perfusion, or those with hyperthermia), myocardial perfusion and performance may be inadequate to maintain effective systemic oxygen and substrate delivery. Extreme core hyperthermia may increase oxygen demand significantly. Chronic, severe congestive heart failure also may result in down-regulation (decreased density) of beta-adrenergic receptors.969 All of these factors may further compromise myocardial function.
Some patients with congestive heart failure develop enhanced calcium influx, prolonged calcium binding, and impaired calcium uptake. When this occurs, the myocardium generates tension effectively but relaxation is impaired. Impaired relaxation, in turn, compromises diastolic filling, and stroke volume falls.438
Ventricular Dilation and Hypertrophy
When myocardial dysfunction is present, compensatory ventricular hypertrophy and dilation may enable maintenance of effective systemic perfusion. Ventricular hypertrophy distributes the ventricular load among an increased number of sarcomeres.438 Ventricular dilation increases ventricular end-diastolic volume and so may improve stroke volume by stretching ventricular fibers, according to the Frank-Starling law of the heart (see section, Essential Anatomy and Physiology).
Afterload is the impedance to ventricular ejection, which can be evaluated by calculating ventricular wall stress. This is accomplished by dividing the product of ventricular pressure and ventricular cavity diameter by twice the ventricular wall thickness (see Box 8-3 and Chapter 6). Uncompensated increases in ventricular cavity diameter (dilation) increase ventricular wall stress and myocardial oxygen consumption, reducing myocardial efficiency.841
Sympathetic Nervous System Compensation and Redistribution of Blood Volume
When cardiac output becomes insufficient to meet metabolic demands, sympathetic nervous system “fight or flight” compensatory mechanisms are activated. These neural and humeral control mechanisms are designed to improve cardiac output and redistribute blood volume, so that oxygen delivery is maintained to the heart and brain.543
Compensatory redistribution of blood flow is complicated by the increased work of breathing for the child with congestive heart failure. Under normal conditions, respiratory muscles require a very small portion of cardiac output and oxygen consumption. When congestive heart failure is present, however, the work of breathing increases significantly,935 and a significant portion of cardiac output may be redistributed to respiratory muscles (see section, Altered Nutrition and Potential Gastrointestinal Complications).
Renal and Humeral Factors Affecting Blood Volume and Distribution
When renal blood flow is reduced, the renin-angiotensin-aldosterone mechanism is activated, producing renal sodium and water retention. The resulting increase in circulating blood volume should improve systemic venous return and cardiac output, and maximize ventricular function by increasing ventricular end-diastolic volume. Renin release also catalyzes the production of angiotensin I, which is converted to angiotensin II, a potent vasoconstrictor. Angiotensin II crosses the blood-brain barrier and affects the medullary cardiovascular center, stimulating release of further vasoactive substances and affecting blood pressure and volume.101 Angiotensin II also mediates ventricular hypertrophy, through stimulation of the protein kinase C pathway in cardiac myocytes.906
Increased myocardial wall stretch results in release of a family of natriuretic factors—atrial natriuretic peptide (ANP), brain natriuretic peptide (BNP), C-type natriuretic peptide, and dendroaspis natriuretic peptide (DNP). These polypeptides stimulate natriuresis (sodium excretion), diuresis, and vasodilation directly (for additional information, see Evolve Fig. 8-3 in the Chapter 8 Supplement on the Evolve Website); however, in children with congestive heart failure the natriuretic effects seem to be blunted. In addition, these natriuretic peptides interact with renin, aldosterone, and vasopressin to modulate blood volume and distribution.101
Clinical Signs and Symptoms
Clinical signs and symptoms of anemia-induced congestive heart failure include lethargy, weakness, and fatigue. The child is often pale, and a systolic flow murmur is often present. Signs of high cardiac output failure, including tachycardia (with a gallop), pulmonary edema, and hepatosplenomegaly, usually develop once the hematocrit falls below 15% and the hemoglobin concentration is less than 5 g/dL. Signs of shock may develop with acute severe blood loss. If signs of shock are absent, the anemia is probably chronic, and renal sodium and water retention have succeeded in maintaining the circulating blood volume (see Anemia in Chapter 15).
Classic clinical signs and symptoms associated with congestive heart failure result from adrenergic stimulation and redistribution of blood flow and from the effects of right or left ventricular dysfunction. In addition, some infants demonstrate nonspecific signs of respiratory distress and very poor systemic perfusion (Box 8-9). These signs may be used to classify the severity of the congestive heart failure (Table 8-6).