Chapter 14 Cardiovascular disease
Essential anatomy, physiology and embryology of the heart
The conduction system of the heart
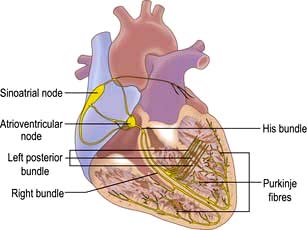
The sinus node
The sinus node is a complex spindle-shaped structure that lies in the lateral and epicardial aspects of the junction between the superior vena cava and the right atrium (Fig. 14.1). Physiologically, it generates impulses automatically by spontaneous depolarization of its membrane at a rate quicker than any other cardiac cell type. It is therefore the natural pacemaker of the heart.
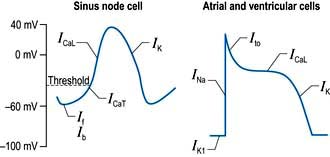
A number of factors are responsible for the spontaneous decay of the sinus node cell membrane potential (‘the pacemaker potential’), the most significant of which is a small influx of sodium ions into the cells. This small sodium current has two components: the background inward current (Ib) and the ‘funny’ (If) current (or pacemaker current) (Fig. 14.2). The term ‘funny’ current denotes ionic flow through channels activated in hyperpolarized cells (−60 mV or greater), unlike other time- and voltage-dependent channels activated by depolarization. The rate of depolarization of the sinus node membrane potential is modulated by autonomic tone (i.e. sympathetic and parasympathetic input), stretch, temperature, hypoxia, blood pH and in response to other hormonal influences (e.g. tri-iodothyronine and serotonin).
Atrial and ventricular myocyte action potentials
Action potentials in the sinus node trigger depolarization of the atrial and subsequently the ventricular myocytes. These cells have a different action potential from that of sinus node cells (Fig. 14.2). Their resting membrane potential is a consequence of a small flow of potassium ions into the cells through open ‘inward rectifier’ channels (IKl); at this stage sodium and calcium channels are closed. The arrival of adjacent action potentials triggers the opening of voltage-gated, fast, self-inactivating sodium channels, resulting in a sharp depolarization spike. This is followed by a partial repolarization of the membrane due to activation of ‘transient outward’ potassium channels.
The plateau phase which follows is unique to myocytes and results from a small, but sustained inward calcium current through L-type calcium channels (ICaL) lasting 200–400 ms. This calcium influx is caused by a combined increase in permeability of the cell, especially the sarcolemmal membranes to calcium (Fig. 14.3). This plateau (or refractory) phase in myocyte action potential prevents early reactivation of the myocytes and directly determines the strength of contraction. The gradual inactivation of the calcium channels activates delayed rectifier potassium channels (IK) repolarizing the membrane. Atrial tissue is activated like a ‘forest fire’, but the activation peters out when the insulating layer between the atrium and the ventricle – the annulus fibrosus – is reached. Controversy exists about whether impulses from the sinoatrial (SA) node travel over specialized conducting ‘pathways’ or over ordinary atrial myocardium.
The cellular basis of myocardial contraction – excitation-contraction coupling
Each myocyte, approximately 100 µm long, branches and interdigitates with adjacent cells. An intercalated disc permits electrical conduction to adjacent cells. Myocytes contain bundles of parallel myofibrils. Each myofibril is made up of a series of sarcomeres (Fig. 14.4). A sarcomere (which is the basic unit of contraction) is bound by two transverse Z lines, to each of which is attached a perpendicular filament of the protein actin. The actin filaments from each of the two Z bands overlap with thicker parallel protein filaments known as myosin. Actin and myosin filaments are attached to each other by cross-bridges that contain ATPase, which breaks down adenosine triphosphate (ATP) to provide the energy for contraction.
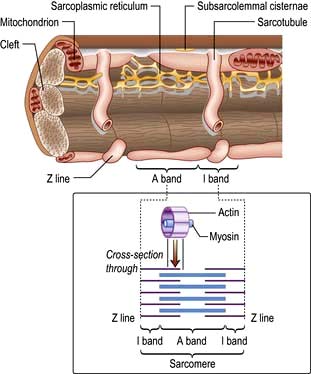
Calcium is made available during the plateau phase of the action potential by calcium ions entering the cell and by being mobilized from the sarcoplasmic reticulum through the ryanodine receptor (RyR2) calcium-release channel. RyR2 activity is regulated by the protein calstabin 2 (see p. 770) and nitric oxide. The force of cardiac muscle contraction (‘inotropic state’) is thus regulated by the influx of calcium ions into the cell through calcium channels (Fig. 14.3). T (transient) calcium channels open when the muscle is more depolarized, whereas L (long-lasting) calcium channels require less depolarization. The extent to which the sarcomere can shorten determines the stroke volume of the ventricle. It is maximally shortened in response to powerful inotropic drugs or severe exercise.
Starling’s law of the heart
The contractile function of an isolated strip of cardiac tissue can be described by the relationship between the velocity of muscle contraction, the load that is moved by the contracting muscle, and the extent to which the muscle is stretched before contracting. As with all other types of muscle, the velocity of contraction of myocardial tissue is reduced by increasing the load against which the tissue must contract. However, in the non-failing heart, pre-stretching of cardiac muscle improves the relationship between the force and velocity of contraction (Fig. 14.5).
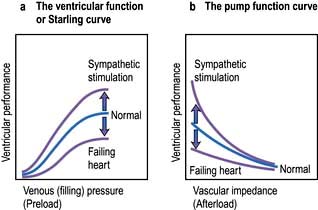
This phenomenon was described in the intact heart as an increase of stroke volume (ventricular performance) with an enlargement of the diastolic volume (preload), and is known as ‘Starling’s law of the heart’ or the ‘Frank–Starling relationship’. It has been transcribed into more clinically relevant indices. Thus, stroke work (aortic pressure × stroke volume) is increased as ventricular end-diastolic volume is raised. Alternatively, within certain limits, cardiac output rises as pulmonary capillary wedge pressure increases. This clinical relationship is described by the ventricular function curve (Fig. 14.5), which also shows the effect of sympathetic stimulation.
Nerve supply of the myocardium
Adrenergic stimulation and cellular signalling
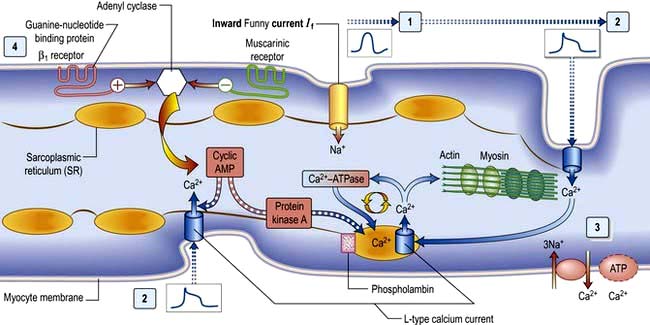
β1-Adrenergic stimulation enhances Ca2+ flux in the myocyte and thereby strengthens the force of contraction (Fig. 14.3). Binding of catecholamines, e.g. norepinephrine (noradrenaline), to the myocyte β1-adrenergic receptor stimulates membrane-bound adenylate kinases. These enzymes enhance production of cyclic adenosine monophosphate (cAMP) that activates intracellular protein kinases, which in turn phosphorylate cellular proteins, including L-type calcium channels within the cell membrane. β1-Adrenergic stimulation of the myocyte also enhances myocyte relaxation.
The return of calcium from the cytosol to the sarcoplasmic reticulum (SR) is regulated by phospholamban (PL), a low-molecular-weight protein in the SR membrane. In its dephosphorylated state, PL inhibits Ca2+ uptake by the SR ATPase pump (Fig. 14.3). However, β1-adrenergic activation of protein kinase phosphorylates PL, and blunts its inhibitory effect. The subsequently greater uptake of Ca2+ ions by the SR hastens Ca2+ removal from the cytosol and promotes myocyte relaxation.
The cardiac cycle
The cardiac cycle (Fig. 14.6) consists of precisely timed rhythmic electrical and mechanical events that propel blood into the systemic and pulmonary circulations. The first event in the cardiac cycle is atrial depolarization (a P wave on the surface ECG) followed by right atrial and then left atrial contraction. Ventricular activation (the QRS complex on the ECG) follows after a short interval (the PR interval). Left ventricular contraction starts and shortly thereafter right ventricular contraction begins. The increased ventricular pressures exceed the atrial pressures, and close first the mitral and then the tricuspid valves.
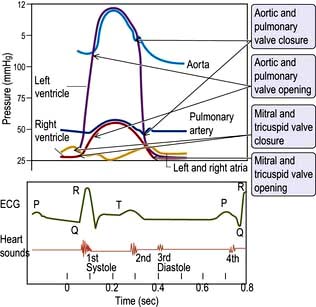
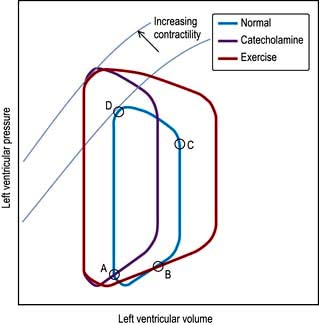
Until the aortic and pulmonary valves open, the ventricles contract with no change of volume (isovolumetric contraction). When ventricular pressures rise above the aortic and pulmonary artery pressures, the pulmonary valve and then the aortic valve open and ventricular ejection occurs. As the ventricles begin to relax, their pressures fall below the aortic and pulmonary arterial pressures, and aortic valve closure is followed by pulmonary valve closure. Isovolumetric relaxation then occurs. After the ventricular pressures have fallen below the right atrial and left atrial pressures, the tricuspid and mitral valves open. The cardiac cycle can be graphically depicted as the relationship between the pressure and volume of the ventricle. This is shown in Figure 14.7, which illustrates the changing pressure-volume relationships in response to increased contractility and to exercise.
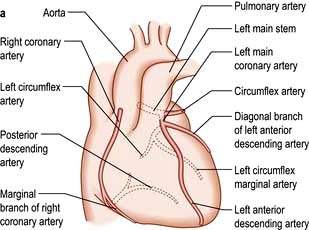
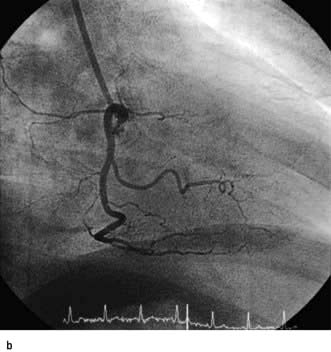
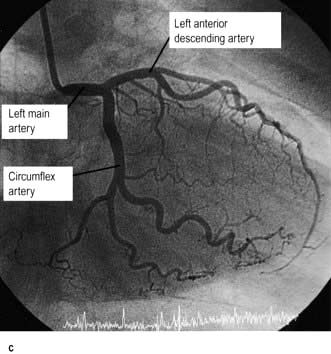
The coronary circulation
The coronary arterial system (Fig. 14.8) consists of the right and left coronary arteries. These arteries branch from the aorta, arising immediately above two cusps of the aortic valve. These arteries are unique in that they fill during diastole, when not occluded by valve cusps and when not squeezed by myocardial contraction. The right coronary artery arises from the right coronary sinus and courses through the right side of the AV groove, giving off vessels that supply the right atrium and the right ventricle. The vessel usually continues as the posterior descending coronary artery, which runs in the posterior interventricular groove and supplies the posterior part of the interventricular septum and the posterior left ventricular wall.
Blood vessel control and functions of the vascular endothelium


Vasomotor control
Nitric oxide is a diffusible gas with a very short half-life, produced in endothelial cells from the amino acid L-arginine via the action of the enzyme NO synthase (NOS), which is controlled by cytoplasmic calcium/calmodulin (Fig. 14.9). It is produced in response to various stimuli (Table 14.1), triggering vascular smooth muscle relaxation through activation of guanylate cyclase, leading to an increase in the intracellular levels of cyclic 3,5-guanine monophosphate (cGMP). Its cardiovascular effects protect against atherosclerosis, high blood pressure, heart failure and thrombosis. NO is also the neurotransmitter in various ‘nitrergic’ nerves in the central and peripheral nervous systems and may play a role in the central regulation of vascular tone. The class of drugs used to treat erectile dysfunction, the phosphodiesterase (PDE5) inhibitors, prevent the breakdown of cGMP and promote vasodilatation.
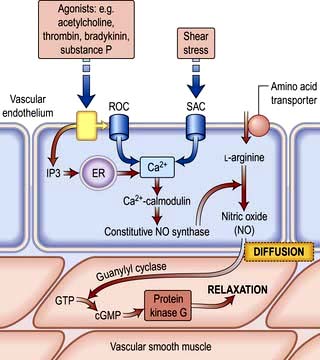
Table 14.1 Some of the products and functions of the vascular endothelium
| Endothelial product | Function(s) | Stimulus |
|---|---|---|
|
Nitric oxide |
Prostacyclin (PGI2)
Prostanoids
Endothelin
Endothelial-derived hyperpolarizing factor
Angiotensin-converting enzyme
von Willebrand factor
Adhesion molecules
P, L, E selectins
ICAM, VCAM, PECAM
Vascular endothelial growth factor (VEGF)
ICAM, intracellular adhesion molecule; VCAM, vascular cell adhesion molecule, PECAM, platelet/endothelial cell adhesion molecule; TNF, tumour necrosis factor; IL, interleukin.
PGI2 is synergistic to NO and also plays a role in the local regulation of vasomotor tone.
Angiotensin-converting enzyme located on the endothelial cell membrane converts circulating angiotensin I (synthesized by the action of renin on angiotensinogen) to angiotensin II which has vasoconstrictor properties and leads to aldosterone release (Fig. 12.5). Aldosterone promotes sodium absorption from the kidney and together with the angiotensin-induced vasoconstriction provides haemodynamic stability.
Anti- and pro-thrombotic mechanisms
In addition to their ability to prevent clotting, endothelial cells also aid thrombosis. They are responsible for the production of von Willebrand factor through a unique organelle called the Weibel–Palade body, which not only acts as a carrier for factor VIII but also promotes platelet adhesion by binding to exposed collagen (p. 414).
Modulation of immune responses
In response to various inflammatory mediators, the vascular endothelium expresses various so-called ‘adhesion molecules’ which promote leucocyte attraction, adhesion and infiltration into the blood vessel wall (Chapter 3).
Symptoms of heart disease
The following symptoms occur with heart disease:


The severity of cardiac symptoms or fatigue is classified according to the New York Heart Association (NYHA) grading of cardiac status (see Table 14.19). The differential diagnosis of chest pain is given in Table 14.2.
| Central | Lateral/peripheral |
|---|---|
|
Cardiac |
Pulmonary |
|
Ischaemic heart disease (infarction or angina) |
Infarction |
|
Coronary artery spasm |
Pneumonia |
|
Pericarditis/myocarditis |
Pneumothorax |
|
Mitral valve prolapse |
Lung cancer |
|
Aortic aneurysm/dissection |
Mesothelioma |
|
Non-cardiac |
Non-pulmonary |
|
Pulmonary embolism |
Bornholm disease (epidemic myalgia) |
|
Oesophageal disease (see Box 6.3) |
Herpes zoster |
|
Mediastinitis |
Trauma (ribs/muscular) |
|
Costochondritis (Tietze disease) |
|
|
Trauma (soft tissue, rib) |
|
Central chest pain
 Retrosternal heavy or gripping sensation with radiation to the left arm or neck that is provoked by exertion and eased with rest or nitrates – angina (p. 729)
 Similar pain at rest – acute coronary syndrome (p. 734)
 Severe tearing chest pain radiating through to the back – aortic dissection (p. 787)
 Sharp central chest pain that is worse with movement or respiration but relieved with sitting forward – pericarditis pain (p. 774)
 Sharp stabbing left submammary pain associated with anxiety – Da Costa’s syndrome.
Dyspnoea
Central sleep apnoea syndrome (CSAS). If hypopnoea occurs rather than apnoea, the phenomenon is termed ‘periodic breathing’, but the two variations are known together as CSAS. This occurs due to malfunctioning of the respiratory centre in the brain, caused by poor cardiac output with concurrent cerebrovascular disease. The symptoms of CSAS, such as daytime somnolence and fatigue, are similar to those of obstructive sleep apnoea syndrome (OSAS, p. 818) and there is considerable overlap with the symptoms of heart failure. CSAS is believed to lead to myocardial hypertrophy and fibrosis, deterioration in cardiac function and complex arrhythmias, including non-sustained ventricular tachycardia, hypertension and stroke. Patients with CSAS have a worse prognosis compared to similar patients without CSAS.
Palpitations
 Premature beats (ectopics) are felt by the patient as a pause followed by a forceful beat. This is because premature beats are usually followed by a pause before the next normal beat, as the heart resets itself. The next beat is more forceful as the heart has had a longer diastolic period and therefore is filled with more blood before this beat.
 Paroxysmal tachycardias (see p. 698) are felt as a sudden racing heart beat.
 Bradycardias (p. 702) may be appreciated as slow, regular, heavy or forceful beats. Most often, however, they are simply not sensed. All palpitations can be graded by the NYHA cardiac status (see Table 14.19).
Syncope
Syncope is a transient loss of consciousness due to inadequate cerebral blood flow. The cardiovascular causes are listed in Table 14.3.
|
|
 A vasovagal attack is a simple faint and is the most common cause of syncope. The mechanism begins with peripheral vasodilatation and venous pooling of blood, leading to a reduction in the amount of blood returned to the heart. The near-empty heart responds by contracting vigorously, which in turn stimulates mechanoreceptors (stretch receptors) in the inferoposterior wall of the left ventricle. These in turn trigger reflexes via the central nervous system, which act to reduce ventricular stretch (i.e. further vasodilatation and sometimes profound bradycardia), but this causes a drop in blood pressure and therefore syncope. These episodes are usually associated with a prodrome of dizziness, nausea, sweating, tinnitus, yawning and a sinking feeling. Recovery occurs within a few seconds, especially if the patient lies down.


 Micturition syncope refers to loss of consciousness whilst passing urine.

Obstructive. The obstructive cardiac causes listed in Table 14.3 all lead to syncope due to restriction of blood flow from the heart into the rest of the circulation, or between the different chambers of the heart.
Arrhythmias. Stokes–Adams attacks (p. 700) are a sudden loss of consciousness unrelated to posture and due to intermittent high-grade AV block, profound bradycardia or ventricular standstill. The patient falls to the ground without warning, is pale and deeply unconscious. The pulse is usually very slow or absent. After a few seconds the patient flushes brightly and recovers consciousness as the pulse quickens. Often there are no sequelae, but patients may injure themselves during falls. Occasionally a generalized convulsion may occur if the period of cerebral hypoxia is prolonged, leading to a misdiagnosis of epilepsy.
FURTHER READING
Moya A, Sutton R, Ammirati F et al. Task Force for the Diagnosis and Management of Syncope; European Society of Cardiology (ESC); European Heart Rhythm Association (EHRA); Heart Failure Association (HFA); Heart Rhythm Society (HRS). Guidelines for the diagnosis and management of syncope (version 2009). Eur Heart J 2009; 30(21):2631–2671.
Examination of the cardiovascular system
General examination
 Clubbing (p. 799) is seen in congenital cyanotic heart disease, particularly Fallot’s tetralogy and also in 10% of patients with subacute infective endocarditis.

 Cyanosis is a dusky blue discoloration of the skin (particularly at the extremities) or of the mucous membranes when the capillary oxygen saturation is less than 85%. Central cyanosis (p. 799) is seen with shunting of deoxygenated venous blood into the systemic circulation, as in the presence of a right-to-left heart shunt. Peripheral cyanosis is seen in the hands and feet, which are cold. It occurs in conditions associated with peripheral vasoconstriction and stasis of blood in the extremities leading to increased peripheral oxygen extraction. Such conditions include congestive heart failure, circulatory shock, exposure to cold temperatures and abnormalities of the peripheral circulation, e.g. Raynaud’s, p. 788.
The arterial pulse
Rhythm


Character of pulse
 Carotid pulsations are not normally apparent on inspection of the neck but may be visible (Corrigan’s sign) in conditions associated with a large-volume pulse, including high output states (such as thyrotoxicosis, anaemia or fever) and in aortic regurgitation.
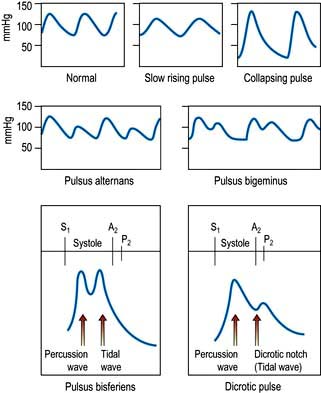
 A ‘collapsing’ or ‘water hammer’ pulse (Fig. 14.10) is a large-volume pulse characterized by a short duration with a brisk rise and fall. This is best appreciated by palpating the radial artery with the palmer aspect of four fingers while elevating the patient’s arm above the level of the heart. A collapsing pulse is characteristic of aortic valvular regurgitation or a persistent ductus arteriosus.

 A plateau pulse is small in volume and slow in rising to a peak due to aortic stenosis (Fig. 14.10).
 Alternating pulse (pulsus alternans). This is characterized by regular alternate beats that are weak and strong. It is a feature of severe myocardial failure and is due to the prolonged recovery time of damaged myocardium; it indicates a very poor prognosis. It is easily noticed when taking the blood pressure because the systolic pressure may vary from beat to beat by as much as 50 mmHg (Fig. 14.10).
 Bigeminal pulse (pulsus bigeminus). This is due to a premature ectopic beat following every sinus beat. The rhythm is not regular (Fig. 14.10) because every weak pulse is premature.
 Pulsus bisferiens (Fig. 14.10). This is a pulse that is found in hypertrophic cardiomyopathy and in mixed aortic valve disease (regurgitation combined with stenosis). The first systolic wave is the ‘percussion’ wave produced by the transmission of the left ventricular pressure in early systole. The second peak is the ‘tidal’ wave caused by recoil of the vascular bed. This normally happens in diastole (the dicrotic wave), but when the left ventricle empties slowly or is obstructed from emptying completely, the tidal wave occurs in late systole. The result is a palpable double pulse.
 Dicrotic pulse (Fig. 14.10) results from an accentuated dicrotic wave. It occurs in sepsis, hypovolaemic shock and after aortic valve replacement.

The blood pressure
The peak systemic arterial blood pressure is produced by transmission of left ventricular systolic pressure. Vascular tone and an intact aortic valve maintain the diastolic blood pressure. How to take the blood pressure is outlined in Practical Box 14.1.
 Practical Box 14.1
Taking the blood pressure
Use a properly calibrated machine.
1. The blood pressure is taken in the (right) arm with the patient relaxed and comfortable.
2. The sphygmomanometer cuff is wrapped around the upper arm with the inflation bag placed over the brachial artery.
3. The cuff is inflated until the pressure exceeds the arterial pressure – when the radial pulse is no longer palpable.
4. The diaphragm of the stethoscope is positioned over the brachial artery just below the cuff.
5. The cuff pressure is slowly reduced until sounds (Korotkoff sounds) can be heard (phase 1). This is the systolic pressure.
6. The pressure is allowed to fall further until the Korotkoff sounds become suddenly muffled (phase 4).
7. The pressure is allowed to fall still further until they disappear (phase 5).
Jugular venous pressure
 Practical Box 14.2


The jugular venous pressure wave
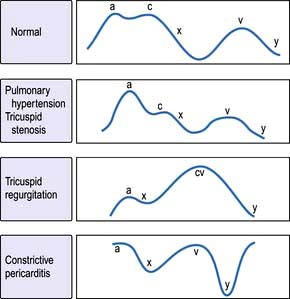
This consists of three peaks and two troughs (Fig. 14.11). The peaks are described as a, c and v waves and the troughs are known as x and y descents:


Examination of the precordium
 With the patient at 45°, the cardiac apex is located in the 5th intercostal space mid-clavicular line. Left ventricular dilatation will displace the apex downwards and laterally. It may be impalpable in patients with emphysema, obesity, pericardial or pleural effusions.
 A tapping apex is a palpable first sound and occurs in mitral stenosis.
 A vigorous apex may be present in diseases with volume overload, e.g. aortic regurgitation.

 A double pulsation may occur in hypertrophic cardiomyopathy.


Auscultation
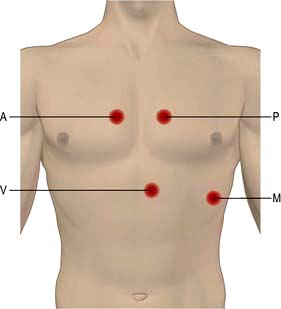
The bell of the stethoscope is used for low-pitched sounds (heart sounds and mid-diastolic murmur in mitral stenosis). The diaphragm is used for high-pitched sounds (systolic murmurs, aortic regurgitation, ejection clicks and opening snaps). The areas of auscultation are described in (Fig. 14.12). Left-sided valve murmurs may be more prominent in expiration and right-sided in inspiration. Mitral murmurs may be more audible with the patient reclining to the left.
Third and fourth heart sounds


Cardiac investigations
Chest X-ray
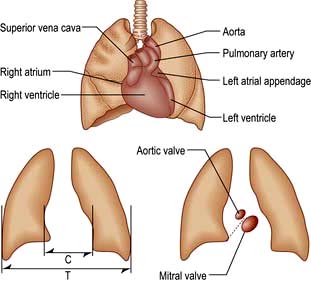
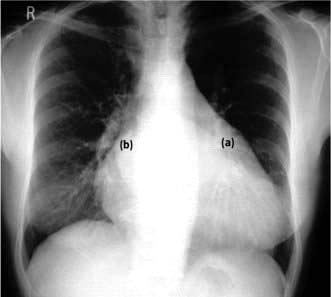
Ideally, this is taken in the postero-anterior (PA) direction at maximum inspiration with the heart close to the X-ray film to minimize magnification with respect to the thorax. A lateral may give additional information if the PA is abnormal. The cardiac structures and great vessels that can be seen on these X-rays are indicated in Figure 14.13. An antero-posterior (AP) view is only taken in an emergency.
Heart size
A pericardial effusion produces a globular heart (see Fig. 14.115, p. 775). This enlargement may occur quite suddenly and, unlike in heart failure, there is no associated change in the pulmonary vasculature. The echocardiogram is more specific (p. 776).
Certain patterns of specific chamber enlargement may be seen on the chest X-ray:
Left atrial dilatation. This results in prominence of the left atrial appendage and a straightening or convex bulging of the upper left heart border, a double atrial shadow to the right of the sternum, and splaying of the carina because a large left atrium elevates the left main bronchus (Fig. 14.14). On a lateral chest X-ray an enlarged left atrium bulges backwards, impinging on the oesophagus.
Lung fields
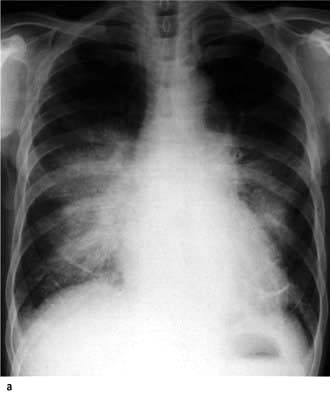
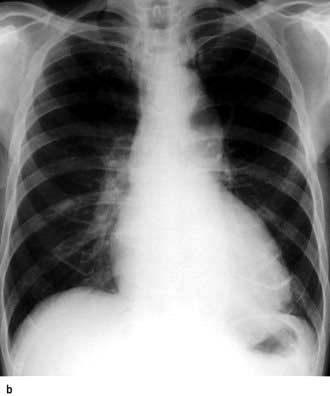
Alveolar oedema occurs when the pressure exceeds 30 mmHg, appearing as areas of consolidation and mottling of the lung fields (Fig. 14.15) and pleural effusions. Patients with long-standing elevation of the pulmonary capillary pressure have reactive thickening of the pulmonary arteriolar intima, which protects the alveoli from pulmonary oedema. Thus, in these patients the pulmonary venous pressure may increase to well above 30 mmHg before frank pulmonary oedema develops.
Electrocardiography
The electrocardiogram (ECG) is a recording of the electrical activity of the heart. It is the vector sum of the depolarization and repolarization potentials of all myocardial cells (see Fig. 14.2, p. 670). At the body surface these generate potential differences of about 1 mV, and the fluctuations of these potentials create the familiar P-QRS-T pattern. At rest the intracellular voltage of the myocardium is polarized at −90 mV compared with that of the extracellular space. This diastolic voltage difference occurs because of the high intracellular potassium concentration, which is maintained by the sodium potassium pump despite the free membrane permeability to potassium. Depolarization of cardiac cells occurs when there is a sudden increase in the permeability of the membrane to sodium. Sodium rushes into the cell and the negative resting voltage is lost (phase 0 in Fig. 14.37, p. 698). The depolarization of a myocardial cell causes the depolarization of adjacent cells and, in the healthy heart, the entire myocardium is depolarized in a coordinated fashion. During repolarization, cellular electrolyte balance is slowly restored (phases 1, 2 and 3). Slow diastolic depolarization (phase 4) follows until the threshold potential is reached. Another action potential then follows.
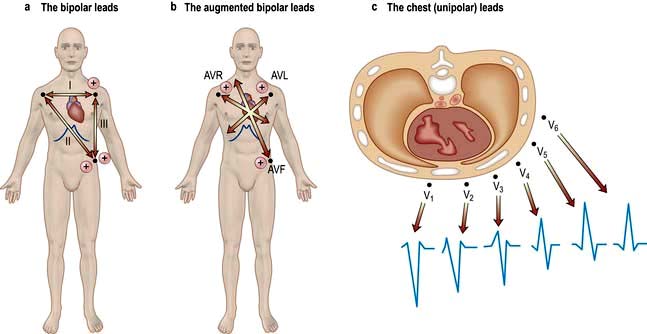
The ECG is recorded from two or more simultaneous points of skin contact (electrodes). When cardiac activation proceeds towards the positive contact, an upward deflection is produced on the ECG. Correct representation of a three-dimensional spatial vector requires recordings from three mutually perpendicular (orthogonal) axes. The shape of the human torso does not make this easy, so the practical ECG records 12 projections of the vector, called ‘leads’ (Fig. 14.16).
The ECG waveform
The shape of the normal ECG waveform (Fig. 14.17) has similarities, whatever the orientation. The first deflection is caused by atrial depolarization, and it is a low-amplitude slow deflection called a P wave. The QRS complex reflects ventricular activation or depolarization and is sharper and larger in amplitude than the P wave. An initial downward deflection is called the Q wave. An initial upward deflection is called an R wave. The S wave is the last part of ventricular activation. The T wave is another slow and low-amplitude deflection that results from ventricular repolarization.
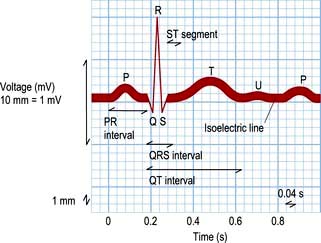
The QT interval extends from the start of the QRS complex to the end of the T wave. This interval represents the time taken to depolarize and repolarize the ventricular myocardium. The QT interval varies greatly with heart rate and is often represented as a corrected QT interval (or QTc) for a given heart rate. There are a number of formulae for derivation of QTc, but the most widely accepted are Bazett’s formula and Fridericia’s correction (Table 14.4).
|
P wave duration |
≤0.12 s |
|
PR interval |
0.12–0.22 s |
|
QRS complex duration |
≤0.10 s |
|
Corrected QT (QTc) |
≤0.44 s in males |
|
≤0.46 s in female |
|
|
QTcB = QT√2 (R – R) |
Bazett’s square root formula |
|
QTcF = QT√3 (R – R) |
Fridericia’s cube root formula |
An abnormally prolonged QTc can predispose to a risk of dangerous ventricular arrhythmias. Prolongation of QT interval may be congenital or can occur in many acquired conditions (see Table 14.12, p. 709).
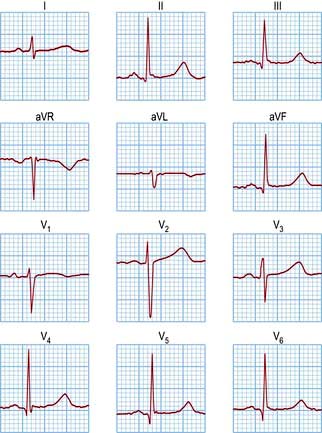
A normal 12-lead ECG is shown in Figure 14.18, and the normal values for the electrocardiographic intervals are indicated in Table 14.4. Leads that face the lateral wall of the left ventricle have predominantly positive deflections, and leads looking into the ventricular cavity are usually negative. Detailed patterns depend on the size, shape and rhythm of the heart and the characteristics of the torso.
Cardiac vectors
The mean QRS vector can be calculated from the six standard leads (Fig. 14.19):


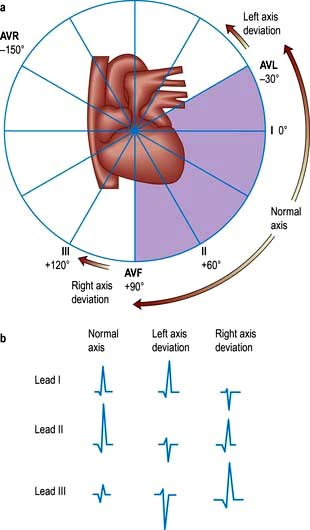
Calculation of this vector is useful in the diagnosis of some cardiac disorders.
Exercise electrocardiography
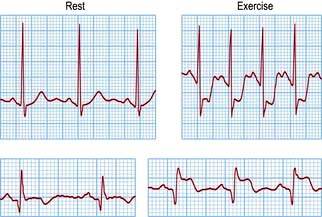
This is less used than previously (see p. 730) because of its low sensitivity. The ECG is recorded whilst the patient walks or runs on a motorized treadmill. The test is based upon the principle that exercise increases myocardial demand on coronary blood supply, which may be inadequate during exercise, and at peak stress can result in relative myocardial ischaemia. Most exercise tests are performed according to a standardized method, e.g. the Bruce protocol. Recording an ECG after exercise is not an adequate form of stress test. Normally there is little change in the T wave or ST segment during exercise.
Myocardial ischaemia provoked by exertion results in ST segment depression (>1 mm) in leads facing the affected area. The form of ST segment depression provoked by ischaemia is characteristic: it is either planar or shows down-sloping depression (Fig. 14.20). Up-sloping depression is a nonspecific finding. The degree of ST segment depression is positively correlated to the degree of myocardial ischaemia.
Frequent premature ventricular depolarizations during the test are associated with a long-term increase in the risk of death from cardiovascular causes and further testing is required in these patients. Use of the exercise test in angina is described on page 682.
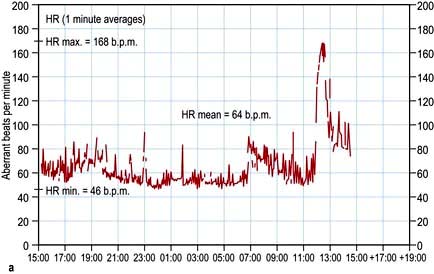
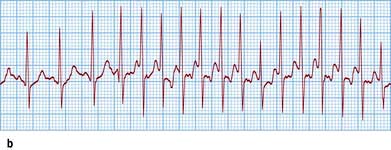
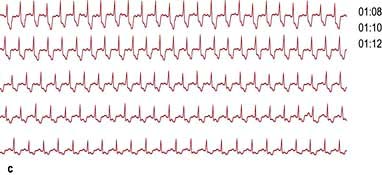
24-Hour ambulatory taped electrocardiography
This records transient changes such as a brief paroxysm of tachycardia, an occasional pause in the rhythm, or intermittent ST segment shifts (Fig. 14.21). A conventional 12-lead ECG is recorded in less than a minute and usually samples less than 20 complexes. In a 24-hour period, over 100 000 complexes are recorded. Such a large amount of data must be analysed by automatic or semi-automatic methods. This technique is called ‘Holter’ electrocardiography after its inventor.
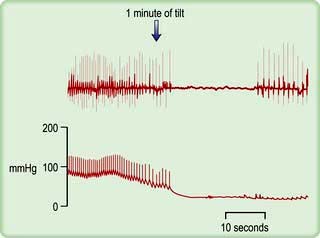
Tilt testing
Patients with suspected neurocardiogenic (vasovagal) syncope should be investigated by upright tilt testing. The patient is secured to a table which is tilted to +60° to the vertical for ≥45 minutes. The ECG and blood pressure are monitored throughout. If neither symptoms nor signs develop, isoprenaline may be slowly infused or glyceryl trinitrate inhaled and the tilt repeated. A positive test results in hypotension, sometimes bradycardia (Fig. 14.22) and pre-syncope/syncope, and supports the diagnosis of neurocardiogenic syncope. If symptoms and signs appear, placing the patient flat can quickly reverse them. The effect of treatment can be evaluated by repeating the tilt test, but it is not always reproducible. The overall sensitivity, specificity and reproducibility is low.
Carotid sinus massage
Carotid sinus massage (Practical Box 14.3) may lead to asystole (>3 s) and/or a fall of systolic blood pressure (>50 mmHg). This hypersensitive response occurs in many of the normal (especially elderly) population, but may also be responsible for loss of consciousness in some patients with carotid sinus syndrome (p. 676). In one-third of cases, carotid sinus massage is only positive when the patient is standing. Atherosclerosis can cause narrowing and stenosis of carotid arteries. Carotid sinus massage should thus be avoided in patients with carotid bruits.
 Practical Box 14.3
Carotid sinus massage
 Ensure there is no significant carotid artery disease (carotid bruits).
 Provide continuous electrocardiographic monitoring.
 Patient is in supine position with the head slightly extended.
 Start with right carotid sinus massage.

 Alternatively, steady pressure can be applied.
 If no response, massage left carotid sinus.


Echocardiography
Echocardiographic modalities
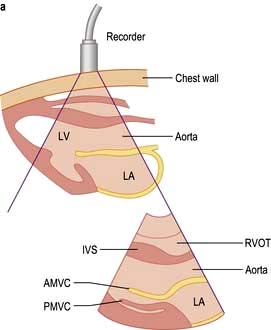
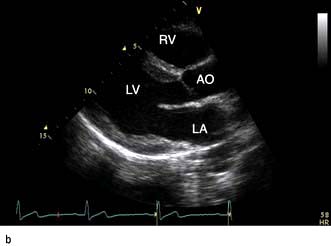
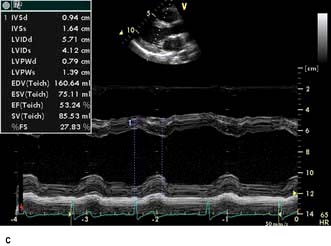
M mode and two-dimensional echocardiography
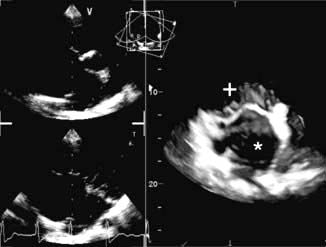
M-mode echocardiography is a technique that details the changing motion of structures along the ultrasound beam with time. Thus the motion of the interventricular septum during the cardiac cycle (either towards or away from the transducer placed on the chest wall) can be assessed and quantified. Stationary structures thus generate horizontal straight lines, the distances of which from the top of the screen indicate their depths, and movements, such as those of heart valves, are indicated by zigzag lines (Fig. 14.23c). Alternatively, a series of views from different positions can be obtained in the form of a two-dimensional image (cross-sectional 2-D echocardiography) (Fig. 14.23a,b). This method is useful for delineating anatomical structures and for quantifying volumes of cardiac chambers. M mode can be used to estimate LV systolic function by comparing end-diastolic and end-systolic dimensions. For example, the percentage reduction in the left ventricular cavity size (‘shortening fraction’ – SF) is given by:
Three-dimensional echocardiography
Three-dimensional echocardiography is a novel development in cardiac imaging in which a volumetric dataset is acquired using a multiplane probe rotating around a fixed axis. Clinical uses include accurate volumetric assessment of ventricular function and mass, assessment of mitral and aortic valve disease and assessment of adult congenital heart disease (Fig. 14.24).
Doppler echocardiography
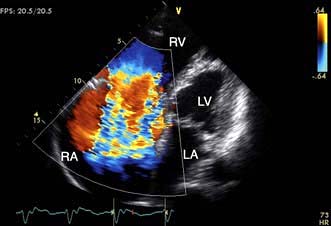
Colour flow Doppler. Doppler colour flow imaging uses one colour for blood flowing towards the transducer and another colour for blood flowing away. This technique allows the direction, velocity and timing of the flow to be measured with a simultaneous view of cardiac structure and function. Colour flow Doppler is used to help assess valvular regurgitation (Fig. 14.25) and may be useful in the assessment of coronary blood flow.
Wall motion stress echocardiography
Stress for this indication needs to be inotropic to induce true ischaemia. Physiological stress includes treadmill exercise, which is complicated by the difficulty in obtaining reliable images rapidly as the patient comes off the treadmill, before heart rate reduces back to sub-maximal levels. Alternatively, pharmacological stress can be induced with dobutamine at graded doses. This is relatively safe but complications such as ventricular arrhythmia have been reported. This technique can also be used to assess for viability of the myocardium and for hibernating or stunned myocardium (p. 721).
Contrast echo for LV opacification
FURTHER READING
Hung J, Lang R, Flachskampf F et al. 3D Echocardiography: a review of the current status and future directions. J Am Soc Echocardiogr 2007; 20:213–233.
Quinones MA, Otto CM, Stoddard M et al. Recommendations for quantification of Doppler echocardiography: a report from the Doppler Quantification Task Force of the Nomenclature and Standards Committee of the American Society of Echocardiography. J Am Soc Echocardiogr 2002; 15:167–184.
Nuclear imaging
Nuclear imaging is used to detect myocardial infarction or to measure myocardial function, perfusion or viability, depending on the radiopharmaceutical used and the technique of imaging. These data are particularly valuable when used in combination. All involve a significant radiation dose (p. 688).
Image type
Myocardial perfusion and viability
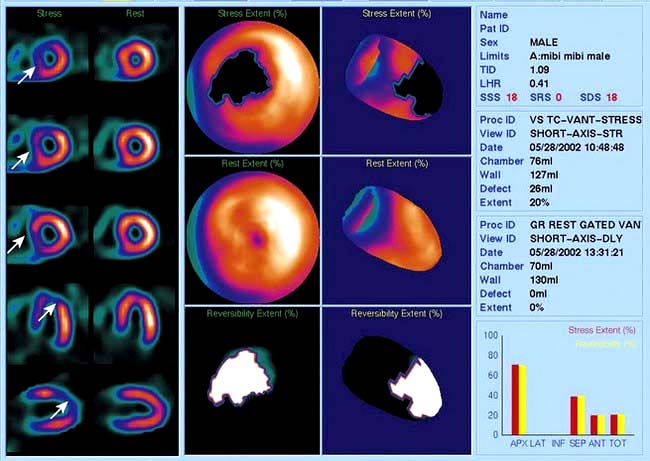
Thallium-201 is rapidly taken up by the myocardium, so an image taken immediately after injection reflects the distribution of blood flow to the myocardium. Areas of ischaemia or infarction receive less 201Tl and appear dark. Between 2 and 24 h after injection, 201Tl is redistributed so that all cardiac myocytes contain a comparable concentration. Images at this time show dark areas where the myocardium has infarcted, but normal density in ischaemic areas. Comparison of the early and late images is one method of predicting whether an ischaemic area of myocardium contains enough viable tissue to justify coronary bypass or angioplasty. Technetium-99-labelled tetrofosmin (Fig. 14.26) is also taken up rapidly by cardiac myocytes, but does not undergo redistribution. When this substance is injected during exercise, its distribution in the myocardium reflects the distribution of blood at the time of the exercise, even if the image is taken several hours later. This is a sensitive method of detecting myocardial viability. Images produced following injection of [99mTc]tetrofosmin during exercise can be compared to images produced following injection at rest to decide which areas of ischaemia are reversible (p. 721). In patients unable to exercise, the heart can be stressed with drugs, e.g. dipyridamole or dobutamine.
Cardiac computed tomography
Coronary artery calcification
Calcium is absent in normal coronary arteries but is present in atherosclerosis and increases with age. Studies have demonstrated a positive correlation between calcification and the presence of coronary artery stenoses, although the relationship is non-linear. Electron beam CT (EBT) and MDCT scanners are used to obtain multiple thin axial slices through the heart and then the calcium score is calculated. The calcium score is based on the X-ray attenuation coefficient or CT number measured in Hounsfield units. Meta-analyses have demonstrated that a higher calcium score is associated with higher event rate and higher relative risk ratios, although currently no study has shown a net effect on health outcomes of calcium scoring. The current NICE chest pain guidelines recommend the use of CT calcium scoring in patients with chest pain and a 10–29% likelihood of coronary artery disease (p. 730).
FURTHER READING
Budoff MJ, Ashenbach S, Blumenthal RS et al. Assessment of coronary artery disease by cardiac computed tomography: a scientific statement from the American Heart Association Committee on Cardiovascular Imaging and Intervention, Council on Cardiovascular Radiology and Intervention, and Committee on Cardiac Imaging, Council on Clinical Cardiology. Circulation 2006; 114:1761–1791.
Hundley WG, Bluemke DA, Finn JP et al.; American College of Cardiology Foundation Task Force on Expert Consensus Documents. ACCF/ACR/AHA/NASCI/SCMR 2010 expert consensus document on cardiovascular magnetic resonance: a report of the American College of Cardiology Foundation Task Force on Expert Consensus Documents. Circulation 2010; 121; 2462–2508.
CT coronary angiography
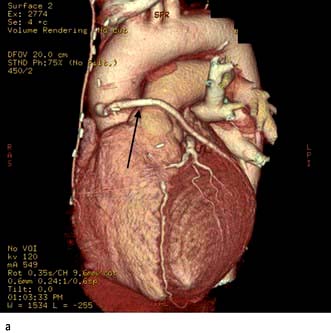
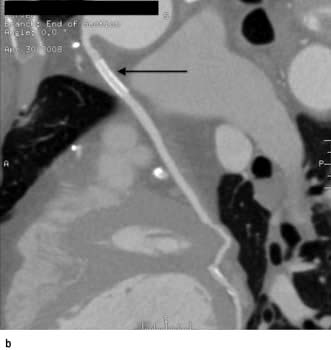
CT coronary angiography (CTCA) is performed with a supine patient connected to a 3-lead ECG for cardiac synchronization. The 64-slice MDCT scanners have a temporal resolution of 165–210 ms and image quality is optimal with a slow and steady heart rate (<65–70 b.p.m.), which can be obtained with the use of oral or intravenous beta-blockers. Sublingual nitroglycerin (0.4–0.8 mg dose) may improve visualization of the coronary artery lumen. A volume dataset containing the whole heart is acquired during a single breath-hold with the injection of 60–80 mL of iodinated contrast agent at 4–6 mL/s. The radiation dose during the scan is 11–22 mSv but this can be reduced to 7–11 mSv with ECG-controlled dose modulation; this compares with 2.5–5.0 mSv for diagnostic coronary angiography and 15–20 mSv for SPECT. The volume dataset is then analysed with multiplanar reformatting for the presence of coronary artery stenoses (Fig. 14.27). Recent studies have reported high sensitivity (>85%) and specificity (>90%) for the detection of coronary artery disease with a very high negative predictive value (>95%). CTCA may become part of an acute chest pain service in the emergency medicine department to exclude aortic dissection, pulmonary embolism and coronary artery disease. However CT coronary angiography does expose the patient to ionizing radiation.
Cardiovascular magnetic resonance
Clinical use of CMR
The current indications for CMR are summarized in Table 14.5.
|
Indications |
Cardiomyopathies, pericardial disease and cardiac masses
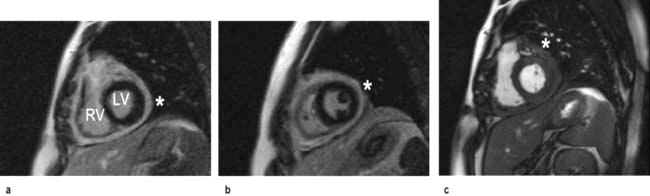
In hypertrophic cardiomyopathy CMR accurately defines the extent and distribution of myocardial hypertrophy and can be used in patients with sub-optimal echocardiograms. Intravenous gadolinium can be used to demonstrate regional myocardial fibrosis which is associated with an adverse prognosis. In patients with suspected arrhythmogenic right ventricular cardiomyopathy, CMR is the imaging investigation of choice to detect global and regional wall motion abnormalities of the right ventricle and right ventricular outflow tract, and to detect fatty or fibro-fatty infiltration of the right and left ventricles. In constrictive pericarditis and restrictive cardiomyopathy CMR can demonstrate the effects of the impaired ventricular filling common to both conditions (dilated right atrium and inferior vena cava), but can also determine the thickness of the pericardium (usually 4 mm in normal individuals) (Fig. 14.28). In patients with dilated cardiomyopathy CMR can accurately quantify bi-ventricular function and with gadolinium can demonstrate myocardial fibrosis. In inflammatory and infiltrative conditions of the myocardium, such as myocarditis, sarcoidosis and amyloidosis, CMR is increasingly used as a diagnostic investigation due to different patterns of signal enhancement seen with gadolinium. In patients with thalassaemia, CMR can detect iron deposition within the myocardium and guide chelation therapy. CMR can be useful in patients with cardiac masses to differentiate benign from malignant tumours and to identify thrombus not visualized on echocardiography.
Coronary artery disease
CMR can be used to assess coronary artery anatomy, left ventricular function, myocardial perfusion and viability in a ‘one-stop’ approach to the assessment of patients with coronary artery disease. Coronary artery anatomy and stenoses can be identified with ultra-fast breath-hold or respiratory-gated sequences with high accuracies. Global left ventricular function and wall motion abnormalities can be detected with ciné imaging performed at rest and during dobutamine stress. Myocardial perfusion can be assessed with gadolinium and first-pass imaging; ischaemia can be demonstrated with adenosine for coronary vasodilatation. Myocardial viability can be determined using gadolinium and ‘delayed enhancement’ images. With these techniques CMR is increasingly used both for the assessment of ischaemia in patients with suspected coronary disease and to assess myocardial viability prior to revascularization in patients with impaired cardiac function (Figs 14.29, 14.30).

Cardiac catheterization
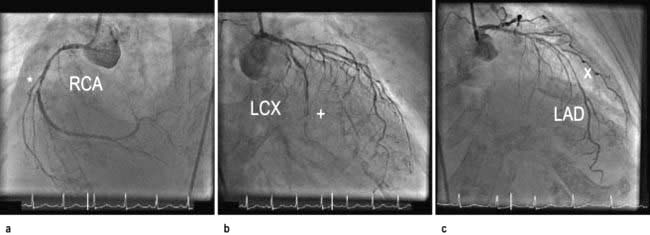
Cardiac catheterization is the introduction of a thin radio-opaque tube (catheter) into the circulation. The right heart is catheterized by introducing the catheter into a peripheral vein (usually the right femoral or internal jugular vein) and advancing it through the right atrium and ventricle into the pulmonary artery. The pressures in the right heart chambers, and pulmonary artery can be measured directly. An indirect measure of left atrial pressure can be obtained by ‘wedging’ a catheter into the distal pulmonary artery (p. 874). In this position the pressure from the right ventricle is obstructed by the catheter and only the pulmonary venous and left atrial pressures are recorded. Left heart catheterization is usually performed via the right femoral or radial artery. A pigtail catheter is advanced up the aorta and manipulated through the aortic valve into the left ventricle. Pressure tracings are taken from the left ventricular cavity. The end-diastolic pressure is invariably elevated in patients with left ventricular dysfunction. A power injection of radio-opaque contrast material is used to opacify the left ventricular cavity (left ventriculography) and thereby assesses left ventricular systolic function. The catheter is then withdrawn across the aortic valve into the aorta and the ‘pullback’ gradient across the valve is measured. Aortography (a power injection into the aortic root) can be performed to assess the aortic root and the presence and severity of aortic regurgitation. Specially designed catheters are then used to selectively engage the left and right coronary arteries, and contrast ciné-angiograms are taken in order to define the coronary circulation and identify the presence and severity of any coronary artery disease. During the procedure intracoronary nitrate or adenosine may be used to dilate the coronary arteries. During cardiac catheterization, blood samples may be withdrawn to measure the oxygen content. These estimations are used to quantify intracardiac shunts and measure cardiac output.
Therapeutic procedures
Cardiac resuscitation
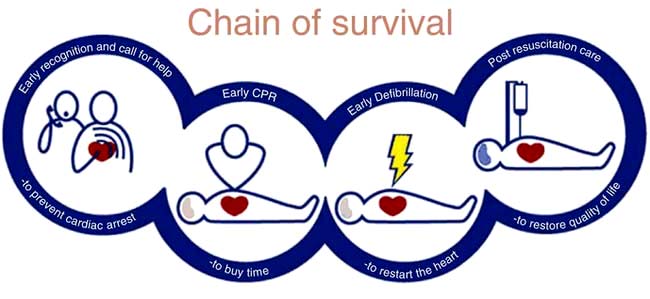
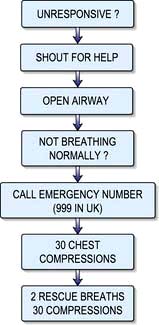
When cardiac arrest occurs, basic life support must be started immediately. The longer the period of respiratory and circulatory arrest, the lower is the chance of restoring healthy life. The chain of survival (Fig. 14.31) includes early recognition of cardiac arrest; early activation of emergency services; early cardiopulmonary resuscitation (CPR); early defibrillation and early advanced life support; and high quality post resuscitation care.
Basic life support (BLS)
The first step is to ensure the safety of the victim and rescuer. The next is to ascertain that the victim is unresponsive by shaking him/her and shouting into one ear. If no response is obtained, help should be sought immediately prior to commencement of basic life support. If the victim has absent or abnormal breathing then cardiac arrest is confirmed and basic life support should be started (Emergency Box 14.1).
 Emergency Box 14.1
Adult basic life support (out of hospital)
With permission from Resuscitation Council UK; http://www.resus.org.uk.
Circulation


Advanced cardiac life support
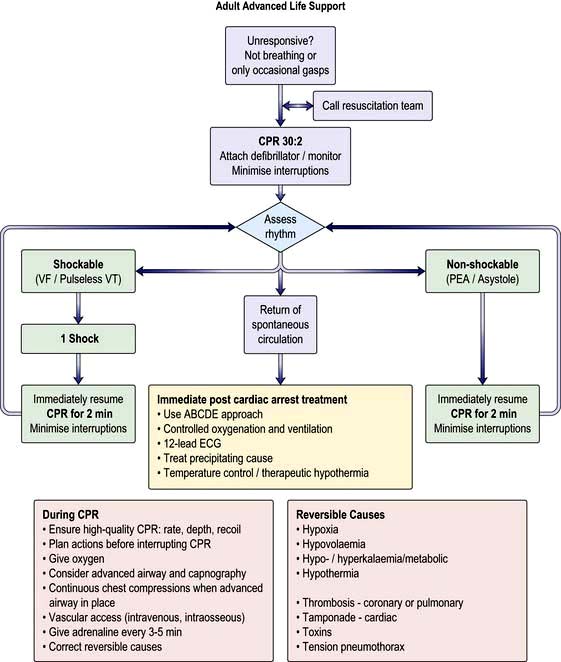
By the time effective life support has been established, more help should have arrived and advanced cardiac life support can begin. This consists of ECG monitoring, advanced airway management (endotracheal intubation or supraglottic airway tube) and setting up an intravenous infusion in a large peripheral or central vein (an intraosseous needle may be used if i.v. access is not possible). As soon as possible the cardiac rhythm should be established as this determines which pathway of the European Resuscitation Council and the Resuscitation Council UK ACLS Algorithm is followed (Fig. 14.32). This can be determined with an automated external defibrillator (AED), or the paddles or limb leads of a standard defibrillator.
(Reproduced with permission from the Resuscitation Council: http://www.resus.org.uk/pages/alsalgo.pdf)
 Hypoxia should be minimized by ventilating the patient with oxygen and a bag-valve mask or advanced airway (endotracheal intubation or supraglottic airway tube) insuring that there is bilateral air entry and chest expansion. With an advanced airway CPR should continue with a ventilation rate of 10/minute without interrupting cardiac massage.


 Tamponade should be excluded with echocardiography and if present treated with pericardiocentesis.


Causes of unexpected cardiac arrest
Each year in the UK, there are approximately 100 000 unexpected deaths occurring within 24 hours of the development of cardiac symptoms. About half of these deaths are almost instantaneous. There are several causes (Table 14.6).
There are two mechanisms of sudden unexpected cardiac arrest:
 Ventricular fibrillation or pulseless ventricular tachycardia (VF/VT)
 Non-VF/VT (asystole and pulseless electrical activity also known as electromechanical dissociation).
The principal difference in the management of these two groups of arrhythmias is the need for attempted defibrillation in those patients with VF/VT (Fig. 14.32).
Arrests are treated in the following ways:
 Ventricular fibrillation or pulseless ventricular tachycardia is readily treated with IMMEDIATE defibrillation, cardiopulmonary resuscitation (CPR) and drugs. Intravenous amiodarone is the first-line drug in refractory VF/pulseless VT. When treating VF/VT cardiac arrest, adrenaline 1 mg is given after the third shock and then every 3–5 min. Amiodarone 300 mg is also given after the third shock, particularly if VT/VF have recurred after defibrillation.

 Pulseless electrical activity: several potentially reversible causes are listed in the universal algorithm (Fig. 14.32). It carries a very poor prognosis. Effective treatment involves continued CPR and addressing the underlying cause.
Defibrillation


DC cardioversion (DCC)
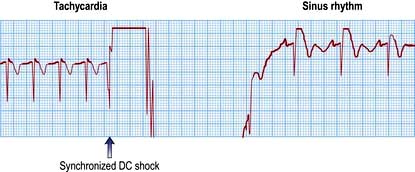
When the arrhythmia has definite QRS complexes, the delivery of the shock should be timed to occur with the downstroke of the QRS complex (synchronization) (Fig. 14.33). The machine being used to perform the cardioversion will do this automatically if the appropriate button is pressed. There is a crucial difference between defibrillation and cardioversion: a non-synchronized shock is used to defibrillate. Accidental defibrillation of a patient who does not require it may itself precipitate ventricular fibrillation.


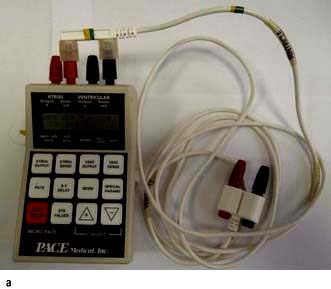
Temporary pacing
Transvenous pacing is the preferred method in patients with symptomatic bradycardias. In summary, a thin (French gauge 5 or 6), bipolar pacing electrode wire is inserted via an internal jugular vein, a femoral vein or a subclavian vein and is positioned at the right ventricular apex using cardiac fluoroscopy. The energy needed for successful pacing (the pacing threshold) is assessed by reducing the energy until the pacemaker fails to stimulate the tissue (loss of capture). The output energy is then set at three times the threshold value to prevent inadvertent loss of capture. If the threshold increases above 5 V, the pacemaker wire should be resited. A temporary pacemaker unit (Fig. 14.34a) is almost always set to work ‘on demand’ – to fire only when a spontaneous beat has not occurred. The rate of temporary pacing is usually 60–80/minute.
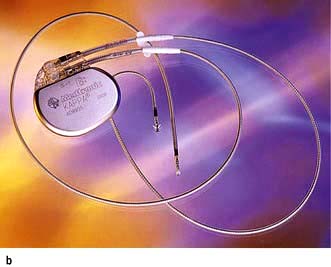
Permanent pacing
Permanent pacemakers are fully implanted in the body and connected to the heart by one or two electrode leads (Fig. 14.34b). The pacemaker is powered by solid-state lithium batteries, which usually last 5–10 years. Pacemakers are ‘programmable’ in that their operating characteristics (e.g. the pacing rate) can be changed by a programmer that transmits specific electromagnetic signals through the skin. The pacemaker leads are passed transvenously to the right heart chambers.
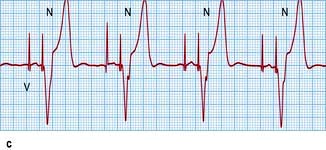
Pacemakers are designed to both pace and sense either the ventricles or the atria or more commonly both chambers. A single chamber ventricular pacemaker is described as a ‘VVI’ unit because it paces the ventricle (V), senses the ventricle (V) and is inhibited (I) by a spontaneous ventricular signal. Occasionally (e.g. in symptomatic sinus bradycardia), an atrial pacemaker (AAI) may be implanted. Pacemakers that are connected to both the right atrium and ventricle (‘dual chamber’ pacemakers) are used to simulate the natural pacemaker and activation sequence of the heart. This form of pacemaker is called DDD because it paces the two (dual) chambers, senses both (D) and reacts in two (D) ways – pacing in the same chamber is inhibited by spontaneous atrial and ventricular signals, and ventricular pacing is triggered by spontaneous atrial events (Fig. 14.34c).


Right-heart bedside catheterization
Bedside catheterization (Fig. 16.18) of the pulmonary artery with a pulmonary artery balloon flotation catheter (Swann–Ganz catheter) is performed in patients with:


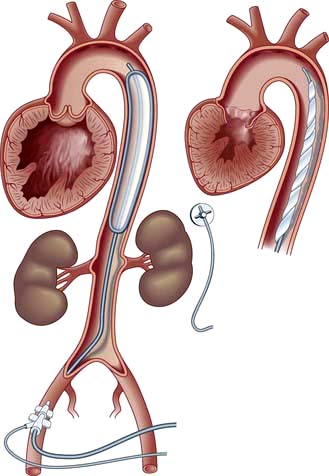
Intra-aortic balloon pumping
This is a technique used to assist temporarily the failing left ventricle. A catheter with a long sausage-shaped balloon at its tip is introduced percutaneously into the femoral artery and manipulated under X-ray control so that the balloon lies in the descending aorta just below the aortic arch (Fig. 14.35). The balloon is rhythmically deflated and inflated with carbon dioxide gas. Using the ECG or intra-aortic pressure changes, the inflation is timed to occur during ventricular diastole to increase diastolic aortic pressure and consequently to improve coronary and cerebral blood flow. During systole the balloon is deflated, resulting in a reduction in the resistance to left ventricular emptying. Intra-aortic balloon pumping is used for circulatory support in the following acute situations:
 Acute heart failure. Balloon pumping is used to improve cardiac output when there is a transient or reversible depression of left ventricular function, such as in a patient with severe mitral valve regurgitation who is awaiting surgical replacement of the mitral valve, or in a patient with a ventricular septal defect that is due to septal infarction. It may also be used to support patients awaiting heart transplantation.