9 Cardiovascular Assessment and Monitoring
After reading this chapter, you should be able to:
• describe the normal blood flow through the cardiovascular system
• define each stage of the cardiac action potential
• describe the determinants of cardiac output
• describe the reasons for the assessment and monitoring of critically ill patients
• summarise the key principles underpinning cardiac assessment and monitoring
• identify the recommended anatomical landmarks for cardiac auscultation and identify normal and common abnormal heart sounds
• describe the physiological bases and reasons for different types of haemodynamic monitoring
Related Anatomy and Physiology
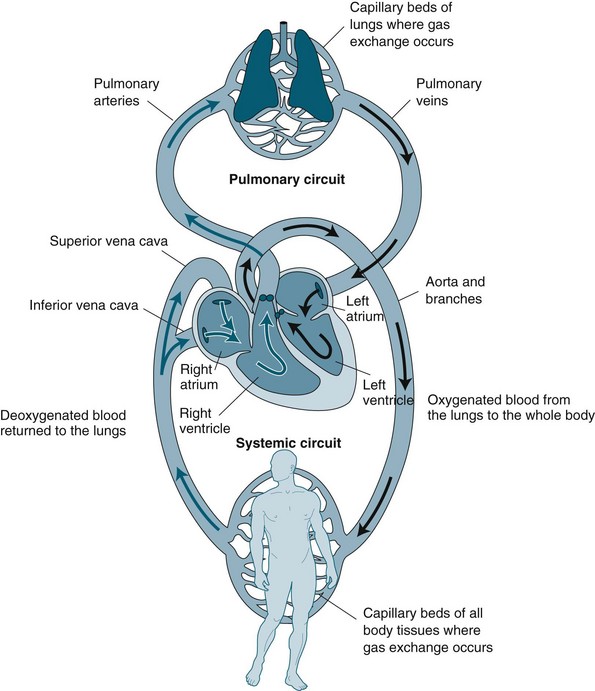
The cardiovascular system is essentially a transport system for distributing metabolic requirements to, and collecting byproducts from, cells throughout the body. The heart pumps blood continuously through two separate circulatory systems: both to the lungs, and all other parts of the body (see Figure 9.1). Structures on the right side of the heart pump blood through the lungs (the pulmonary circulation) to be oxygenated. The left side of the heart pumps oxygenated blood throughout the remainder of the body (the systemic circulation).1,2 The two systems are connected, so the output of one becomes the input of the other.
Cardiac Macrostructure
The heart is cone-shaped and lies diagonally in the mediastinum towards the left side of the chest. The point of the cone is called the apex and rests just above the diaphragm; the base of the cone lies just behind the mediastinum. The adult heart is about the size of that individual’s fist, weighs around 300 g, and is composed of chambers and valves that form the two separate pumps. The upper chambers, the atria, collect blood and act as a primer to the main pumping chambers, the ventricles. As the atria are low-pressure chambers, they have relatively thin walls and are relatively compliant. As the ventricle propels blood against either pulmonary or systemic pressure, they are much thicker and more muscular walls than the atria. As pressure is higher in the systemic circulation, the left ventricle is much thicker than the right ventricle. Dense fibrous connective tissue rings provide a firm anchorage for attachments of atrial and ventricular muscle and valvular tissue.1,4
One-way blood flow in the system is facilitated by valves. Valves between the atria and ventricles are composed of cusps or leaflets sitting in a ring of fibrous tissue and collagen. The cusps are anchored to the papillary muscles by chordae tendinae so that the cusps are pulled together and downwards at the onset of ventricular contraction. The atrioventricular valves are termed the tricuspid valve in the right side of the heart and the mitral or bicuspid valve in the left side of the heart. Semilunar valves prevent backflow from the pulmonary artery (pulmonic valve) and aorta (aortic valve) into the right and left ventricles correspondingly. The muscles in the ventricles follow a distinct spiral path so that during contraction, blood is propelled into the respective outflow tracts of the pulmonary artery and aorta. The aortic valve sits in a tubular area of mostly non-contractile collagenous tissue, which contains the opening of the coronary arteries. The coronary arteries run through deep grooves that separate the atria and ventricles. The two sides of the heart are divided by a septum, which ensures that two separate but integrated circulations are maintained.1,4
The myocardium forms the bulk of the heart and is composed primarily of myocytes. Myocytes are the contractile cells, and autorhythmic cells, which create a conduction pathway for electrical impulses. Myocytes (see Figure 9.2) are cylindrical in shape and able to branch to interconnect with each other. The junctions between myocytes are termed intercalated discs and contain desmosomes and gap junctions.6 Desmosomes act as anchors to prevent the myocytes from separating during contraction. Gap junctions contain connexons, which allow ions to move from one myocyte to the next. The movement of ions from cell to cell ensures that the whole myocardium acts as one unit, termed a functional syncytium. When ischaemia occurs, the gap junctions may uncouple, so ions do not move as freely. Uncoupling may also contribute to the poor conduction evidenced on ECG during ischaemia.5
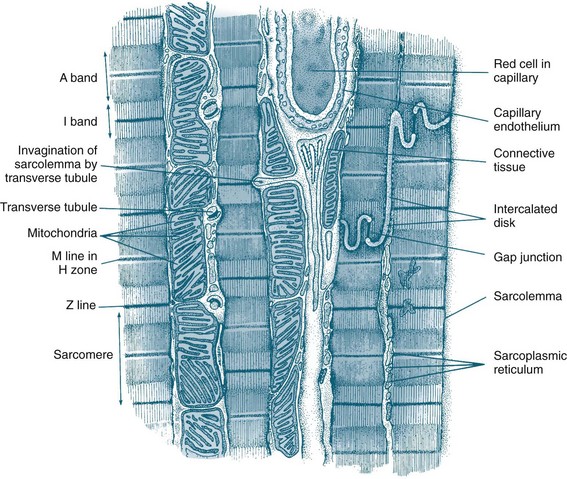
FIGURE 9.2 Diagram of an electron micrograph of cardiac muscle showing mitochondria, intercalculated discs, tubules and sarcoplasmic reticulum.5
The endocardium is composed primarily of squamous epithelium, which forms a continuous sheet with the endothelium that lines all arteries, veins and capillaries. The vascular endothelium is the source of many chemical mediators, including nitric oxide and the endothelin involved in vessel regulation. It has been theorised that the endocardium may also have this function.1,4
Coronary Perfusion
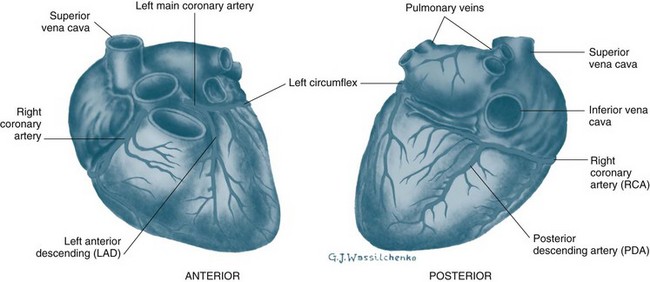
The heart is perfused by the right and left coronary arteries that arise from openings in the aorta called the coronary ostia (see Figure 9.3). The right coronary artery (RCA) branches supply the atrioventricular node, right atrium and right ventricle, and the posterior descending branch supplies the lower aspect of the left ventricle. The left coronary artery divides into the left anterior descending artery (LAD) and the circumflex artery (CX) shortly after its origin. The LAD supplies the interventricular septum and anterior surface of the left ventricle. The CX supplies the lateral and posterior aspects of the left ventricle. This is the most common distribution of the coronary arteries, but it is not uncommon for the right coronary artery to be small and the CX to supply the inferior wall of the left ventricle. The coronary arteries ultimately branch into a dense network of capillaries to support cardiac myocytes. Anastomoses between branches of the coronary arteries often occur in mature individuals when myocardial hypoxia has been present. These anastomoses are termed collateral arteries, but the contribution to normal cardiac perfusion during occlusion of coronary arteries is unclear.1
Physiological Principles
Mechanical Events of Contraction
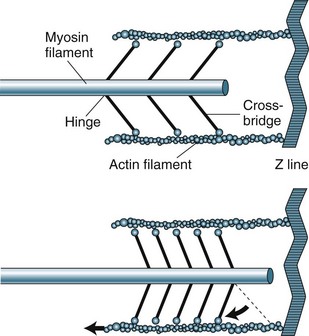
The sarcomere contains two types of protein myofilaments, one thick (myosin) and one thin (actin, tropomyosin and troponin) (see Figure 9.4). The myosin molecules of the thick filaments contain active sites that form bridges with sites of the actin molecules on the thin filaments. These filaments are arranged so that during contraction, bridges form and the thin filaments are pulled into the lattice of the thick filaments. As the filaments are pulled towards the centre of the sarcomere, the degree of contraction is limited by the length of the sarcomere. Starling’s law states that, within physiological limits, the greater the degree of stretch, the greater the force of contraction. The length of the sarcomere is the physiological limit because too great a stretch will disconnect the myosin–actin bridges.
Electrical events of Depolarisation, Resting Potential and Action Potential
Automaticity and rhythmicity are intrinsic properties of all myocardial cells. However, specialised autorhythmic cells in the myocardium generate and conduct impulses in a specific order to create a conduction pathway. This pathway ensures that contraction is coordinated and rhythmical, so that the heart pumps efficiently and continuously. Electrical impulses termed action potentials are transmitted along this pathway and trigger contraction in myocytes. Action potentials represent the inward and outward flow of negative and positive charged ions across the cell membrane (see Figure 9.5).
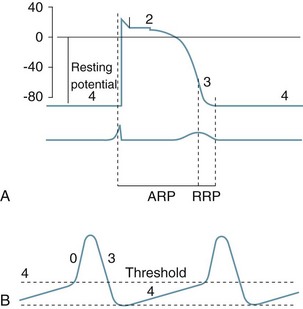
FIGURE 9.5 (A) Action potential in a ‘fast response’, non-pacemaker myocyte: phases 0–4, resting membrane potential −80 mV, absolute refractory period (ARP) and relative refractory period (RRP). (B) Action potential in a ‘slow response’, pacemaker myocyte. The upward slope of phase 4, on reaching threshold potential, results in an action potential.7
The contractile response begins just after the start of depolarisation and lasts about 1.5 times as long as the depolarisation and repolarisation (see Figure 9.6).
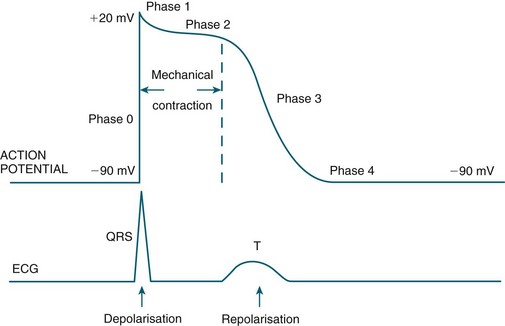
• at rest cell membranes are more permeable to potassium and consequently;
• potassium moves slowly and passively from intracellular to extracellular fluid;
• rapid ion movement caused by sodium flowing into the cell alters the charge from −90 mV to +30 mV;
• there follows a brief influx of calcium via the fast channel and then more via the slower channel to create a plateau, the time of which determines stroke volume due to its influence on the contractile strength of muscle fibres;
• the third phase occurs when the potassium channel opens, allowing potassium to leave the cell, to restore the negative charge, causing rapid repolarisation.
• the final resting phase occurs when slow potassium leakage allows the cell to increase its negative charge to ensure that it is more negative than surrounding fluid, before the next depolarisation occurs and the cycle repeats.6
Cardiac muscle is generally slow to respond to stimuli and has relatively low ATPase activity. Its fibres are dependent on oxidative metabolism and require a continuous supply of oxygen. The length of fibres and the strength of contraction are determined by the degree of diastolic filling in the heart. The force of contraction is enhanced by catecholamines.2
Depolarisation is initiated in the sino-atrial (SA) node and spreads rapidly through the atria, then converges on the atrio-ventricular (AV) node; atrial depolarisation normally takes 0.1 second. There is a short delay at the AV node (0.1 sec) before excitation spreads to the ventricles. This delay is shortened by sympathetic activity and lengthened by vagal stimulation. Ventricular depolarisation takes 0.08–0.1 sec, and the last parts of the heart to be depolarised are the posteriobasal portion of the left ventricle, the pulmonary conus and the upper septum.8
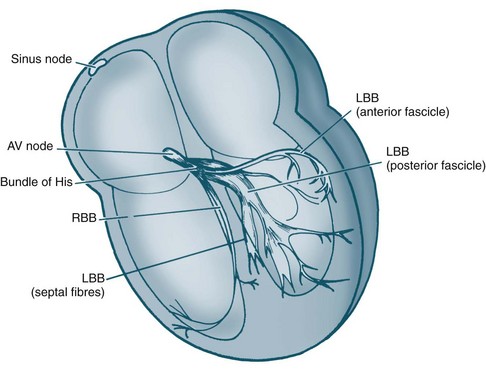
Cardiac Macrostructure and Conduction
The electrical and mechanical processes of the heart differ but are connected. The autorhythmic cells of the cardiac conduction pathway ensure that large portions of the heart receive an action potential rapidly and simultaneously. This ensures that the pumping action of the heart is maximised. The conduction pathway is composed of the sinoatrial (SA) node, the atrioventricular (AV) node, the bundle of His, right and left bundle branches and Purkinje fibres (see Figure 9.7). The cells contained in the pathway conduct action potentials extremely rapidly, 3–7 times faster than general myocardial tissue. Pacemaker cells of the sinus and atrioventricular nodes differ, in that they are more permeable to potassium, so that potassium easily ‘leaks’ back out of the cells triggering influx of sodium and calcium back into cells. This permits the spontaneous automaticity of pacemaker cells.
Cardiac Output
Determinants of Cardiac Output
Cardiac performance is altered by numerous homeostatic mechanisms. Cardiac output is regulated in response to stress or disease, and changes in any of the factors that determine cardiac output will result in changes to cardiac output (see Figure 9.8). Cardiac output is the product of heart rate and stroke volume; alteration in either of these will increase or decrease cardiac output, as will alteration in preload, afterload or contractility. In the healthy individual, the most immediate change in cardiac output is seen when heart rate rises. However, in the critically ill, the ability to raise the heart rate in response to changing circumstances is limited, and a rising heart rate may have negative effects on homeostasis, due to decreased diastolic filling and increased myocardial oxygen demand.
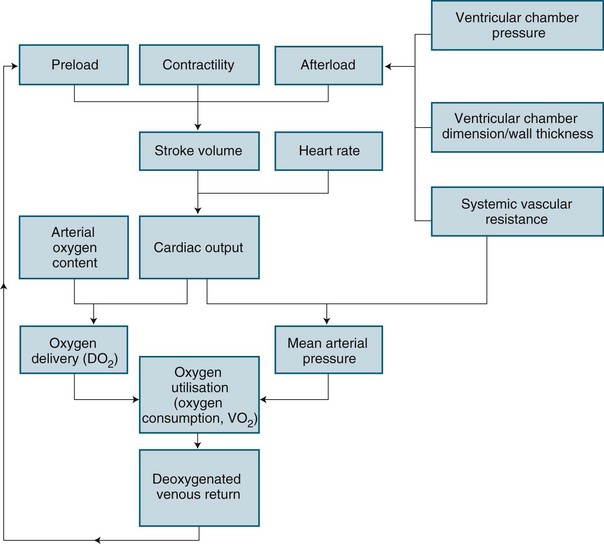
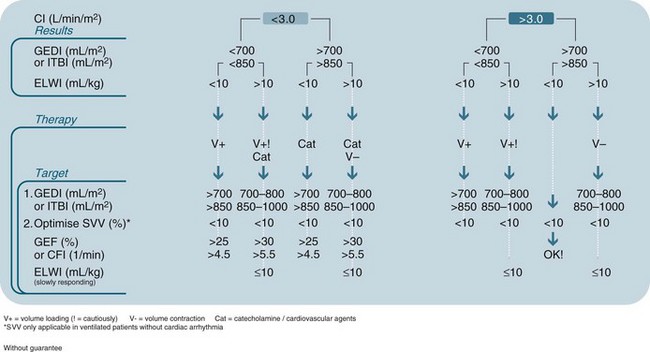
Preload is the load imposed by the initial fibre length of the cardiac muscle before contraction (i.e. at the end of diastole). The primary determinant of preload is the amount of blood filling the ventricle during diastole, and as indicated in Figure 9.8, it is important in determining stroke volume. Preload influences the contractility of the ventricles (the strength of contraction) because of the relationship between myocardial fibre length and stretch. However, a threshold is reached when fibres become overstretched, and force of contraction and resultant stroke volume will fall.
Preload of the left side of the heart, assessed at the end of filling of the left ventricle from the left atrium using the pulmonary capillary wedge pressure (PCWP), is assumed for clinical purposes to reflect left ventricular end-diastolic volume (LVEDV). Due to the non-linear relationship between volume and pressure,10 caution must, however, be taken when interpreting these values, as rises in LVEDP may indicate pathology other than increased preload. Preload of the right side of the heart is indirectly assessed at the end of filling of the right ventricle from the right atrium through central venous pressure (CVP) monitoring.
Cardiac output is dependent on a series of mechanical events in the cardiac cycle (see Figure 9.9). As normal average heart rate is maintained at approximately 70 beats/min the average phases of the cardiac cycle are completed in less than a second (0.8 sec). Electrical stimulation of myocardial contraction ensures that the four chambers of the heart contract in sequence. This allows the atria to act as primer pumps for the ventricles, while the ventricles are the major pumps that provide the impetus for blood through the pulmonary and systemic vascular systems. The phases of the cardiac cycle are characterised by pressure changes within each of the heart chambers, resulting in blood flow from areas of high pressure to areas of lower pressure.
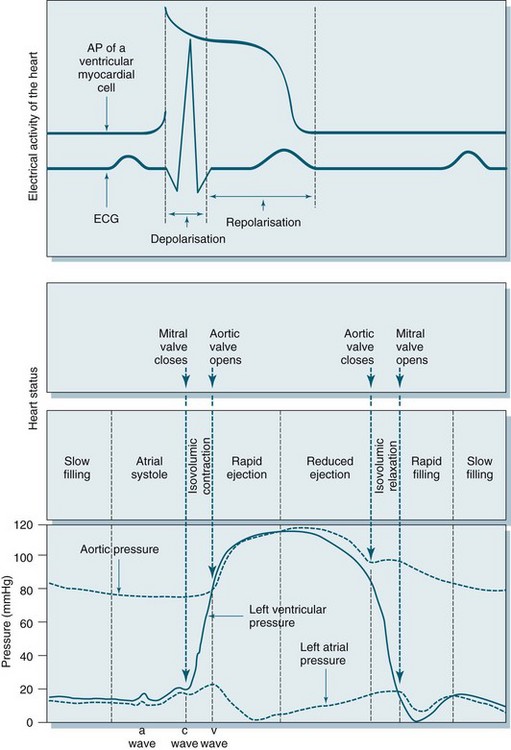
During early ventricular diastole, the ventricles repolarise and ventricular relaxation occurs. The pressure in the ventricles falls until the pressures in the aorta and pulmonary artery are higher and blood pushes back against the semilunar valves. Shutting of these valves prevents backflow into the ventricles, and pressure in the ventricles declines further. During ventricular contraction, the atria have been filling passively, so the pressure in the atria rises to higher than that in the ventricles and the AV valves open, allowing blood flow to the ventricles. Any rise in heart rate will shorten the resting period, which may impair filling time and coronary artery flow as these arteries fill during diastole.1
Regulation of Cardiac Output
Intrinsic regulation of contraction responds to the rate of blood flow into the chambers. Blood flow into the heart depends on venous return from systemic and pulmonic veins and varies according to tissue metabolism, total blood volume and vasodilation. Venous return contributes to end-diastolic volume (preload) and pressure, which are both directly related to the force of contraction in the next ventricular systole. The intrinsic capacity of the heart to respond to changes in end-diastolic pressure can be represented by a number of length–tension curves and the Frank-Starling mechanism (see Figure 9.10). According to this mechanism, within limits, the more stretch on the cardiac muscle fibre before contraction, the greater the strength of contraction. The ability to increase strength of contraction in response to increased stretch is because there is an optimal range of cross-bridges that can be created between actin and myosin in the myocyte. Under this range, when venous return is poor, fewer cross-bridges can be created. Above this range, when heart failure is present, the cross-bridges can become partially disengaged, contraction is poor, and higher filling pressures are needed to achieve adequate contractile force.
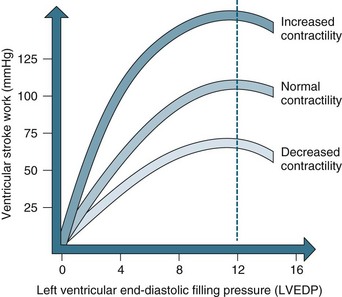
FIGURE 9.10 The Frank-Starling curve. As left ventricular end-diastolic pressure increases, so does ventricular stroke work.5
Ventricular contraction is also intrinsically influenced by the size of the ventricle and the thickness of the ventricle wall. This mechanism is described by Laplace’s law, which states that the amount of tension generated in the wall of the ventricle required to produce intraventricular pressure depends on the size (radius and wall thickness) of the ventricle.1 As a result, in heart failure, when ventricular thinning and dilation is present, more tension or contractile force is required to create intraventricular pressure and therefore cardiac output.
Autonomic nervous system control and regulation of heart rate
Although the pacemaker cells of the heart are capable of intrinsic rhythm generation (automaticity), inputs from the autonomic nervous system regulate heart rate changes in accordance with body needs by stimulating or depressing these pacemaker cells. Cardiac innervation includes sympathetic fibres from branches of T1–T5, and parasympathetic input via the vagus nerve.10 The heart rate at any moment is a product of the respective inputs of sympathetic stimuli (which accelerate) and parasympathetic stimuli (which depress) on heart rate. Rises in heart rate can thus be achieved by an increase in sympathetic tone or by a reduction in parasympathetic tone (vagal inhibition). Conversely, slowing of the heart rate can be achieved by decreasing sympathetic or increasing parasympathetic activity.4
Hormonal, biochemical and pharmacological inputs also exert heart rate influences by their effect on autonomic neural receptors or directly on pacemaker cells. In mimicking the effects of direct nervous inputs, these influences may be described as sympathomimetic or parasympathomimetic. Sympathomimetic stimulation (e.g. through the use of isoprenaline) achieves the same cardiac endpoints as direct sympathetic activity, increasing the heart rate, while sympathetic antagonism (e.g. beta-blockade therapy) slows the heart through receptor inhibition. By contrast, parasympathomimetic agonist activity slows the heart rate, while parasympathetic antagonism (e.g. via administration of atropine sulphate) raises the heart rate by causing parasympathetic receptor blockade.4
The Vascular System
Capillaries function to allow exchange of fluid, nutrients, electrolytes, hormones and other substances through highly permeable walls between the blood plasma and interstitial fluid (see Figure 9.11). Just before the capillary beds are precapillary sphincters, bands of smooth muscle that adjust flow in the capillaries. Venules collect blood from the capillaries to veins. Excess tissue fluid is collected by the lymphatic system. Lymphatic veins have a similar structure to the cardiovascular system veins described below, with lymph returning to this system at the right side of the heart.
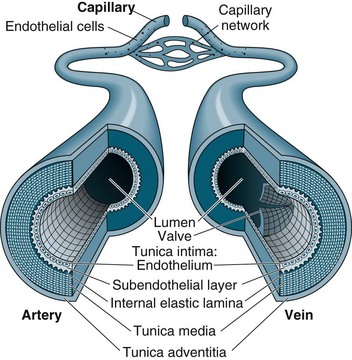
Veins collect and transport blood back to the heart at low pressure and serve as a reservoir for blood. Therefore, veins are numerous and have thinner, less muscular walls, which can dilate to store extra blood (up to 64% of total blood volume at any time). Some veins, particularly in the lower limbs, contain valves to prevent backflow and ensure one-way flow to the heart. Venous return is promoted during standing and moving by the muscles of the legs compressing the deep veins, promoting blood flow towards the heart.1,4
Blood Pressure
Blood flow is maintained by pulsatile ejection of blood from the heart and pressure differences between the blood vessels. Traditionally, blood pressure is measured from the arteries in the general circulation at the maximum value during systole and the minimum value occurring during diastole. The cardiovascular system must supply blood according to varying demands and in a range of circumstances, with at least a minimal blood flow to be maintained to all organs. At a local level this is achieved by autoregulation of individual arteries, such as the coronary arteries, in response to the metabolic needs of the specific tissue or organ. The exact mechanism is unknown, but it has been proposed that increased vascular muscle stretch and/or metabolites and decreased oxygen levels are detected and cells release substances such as adenosine.4 These substances result in rapid vasodilation and increased perfusion. The vascular endothelium actively secretes prostacyclin and endothelial-derived relaxing factor (nitric oxide), both vasoactive agents.
Renal control
In addition to longer term fluid regulation, during acute illness or time of acute hypotension, the renin-angiotensin-aldesterone system (RAAS) plays an important role in maintaining blood pressure. This negative feedback system results in both reabsorption of intravascular fluid and increases peripheral resistance, in an effort to increase blood pressure. Further details on the RAAS system can be found in Chapter 18.
Assessment
Specific physical assessment in relation to cardiovascular function should be inclusive of:
• respiratory assessment for signs of pulmonary oedema (shortness of breath or basal crepitations)
• assessment of neck vein distension for signs of right sided venous congestion
• assessment for signs of peripheral oedema
• capillary refill time with >3 sec return indicative of sluggish capillary return
• 12-lead ECG for signs of ischaemia or cardiac pathology
• appearance and temperature of the skin for signs of peripheral constriction or dehydration
• core body temperature measurement
• urine output with <0.5 mL/kg/hour a potential indicator of decreased renal perfusion.12
Auscultation of Heart Sounds
A guide to placement of stethoscope when listening to heart sounds is presented in Table 9.1.
TABLE 9.1 Guide to placement of stethoscope when listening to heart sounds
| Stethescope placement | Auditable region of heart | |
|---|---|---|
| 2nd intercostal space | right of sternum | aortic valve |
| 2nd intercostal space | left of sternum | pulmonary valve |
| 4th intercostal space | left side of sternum | tricuspid valve |
| 5th intercostal space | midclavicular line | mitral valve |
In addition to pericardial rub, murmurs may also be audible. Murmurs are generally classified and characterised by location with the most common murmurs associated with the mitral or aortic valves due to either stenosis or regurgitation at these locations. Murmurs are best thought of as turbulent flow or vibrations associated with the corresponding valve and can be of variable pitch. Specialist cardiac referral is indicated upon detection of cardiac murmurs to differentiate pathological murmurs as seen during valvular dysfunction or myocardial infarction from innocent systolic ‘high flow’ murmurs detected in children or adolescents as a result of vigorous ventricular contraction. Murmurs may be classified using the Levine scale,12 seen in Table 9.2.
TABLE 9.2 Classification of heart murmurs using the Levine scale12
| Grade 1 | low intensity and difficult to hear |
| Grade 2 | low intensity, but audible with a stethoscope but no palpable thrill |
| Grade 3 | medium intensity and easily heard with a stethoscope |
| Grade 4 | loud and audible and with palpable thrill |
| Grade 5 | very loud but cannot be heard outside the praecordium and with palpable thrill |
| Grade 6 | audible with the stethoscope away from the chest |
Continuous Cardiac Monitoring
Internationally, a minimum standard for an ICU requires availability of facilities for cardiovascular monitoring.13 Continuous cardiac monitoring allows for rapid assessment and constant evaluation with, when required, the instantaneous production of paper recordings for more detailed assessment or documentation into patient records. In addition, practice standards for electrocardiographic monitoring in hospital settings have been established.14
It is now common practice for five leads to be used for continuous cardiac monitoring,5 as this allows a choice of seven views. The five electrodes are placed as follows:15
• right and left arm electrodes: placed on each shoulder;
• right and left leg electrodes: placed on the hips or level with the lowest ribs on the chest;
• V-lead views can be monitored: for V1 place the electrode at the 4th ICS, right of the sternum; for V6 place the electrode at the 5th ICS, left mid-axillary line.
The monitoring lead of choice is determined by the patient’s clinical situation.15 Generally, two views are better than one. V1 lead is best to view ventricular activity and differentiate right and left bundle branch blocks; therefore, one of the channels on the bedside monitor should display a V lead, preferably V1, and the other display lead II or III for optimal detection of arrhythmias. When the primary purpose of monitoring is to detect ischaemic changes leads III and V3 usually present the optimal combination.14
12-lead ECG
The Dutch physiologist Einthoven was one of the first to represent heart electrical conduction as two charged electrodes, one positive and one negative.16 The body can be likened to a triangle, with the heart at its centre, and this has been called Einthoven’s triangle. Cardiac electrical activity can be captured by placing electrodes on both arms and on the left leg. When these electrodes are connected to a common terminal with an indifferent electrode that stays near zero, an electrical potential is obtained. Depolarisation moving towards an active electrode produces positive deflection.
The 12-lead ECG consists of six limb leads and six chest leads. The limb leads examine electrical activity along a vertical plane. The standard bipolar limb leads (I, II, III) record differences in potential between two limbs by using two limb electrodes as positive and negative poles (see Figure 9.12):17 Leads I, II, and III all produce positive deflections on the ECG because the electrical current flows from left to the right and from upwards to downwards. Placement should be:
• I = negative electrode in right arm and positive electrode in left arm
• II = negative electrode in right arm and positive electrode in left leg
• III = negative electrode in left arm and positive electrodes in left leg
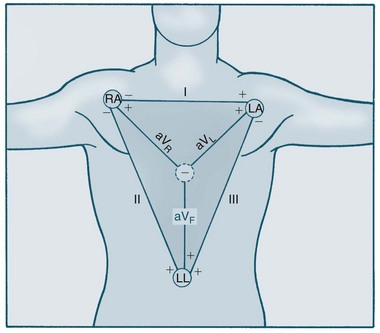
The three unipolar limb leads (aVR, aVL, aVF) record activity of the heart’s frontal plane. Each of these unipolar leads have only one positive electrode (the limb electrode such as left arm, right arm and left leg), with the centre of the Einthoven’s triangle acting as the negative electrode. The waveforms of these leads are usually very small therefore they are augmented by the ECG machine to increase the size of the potentials on the ECG strip.17 These three leads views the heart at different angles:
• Lead aVR produces a negative reflection because the electrical activity moves away from the lead. Lead aVR does not provide a specific view of the heart.
• Lead aVL produces a positive deflection because the electrical activity moves towards the lead. Lead aVL views the electrical activity from the lateral wall.
• Lead aVF also produces a positive deflection on the ECG because the electrical activity flows toward this lead. It views the electrical activity from the inferior wall.
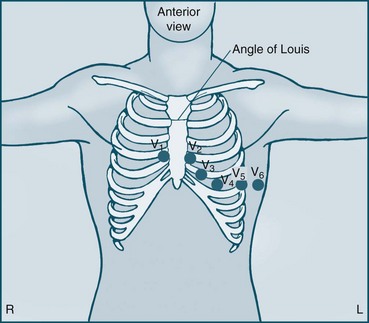
The six unipolar chest leads (precordial leads) are designated V1–6 and examine electrical activity along a horizontal plane from the right ventricle, septum, left ventricle and the left atrium. They are positioned in the following way (see Figure 9.13):
• V1 = 4th ICS, to the right of the patient’s sternum
• V2 = 4th ICS, to the left of the patient’s sternum
• V3 = equidistant between V2 and V4
• V4 = 5th ICS on the midclavicular line
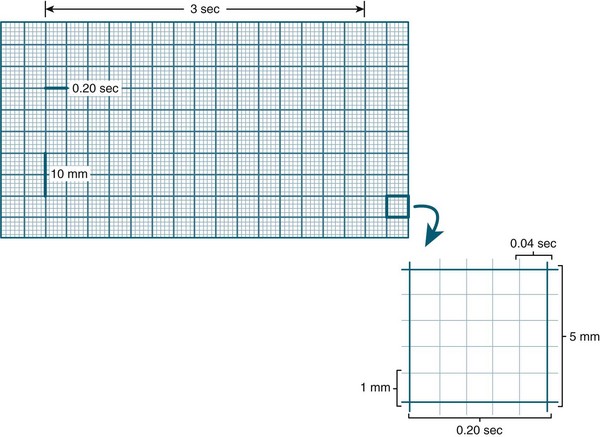
Amplitude (voltage) in the ECG is measured by a series of horizontal lines on the ECG (see Figure 9.14). Each line is 1 mm apart and represents 0.1 mV. Amplitude reflects the wave’s electrical force and has no relation to the muscle strength of ventricular contraction.8 Duration of activity within the ECG is measured by a series of vertical lines also 1 mm apart (see Figure 9.14). The time interval between each line is 0.04 sec. Every 5th line is printed in bold, producing large squares. Each represents 0.5 mV (vertically) and 0.2 sec (horizontally).
Key Components of the ECG
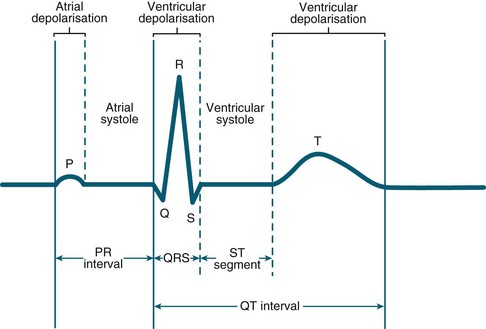
Key components of the cardiac electrical activity are termed PQRST (see Figure 9.15):
• The P wave represents electrical activity caused by spread of impulses from the SA node across the atria and appears upright in lead II. Inverted P waves indicate atrial depolarisation from a site other than the SA node. Normal P wave duration is considered less than 0.12 sec.
• The P–R interval reflects the total time taken for the atrial impulse to travel through the atria and AV node. It is measured from the start of the P wave to the beginning of the QRS complex, but is lengthened by AV block or some drugs. Normal P–R interval is 0.12–0.2 sec.
• The QRS complex is measured from the start of the Q wave to the end of the S wave and represents the time taken for ventricular depolarisation. Normal QRS duration is 0.08–0.12 sec. Anything longer than 0.12 sec is abnormal and may indicate conduction disorders such as bundle branch block. The deflections seen in relation to this complex will vary in size, depending on the lead being viewed. However, small QRS complexes occur when the heart is insulated, as in the presence of a pericardial effusion. Conversely, an exaggerated QRS complex is suggestive of ventricular hypertrophy. Normal, non-pathological Q waves are often seen in leads I, aVL, V5, V6 from septal depolarisation which are less than 25% of the R height, and 0.04 sec. A ‘pathological’ Q wave (>0.04 sec plus >25% of R wave height) may indicate a previous myocardial infarction, however, not every myocardial infarction will result in a pathological Q wave18 and some abnormal Q waves, in combination of other ECG changes and patient symtoms, may indicate a current myocardial infarction.19 Pathological Q waves could also be seen in non-ischaemic conditions such as Wolff–Parkinson–White syndrome (WPW).20
• The Q–T interval is the time taken from ventricular stimulation to recovery. It is measured from the beginning of the QRS to the end of the T wave. Normally, this ranges from 0.35 to 0.45 sec, but shortens as heart rate increases. It should be less than 50% of the preceding cycle length.
• The T wave reflects repolarisation of the ventricles. A peaked T wave indicates hyperkalaemia, myocardial infarction (MI) or ischaemia, while a flattened T wave usually indicates hypokalaemia. An inverted T wave occurs following an MI, or ventricular hypertrophy. Normal T wave is 0.16 sec. The height of the T wave should be less than 5 mm in all limb leads, and less than 10 mm in the praecordial leads.17
• The ST segment is measured from the J point (junction of the S wave and ST segment) to the start of the T wave. It is usually isoelectric in nature, and elevation or depression indicates some abnormality in the onset of recovery of the ventricular muscle, usually due to myocardial injury.
• The U wave is a small positive wave sometimes seen following the T wave. Its cause is still unknown but it is exaggerated in hypokalaemia. Inverted U waves may be seen and often associated with coronary heart disease (CHD), and these may appear transiently during exercise testing.18
ECG Interpretation
• Check R-R intervals (rhythm):
• Locate P waves (check atrial activity):
• Measure P-R interval (check AV node activity):
Haemodynamic Monitoring
The blood’s dynamic movement in the cardiovascular system is referred to as haemodynamics. Haemodynamic monitoring is performed to provide the clinician with a greater understanding of the pathophysiology of the problem being treated than would be possible with clinical assessment alone. Knowledge of the evidence that underpins the technology and the processes for interpretation is therefore essential to facilitate optimal usage and evidence-based decisions.22
Haemodynamic monitoring can be non-invasive or invasive, and may be required on a continuous or intermittent basis depending on the needs of the patient.23 In both cases, signals are processed from a variety of physiological variables, and these are then clinically interpreted within the individual patient’s context.
The invasive nature of this monitoring allows the pressures that are sensed at the distal ends of the catheters to be transduced, and to continuously display and monitor the corresponding waveforms. The extent of monitoring should reflect how much information is required to optimise the patient’s condition, and how precisely the data are to be recorded. As Pinsky argues, a great deal of information is generated by this form of monitoring, and yet little of this is actually used clinically.24 Consequently, monitors are not substitutes for careful examination and do not replace the clinician. The accuracy of the values obtained and a nurse’s ability to interpret the data and choose an appropriate intervention directly affect the patient’s condition and outcome.25
Principles of Haemodynamic Monitoring
Haemodynamic Accuracy
Accuracy of the value obtained from haemodynamic monitoring is essential, as it directly affects the patient’s condition.26,27 Electronic equipment for this purpose has four components (see Figure 9.16):
1. an invasive catheter attached to high-pressure tubing
2. a transducer to detect physiological activity
4. a recording device, incorporating an amplifier to increase the size of the signal, to display information.
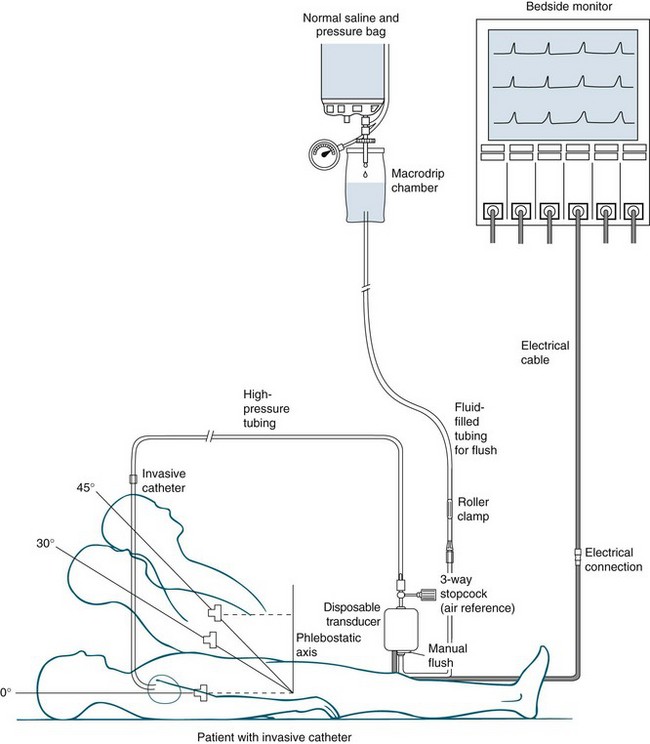
Accuracy is dependent on levelling the transducer to the appropriate level (and altering this level with changes in patient position as appropriate), then zeroing the transducer in the pressure monitoring system to atmospheric pressure (called calibration) as well as evaluating the response of the system by fast-flush wave testing. The transducer must be levelled to the reference point of the phlebostatic axis, at the intersection of the 4th intercostal space and the midthoracic anterior-posterior diameter (not the midaxillary line).27 Error in measurement can occur if the transducer is placed above or below the phlebostatic axis.26,27 Measurements taken when the patient is in the lateral position are not considered as accurate as those taken when the patient is lying supine or semirecumbent up to an angle of approximately 60 degrees.28
Zeroing the transducer system to atmospheric pressure (calibration of the system) is achieved by turning the 3-way stopcock nearest to the transducer open to the air, and closing it to the patient and the flush system. The monitor should display zero (0 mmHg), as this equates to current atmospheric pressure (760 mmHg at sea level). With the improved quality of transducers, repeated zeroing is not necessary, as once zeroed, the drift from the baseline is minimal.29 Some critical care units, however, continue to recalibrate transducer(s) at the beginning of each clinical shift.
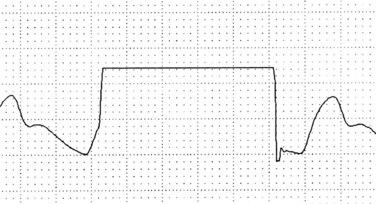
Fast-flush square wave testing, or dynamic response measurement,29 is a way of checking the dynamic response of the monitor to signals from the blood vessel. It is also a check on the accuracy of the subsequent haemodynamic pressure values. The fast-flush device within the system, when triggered and released, exposes the transducer to the amount of pressure in the flush solution bag (usually 300 mmHg). The pressure waveform on the monitor will show a rapid rise in pressure, which then squares off before the pressure drops back to the baseline (see Figure 9.17).
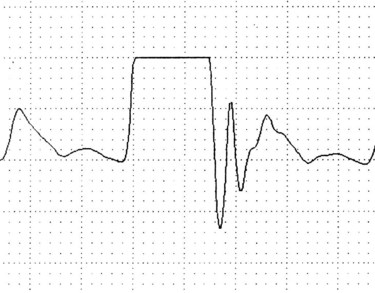
Interpretation of the square wave testing is essential; the clinician must observe the speed with which the wave returns to the baseline as well as the pattern produced. One to three rapid oscillations should occur immediately after the square wave, before the monitored waveform resumes. The distance between these rapid oscillations should not exceed 1 mm or 0.04 sec.29 Absence, or a reduction, of these rapid oscillations, or a ‘square wave’ with rounded corners, indicates that the pressure monitoring system is overdamped; in other words its responsiveness to monitored pressures and waveforms is reduced (see Figure 9.18). An underdamped monitoring system will produce more rapid oscillations after the square wave than usual.
Haemodynamic Monitoring Standards
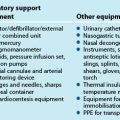
There are stated minimum standards for critical care units in Australia and New Zealand.30,31 The standards require that patient monitoring include circulation, respiration and oxygenation, with the following essential equipment available for every patient: an ECG that facilitates continual cardiac monitoring; a mechanical ventilator, pulse oximeter; and other equipment available where necessary to measure intra-arterial and pulmonary pressures, cardiac output, inspiratory pressure and airway flow, intracranial pressures and expired carbon dioxide.30
Blood Pressure Monitoring
Non-invasive Blood Pressure Monitoring
Non-invasive blood pressure (NIBP) monitoring requires the use of a manual or electronic sphygmomanometer. Oscillation in the pressure generated by alterations in arterial flow is captured either through auscultation or automatic sensing. On auscultation, a number of Korotkoff sounds can be heard as the cuff pressure is released:32
• a sharp thud that is heard when the patient’s systolic pressure is reached
• a soft tapping, intermittent in nature
• a loud tapping, intermittent in nature
• a low, muffled noise that is continuous in nature and is heard when the diastolic pressure is reached; as the cuff pressure diminishes further, the sound disappears.
For critically ill patients, this method of blood pressure monitoring has limitations and is often used when invasive methods cannot be utilised.33 It is a less accurate alternative, as results vary with the size of cuff used, equipment malfunction, and incorrect placement of the sphygmomanometer (this must be placed at heart level). In addition, the pressures generated by the inflating cuff, particularly those generated by automatic machines, can be high and frequent measurements of blood pressure in this method may become uncomfortable for the patient. It is therefore important that skin integrity be checked regularly to prevent ischaemia and that the frequency of automated inflations be minimised.33
Invasive Intra-arterial Pressure Monitoring
Arterial pressure recording is indicated when precise and continuous monitoring is required, especially in periods of fluid volume, cardiac output and blood pressure instability.34 An arterial catheter is commonly placed in the radial artery, although other sites can be accessed, including the brachial, femoral, dorsalis pedis and axillary arteries. Arterial catheter insertion is performed aseptically, and it is important that collateral circulation, patient comfort and risk of infection be assessed before insertion is attempted. The radial artery is the most common site, as the ulnar artery provides additional supply to extremities if the radial artery becomes compromised.
Complications of arterial pressure monitoring include:
• accidental disconnection (the insertion sites should be always visible)
• accidental drug administration through the arterial catheter; all arterial lines and connections should be clearly identified as such (e.g. marked with red stickers or have red bungs).
Blood pressure is the same at all sites along a vertical level but when the vertical level is varied, pressure will change. Consequently, referencing is required to correct for changes in hydrostatic pressure in vessels above and below the heart; if not, the blood pressure will appear to rise when this is not really the case. It is important to zero the monitoring system at the left atrial level.27
Arterial waveform
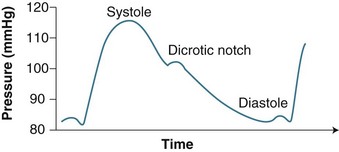
A steep upstroke (corresponding to ventricular systole) is followed by brief, sustained pressure (anacrotic shoulder). At the end of systole pressure falls in the aorta and left ventricle, causing a downward deflection (see Figure 9.19). A dicrotic notch can be seen in the downward deflection which represents the closure of the aortic valve. The systolic pressure corresponds to the peak of the waveform. The arterial pressure waveform changes its contours when recorded at different sites. It can become sharper in distal locations.
Invasive arterial pressure versus cuff pressure
At times the accuracy of the invasive arterial pressure reading may be checked by comparing the reading against that generated by a non-invasive device using an inflating cuff. However, there is no basis for comparing these values. Invasive blood pressure values are a measure of the actual pressure within the artery whereas those from the cuff depend on flow-induced oscillations in the arterial wall.35 Pressure does not equal flow, as resistance does not remain constant. In addition, radial arterial pressure is normally higher than that obtained by brachial non-invasive pressure monitoring because the smaller vessel size exerts greater resistance to flow, and therefore generates a high pressure reading.27,35
Invasive Cardiovascular Monitoring
For many critically ill patients, haemodynamic instability is a potentially life-threatening condition that necessitates urgent action. Accurate assessment of the patient’s intracardiac status is therefore essential. A number of values can be calculated, and Tables 9.3 and 9.4 list the measurements commonly made.
| Parameter | Resting values |
|---|---|
| Central venous pressure | 0 to +8 mmHg (mean) |
| Right ventricular pressure | +15 to +30 mmHg systolic0 to +8 mmHg diastolic |
| Pulmonary artery wedge pressure | +5 to +15 mmHg (mean) |
| Left atrial pressure | +4 to +12 mmHg (mean) |
| Left ventricular pressure | 90 to 140 mmHg systolic+4 to +12 mmHg diastolic |
| Aortic pressure | 90 to 140 mmHg systolic60 to 90 mmHg diastolic70 to 105 mmHg (mean) |
TABLE 9.4 Normal haemodynamic values10,36
| Parameter | Description | Normal values |
|---|---|---|
| Stroke volume (SV) | Volume of blood ejected from left ventricle/beat SV = CO/HR |
50–100 mL/beat |
| Stroke volume index (SVI) | Volume of blood ejected/beat indexed to BSA | 25–45 mL/beat |
| Cardiac output (CO) | Volume of blood ejected from left ventricle/min CO = HR × SV |
4–8 L/min |
| Cardiac index (CI) | A derived value reflecting the volume of blood ejected from left ventricle/min indexed to BSA CI = CO/BSA |
2.5–4.2 L/min/m2 (normal assumes an average weight of 70 kg) |
| Flow time corrected (FTc) | Systolic flow time corrected for heart rate | 330–360 msec |
| Systemic vascular resistance (SVR) | Resistance left heart pumps against SVR = [(MAP − RAP) × 79.9]/CO |
900–1300 dynes/sec/cm−5 |
| Systemic vascular resistance index (SVRI) | Resistance left heart pumps against indexed to body surface area SVRI = [(MAP − RAP) × 79.9]/CI |
1700–2400 dynes/sec/cm5/m2 |
| Pulmonary vascular resistance (PVR) | Resistance right heart pumps against PVR = [(mPAP − LVEDP) × 79.9]/CO |
20–120 dynes/sec/cm−5 |
| Pulmonary vascular resistance index (PVRI) | Resistance right heart pumps against indexed to body surface area PVRI = [(mPAP − LVEDP) × 79.9]/CI |
255–285 dynes/sec/cm5/m2 |
| Mixed venous saturation (SvO2) | Shows the balance between arterial O2 supply and oxygen demand at the tissue level | 70% |
| Left ventricular stroke work index (LVSWI) | Amount of work performed by LV with each heartbeat (MAP – LVEDP) × SVI × 0.0136 |
50–62 g-m/m2 |
| Right ventricular stroke work index (RVSWI) | Amount of work performed by RV with each heartbeat (mPAP – RAP) × SVI × 0.0136 |
7.9–9.7 g-m/m2 |
| Right ventricular end-systolic volume (RVESV) | The volume of blood remaining in the ventricle at the end of the ejection phase of the heartbeat | 50–100 mL/beat |
| Right ventricular end-systolic volume index (RVESVI) | 30–60 mL/m2 | |
| Right ventricular end-diastolic volume (RVEDV) | The amount of blood in the ventricle immediately before a cardiac contraction begins | 100–160 mL/beat |
| Right ventricular end-diastolic volume index (RVEDVI) | 60–100 mL/m2 |
BSA = Body surface area
Preload
As noted earlier, preload is the filling pressure in the ventricles at the end of diastole. Preload in the right ventricle is generally measured as CVP, although this may be an unreliable predictor because CVP is affected by intrathoracic pressure, vascular tone and obstruction.37 Left ventricular preload can be measured as the pulmonary capillary wedge pressure (PCWP), but again, due to unreliability, this parameter provides an estimate rather than a true reflection of volume.38,39 In view of this, other modalities are now being explored, including right ventricular end-diastolic volume evaluation via fast-response pulmonary artery catheters, left ventricular end-diastolic area measured by echocardiography and intrathoracic blood volume measured by transpulmonary thermodilution.40
Central venous pressure monitoring
Central venous catheters are inserted to facilitate the monitoring of central venous pressure; facilitating the administration of large amounts of IV fluid or blood; providing long-term access for fluids, drugs, specimen collection; and/or parenteral feeding. CVP monitoring has been used for many years to evaluate circulating blood volume, despite discussion as to its validity to do so.41–43 However, it is a common monitoring practice and continues to be used. Therefore clinicians need to be aware of possible limitations to this form of measurement and interpret the data accordingly. CVP monitoring can produce erroneous results: a low CVP does not always mean low volume and it may reflect other pathology, including peripheral dilation due to sepsis. Hypovolaemic patients may have normal CVP due to sympathetic nervous system activity increasing vascular tone. An increase in CVP can also be seen in patients on mechanical ventilation with application of PEEP.41–43
Central venous catheters used for haemodynamic monitoring are classed as short-term percutaneous (non-tunnelled) devices. Short-term percutaneous catheters are inserted through the skin, directly into a central vein, and usually remain in situ for only a few days or for a maximum of 2–3 weeks.37 They are easily removed and changed, and are manufactured as single- or multi-lumen types. However, they can be easily dislodged, are thrombogenic due to their material, and are associated with a high risk of infection.37,44
A number of locations can be used for central venous access. The two commonly used sites in critically ill patients are the subclavian and the internal jugular veins. Other less common sites are the antecubital fossa (generally avoided but may be used when the patient cannot be positioned supine), the femoral vein (associated with high infection risk), and the external jugular vein (although the high incidence of anomalous anatomy and the severe angle with the subclavian vein make this an unpopular choice).44
Internal jugular cannulation has a high success rate for insertion; however, complications related to insertion via this route include carotid artery puncture and laceration of local neck structures arising from needle probing.44,45 There are a number of key structures adjacent to the vein, including the vagus nerve (located posteriorly to the internal jugular vein); the sympathetic trunk (located behind the vagus nerve); and the phrenic nerve (located laterally to the internal jugular).46 Damage can also occur to the sympathetic chain, which leads to Horner’s syndrome (constricted pupil, ptosis, and absence of sweat gland activity on that side of the face). Central venous catheters inserted in the internal jugular vein pose a number of nursing challenges which can cause fixation problems and the need for repeated dressing changes. These include beard growth, diaphoresis and poor control of oral secretions.
The subclavian approach is used often, perhaps because of a reported lower risk of catheter-related bloodstream infection.46,47 Coagulopathy is a significant contraindication for this approach, as puncture of the subclavian artery is a known complication. There is also a risk of pneumothorax, which rises if the patient is receiving intermittent positive pressure ventilation (IPPV).47 Complications of any central venous access catheters include air embolism, pneumothorax, hydrothorax and haemorrhage.44
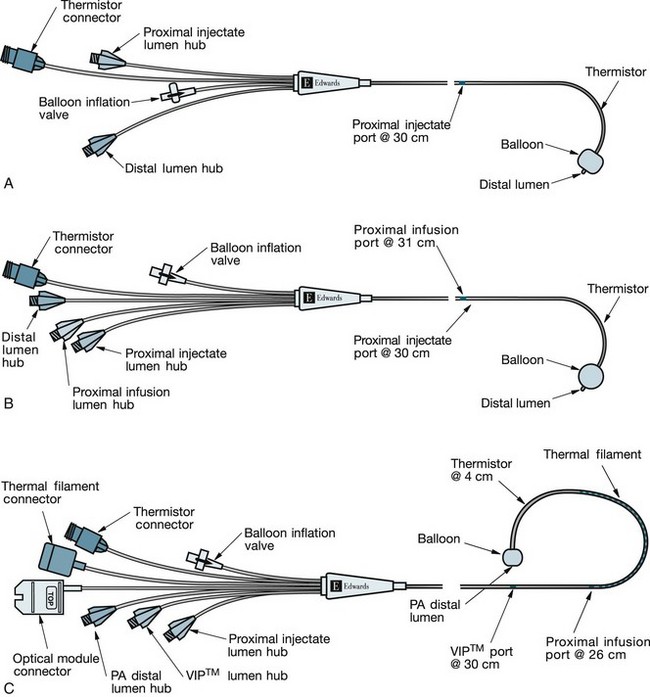
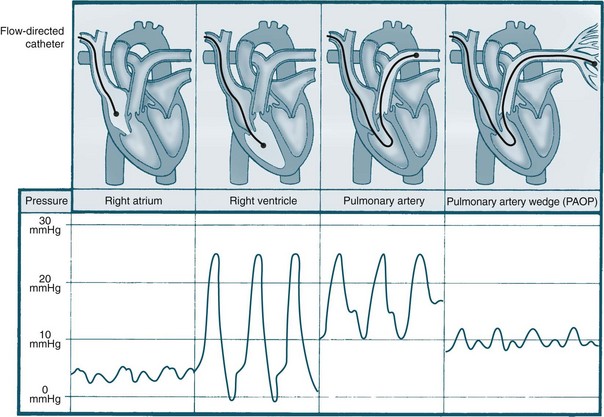
Pulmonary artery pressure (PAP) monitoring
Pulmonary artery pressure monitoring began in the 1970s, led by Drs Swan, Ganz and colleagues,48 and was subsequently adopted in ICUs worldwide. Pulmonary artery catherisation facilitates assessment of filling pressure of the left ventricle through the pulmonary artery wedge (occlusion) pressure (see Figure 9.20).45,49 By using a thermodilution pulmonary artery catheter (PAC), cardiac output and other haemodynamic measurements can also be calculated. PAP monitoring is a diagnostic tool that can assist in determination of the nature of a haemodynamic problem and improve diagnostic accuracy. In addition to measuring PA pressures, PAC may also be used for accessing blood for assessment of mixed-venous oxygenation levels (see Chapter 13).
The beneficial claims of PAP monitoring have, however, been questioned, with some proposing a moratorium.50 In response, two consensus conferences were held in the USA to make recommendations for future practice. It was concluded that there was no basis for a moratorium on the use of PACs; instead, education and knowledge about the use of this technology must be standardised and monitored. Further research was indicated, particularly focusing on the use of PACs.51,52 More recently, an observational cohort study of 7310 patients found that PAC use was not associated with an overall higher mortality, although the authors concluded that severity of illness should be examined when considering the use of this measurement tool.53 The PAC-Man study, a randomised controlled clinical trial, suggested that the use of PAC did not improve the critically ill patients’ outcome.54 A systematic review on PAC use by Harvey et al.55 by the Cochrane Collaboration suggested that more empirical studies are needed to identify the appropriate patient groups that could benefit from the use of PAC and the protocols for their use. In the meantime, proponents for continuing clinical use of the PAC argue that it provides a physiological rationale for diagnosis and assists in the titration of therapies such as inotropes, which would otherwise be potentially dangerous.29,49,51
Since the benefit of use of PAC is still arguable, the indications of PAP monitoring are largely based on clinical experience. PAP monitoring may be indicated for adults in severe hypovolaemic or cardiogenic shock, where there may be diagnostic uncertainty, or where the patient is unresponsive to initial therapy. The PAP is used to guide administration of fluids, inotropes and vasopressors. PAP monitoring may also be utilised in other cases of haemodynamic instability when diagnosis is unclear. It may be helpful when clinicians want to differentiate hypovolaemia from cardiogenic shock or, in cases of pulmonary oedema, to differentiate cardiogenic from non-cardiogenic origins.56 It has been used to guide haemodynamic support in a number of disease states such as shock, and to assist in assessing the effects of fluid management therapy.34,49
Complications do arise from PACs, as these catheters share all the complications of central lines and are additionally associated with a higher incidence of arrhythmia, valve damage, pulmonary vascular occlusion, emboli/infarction (reported incidence of 0.1–5.6%) and, very rarely, knotting of the catheter.44
A number of measurements can be taken via the PAC, either by direct measurement, for example using pulmonary capillary wedge pressure (PCWP), which is an estimate of left ventricular preload (LVEDV) or through calculation of derived parameters, such as cardiac output (CO) and cardiac index (CI)34 (see Table 9.4 for descriptors and normal values).
Pulmonary capillary wedge pressure (PCWP) monitoring
PCWP, or pulmonary artery occlusion pressure (PAOP), is measured when the pulmonary artery catheter balloon is inflated with no more than 1–1.5 mL air. The inflated balloon isolates the distal measuring lumen from the pulmonary arterial pressures, and measures pressures in the capillaries of the pulmonary venous system, and indirectly the left atrial pressure. The PAP waveform looks similar to that of the arterial waveform, with the tracing showing a systolic peak, dicrotic notch and a diastolic dip (see Figure 9.21). When the balloon is inflated, the waveform changes shape and becomes much flatter in appearance, providing a similar waveform to the CVP. There are two positive waves on the tracing: the first reflects atrial contraction, and the second reflects pressure changes from blood flow when the mitral valve closes and the ventricles contract.57 The PCWP should be read once the ‘wedge’ trace stops falling at the end-expiratory phase of the respiratory cycle (see Figure 9.21).
If balloon occlusion occurs with <1 mL air, then the balloon is wedged in a small capillary and consequently will not accurately reflect LA pressure. Conversely, if 1.5 mL air does not cause occlusion, the balloon may have burst (which can result in an air embolus) or it may be floating in a larger vessel. If balloon rupture is suspected, no further attempts to inflate the balloon should be made, and interventions to minimise the risk of air embolism should be initiated.7,58 Note: it is essential that the balloon be deflated as soon as the wedge has been recorded, as continued occlusion will cause distal pulmonary vasculature ischaemia and infarction.59
Left atrial pressure monitoring
Left atrial pressure (LAP) monitoring directly estimates left heart preload. It used to require an open thorax to enable direct cannulation of the atrium. It was used only in the postoperative cardiac surgical setting, although such use was infrequent since the widespread use of PAC. Recent advancement in cardiac implantable devices development enables the patients to self monitor LAP under their doctors’ guidance, which was found to be a valuable tool to improve the management of patients with advanced heart failure.60 Other modes of monitoring can also be used to achieve comprehensive left atrial assessment, such as Doppler echocardiography.61
Afterload
As previously noted, afterload is the pressure that the ventricle produces to overcome the resistance to ejection generated in the systematic or pulmonary circulation by the arteries and arterioles. It is calculated by cardiac output studies: left heart afterload is reflected as systemic vascular resistance (SVR), and right heart afterload is reflected as pulmonary vascular resistance (PVR) (see Table 9.4).
Systemic and pulmonary vascular resistance
Systemic vascular resistance (SVR) is a measure of resistance or impediment of the systemic vascular bed to blood flow. An elevated SVR can be caused by vasoconstrictors, hypovolaemia or late septic shock. A lowered SVR can be caused by early septic shock, vasodilators, morphine, nitrates or hypercarbia. Afterload is a major determinant of blood pressure, and gross vasodilation causes peripheral pooling and hypotension, reducing SVR. The precise estimation of SVR enables safer use of therapies such as vasodilators (e.g. sodium nitroprusside) and vasoconstrictors (e.g. noradrenaline).62
Pulmonary vascular resistance (PVR) is a measure of resistance or the impediment of the pulmonary vascular bed to blood flow. An elevated PVR (‘pulmonary hypertension’) is caused by pulmonary vascular disease, pulmonary embolism, pulmonary vasculitis or hypoxia. A lowered PVR is caused by medications such as calcium channel blockers, aminophylline or isoproterenol, or by the delivery of O2.62,63
Contractility
Right ventricular stroke work index (RVSWI) can be similarly calculated. Contractility can decrease as a result of excessive preload or afterload, drugs such as negative inotropes, myocardial damage such as that occurring after MI, and changes in the cellular environment arising from acidosis, hypoxia or electrolyte imbalances. Increases in contractility arise from drugs such as positive inotropes.64
Cardiac Output
The variety of cardiac output measurement techniques has grown over the past decade65 since the development of thermodilution pulmonary artery catheters, pulse-induced contour devices and less invasive techniques such as Doppler. As many critically ill patients require mechanical ventilation support, the associated rises in intrathoracic pressure, as well as changing ventricular compliance, make accurate haemodynamic assessment difficult with the older technologies. Therefore, volumetric measurements of preload, such as right ventricular end-systolic volume (RVESV), right ventricular end-diastolic volume (RVEDV) and index (RVESVI/RVEDVI) as well as measurements of right ventricular ejection fraction (RVEF) are now being used to more accurately determine cardiac output. The parameters RVEF, CO and/or CI, and stroke volume (SV) are generated using thermodilution technology, and from these the parameters of RVEDV/RVEDVI and RVESV/RVESVI can be calculated (see Table 9.4 for normal values).10 The availability of continuous modes of assessment has further improved a clinician’s ability to effectively treat these patients.10
The Fick principle
Several cardiac output measurement methods use the Fick principle. In 1870, Fick proposed that ‘in an organ, the uptake or release of an indicator substance is the product of the arterial-venous concentration of this substance and the blood flow to the organ’.66 Using oxygen as the indicator substance, the calculation of cardiac output is as follows:
Thermodilution methods
Thermodilution methods calculate cardiac output by using temperature change as the indicator in Fick’s method. Cardiac output and associated pressures such as global end-diastolic volume40 can be calculated using a thermodilution PA catheter. Cardiac output can be monitored intermittently or continuously using the PA catheter. Intermittent measurements obtained every few hours produce a snapshot of the cardiovascular state over that time. By injecting a bolus of 5–10 mL of crystalloid solution, and measuring the resulting temperature changes, an estimation of stroke volume is calculated. Cold injectate (run through ice) was initially recommended, but studies now support the use of room temperature injectate, providing there is a difference of 12° Celsius between injectate and blood temperature.67 Three readings are taken at the same part of the respiratory cycle (normally end expiration), and any measurements that differ by more than 10% should be disregarded (see Table 9.4 for normal values). Since the 1990s, the value of having continuous measurement of cardiac output has been recognised49 and this has led to the development of devices which permit the transference of pulses of thermal energy to pulmonary artery blood – the pulse-induced contour method.61
Pulse-induced contour cardiac output
Pulse-induced contour cardiac output (PiCCO) provides continuous assessment of CO, and requires a central venous line and an arterial line with a thermistor (not a PAC).68 A known volume of thermal indicator (usually room temperature saline) is injected into the central vein. The injectate disperses both volumetrically and thermally within the cardiac and pulmonary blood. When the thermal signal is detected by the arterial thermistor, the temperature difference is calculated and a dissipation curve generated.69 From these data, the cardiac output can be calculated. These continuous cardiac output measurements have been well researched over the past 10 years and appear to be equal in accuracy to intermittent injections required for the earlier catheters.65,70,71 The parameters measured by PiCCO68 include:
• Pulse-induced contour cardiac output: derived normal value for cardiac index 2.5–4.2 L/min/m2.
• Global end-diastolic volume (GEDV): the volume of blood contained in the four chambers of the heart; assists in the calculation of intrathoracic blood volume. Derived normal value for global end-diastolic blood volume index 680–800 mL/m2.
• Intrathoracic blood volume (ITBV): the volume of the four chambers of the heart plus the blood volume in the pulmonary vessels; more accurately reflects circulating blood volumes, particularly when a patient is artificially ventilated. Derived normal value for intrathoracic blood volume index 850–1000 mL/m2.
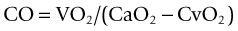
• Extravascular lung water (EVLW): the amount of water content in the lungs; allows quantification of the degree of pulmonary oedema (not evident with X-ray or blood gases). Derived normal value for extravascular lung water index is 3–7 mL/kg. EVLW has been shown to be useful as a guide for fluid management in critically ill patients.67 An elevated EVLW may be an effective indicator of severity of illness, particularly after acute lung injury or in ARDS, when EVLW is elevated due to alterations in hydrostatic pressures.72 Other patients at risk of high EVLW are those with left heart failure, severe pneumonia, and burns. There may be an association between a high EVLW and increased mortality, the need for mechanical ventilation and a higher risk of nosocomial infection.72 A decision tree outlining processes of care guided by information provided by PiCCO is provided in Figure 9.22.
PiCCO removes the impact of factors that can cause variability in the standard approach of cardiac output measurement, such as injectate volume and temperature, and timing of the injection within the respiratory cycle.73 The additional fluid volume injected with the standard technique is significant in some patients; with the continuous technology this is eliminated. A further advantage is that virtually real-time responses to treatment can be obtained, removing the time delay that was a potential problem with standard thermodilution techniques.61
PiCCO preload indicators of intrathoracic blood volume (ITBV) and global end-diastolic volume (GEDV) are more sensitive and specific to cardiac preload than the standard cardiac filling pressures of CVP and PCWP, as well as right ventricular end-diastolic volume.40 One advantage of ITBV and GEDV is that they are not affected by mechanical ventilation and therefore give correct information on the preload status under almost any condition. Extravascular lung water correlates moderately well with severity of ARDS, length of ventilation days, ICU stay and mortality,74 and appears to be of greater accuracy than the traditional assessment of lung oedema by chest X-ray. Disadvantages of PiCCO include its potential unreliability when heart rate, blood pressure and total vascular resistance change substantially.10,68
Doppler ultrasound methods
Oesophageal Doppler monitoring enables calculation of cardiac output from assessment of stroke volume and heart rate, but uses a less invasive technique than those outlined previously.75 Stroke volume is assessed by measuring the flow velocity and the area through which the forward flow travels. Flow velocity is the distance one red blood cell travels forward in one cardiac cycle, and the measurement provides a time velocity interval (TVI). The area of flow is calculated by measuring the cross-sectional area of the blood vessel or heart chamber at the site of the flow velocity management.76 Oesophageal Doppler monitoring can be performed at the level of the pulmonary artery, mitral valve or aortic valve.
Doppler principles are that the movement of blood produces a waveform that reflects blood flow velocity, in this case in the descending thoracic aorta, by capturing the change in frequency of an ultrasound beam as it reflects off a moving object (see Figure 9.23).23 This measurement is combined with an estimate of the aorta’s cross-sectional area for the stroke volume, cardiac output and cardiac index to be calculated, using the patient’s age, height and weight.77
Oesophageal Doppler monitoring provides an alternative for patients who would not benefit from PAC insertion,77 and can be used to provide continuous measurements under certain conditions: the estimate of cross-sectional area must be accurate; the ultrasound beam must be directed parallel to the flow of blood; and there should be minimal variation in movement of the beam between measurements. There is some debate at present among clinicians about the accuracy of Oesophageal Doppler monitoring when compared with thermodilution technique for calculating cardiac output.78–80 However, Australian research purports that this technology has become, and will continue to be, an invaluable tool in critical care.81 This form of monitoring can be used perioperatively and in the critical care unit, on a wide variety of patients. It should not, however, be used in patients with aortic coarctation or dissection, oesophageal malignancy or perforation, severe bleeding problems, or with patients on an intra-aortic balloon pump.77
The Doppler probe that sits in the oesophagus is approximately the size of a nasogastric tube, is semirigid and is inserted using a similar technique.77 The patient is usually sedated but it has been used in awake patients.82 In such cases, however, the limitation is that the probe is more likely to require more frequent repositioning.76
The waveform that is displayed on the monitor is triangular in shape (see Figure 9.23) and captures the systolic portion of the cardiac cycle – an upstroke at the beginning of systole, the peak reflecting maximum systole, and the downward slope of the ending of systole. The waveform captures real-time changes in blood flow and can therefore be seen as an indirect reflection of left ventricular function.83 Changes to haemodynamic status will be reflected in alterations in the triangular shape (see Figure 9.23).
Ultrasonic cardiac output monitor
Introduced in 2001 in Australia, the Ultrasonic cardiac output monitor (USCOM) monitors CO non-invasively using continuous doppler ultrasound wave by placing a ultrasound transducer probe supra- or parasternally. The principles of CO calculation in this method is the same as Oesophageal Doppler monitoring. Empirical study suggests that the use of non-invasive USCOM provided adequate clinical data in patients in different shock categories and it was safe and cost effective.84
Impedance cardiography
Transthoracic bioimpedance (impedance cardiography) is another form of non-invasive monitoring used to estimate cardiac output, and was first introduced by Kubicek in 1966.85 It measures the amount of electrical resistance generated by the thorax to high-frequency, very-low-magnitude currents. This measure is inversely proportional to the content of fluid in the thorax: if the amount of thoracic fluid increases, then transthoracic bioimpedance falls.23 Changes in cardiac output can be reflected as a change in overall bioimpedance. The technique requires six electrodes to be positioned on the patient: two in the upper thorax/neck area, and four in the lower thorax. These electrodes also monitor electrical signals from the heart.
Overall, transthoracic bioimpedance is determined by: (a) changes in tissue fluid volume; (b) volumetric changes in pulmonary and venous blood caused by respiration; and (c) volumetric changes in aortic blood flow produced by myocardial contractility.86 Accurate measurements of changes in aortic blood flow are dependent on the ability to measure the third determinant, while filtering out any interference produced by the first two determinants. Any changes to position or to electrode contact will cause alterations to the measurements obtained, and recordings should therefore be undertaken with the electrodes positioned in the same location as previous readings. Caution is required for patients with high levels of perspiration (which reduces electrode contact), atrial fibrillation (irregular R–R intervals makes estimation of the ventricular ejection time difficult), or pulmonary oedema, pleural effusions or chest wall oedema (which alter bioimpedance readings irrespective of any changes in cardiac output). The use of transthoracic bioimpedance in critically ill patients is variable, due in part to limitations of its usefulness in patients who have pulmonary oedema.87,88
Diagnostics
Apart from the haemodynamic monitoring methods to facilitate cardiac assessment of patients’ clinical condition, a variety of diagnostic tests are often used. Echocardiography and blood tests are the most commonly used in critical care. Other tests such as Computerised Tomography (CT) and Nuclear medicine cardiac examination are also used when indicated. Exercise stress tests and cardiac angiography are also used and are reviewed in Chapter 10.
Echocardiography
Echocardiography (shortened to ECHO) is often used in critical care to assess patients’ cardiovascular conditions such as heart failure, hypertensive heart disease, valve disease, and pericardial disease in critically ill patients. It adopts a technique of detecting the echoes produced by a heart from a beam of very high frequency sound – the ultrasound. Two dimensional, three dimensional and contrast ECHO images can be obtained using non-invasive transthoracic technique or the invasive trans-oesophageal technique (TOE). The transthoracic ECHO uses a transducer probe externally to the heart to obtain images (same as a normal ultrasound technique). This method is painless and does not require sedation. The TOE technique involves placing a transducer probe into the oesophageal cavity to assess the function and structure of the heart. This method produces better images of the heart than the normal ECHO.66 However this method requires sedation during the procedure and the patient needs to fast for a few hours prior to the examination.
Two-dimensional ECHO images are valuable resources for assessment of the function and structure of the heart. Three dimensional images offer more realistic visualisation of the heart’s structure and function. The contrast ECHO provides enhanced images of left and right ventricular definition to facilitate the diagnosis of complex cardiac conditions such as congenital heart defects, valve stenosis and regurgitation.83,89,90 The contrast ECHO technique uses gas air microbubbles, produced by hand-agitating a syringe containing 10 mL of normal saline with a small amount of air, injected into the peripheral vein to produce images of the heart functions.66
Blood Tests
Full Blood Count
The full blood count (FBC) assesses the status of three major cells that are formed in the bone marrow: red blood cells (RBC), white blood cells (WBC) and platelets. Although normal values have been given (see Appendix C), for critically ill patients changes will occur in certain conditions. For example, Hb is reduced in the presence of haemorrhage and also in acute fluid overload causing haemodilution.
Haemoconcentration can occur during acute dehydration, which would show as a high Hb. Similar conditions will also affect the haematocrit. WBC levels will be elevated during episodes of infection, tissue damage and inflammation. When infections are severe, the full blood count will show a dramatic rise in the number of immature neutrophils. Platelets are easily lost during haemorrhage, and spontaneous bleeding is a danger when the count falls to below 20 × 109/L.91,92

Cardiac Enzymes
Recent studies have revealed that cardiac troponin levels are elevated in critically ill septic patients who do not have evidence of MI. Further, mortality rates are higher in troponin-positive patients than in those who are troponin-negative, suggesting that this may become an important enzyme to measure; however, more research is still required to refine the testing.93,94 For patients with suspected acute myocardial infarction, testing of the enzyme troponin T or I is now standard. But not all critically ill patients with elevated cardiac troponin levels should be treated as having myocardial infarction unless there is support from other data.95 All injured cells release enzymes, and by measuring the levels of enzymes it is possible to determine which cells are damaged, thus aiding diagnosis. See Table 9.6 for cardiac enzyme parameters and normal values. For abnormal cardiac enzymes in myocardial infarction, please refer to Chapter 10.
| Enzyme | Description | Normal value |
|---|---|---|
| Troponin T | Detected within 4–6 hours of infarction, peaking in 10–24 hours. | not normally detected |
| Creatine kinase (CK) | Levels of CK are raised in diseases affecting skeletal muscle. It can be used to detect carrier status for Duchenne muscular dystrophy, although not all carriers have increased levels.CK-MB is the first of cardiac enzymes to rise, levels peaking in 24 hours but returning to normal within 2–3 days. | Adult female: 30–180 U/LAdult male: 60–220 U/L |
| CK-MB: 0–5% of total CK | ||
| Aspartate aminotransferase (AST) | Detection and monitoring of liver cell damage. No cardiac-specific isoenzymes; today rarely used because it is released after renal, cerebral and hepatic damage. | <40 U/L |
| Lactate dehydrogenase (LDH) | Of no value in the diagnosis of myocardial infarction. Occasionally useful in the assessment of patients with liver disease or malignancy (especially lymphoma, seminoma, hepatic metastases); anaemia when haemolysis or ineffective erythropoiesis suspected. Although it may be elevated in patients with skeletal muscle damage, it is not useful in this situation. Post-AMI, cardiac-specific isoenzyme LDH1 peaks between 48 and 72 hours. | 110–230 U/L |
| D-Dimer | Presence indicates deep vein thrombosis, myocardial infarction, DIC | <0.25 ng/L |
DIC = disseminated intravascular coagulation.
Chest X-Ray
Chest X-ray is the oldest non-invasive way to visualise the images of the heart and blood vessels, and is one of the most commonly taken diagnostic procedures in critical care. To interpret a chest X-ray for cardiac diagnosis, the basic knowledge of the normal anatomical cardiac structure is important to identify abnormality, and basic understanding of the how chest X-ray works is essential. Please review the basic concepts, such as what water, air and bone show on X-ray, and the concepts of AP and PA films, in Chapter 13 before you move on to the next section.
Cardiac Chest X-ray Interpretation
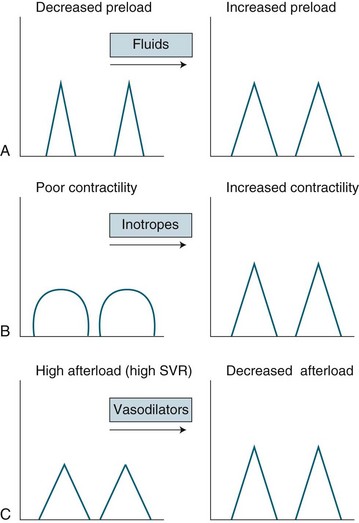
1. First the heart size needs to be checked to see if the size of the heart is appropriate. The cardiac silhouette should be no more than 50% of the diameter of the thorax, this is called the cardiothoracic ratio.96 The position of the heart should be  of heart shadow to the right of the vertebrae and
  of the shadow to the left of the vertebrae.93 The size of the heart can be determined in a matter of seconds even for the novice clinician, since this can be simply determined by visualising the cardiothoracic ratio.
2. The shape of the heart should be inspected next on the film once the size of the heart was inspected. The border of the heart on the X-ray film is determined by the heart anatomy. The border is formed by: the right atrial shadow as the right convex cardiac border; the superior vena cava as the superior border; and the left ventricle as the left heart border and cardiac apex. In the frontal chest X-ray, the right ventricle is not a border-forming structure because it is directly superimposed on the cardiac silhouette. Similarly, the normal left atrium should not be visible on a posteroanterior (PA) film. The border of the heart should be sharp. If the left atrium becomes enlarged, it shows a convex superior left heart border.96
3. The next step should move to the superior border to identify the aortic arch and the pulmonary arteries. The aortic arch is called the knob. The pulmonary arteries and the branches radiate outward from the hili (see Figure 9.24). The hilum in the mediasternal region is formed by the pulmonary arteries and the main stem bronchi shadows on the film. The focus of this step is to check for prominence of vessels in this region, as this suggests vascular abnormalities.97
Chest X-ray in Diagnosing Cardiac Conditions
For coronary heart disease assessment, an initial chest X-ray film is useful to exclude other causes of chest pain, such as pneumonia, pneumothorax and aortic aneurysm, and to assess whether heart failure and/or pulmonary congestion are present. Patients with chronic heart failure show cardiomegaly, Kerby B lines or pulmonary oedema. Cardiomegaly is the enlarged heart on the X-ray film. Kerby B lines on the X-ray film is the result of pulmonary congestion and fluid accumulation in the interstitium. Although cardiomegaly and pulmonary oedema indicate heart failure, the chest X-ray alone cannot diagnose the condition. Other forms of tests are needed to thoroughly assess the patients for accurate diagnosis.98
A widened mediastinum and abnormal aortic contour may indicate aortic dissection. Similar to heart failure, further tests such as TOE, MRI or angiography are needed to confirm the diagnosis. Subtle abnormalities in the hilar region may indicate pulmonary hypertension (PAH). A decrease in pulmonary vascular markings and prominent main and hilar pulmonary arterial shadows in the lung fields on the chest film are classic signs of pulmonary hypertension. However the sensitivity of this for excluding PAH is lacking.99 In pericardial disease, the chest X-ray often appears normal unless the accumulated fluid in the pericardial space is over 250 mL. Note that accumulation of fluid is indicated in many cardiac conditions therefore other tests need to be carried out to confirm the diagnosis.100
The position of a Pulmonary Artery Catheter, a Central Venous Catheter, and pacing wires can be identified on the chest X-ray. The position of these catheters need to be checked regularly to ensure the catheters and wires are in appropriate places. More details on how to identify the catheters and pacing wires are in Chapter 13.
Due to the individual variations in shape, size and rotation of the heart, and the complexity of cardiac signs, chest X-rays often play a minor role in cardiac diagnosis. A patient’s clinical condition and other diagnostic test results must be taken into account when diagnosing a cardiac condition.99,101
X-Ray Computed Tomography, Magnetic Resonance Imaging (MRI) and Nuclear Medicine Studies of the Heart
Since 2000, more non-invasive imaging diagnostic techniques are used to aid cardiac assessment. Some of these techniques have shown significant advantages, such as lowered cost, but they also have their limitations.66
Cardiac Computed Tomography
Cardiac computed tomography (cardiac CT) is a recent development in diagnosing cardiac conditions such as suspected coronary heart disease, and in the evaluation of coronary artery bypass grafts. It provides a method to visualise the anatomical structure of the heart and coronary arteries reliably and accurately in patients.102 However, limitations remain with this method including the inability to assess the haemodynamic relevance of a coronary artery lesion. In addition, the most appropriate radiation and contrast dose have not been determined.103
Magnetic Resonance Imaging
Magnetic resonance imaging (MRI) is a non-invasive method that can provide cardiac-specific biochemical information such as tissue integrity, cardiac aneurysms, ejection fraction, and cardiac output. These techniques are sometimes considered superior to radiography and ultrasound examination methods because the MRI is not affected by bone structure. The techniques include perfusion imaging, atherosclerosis imaging and coronary artery imaging.104 MRI is considered an accurate method to predict the presence of significant coronary artery disease.105 However, MRI use in critically ill patients has its limitations. Because of the magnetic field required for this method, the patient cannot be fitted with any pumps or machines that have metal parts in them. Organising appropriate equipment for the critically ill patients who are undergoing this test can be a challenge.
Nuclear Medicine Cardiac Studies
There are several types of radionuclide imaging methods available to assess a patient’s cardiac information, including the radionuclide isotopes, thallium scan and stress test radionuclide scan.17 The purpose of radionuclide imaging is to assess the perfusion status of cardiac muscle. When lowered perfusion in cardiac muscle is identified this may indicate heart muscle damage. Radionuclide imaging is often used in patients who have been diagnosed with a myocardial infarction and further investigation is required to determine if interventions such as cardiac stent or coronary artery bypass surgery are likely to benefit the patient.
Nursing Care of Patients Undergoing Cardiac CT, MRI and Nuclear Medicine Studies
• Patient’s allergy profile in relation to imaging contrast needs to be evaluated before the requests are made.
• These tests all require the patient to lie still for certain periods of time, therefore sedation may be required during the procedure.
• Appropriate equipment, such as non-metal equipment, needs to be organised beforehand if the patient is having an MRI study.
Summary
Case study
Relevant past medical history included:
Admitted to hospital 2 days ago following collapse:
• with a 4-day history of fever, sweats and rigors
• anorexic: only able to drink 5–6 glasses fluid per day
• lethargic: able to carry out ADLs with effort
• passing dark urine and pale stools frequently
• denied abdominal pain, jaundice, haematuria, prodromal or presyncopal symptoms
In the emergency department the patient observations were as follows:
• HR 126/min, Sinus tachycardia
• Body temp 37.9–38.1°C per axilla
• jugular venous pressure noted as normal
• heart sounds audable S1, S2 and considered normal
• hepatomegaly – (non-tender) 16 cm
• urinalysis showed protein +++ and large amount of blood
• intravenous fluids were commenced and the patient was transferred to a medical ward
Key events during hospitalisation
Learning activities
Learning activities 1–4 relate to the case study.
1. Consider the case study and discuss why haemodynamic monitoring is important for this patient’s management. Include consideration of the aspects of haemodynamic monitoring that provide particular benefit in this specific case.
2. Describe the rationale of inserting a central line when the patient was first admitted to ICU. What are the complications of central line insertion and what strategies can you implement to reduce the likelihood of those complications?
3. What are the key points to remember when interpreting haemodynamic monitoring results in a patient receiving mechanical ventilation?
4. Consider the indications for PAP monitoring, and explain why PAP monitoring was beneficial for this patient’s management.
American Heart Foundation. www.americanheart.org.
Australian Institute of Health and Welfare. www.aihw.gov.au.
National Heart Foundation of Australia. www.heartfoundation.org.au.
Australian College of Critical Care Nurses. www.acccn.com.au.
Australian and New Zealand Intensive Care Society. www.anzics.com.au.
British Association of Critical Care Nurses. www.baccn.org.uk.
Critical Care Forum. www.ccforum.com/home.
1 McCance K, Brashers VL. Structure and function of the cardiovascular and lymphatic systems. In: Huether SE, McCance K. Understanding pathophysiology. St. Louis, Mo: Mosby, 2008.
2 Copstead L. Pathophysiology, 3rd edn. St. Louis, Mo.: Elsevier Saunders; 2005.
3 Novak B, Filer L, Hatchett R. The applied anatomy and physiology of the cardiovascular system. In: Hatchett R, Thompson D. Cardiac nursing: a comprehensive guide. Philadelphia: Churchill Livingstone Elsevier, 2002.
4 Guyton AC. Textbook of medical physiology, 11th edn. Philadelphia: Elsiever: Saunders; 2006.
5 Urden L, Stacy KL, Lough ME. Thelan’s critical care nursing: diagnosis and management, 5th edn, St Louis: Mosby/Elsevier, 2006.
6 Campbell AM, Hulf JA. Aspects of myocardial physiology. Update in Anaesthesia. 18(Article 14), 2004. Available from [serial on the Internet] http://www.nda.ox.ac.uk/wfsa/html/u18/u1814_01.htm
7 Bersten AD, Soni N, Oh TE. Oh’s intensive care manual, 6th edn. Oxford: Butterworth-Heinemann; 2009.
8 Johns CI, Gallagher R. Nursing management: arrhythmias. In: Brown D, Edwards H. Lewis’ medical and surgical nursing. Sydney: Mosby/Elsevier, 2005.
9 Elliott D. Shock. In: Romanini J, Daly J. Critical care nursing. Sydney: Harcourt Brace: Australian perspectives; 1994:687.
10 Leeper B. Monitoring right ventricular volumes: a paradigm shift. AACN Clinical Issues. 2003;14(2):208–219.
11 Sugerman RA. Structure and function of the neurological system. McClance KL, Huether SE, Brasher VL, Rote NS. Pathophysiology: the biological basis for disease in adults and children, 6th edn, Maryland Heights: Mosby Elsevier, 2010.
12 Johnson K, Rawlings-Anderson K. Oxford handbook of cardiac nursing. New York: Oxford University Press; 2007.
13 Australian and New Zealand College of Intensive Care Medicine. Minimum standards for intensive care units. [Cited Jan 2011.] Available from http://www.cicm.org.au/cmsfiles/IC-1%20Minimum%20Standards%20for%20Intensive%20Care%20Units.pdf
14 Drew BJ, Califf RM, Funk M, Kaufman ES, Krucoff MW, et al. Practice standards for electrocardiographic monitoring in hospital settings: an American Heart Association scientific statement from the Councils on Cardiovascular Nursing, Clinical Cardiology, and Cardiovascular Disease in the Young: Endorsed by the International Society of Computerized Electrocardiology and the American Association of Critical-Care Nurses. Circulation. 2004;110(17):2721–2726.
15 Jacobson C. Bedside cardiac monitoring. Critical Care Nurse. 2003;23(6):71–73.
16 Shoemaker WC. Routine clinical monitoring in acute illness. In: Shoemaker WC, Vehmohos GC, Demetridas D. Procedure and monitoring for the critically ill. Philadelphia: W.B. Saunders; 2002:155–166.
17 Urden L, Stacy KL, Lough ME. Critical care nursing: diagnosis and management, 6th edn, St Louis: Mosby/Elsevier, 2010.
18 Conover MB. Understanding electrocardiography, 8th edn. St Louis: Mosby; 2003.
19 Morris F, Brady WJ. Clinical review: ABC of clinical electrocardiography. Acute myocardial infarction – Part I. BMJ. 2002;324:831–834.
20 Americal Heart Association. Myocardial ischemia, injury and infarction. Available from http://www.americanheart.org/presenter.jhtml?identifier=251, 2008.
21 Raistin AM, Soars L. Nursing assessment: cardiovascular system. In: Brown D, Edwards H. Lewis’ medical-surgical nursing. Sydney: Mosby/Elsevier, 2005.
22 Aitken LM. Critical care nurses’ use of decision-making strategies. J Clin Nurs. 2003;12(4):476–483.
23 Chaney JC, Derdak S. Minimally invasive haemodynamic monitoring for the intensivist: current and emerging technology. Crit Care Med. 2002;30(10):2338–2345.
24 Pinsky MR. Rationale for cardiovascular monitoring. Curr Opin Crit Care. 2003;9(3):222–224.
25 Dietz B, Smith TT. Enhancing the accuracy of haemodynamic monitoring. J Nurs Care Qual. 2002;17(1):27–34.
26 Rice WP, Fernandez EG, Jarog D, Jensen A. A comparison of hydrostatic leveling methods in invasive pressure monitoring. Crit Care Nurse. 2000;20(6):20–30.
27 McGhee BH, Bridges MEJ. Monitoring aterial blood pressure: what you may not know. Crit Care Nurse. 2002;22(2):60–79.
28 American Association of Critical Care Nurses (AACN). Pulmonary artery pressure monitoring. Available from www.aacn.org, 2004. [Cited July 2010]
29 Quaal SJ. Improving the accuracy of pulmonary artery catheter measurements. J Cardiovas Nurs. 2001;15(2):71–82.
30 Australian Council of Health Care Standards. Intensive Care Indicators Version 3. Available at http://www.achs.org.au/, 2006. [Cited Jan 2011]
31 Intensive Care Clinical Advisory Group. Intensive care services in New Zealand: a report to the Deputy Director-General, Clinical Services. Wellington: Ministry of Health; 2005.
32 O’Sullivan J, Allen J, Murray A. The forgotten Korotkoff phases: how often are phases II and III present and how often do they relate to the other Korotkoff phases? Am J Hypertension. 2002;15(3):264–268.
33 Dobbin KR. Non-invasive blood pressure monitoring. Crit Care Nurse. 2002;22(2):123–124.
34 Hung DT, Lilly CM. Making the most of hemodynamic monitoring in the ICU: observing and optimizing appropriate parameters. J Crit Illness. 2003;18(5):198–208.
35 Imperial-Perez F, McRae M. Arterial pressure monitoring. Crit Care Nurse. 2002;22(1):70–72.
36 Chatfield D, Rees-Padlar S. Jugular venous oxygen saturation: is it relevant to the nurse? Nurs Crit Care. 2001;6(4):187–191.
37 Woodrow P. Central venous catheters and central venous pressure. Nurs Stand. 2002;16(26):45–51.
38 Bellomo R, Uchino S. Cardiovascular monitoring tools: use and misuse. Curr Opin Crit Care. 2003;9(3):225–229.
39 Kumar A, Anel R, Bunnell E, Habet K, Zanotti S, et al. Pulmonary artery occlusion pressure and central venous pressure fail to predict ventricular filling volume, cardiac performance, or the response to volume infusion in normal subjects. Crit Care Med. 2004;32(3):691–699.
40 Michard F, Alaya S, Zarka V, Bahloul M, Richard C, Teboul JL. Global end-diastolic volume as an indicator of cardiac preload in patients with septic shock. Chest. 2003;124(5):1900–1908.
41 Weyland A, Grune F. Cardiac preload and central venous pressure. Anaesthetist. 2009;58(5):506–512.
42 Pinsky MR. Functional hemodynamic monitoring. Intens Care Med. 2002;28(4):392–398.
43 Schummer W. Central venous pressure. Validity, informative value and correct measurement. Anaesthetist. 2009;58(5):499–505.
44 McGee DC, Gould MK. Current concepts: preventing complications of central venous catheterization. N Eng J Med. 2003;348(12):1123–1133.
45 Truwit JD. Technique and measurements: getting a line on the hemodynamic undercurrent. J Crit Illness. 2003;18(1):9–20.
46 Ruesch S, Walder B, Tramèr MR. Complications of central venous catheters: internal jugular versus subclavian access – a systematic review. Crit Care Med. 2003;30(2):454–460.
47 Rubinson L, Diette GB. Best practices for insertion of central venous catheters in intensive care units to prevent catheter-related bloodstream infections. J Lab Clin Med. 2004;143(1):5–13.
48 Swanz HJ, Ganz W, Forrester J, Marcus H, Diamond G, Chonette D. Catheterisation of the heart in man with use of flow-directed balloon-tipped catheter. N Eng J Med. 1970;283(9):447–451.
49 Truwit JD. The pulmonary artery catheter in the ICU, part 2: clinical applications; how to interpret the hemodynamic picture. J Crit Illness. 2003;18(2):63–71.
50 Dalen JE, Bone RC. Is it time to pull the pulmonary artery catheter? JAMA. 1996;276(11):916–918.
51 Prentice D, Ahrens T. Controversies in the use of the pulmonary artery catheter. J Cardiovas Nurs. 2001;15(2):1–5.
52 Society of Critical Care Medicine. Pulmonary Artery Catheter Consenus conference. Consensus statement. Crit Care Med. 1997;25(6):910–925.
53 Chittock DR, Dhingra VK, Ronco JJ, Russell JA, Forrest DM, et al. Severity of illness and risk of death associated with pulmonary artery catheter use. Crit Care Med. 2004;32(4):911–915.
54 Harvey S, Harrison D, Singer M, Ashcroft J, Jones CM, et al. Assessment of the clinical effectiveness of pulmonary artery catheters in management of patients in intensive care (PAC-Man): a randomized controlled trial. Lancet. 2005;366:472–477.
55 Harvey S, Young D, Brampton W, Cooper A, Doig GS, et al. Pulmonary artery catheters for adult patients in intensive care. Cochrane Database of Systematic Reviews. (3):2006.
56 Cruz K, Franklin C. The pulmonary artery catheter: uses and controversies. Crit Care Clinics. 2001;17(2):271–291.
57 Bridges EJ. Pulmonary artery pressure monitoring: when, how, and what else to use. AACN Adv Crit Care. 2006;17(3):286–303.
58 Woodrow P. Intensive care nursing. London: Routledge; 2000.
59 Bowdle TA. Complications of invasive monitoring. Anaesthesiology Clinics N Am. 2002;20(3):571–578.
60 Ritzema J, Troughton R, Melton I, Crozier I, Doughty R, et al. Physician-directed patient self-management of left atrial pressure in advanced chronic heart failure. Circulation. 2010;121(9):1086–1095.
61 Ott K, Johnson K, Ahrens T. New technologies in the assessment of hemodynamic parameters. J Cardiovascular Nurs. 2001;15(2):41–55.
62 Carelock J, Clark AP. Heart failure: pathophysiologic mechanisms. Am J Nurs. 2001;101(12):26–33.
63 Rodgers JM, Reeder SJ. Current therapies in the management of systolic and diastolic dysfunction. Dimensions Crit Care Nurs. 2001;20(6):2–10.
64 Lough ME. Cardiovascular assessment and diagnostic procedures. In: Urden L, Stacy KL, Lough ME. Priorities in critical care nursing. St Louis: Mosby, 2004.
65 Gödje O, Höke K, Goetz AE, Felbinger TW, Reuter DA, et al. Reliability of a new algorithm for continuous cardiac output determination by pulsecontour analysis during hemodynamic instability. Crit Care Med. 2002;30(1):52–58.
66 Moser DK, Reigel B. Cardiac nursing: a companion to Brauwald’s heart disease. St Louis: Elsevier; 2008.
67 Faybik P, Hetz H, Baker A, Yankovskaya E, Krenn CG, Steltzer H. Iced versus room temperature injectate for assessment of cardiac output, intrathoracic blood volume and extravascular lung water by single transpulmonary thermodilution. J Crit Care. 2004;19(2):103–107.
68 Cottis R, Magee N, Higgins DJ. Haemodynamic monitoring with pulse-induced contour cardiac output (PiCCO) in critical care. Intens Crit Care Nurs. 2003;19(5):301–307.
69 Salukhe TV, Wyncoll DL. Volumetric haemodynamic monitoring and continuous pulse contour analysis: an untapped resource for coronary and high dependency care units? Brit J Cardiology (Acute and Interventional Cardiology). 2002;9(1):20–25.
70 Gödje O, Friedl R, Hannekum A. Accuracy of beat-to-beat cardiac output monitoring by pulse contour analysis in hemodynamical unstable patients. Med Sci Monitor. 2001;7(6):1344–1350.
71 Hofer CK, Bulmann S, Jaeggi P, Genoni M, Zollinger A. Cardiac output measurement after cardiac surgery: Thermodilution compared with two alternative methods. Euro J Anaesthesiol. 2002;19(Suppl. 27):9–11.
72 Chung F-T, Lin S-M, Lin S-Y, Lin H-C. Impact of extravascular lung water index on outcomes of severe sepsis patients in a medical intensive care unit. Resp Med. 2008;102(7):956–961.
73 Jansen JJ. The thermodilution method for the clinical assessment of cardiac output. Intens Care Med. 1995;21(8):691–697.
74 Martin GS, Eaton S, Mealer M, Moss M. Extravascular lung water in patients with severe sepsis: a prospective cohort study. Crit Care. 2005;9(2):74–82.
75 King S, Lim T. The use of the oesophageal Doppler monitor in the intensive care unit. Crit Care Resusc. 2004;6(2):113–122.
76 Hett A, Jonas MM. Non-invasive cardiac output monitoring. Intens Crit Care Nurs. 2004;20(2):103–108.
77 Turner MA. Doppler-based haemodynamic monitoring. AACN Clinical Issues. 2003;14(2):220–231.
78 Bein B, Renner J, Tonner PH. Transoesophageal echocardiography for the determination of cardiac output: beware of improper comparisons. Anaesthesia. 2005;60(5):512–514.
79 Engoren M, Barbee D. Comparison of cardiac output determined by bioimpedance, thermodilution and the Fick method. Am J Crit Care. 2005;14(1):40–45.
80 Bettex DA, Hinselmann V, Hellermann JP, Jenni R, Schmid ER. Transoesophageal echocardiography is unreliable for cardiac output assessment after cardiac surgery compared with thermodilution. Anaesthesia. 2004;59(12):1184–1192.
81 McLean AS. Transoesophageal echocardiography in the intensive care unit. Anaesthesia Intens Care. 1998;26(1):22–25.
82 Atlas G, Mort T. Placement of the esophageal Doppler ultrasound probe in awake patients. Chest. 2001;119(1):319.
83 Miyagawa S, Masai T, Fukuda H, Yamauchi T, Iwakura K, Itoh H, et al. Coronary microcirculatory dysfunction in aortic stenosis: myocardial contrast echocardiography study. Annals Thoracic Surg. 2009;87:715–719.
84 Haas LEM, Tjan DHT, van Wees J, van Zanten ARH, eds. Validation of the USCOM-1A cardiac output monitor in hemodynamic unstable intensive care patients. Conference Paper: Annual Intensive Care Society Congress, Netherlands; 2006.
85 Lasater M, VonRueden KT. Outpatient cardiovascular management utilizing impedance cardiography. AACN Clinical Issues. 2003;14(2):240–250.
86 Albert NM. Bioimpedance cardiography measurements of cardiac output and other cardiovascular parameters. Crit Care Nursing Clinics N Am. 2006;18(2):195–202.
87 Sageman WS, Riffenburgh RH, Spiess BD. Equivalence of bioimpedance and thermodilution in measuring cardiac index after cardiac surgery. J Cardiothoracic Vascular Anesthesia. 2002;16(1):8–14.
88 Raaijmakers E, Faes TJ, Scholten RJ, Goovaerts HG, Heethaar RM. A meta-analysis of three decades of validating thoracic impedance cardiography. Crit Care Med. 1999;27(6):1203–1213.
89 Almeida AG, Sargento L, Gabriel HM, da Costa JM, Morais J, et al. Evaluation of aortic stenosis severity: role of contrast echocardiography in comparison with conventional echocardiography and cardiac catheterization. Portuguese J Cardiology. 2002;21(5):555–572.
90 Baumgartner H, Hung J, Bermejo J, Chambers JB, Evangelista A, et al. Echocardiographic assessment of valve stenosis: EAE/ASE Recommendations for clinical practice. Morrisville, NC: American Society of Echocardiography; 2010.
91 Royal College of Pathoiogists Australasia. RCPA manual. Version 46. Available at http://www.rcpa.edu.au/Publications/RCPAManual.htm., 2011. [Cited March 2011]
92 Pagana KD. Mosby’s diagnostic and laboratory test reference, 8th edn. St Louis: Mosby/Elsevier; 2007.
93 Van Bockel EAP, Tulleken JE, Ligtenberg JJM, Zijlstra JG. Troponin in septic and critically ill patients. Chest. 2005;127(2):687–688.
94 Ammann P, Maggiorini M, Bertel O, Haenseler E, Joller-Jemelka HI, et al. Troponin as a risk factor for mortality in critically ill patients without acute coronary syndromes. J Am College Cardiol. 2003;41(11):2004–2009.
95 Klein-Gunnewiek JMK, Van der hoeven JG. Cardiac troponin elevations among critically ill patients. Curr Opin Crit Care. 2004;10:324–346.
96 Erkonen WE, Wilbur LS. Radiology 101: the basics and fundamentals of imaging, 3rd edn. Philadelphia, PA: Lippincott Williams & Wilkins; 2009.
97 Lareau C, Wootton J. The ‘frequently’ normal chest x-ray. Canadian J Rural Med. 2004;9(3):183–186.
98 Malcolm J, Arnold O. Heart Failure. The MERCK manual for healthcare professionals. Available from http://www.merckmanuals.com/professional/sec07/ch074/ch074a.html, 2009.
99 McGoon M, Gutterman D, Steen V, Barst R, McCrory DC, et al. Screening, early detection, and diagnosis of pulmonary arterial hypertension: ACCP evidence-based clinical practice guidelines. Chest. 2004;126(1 Suppl):S14–S34.
100 Parmet S, Lynm C, Glass RM. Pericarditis. JAMA. 2003;289(9):1194.
101 O’Brien T, Paul S. Chest x-ray and vascular studies. In: Taylor G, ed. Primary care management of heart disease. St Louis: Mosby, 2000.
102 Wijesekera NT, Duncan MK, Padley SPG. X-ray computed tomography of the heart. Brit Med Bull. 2010;93:49–67.
103 Ropers D. Multislice computer tomography for detection of coronary artery disease. J Interventional Cardiol. 2006;19:574–582.
104 Lima J, Desai M. Cardiovascular magnetic resonance imaging: current and emerging applications. J Am College Cardiol. 2004;44:1164–1171.
105 Paetsch I, Gebker R, Fleck E, Nagel E. Cardiac magnetic resonance imaging: a noninvasive tool for functional and morphological assessment of coronary artery diease: current clinical applications and potential future concepts. J Interventional Cardiol. 2003;16:457–463.
106 Lewis J. Fluid and electrolytes metabolism The MERCK manual for healthcare professionals. Available from http://www.merck.com/mmpe/sec12/ch156/ch156b.html, 2009.