Cardiovascular and pulmonary system health in populations with neurological disorders
After reading this chapter, the student or therapist will be able to:
1. Explain the physiological principles related to cardiovascular responses to exercise testing.
2. Discuss the evidence behind cardiovascular fitness and describe the factors that contribute to the deconditioned state in adults with neurological disorders.
3. Explain the adaptive responses to aerobic training in populations with neurological disorders and the factors underlying these responses.
4. Discuss general guidelines for designing exercise programs to improve cardiovascular health and fitness.
The cardiopulmonary health of individuals with residual movement dysfunction after a neurological insult is now regarded as a topic of interest in neurorehabilitation. In traditional practice, the state of the neuromuscular system preoccupied the attention of clinicians in the quest to optimize neurological recovery. Most interventions were based on strategies to improve the capacity of that system—an approach that has met with limited success in terms of restoring functional independence. It is now clear that recovery cannot be explained solely on the basis of improved neuromuscular function. For example, Roth and colleagues1 determined that less than one third of the variance in functional limitations after a stroke can be explained by the extent of neurological impairment. Nevertheless, the current approach to neurorehabilitation is somewhat puzzling. Evidence has accumulated indicating that many people with neurological disabilities are woefully deconditioned. There has been widespread acknowledgement of the central role that aerobic exercise plays in improving cardiopulmonary health and fitness. Furthermore, application of the principles of exercise physiology in cardiac rehabilitation has been widely endorsed. Yet neurorehabilitation clinicians have been observed to practice without full knowledge of their patients’ cardiac status or without monitoring heart rate (HR) and blood pressure (BP).2 Moreover, there is evidence to suggest that patients with neurological insults have not been challenged enough in therapy to induce the metabolic stress needed to enhance their cardiopulmonary fitness.3,4 A troubling explanation offered for these observations is that clinicians lack either an understanding or an appreciation of the basic physiological principles of exercise.5,6
This chapter begins with an overview of physiological principles related to cardiovascular responses to exercise testing. A summary of the evidence of cardiopulmonary fitness levels in adults and children with neurological disabilities is followed by a description of factors that contribute to the deconditioned state. Possible mechanisms responsible for reduced exercise capacity are then reviewed. Adaptive responses to aerobic training in patients with neurological conditions are examined, as are factors underlying these responses. The chapter closes with a summary of guidelines for the design of exercise programs that can be used to improve cardiopulmonary health and fitness. Appendix 30-A at the end of this chapter clearly identifies the meanings of the abbreviations used throughout the chapter.
Physiological responses to exercise
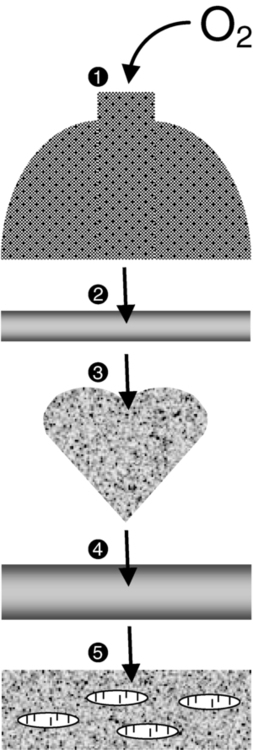
At rest the human body consumes roughly 3.5 mL of oxygen (O2) per kilogram per minute, or 1 metabolic equivalent (MET).7 In the resting state, skeletal muscle activity accounts for less than 20% of the body’s total energy expenditure; the brain, making up only 2% of body weight, also consumes 20% of the available O2.8 Activities at rest such as breathing and contracting of the heart can be sustained indefinitely because the power demands of these activities are met by the rate of energy turnover. In other words, these activities occur well below the critical power of the muscles, defined as the maximal rate of work that can be endured indefinitely.9 Any physical activity beyond the resting state requires more O2; the increase is dependent on the intensity of the effort involved. The rise in metabolism relies on O2 transport by the pulmonary and circulatory systems and O2 usage by the active skeletal, cardiac, and respiratory muscles to convert chemical potential energy to mechanical energy.10 The components of the O2 transport system are outlined in Figure 30-1.

Selective distribution of the increased blood flow to regions with heightened metabolic demands—the working muscles—is largely a result of local vasodilation mediated mainly by metabolites acting on the vascular smooth muscle (e.g., carbon dioxide [CO2], hydrogen ions [H+], nitric oxide, potassium ions, adenosine) and vasoconstriction in tissues with low metabolic demands.11 Blood flow to other vascular beds (e.g., renal and splanchnic bed) either is unchanged or decreases through active vasoconstriction resulting primarily from increased sympathetic discharge. Cerebral autoregulation maintains regional and total cerebral blood flow and normal tissue oxygenation over a wide range of BPs12; thus, cerebral blood flow and O2 delivery during exercise either remain stable13,14 or increase slightly.15,16 As exercise intensity increases, systolic BP (SBP) increases markedly, whereas diastolic BP (DBP) either remains unchanged or lowers slightly, resulting in a moderate increase in mean arterial pressure.17
Extraction of O2 from the muscle capillary blood to mitochondria is dependent on an adequate O2 diffusion gradient. During a progressive increase in workload, the arterial hemoglobin saturation and arterial O2 content remain relatively constant, whereas the venous O2 content decreases substantially as a result of increased O2 extraction in the active muscles.18 As the metabolic rate rises, the minute ventilation (i.e., respiratory rate multiplied by the tidal volume) increases to remove CO2 and to regulate pH balance of the active muscles. At low-intensity exercise, ventilation (mainly tidal volume) increases in a linear manner relative to the volume of O2 use (Vo2) and CO2 production (Vco2). Above the critical power, the energy demand of the muscle exceeds the capacity of the aerobic process to supply energy for muscle contraction; the additional energy is supplied by the anaerobic glycolytic system.
During more intense exercise, ventilation is extremely variable among individuals; the respiratory rate usually increases without a substantial change in tidal volume.17 The point at which the rate of glycolysis exceeds that of oxidative phosphorylation is called the anaerobic threshold (which approximates the ventilatory threshold or lactate threshold).17 Pyruvic acid is converted to lactic acid, which completely dissociates to lactate and H+, resulting in a rise in blood lactate levels and a fall in intramuscular pH. Exercise-induced muscular fatigue is caused by the exponential accumulation of lactate and a drop in intramuscular pH, with negative effects on the actin-myosin turnover rate, enzyme activities, and excitation-contraction coupling.
Maximal oxygen consumption (Vo2max) is defined as the highest O2 intake an individual can attain during physical work.17 The Fick equation describes the relationship between cardiovascular function and Vo2max:


Thus Vo2max reflects both O2 transport to the tissues and O2 usage by the tissues. Increases in Vo2 during exercise are caused by increases in both cardiac output and a-vO2diff, with HR and stroke volume (SV) increasing progressively over the lower third of the workload range. Thereafter, HR continues to increase while SV remains essentially constant,19,20 resulting, at maximal effort, in a cardiac output three to six times greater than baseline levels. An increase in SV (50% over resting volume) is caused by enhanced myocardial contractility and increased venous return resulting from compression of the veins by contracting muscles and reduced intrathoracic pressure.21 At low-intensity exercise the increase in HR is mainly a result of decreased vagal tone, but as exercise intensifies, sympathetic stimulation and circulating catecholamines play a greater role, yielding, at maximal workloads, a rise in HR 200% to 300% above the resting level.22
Measurement of cardiopulmonary fitness
Exercise (aerobic) capacity is the principal determinant of the ability to sustain the power requirements of repetitive physical activity. Vo2max is generally accepted as the definitive index of exercise capacity and cardiopulmonary fitness.23 Vo2max is a relatively stable measurement; variability of repeated measures of Vo2max has been reported to be 2% to 4%24 or 0.2 L/min.25 Accurate determination of Vo2max requires (1) adequate duration and work intensity by at least 50% of total muscle mass, (2) independence from motivation or skill of the subject, and (3) controlled environmental conditions.26 Also, because test performance is sensitive to time of day, the time of repeat testing should be consistent.
Before any fitness test, a 3- to 5-minute warmup of slow treadmill walking on a level grade or unloaded pedaling that raises the metabolic rate twofold above resting should be performed.27 A proper warmup prevents excessive local muscle fatigue from occurring before Vo2max has been attained.28 Furthermore, a 3- to 5-minute cool-down should follow test completion to aid in venous return to prevent blood pooling in the peripheral vasculature and a subsequent drop in DBP. The intensity of exercise can be increased in a continuous progressive manner (i.e., step or ramp protocol) or, less commonly, in a discontinuous progressive manner (i.e., subject rests between stages). Throughout testing, continuous monitoring of the electrocardiogram and periodic monitoring of BP are essential. The optimal duration of a graded exercise test is 8 to 12 minutes, with testing terminated when the subject can no longer generate the required power, is limited by symptoms, or is unable to continue safely.29 Variables of interest during exercise testing include Vo2max expressed in absolute terms (liters of O2 per minute) or relative to body mass (milliliters of O2 per kilogram of body weight per minute), MET level, percent of predicted HRmax, respiratory exchange ratio (RER; ratio of Vo2 to CO2), peak power, minute ventilation, tidal volume, respiratory rate, and rating of perceived exertion (RPE) according to the Borg scale.30 Because there is considerable variability in HRmax among healthy individuals, the percent of predicted HRmax attained is not a robust indicator of exercise capacity.31 Similarly, because both total exercise time and peak exercise intensity (or power attained, i.e., peak treadmill speed and grade or peak power on bike) are dependent on the test protocol, neither is a reliable measure of exercise capacity.32,33 In addition, noninvasive estimation of the anaerobic threshold by identifying the point of nonlinear increases in minute ventilation and Vco2 can be highly subjective and thus unreliable.34
The principal marker of exercise capacity is attainment of a plateau in Vo2 beyond which there is a change of less than 100 mL/min, with further increases in workload dependent solely on anaerobic metabolism.29 In cases in which a Vo2 plateau is not observed (typically in deconditioned or elderly individuals or in patients with heart disease), the preferred term for the value obtained is peak Vo2 (Vo2peak).35 Criteria for attainment of Vo2peak include achieving the age-predicted HRmax, RER in excess of 1.15, minute ventilation greater than the predicted maximal voluntary ventilation, tidal volume greater than 90% of the inspiratory capacity, and obvious patient exhaustion.28
Testing modality
The modality of testing (e.g., treadmill walking, cycling, stepping, arm cranking) can affect Vo2max values. The treadmill has the greatest potential to recruit sufficient muscle mass to elicit a maximal metabolic response, particularly in deconditioned individuals.26 Bike ergometry yields 85% to 90%, and arm ergometry 70%, of the Vo2max achieved with a treadmill.26 Ideally the mode of exercise should be consistent with the patient’s typical activity. Thus the treadmill is often preferred because the pattern of muscle activation during treadmill walking is similar to that for most mobility tasks. In patients with neuromuscular conditions, however, impaired balance and motor control often preclude the use of standard treadmill testing protocols. To resolve this limitation, we devised and validated an exercise protocol using a body-weight support system to permit safe and valid testing of Vo2max early after stroke.36 For subjects with paraplegia, tests with wheelchair treadmills are more functionally relevant than those using arm ergometry.
Predicting maximal oxygen consumption with use of submaximal exercise tests
Although submaximal tests do not measure the systemic response, they are inexpensive to administer and have a low risk of adverse events. The essentially linear relationship between Vo2 and HR permits the estimation of Vo2max from HR measurements taken during submaximal exercise. For example, for healthy people the HR increases approximately 50 beats per uptake of 1 L of O2, independent of sex and body size.37 For unfit individuals and patients with cardiac impairment, the increases in HR are greater per liter, except for patients taking β-blockers, who demonstrate blunting of the HR response throughout exercise. The Åstrand-Ryhming nomogram is often used to predict Vo2max from submaximal HR.38 The HR-Vo2 relationship is independent of the exercise protocol. However, HR, unlike Vo2max, is markedly affected by many stresses (e.g., dehydration, changes in body temperature, acute starvation), resulting in substantial error and inaccurate Vo2max estimations.26 In fact, discrepancies between estimated and measured Vo2max in individuals with low exercise capacity can be as high as 25%.39
Fitness levels in populations with neurological disorders
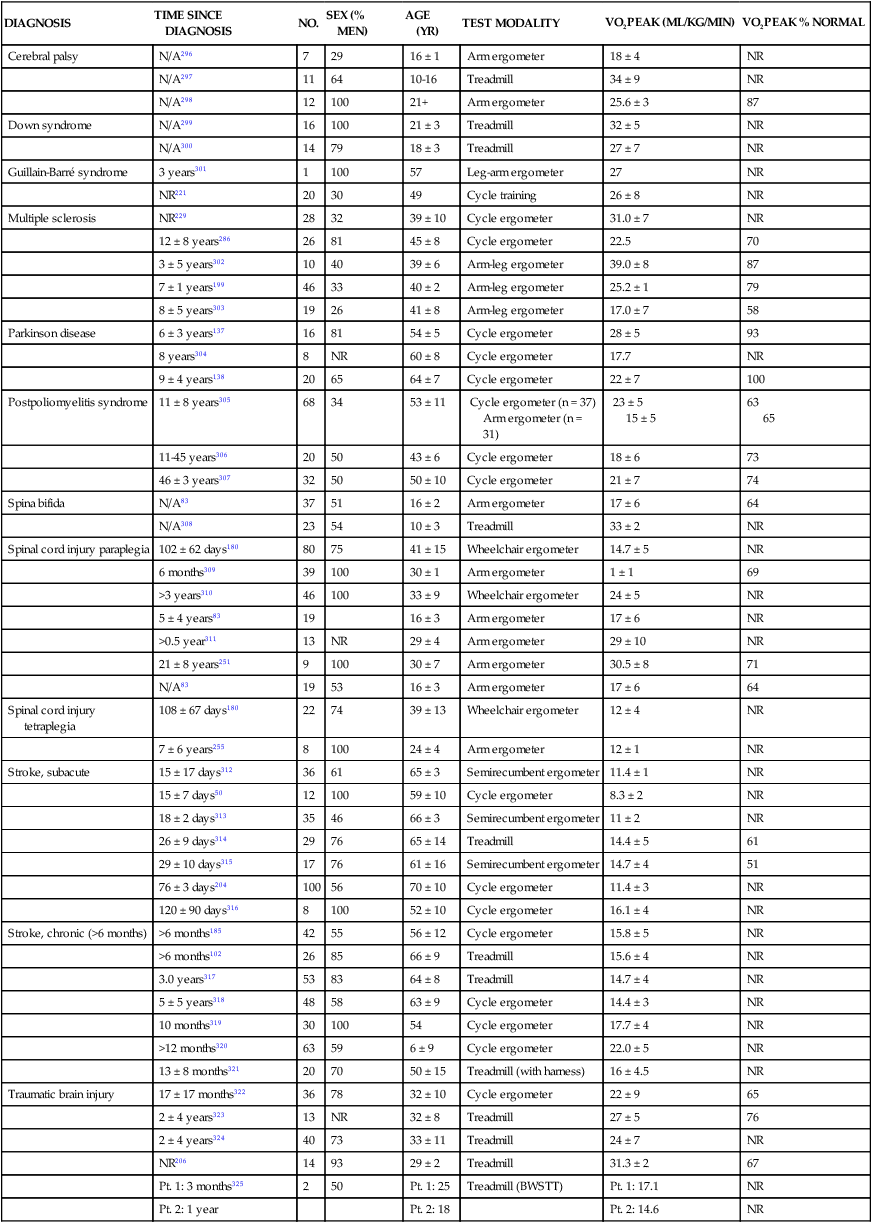
Documentation of exercise capacity in populations with neurological disorders has been hindered by the lack of testing protocols that can safely and effectively accommodate the motor and balance disturbances common to these populations. Not surprisingly, the limited evidence to date suggests that most individuals with neurological disabilities are significantly deconditioned. A summary of Vo2peak data from studies of common neurological conditions is presented in Table 30-1. Variability in the results from a multitude of factors, including differences in testing protocols, as discussed in the previous section, and differences in subject characteristics; these points are discussed in the following section.
TABLE 30-1 
EXERCISE CAPACITY IN COMMON NEUROLOGICAL CONDITIONS
| DIAGNOSIS | TIME SINCE DIAGNOSIS | NO. | SEX (% MEN) | AGE (YR) | TEST MODALITY | VO2PEAK (ML/KG/MIN) | VO2PEAK % NORMAL |
| Cerebral palsy | N/A296 | 7 | 29 | 16 ± 1 | Arm ergometer | 18 ± 4 | NR |
| N/A297 | 11 | 64 | 10-16 | Treadmill | 34 ± 9 | NR | |
| N/A298 | 12 | 100 | 21+ | Arm ergometer | 25.6 ± 3 | 87 | |
| Down syndrome | N/A299 | 16 | 100 | 21 ± 3 | Treadmill | 32 ± 5 | NR |
| N/A300 | 14 | 79 | 18 ± 3 | Treadmill | 27 ± 7 | NR | |
| Guillain-Barré syndrome | 3 years301 | 1 | 100 | 57 | Leg-arm ergometer | 27 | NR |
| NR221 | 20 | 30 | 49 | Cycle training | 26 ± 8 | NR | |
| Multiple sclerosis | NR229 | 28 | 32 | 39 ± 10 | Cycle ergometer | 31.0 ± 7 | NR |
| 12 ± 8 years286 | 26 | 81 | 45 ± 8 | Cycle ergometer | 22.5 | 70 | |
| 3 ± 5 years302 | 10 | 40 | 39 ± 6 | Arm-leg ergometer | 39.0 ± 8 | 87 | |
| 7 ± 1 years199 | 46 | 33 | 40 ± 2 | Arm-leg ergometer | 25.2 ± 1 | 79 | |
| 8 ± 5 years303 | 19 | 26 | 41 ± 8 | Arm-leg ergometer | 17.0 ± 7 | 58 | |
| Parkinson disease | 6 ± 3 years137 | 16 | 81 | 54 ± 5 | Cycle ergometer | 28 ± 5 | 93 |
| 8 years304 | 8 | NR | 60 ± 8 | Cycle ergometer | 17.7 | NR | |
| 9 ± 4 years138 | 20 | 65 | 64 ± 7 | Cycle ergometer | 22 ± 7 | 100 | |
| Postpoliomyelitis syndrome | 11 ± 8 years305 | 68 | 34 | 53 ± 11 | Cycle ergometer (n = 37) Arm ergometer (n = 31) |
23 ± 5 15 ± 5 |
63 65 |
| 11-45 years306 | 20 | 50 | 43 ± 6 | Cycle ergometer | 18 ± 6 | 73 | |
| 46 ± 3 years307 | 32 | 50 | 50 ± 10 | Cycle ergometer | 21 ± 7 | 74 | |
| Spina bifida | N/A83 | 37 | 51 | 16 ± 2 | Arm ergometer | 17 ± 6 | 64 |
| N/A308 | 23 | 54 | 10 ± 3 | Treadmill | 33 ± 2 | NR | |
| Spinal cord injury paraplegia | 102 ± 62 days180 | 80 | 75 | 41 ± 15 | Wheelchair ergometer | 14.7 ± 5 | NR |
| 6 months309 | 39 | 100 | 30 ± 1 | Arm ergometer | 1 ± 1 | 69 | |
| >3 years310 | 46 | 100 | 33 ± 9 | Wheelchair ergometer | 24 ± 5 | NR | |
| 5 ± 4 years83 | 19 | 16 ± 3 | Arm ergometer | 17 ± 6 | NR | ||
| >0.5 year311 | 13 | NR | 29 ± 4 | Arm ergometer | 29 ± 10 | NR | |
| 21 ± 8 years251 | 9 | 100 | 30 ± 7 | Arm ergometer | 30.5 ± 8 | 71 | |
| N/A83 | 19 | 53 | 16 ± 3 | Arm ergometer | 17 ± 6 | 64 | |
| Spinal cord injury tetraplegia | 108 ± 67 days180 | 22 | 74 | 39 ± 13 | Wheelchair ergometer | 12 ± 4 | NR |
| 7 ± 6 years255 | 8 | 100 | 24 ± 4 | Arm ergometer | 12 ± 1 | NR | |
| Stroke, subacute | 15 ± 17 days312 | 36 | 61 | 65 ± 3 | Semirecumbent ergometer | 11.4 ± 1 | NR |
| 15 ± 7 days50 | 12 | 100 | 59 ± 10 | Cycle ergometer | 8.3 ± 2 | NR | |
| 18 ± 2 days313 | 35 | 46 | 66 ± 3 | Semirecumbent ergometer | 11 ± 2 | NR | |
| 26 ± 9 days314 | 29 | 76 | 65 ± 14 | Treadmill | 14.4 ± 5 | 61 | |
| 29 ± 10 days315 | 17 | 76 | 61 ± 16 | Semirecumbent ergometer | 14.7 ± 4 | 51 | |
| 76 ± 3 days204 | 100 | 56 | 70 ± 10 | Cycle ergometer | 11.4 ± 3 | NR | |
| 120 ± 90 days316 | 8 | 100 | 52 ± 10 | Cycle ergometer | 16.1 ± 4 | NR | |
| Stroke, chronic (>6 months) | >6 months185 | 42 | 55 | 56 ± 12 | Cycle ergometer | 15.8 ± 5 | NR |
| >6 months102 | 26 | 85 | 66 ± 9 | Treadmill | 15.6 ± 4 | NR | |
| 3.0 years317 | 53 | 83 | 64 ± 8 | Treadmill | 14.7 ± 4 | NR | |
| 5 ± 5 years318 | 48 | 58 | 63 ± 9 | Cycle ergometer | 14.4 ± 3 | NR | |
| 10 months319 | 30 | 100 | 54 | Cycle ergometer | 17.7 ± 4 | NR | |
| >12 months320 | 63 | 59 | 6 ± 9 | Cycle ergometer | 22.0 ± 5 | NR | |
| 13 ± 8 months321 | 20 | 70 | 50 ± 15 | Treadmill (with harness) | 16 ± 4.5 | NR | |
| Traumatic brain injury | 17 ± 17 months322 | 36 | 78 | 32 ± 10 | Cycle ergometer | 22 ± 9 | 65 |
| 2 ± 4 years323 | 13 | NR | 32 ± 8 | Treadmill | 27 ± 5 | 76 | |
| 2 ± 4 years324 | 40 | 73 | 33 ± 11 | Treadmill | 24 ± 7 | NR | |
| NR206 | 14 | 93 | 29 ± 2 | Treadmill | 31.3 ± 2 | 67 | |
| Pt. 1: 3 months325 | 2 | 50 | Pt. 1: 25 | Treadmill (BWSTT) | Pt. 1: 17.1 | NR | |
| Pt. 2: 1 year | Pt. 2: 18 | Pt. 2: 14.6 | NR |
Impact of low fitness levels on health of people with neurological disorders
People with high fitness levels use only a small fraction of the physiological fitness reserve40 of the cardiovascular, respiratory, and neuromuscular systems to respond to the metabolic challenge of activities of daily living (ADLs).41,42 Thus, small declines in exercise capacity may not be noticeable in carrying out daily activities. In contrast, relatively minor reductions in capacity can substantially influence performance of ADLs by deconditioned individuals. Light instrumental ADLs require approximately 10.5 mL of oxygen per kilogram per minute (3 METs), whereas more strenuous activities have metabolic costs of about 17.5 mL/kg/min (5 METs).43 Cress and Meyer44 reported that the Vo2peak of 20 mL/kg/min is needed for older adults to meet the physiological demands of independent living. From the data presented in Table 30-1, it is evident that many people living with neurological disabilities (particularly stroke, tetraplegia, and postpoliomyelitis syndrome) do not have the level of fitness required for the more strenuous ADLs and independent living. Moreover, relative exercise capacities (expressed as a percentage of normative values) associated with the disabilities in Table 30-1, with the exception of Parkinson disease, are of concern, given that Vo2peak values less than 84% of normal are considered pathological.45
For individuals with neurological disabilities, the minimum Vo2 requirements for ADLs are actually greater than the previously mentioned levels because of the increased energy requirements resulting from gross motor inefficiencies and other related factors.46–48 In other words, the percentage of Vo2peak required for activity at a fixed submaximal workload (termed fractional utilization) is increased. When the anaerobic threshold is exceeded prematurely and lactate accumulation is accelerated, accomplishment of low-intensity ADLs is unsustainable for extended periods and achievement of mid- to upper-intensity ADLs is virtually impossible. Moreover, the combination of poor exercise capacity and elevated energy demands results in diminished reserves to support other activities. For example, in the case of people with postpoliomyelitis syndrome, the energy costs of walking are about 40% higher than for healthy peers and are highly correlated with lower-extremity muscle strength.49 Thus in the calculation of fractional utilization for walking, the numerator (Vo2 during walking) is increased and the denominator (Vo2peak) is decreased; hence, fractional utilization is substantially increased.
Of the neurological populations, people poststroke are the largest consumer group in need of rehabilitation services. This group also has received the most attention in the literature with regard to functional capacity. Exercise capacities documented in this population are consistently low—from 8.3 mL/kg/min in the subacute period50 to 22.4 mL/kg/min in the chronic period.51 As much as 75% to 88% of Vo2peak (almost twice that of the healthy control subjects) is required to perform household chores52 and one-and-a-half to three times the Vo2 levels of healthy controls are needed to walk on level ground.46,53,54 Not surprisingly, up to 70% of patients complain of fatigue after stroke55 and rate poor energy levels ahead of mobility limitations, pain, emotional reactions, sleep disturbances, and social isolation as the area of greatest personal concern.56
In addition to contributing to reduced ADL performance and increased fatigability, low fitness levels are associated with higher mortality. Exercise capacity has been reported to be an independent predictor of mortality in persons with coronary artery disease (CAD), a comorbidity prevalent in some populations of people with neurological conditions.57,58 Those with a Vo2peak <21 mL/kg/min are classified as the high-mortality group and with greater than 35 mL/kg/min as the excellent-survival group.59 Thus, determining an individual’s Vo2peak is of clinical value. Individuals who are being encouraged or are internally motivated to perform beyond their capacity and beyond the capabilities of the interaction of multiple systems are in a high-risk category. Conversely, individuals who are undermotivated or depressed and are performing below their capacity can be trained to self-monitor, which empowers them to reach goals that are safe and have the potential to improve the quality of their lives.
Factors affecting fitness levels in people with neurological disorders
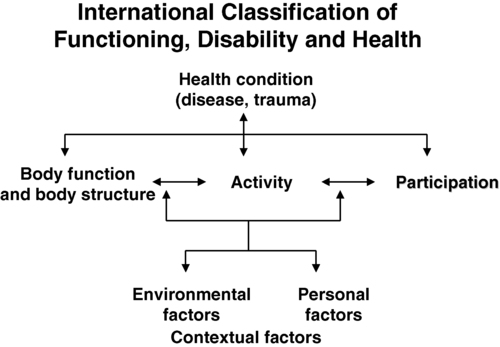
To identify appropriate measures to improve fitness levels in people with neurological disorders, the myriad factors at play that contribute to the deconditioned state must be considered. A useful conceptual framework to discuss the interaction of these factors is the International Classification of Functioning, Disability and Health (ICF)60 (see Chapter 1). The ICF uses a biopsychosocial approach to organize factors related to the health conditions into two components: (1) personal and environmental contextual factors and (2) functioning and disability, which are further subdivided into components of body functions and structures, activity, and participation (Figure 30-2). Through application of the ICF framework, the complexity of interacting influences on cardiovascular and pulmonary health and fitness becomes more understandable.

Personal and environmental contextual factors
Age
A decline in Vo2max of approximately 1% per year (0.4 to 0.5 mL/kg/min/year) occurs from 25 to 75 years of age.61 In accordance with the Fick equation, a reduction in Vo2max is caused by reductions in both O2 transporting (i.e., Qmax) and O2 utilization capacity (i.e., a-vO2diffmax) associated with cardiac, respiratory, and muscular changes. Decreased Qmax is the result of increasing myocardial stiffness and decreased left ventricular contractility, manifested by reductions in both ejection fraction and HRmax—hallmarks of cardiovascular aging.62 In fact, the reduction in HRmax, which decreases 6 to 10 beats per minute (bpm) per decade, is responsible for much of the age-associated decline in Qmax.63 Evidence also suggests that older adults have a smaller SVmax63 and that BP and systemic vascular resistance are higher during maximal exercise in older versus young adults.64
With advancing age, reduced elastic recoil of the lung and calcification and stiffening of the cartilaginous articulations of the ribs restrict compliance of the lungs, thus limiting increases in minute ventilation during exercise.65 Age-related decline in oxidative capacity of the working muscles and hence decreased a-vO2diff during peak exercise66 have been attributed to alterations in mitochondrial structure and distribution, oxidative enzyme activity,67 and skeletal muscle microcirculation, as well as sarcopenia resulting from a reduced number and size of fibers, particularly type II fibers.68 Nevertheless, despite loss of aerobic capacity with aging, people without chronic health conditions retain adequate reserves for daily activities. However, for aging individuals with a neurological impairment, the decrease in aerobic capacity with age can further reduce their reserves and thus threaten living an independent lifestyle. In fact, in a population-based study, age was found to be a significant independent predictor of recurrent stroke.69 Particularly disadvantaged are people with cerebral palsy (CP) or other developmental disabilities as a result of an incomplete development of their musculoskeletal and cardiorespiratory systems at the time of the neurological event, which accelerates the aging process.70 In the case of people with Down syndrome, however, Baynard and colleagues71 found that age-related changes in exercise capacity did not follow the typical pattern of decline after the age of 16 years. People with spinal cord injury (SCI) are at an increased risk for cardiac and respiratory complications with age.72
Sex
The absolute and relative Vo2max of women is about 77% of that of men, after adjustment for body weight and activity level.73 For nondisabled older adults, Kohrt and colleagues74 reported no significant gender difference in the percentage of improvement in Vo2max; women had an increase in Vo2max of 26% ± 12% (range 4% to 58%), and men demonstrated a 23% ± 12% (range 0% to 51%) increase. Although older men and women generally exhibit similar responses to maximal exercise, older women tend to have lower SBP during maximal exercise.64
Lifestyle factors
Smoking is one factor that has been shown to impair exercise capacity in the general population.76 Smoking causes increases in HR, myocardial contractility, and myocardial oxygen demand, which can lead to atherosclerosis and acute cardiovascular events.77 In the stroke population, smoking doubles the risk of death (equivalent of a 7-year reduction in life span) when compared with the risk in nonsmokers and ex-smokers.78
Currently the relationship between cardiovascular disease and diet is receiving international attention.79 Indeed, obesity increases the risk of cardiovascular risk factors such as impaired glucose tolerance and type 2 diabetes, hypertension, and dyslipidemia.80 Specifically, abdominal obesity not only increases the risk of atherosclerotic disease but also the risk of primary ischemic stroke.81,82 In addition, when compared with corresponding normal-weight populations, overweight youth with SCI and spina bifida have lower cardiovascular fitness.83 Yet the lifestyle factor that has received the most attention in the literature is habitual activity. There is now irrefutable evidence of the link between physical activity and cardiopulmonary health and fitness.76,84–86 In fact, in the stroke population, prestroke physical activity has been found to decrease stroke severity as well as to result in better long-term rehabilitation outcomes.87 Cardiovascular alterations resulting from physical inactivity (i.e., reduced Vo2max and Qmax) parallel, in many ways, the changes that occur with aging; in fact, sedentary lifestyles explain a significant proportion of these age-related declines. If physical activity levels and body composition remain constant over time, the expected rate of loss in aerobic power associated with senescence is reduced by almost 50%.68 Nonetheless, people with chronic health conditions often rate poorly in terms of daily physical activity, in part because of underlying physical impairments (e.g., paralysis, pain). For example, people with SCI spend as little as 2% of their walking time participating in leisure physical activity,88 making them the most sedentary members of society.89 Some people with multiple sclerosis (MS) avoid physical activity to prevent elevated body temperature and minimize symptoms of fatigue.90 Inactivity can lead to increased cardiovascular risk factors such as hypertension and dyslipidemia as seen in youth with chronic disabilities (including CP and SCI).91 Bernhardt and colleagues92 found that after a stroke, patients spend more than 50% of their time resting in bed. Short periods of bed rest cause rapid decreases in aerobic capacity—a 15% reduction in healthy, middle-aged men after 10 days of recumbency93 and a 28% reduction in healthy young subjects after 3 weeks.94 Inactivity-induced reductions in Vo2peak have been attributed to both central changes (decreased SV from impaired myocardial function and increased venous pooling) and peripheral changes characteristic of aerobically inefficient muscle fibers (decreases in oxidative enzyme concentrations, mitochondria, and capillary density).22
Environmental factors
Significant associations have been found between physical activity and physical environmental factors such as accessibility, esthetic attributes, and opportunities for activity within the general public.95 However, the influence of such factors on cardiovascular and pulmonary fitness of people with neurological disabilities has received little attention in the literature.
Health condition
Neuromuscular system
For most individuals with neurological conditions, the existence of neuromuscular impairments confounds interpretation of Vo2peak testing. When people with an intact nervous system are tested, normal biomechanical efficiency is assumed; an impaired nervous system increases the complexity of physiological responses. Both primary effects of upper motor neuron damage (e.g., paralysis, incoordination, spasticity, sensory-perceptual disorders, balance disturbances) and secondary “peripheral” changes in skeletal muscle (e.g., gross muscular atrophy96 and changes in muscle fiber composition97) affect the response to exercise. As a result, people with neurological disabilities manifest not only metabolic but also biomechanical defficiencies, both of which contribute to reduction in functional capacity. Consequently, the decline in exercise capacity is greater than expected (e.g., in people with postpoliomyelitis syndrome, deterioration in Vo2peak over a 3- to 5-year period was 12% greater than the predicted decline98).
Paresis reduces the pool of motor units available for recruitment during physical work,99 thereby reducing the metabolically active tissue and lowering the oxidative potential.100 In the case of stroke, an estimated 50% of the normal number of motor units are functioning,101 and a strong relationship between bilateral thigh muscle mass and Vo2peak has been reported.102 In addition, along with altered joint kinematics and decreased postural reactions,103 children with CP exhibit high levels of co-contraction (simultaneous contraction of agonist and antagonist muscle groups), which may prematurely induce skeletal muscle fatigue, further increasing the energy expenditure of walking and decreasing Vo2peak.104,105 Thus, when compared with able-bodied individuals, children with CP experience greater levels of fatigue at slower walking speeds.104,105 For people with postpoliomyelitis syndrome, muscle weakness of the lower extremities is strongly associated with energy expenditure of walking.49 In fact, when compared with healthy age- and sex-matched subjects, energy cost of walking is found to be significantly higher (40%) for people with postpoliomyelitis syndrome.49
Altered fiber composition and recruitment patterns of paretic muscle may also contribute to poor fitness.97,106 Skeletal muscles are composed of fibers that express different myosin heavy chain (MHC) isoforms. Slow (type I) MHC isoform fibers have higher oxidative function, are more fatigue resistant, and are more sensitive to insulin-mediated glucose uptake; fast (type II) MHC fibers are recruited for more powerful movements, are more reliant on anaerobic or glycolytic means of energy production, fatigue rapidly, and are less sensitive to the action of insulin.107 Although relatively equal proportions of slow and fast MHC isoforms are found in the vastus lateralis of healthy individuals,100 elevated proportions of the fast, more fatigable fibers that are less glucose sensitive have been found in the paretic leg of people after a stroke.97 Hence it is likely that reduced insulin sensitivity and increased use of the anaerobic processes during dynamic exercise at the level of the muscle contribute to reductions in Vo2peak. Furthermore, alterations in the structure of mitochondria100 and reduced activity of oxidative enzymes (e.g., succinate dehydrogenase)108 may contribute to the reduced oxidative capacity of paretic muscles.
Cardiovascular system
Cardiovascular comorbidities, prevalent in populations with neurological disorders, contribute to metabolic inefficiency. In fact, cardiovascular complications are the leading cause of death in persons with stroke,109 MS,110 and SCI.111 About 75% of patients who have had a stroke are hypertensive,112 and the same proportion of patients have underlying cardiovascular dysfunction.113 In fact, most persons who have had a stroke have atherosclerotic lesions throughout their vascular system,114 and a high correlation has been reported between the number and degree of stenotic lesions in the coronary and carotid arteries.115,116 The high prevalence of CAD in this population should not be surprising because stroke and cardiac disease share similar predisposing factors (e.g., older age, hypertension, diabetes mellitus, cigarette smoking, sedentary lifestyle, and hyperlipidemia) and pathogenic mechanisms (e.g., atherosclerosis).117 Metabolic syndrome is a usual construct in identifying patients at high risk for future vascular events (e.g., a second stroke, myocardial infarction).118 Metabolic syndrome refers to a constellation of markers of metabolic abnormalities (i.e., hypertension, abdominal obsesity, abnormal lipid profile) that interact to accelerate the progression of atherosclerosis and increase the risk of development of cardiovascular or cerebrovascular disease.119 The prevalence of metabolic syndrome in neurological populations is high. A retrospective study reported that about 61% of 200 patients in stroke rehabilitation met the criteria for the syndrome.120
Factors that elevate HR for a given Vo2, such as CAD, result in attainment of a peak HR (HRpeak) at a Vo2peak below that predicted for that individual. Cardiac dysfunction contributes to a lower aerobic capacity through two principal mechanisms: ischemia-induced reductions in ejection fraction and SV with exercise121 and chronotropic incompetence—the inability to increase HR in proportion to the metabolic demands of exercise.21 For persons who can attain HRmax within 15 bpm of the predicted maximum, limitations in exercise capacity probably do not have cardiovascular causes.
Impaired peripheral blood flow also contributes to reduced cardiovascular fitness. Inadequate blood flow to the periphery impairs O2 transport and limits energy production in the working muscles, thereby compromising the ability to sustain physical activity. Both resting blood flow and postischemic reactive hyperemic blood flow have been found to be lower (approximately 36% less) in the paretic leg of people poststroke.122,123 In addition, despite near-normal (above 0.90) mean ankle brachial index values, arterial diameter has been found to be reduced poststroke.122 Potential mechanisms responsible for reduced blood flow on the hemiparetic side include altered autonomic function,124 enhanced sensitivity to endogenous vasoconstrictor agents,125 and altered histochemical and morphological features of the vascular network itself.126 However, the relative contribution of each of these factors is unknown. In addition, local metabolic mediators associated with changes in muscle fiber composition in the paretic limb (previously discussed) may contribute to impaired limb blood flow.100
Trauma to the spinal cord may disrupt the autonomic reflexes and sympathetic vasomotor outflow required for normal cardiovascular responses to exercise.127 As a result, reduced venous return and cardiac output (referred to as circulatory hypokinesis) impair delivery of O2 and nutrients to and removal of metabolites from working muscles, intensifying muscle fatigue.128 For people with paraplegia, an exaggerated HR response may occur during exercise in order to compensate for reduced SV. However, adrenergic dysfunction associated with lesions above the T1 sympathetic outflow prevent this compensatory mechanism,129 thereby increasing the risk of cardiovascular disease.
Pulmonary system
Typically in able-bodied individuals the pulmonary system does not limit cardiopulmonary fitness, because the lungs of people without chronic health conditions have a large reserve.130 Nevertheless, at maximal workloads as much as 10% of Vo2max is needed to support the mechanical work of the diaphragm, accessory inspiratory muscles, and abdominal muscles.121 In contrast, people with neurological impairments may have limited O2 availability for exercise as a result of pathological conditions involving the pulmonary system, either as a direct complication of a neuromuscular condition (e.g., muscle weakness, impaired breathing mechanics) or as a result of cardiovascular dysfunction, comorbidities (e.g., chronic obstructive pulmonary disease), or lifestyle factors (e.g., physical inactivity, smoking habits).131,132 These impairments can reduce the ventilatory reserve, defined as the difference between the maximal available ventilation and the ventilation measured at the end of exercise.133
As previously mentioned, minute ventilation is closely associated with Vco2 during exercise. At peak exercise, a ratio of minute ventilation to Vco2 above between 35134 and 40135 indicates an abnormal ventilatory response. Neu and colleagues136 reported an 87% incidence of obstructive pulmonary dysfunction in patients with Parkinson disease, despite the finding that Vo2peak levels in this patient group tend to be in the normal range.137,138 For children with CP, reduced exercise capacity may be partly caused by respiratory muscle spasticity resulting in reduced breathing efficiency.105 In the case of stroke, pulmonary function is usually affected to only a modest extent, notwithstanding acute respiratory complications (e.g., pulmonary embolism, aspiration pneumonia).131 Impaired respiration may be attributed to cardiovascular dysfunction or lifestyle factors (e.g., physical inactivity, high incidence of smoking)139 or a direct result of the stroke, particularly brain stem stroke. The overwhelming fatigue felt by some persons after a stroke may be partly caused by respiratory insufficiency as manifested by low pulmonary diffusing capacity, decreased lung volumes, and ventilation-perfusion mismatching.140 Impaired breathing mechanics with restricted and paradoxical chest wall excursion and depressed diaphragmatic excursion have been also reported.131,141 Expiratory dysfunction appears to be related to the extent of motor impairment (e.g., hemiabdominal muscle weakness), whereas inspiratory limitations appear to be related to the gradual development of rib cage contracture.142
To summarize, a host of interacting factors are associated with abnormally low cardiopulmonary fitness in people with neurological disorders. Neuromuscular and respiratory dysfunctions are often superimposed on an already-compromised state as a result of comorbid cardiovascular disease and premorbid health- and lifestyle-related declines. Paresis and the subsequent reduction in lean muscle mass, changes in the muscle fiber phenotype, and increased reliance on anaerobic processes for energy production result in high metabolic costs of moving paretic limbs. As a consequence, cardiac reserves available for meaningful activity-level functions are limited, which in turn has a negative impact on participation-level functions. Collectively, impairments in the neuromuscular, cardiovascular, and pulmonary systems converge to promote a sedentary lifestyle and reduced health-related quality of life, which in turn leads to further inactivity and further reductions in cardiopulmonary fitness. The contribution of skeletal system impairments to this downward spiral has received little attention. Pang and colleagues143 studied the relationship between bone health and physical fitness in patients who had had a stroke and found a significant correlation between paretic femur bone mineral density and Vo2max. They concluded that further study is needed to determine the clinical implications of this finding.
Adaptive responses to aerobic training in populations with neurological disorders
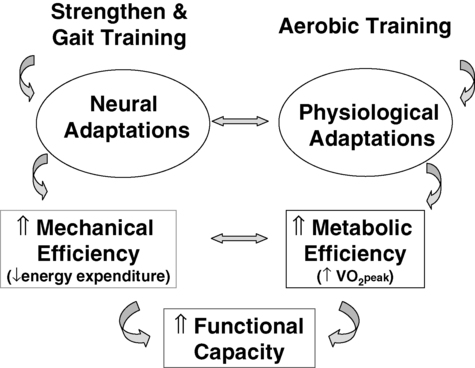
It is now apparent that healthy young and old individuals who begin participating in regular activity even after years of inactivity can enjoy greater health and fitness than those who remain sedentary.144 Training studies involving people with neurological disability, although limited in number and sample size and often lacking a control group, provide preliminary evidence of cardiopulmonary adaptations to physical work (Table 30-2). For example, for adolescents with chronic disabilities (including CP, SpinaBefida [SB], and SCI)91 and children with CP,145–148 cardiovascular fitness training is found to produce positive results on aerobic capacity and fitness. There is also growing evidence supporting the benefits of aerobic training in people with stroke of mild to moderate severity.149 Exercise training has also been found to improve the physical capacity of people with SCI.150,151 In the case of people with TBI, evidence regarding the effects of exercise training has been inconclusive.152 However, in people with neurological disorders, cardiovascular adaptations in response to aerobic training enhance metabolic efficiency, and neuromuscular adaptations in response to strength and gait training improve mechanical efficiency. The result is improved functional capacity with lowered energy costs of ADLs, enhanced fatigue resistance, and increased exercise tolerance (Figure 30-3).
TABLE 30-2 
| DIAGNOSIS | TRAINING MODE | NO. | PROGRAM WEEKS | FREQUENCY (TIMES PER WEEK) | DURATION (MIN) | INTENSITY | % VO2PEAK CHANGE |
| Cerebral palsy | Uphill walking296 | E: 7 | 12 | 3 | 20-22 | 65%-75% HRmax | E: +19 |
| C: 6 | C: +0.6 | ||||||
| Guillain-Barré syndrome | Arm-leg ergometer301 | E: 1 | 16 | 3 | 20 | 75%-85% HRmax | E: +9 |
| Cycle training221 | E: 20 | 12 | 3 | NR | NR | E: +16 | |
| Multiple sclerosis | Arm-leg ergometry199 | E: 21 | 15 | 3 | 30 | 60% Vo2peak | E: +22 |
| C: 25 | C: +1 | ||||||
| Leg cycle ergometer303 | E*: 11 | 8 | 3 | 60 | 60%-80% maximum work rate | ||
| Postpoliomyelitis syndrome | Cycle ergometer167 | E: 16 | 16 | 3 | 15-30 | 70% HRmax | E: +15* |
| C: 21 | C: +4 | ||||||
| Arm ergometer306 | E: 10 | 16 | 3 | 20 | 70%-75% | E: +19 | |
| C: 10 | HRR or 50-60 rpm or RPE6-20 = 13 | C: −1 | |||||
| E1: Aerobic exercise, hospital231 | E1: 15 | 8 | 3 | 30 | 50%-70% of Vo2peak | E1: +23 | |
| E2: Aerobic exercise, home | E2: 13 | E2: +7 | |||||
| Spinal cord injury—C7-T12 | FES-assisted rowing166 | E: 6 | 6 | 3 | 30 | 75%-80% Vo2peak | E: +11 |
| Circuit training262 | E: 7 | 16 | 3 | 40-45 | 50%-60% 1 RM | E: +10 | |
| Spinal cord injury—tetraplegia | FES-assisted ergometry164 | E: 18 | 12-16 | 3 | 30 | 0-31 W | E: +23 |
| Arm ergometer255 | E: 8 | 8 | 3 | 30 | 50%-60% of HRR or 60 rpm | E: +94 | |
| Stroke—subacute | Stationary bicycle204 | E: 44 | 12 | 3 | 20-30 | 40 rpm | E: +9 |
| C: 48 | C: +0.5 | ||||||
| Treadmill50 | E: 6 | 26 | 5 | 20 | NR | E: +35 | |
| C: 6 | C: +1 | ||||||
| Cycle ergometer312 | E: 23 | 3.3-4.1 | 3 | 30 | 50%-75% of Vo2peak | E: +13 | |
| C: 22 | C: +8 | ||||||
| Stroke—chronic | Cycle ergometer207 | E: 37 | 26 | 3 | 10-20 | 40%-50% HRR | E: +18 |
| C: 24 | C: −3NS | ||||||
| Cycle ergometer203 | E: 24 | 8 | 2 | 20 | 50%-60% HRR | E: +13 | |
| C: 24 | C: 0NS | ||||||
| Treadmill with harness support197 | E: 26 | 26 | 3 | 40 | 60%-70% HRR | E: +15 | |
| C: 20 | C: −3NS | ||||||
| E1: Moderate intensity326 | E1: 18 | 14 | 3 | 30-60 | E1: 50%-69% HRR | E1: +4NS | |
| E2: Low intensity326 | E2: 19 | E2: <50% HRR | E2: +6NS | ||||
| C: 18 | C: −3NS | ||||||
| Treadmill327 (plus strength training) | E: 14 | 12 | 5 | 90 | E: 80% HRmax | E: +19 | |
| Treadmill321 | E: 20* | 4 | 2-5 | NR | 80%-85% HRmax or RPE of 17 | Immediate: +6 | |
| Delayed: +6 | |||||||
| Stationary bicycle185 | E: 19 | 10 | 3 | 30 | 50-70 rpm | E: +13 | |
| C: 23 | C: +1 | ||||||
| Aerobic exercise155 | E: 29 | 12 | 3 | 30 | HR = (HR at RER = 1) -15 | E: +8 | |
| Treadmill40 | E: 23 | 26 | 3 | 20 | <60% HRR | E: +10 | |
| Aerobic exercise328 | E: 32 | 19 | 3 | 60 | <80% HRR | E: +9 | |
| C: 31 | C: +1 | ||||||
| Water based163 | E: 7 | 8 | 3 | 30 | <80% HRR | E: +23 | |
| C: 5 | C: +3 | ||||||
| Traumatic brain injury | Low-intensity aerobic exercises324 | E: 40 | 16 | 3 | 15-20 | “Low” | E: +3 |
| Circuit training206 | E: 14 | 16 | 3 | 45 | 70% of Vo2peak | E: +15 | |
| Treadmill, walking, jogging249 | E: 32 | 12 | 3 | 60 | “Moderate intensity” | E and C: +14 | |
| C: 30 | |||||||
| BWSTT325 | E: 2 | Pt. 1: 11 | 2-3 | 17-32 | Pt. 1: 60%-85% HRmax | Pt. 1: +24 | |
| Pt. 2: 15 | Pt. 2: <50% HRmax | Pt. 2: +16 |
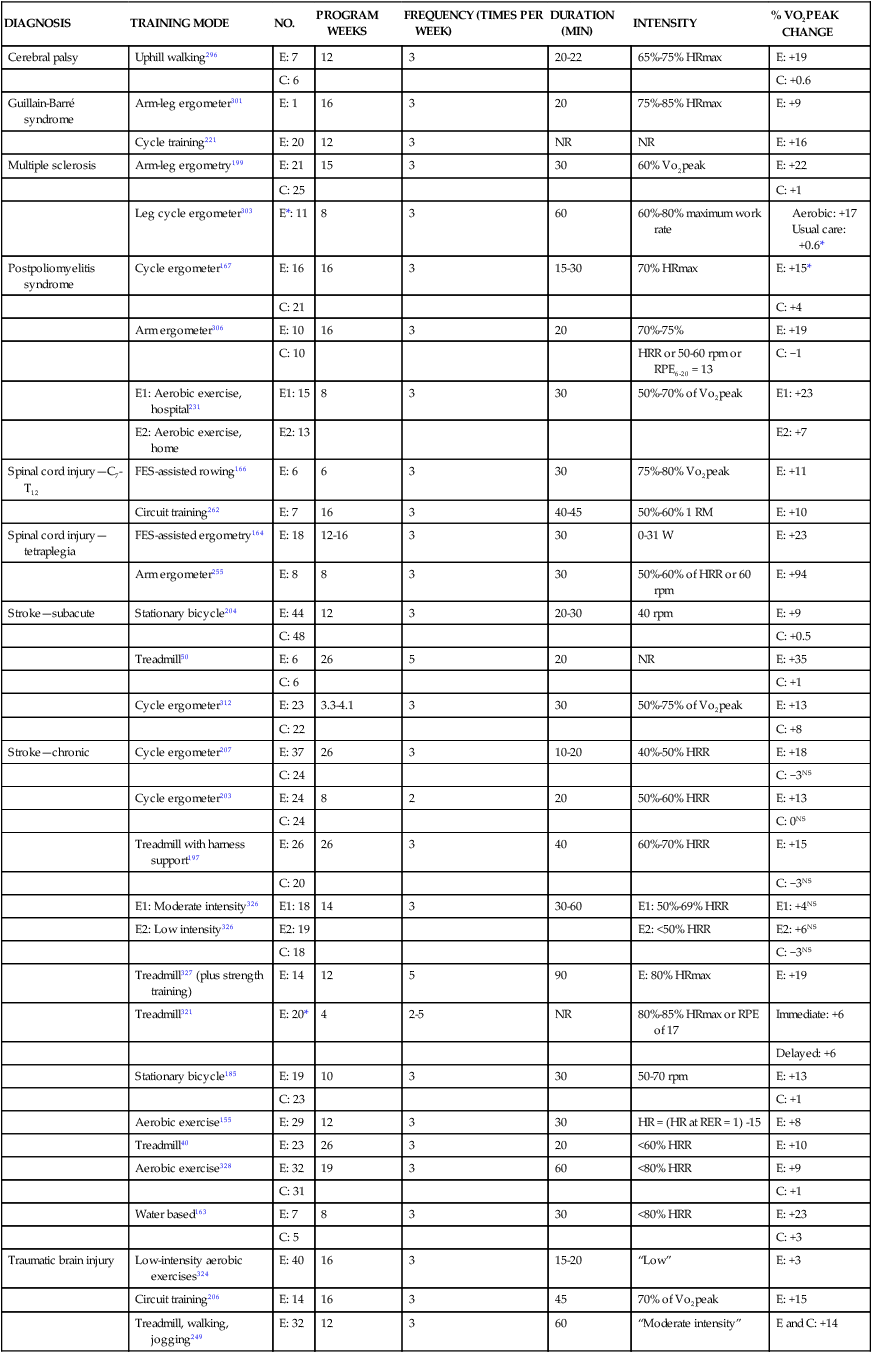
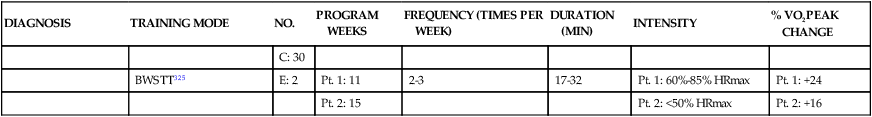

The magnitude of change in Vo2peak in the training studies in Table 30-2 (mean gain of 20%) is comparable to the improvements of 10% to 30%153,154 reported for healthy, sedentary adults and 13% to 15% for participants in cardiac rehabilitation.155,156 The increases in Vo2peak for clinically stable individuals with CAD have been reported to be 12% to 46%.157–159 Substantial intersubject variability in results is attributable to many factors, including differences in neurological condition, severity, and time after insult, as well as variations in intensity of training, mode of exercise, and level of compliance with the exercise regimen. Within studies, considerable interindividual differences have been noted, of which only a small portion (about 11%) have been attributed to recognized covariates such as initial fitness status and an even smaller percentage (about 5%) to measurement error.157–159 The most rapid improvements in exercise capacity are seen in previously sedentary people,160 and similarly the highest overall gains occur in individuals with the lowest initial values of Vo2peak.161 Age and sex have not been shown to have a substantial effect on exercise trainability.162
The dramatic increases in exercise capacity reported in some of the studies (e.g., improvements of 23%163,164 to 94%50) may not be possible for most people with neurological disabilities. Yet the subtle gains realized in other studies (e.g., 8%,165 11%,166 15%167) may yield meaningful dividends by extending the time in which muscle contraction can be sustained through oxidative processes, thus elevating the lactate threshold. Enhanced functional capacity could spell the difference between being dependent and independent. In other words, interventions that result in even small changes in aerobic capacity may be of practical significance for people with neurological disorders.
Mechanism of improved exercise capacity in neurological disorders
It remains unclear whether training-induced increases in Vo2peak in people with neurological disorders result from central mechanisms or peripheral mechanisms. In healthy individuals both peripheral and central adaptations occur; and in those with CAD and an intact nervous system, central168,169 and peripheral157,169,170 adaptations have been variably reported. In accordance with the Fick equation, central adaptations rely on improved SV because HRmax remains unchanged with training. Enhanced myocardial contractility, together with decreased vasoconstriction in the nonworking muscles and improved venous return, account for the higher Qmax171,172 without a concomitant increase in mean arterial pressure.171,172 The effect of training on ejection fraction remains unclear,51 and lack of effect on blood hemoglobin content and coronary blood flow has been documented.171,172
Peripheral adaptations in the exercising muscle tissue include increases in capillary density,173,174 size and number of mitochondria,175 myoglobin levels, Krebs cycle enzymes (e.g., succinate dehydrogenase), and respiratory chain enzymes (e.g., cytochrome oxidase).22 As a consequence of these skeletal muscle adaptations, a-vO2diff and hence Vo2peak increase.61
The possibility of “spontaneous” increases in exercise capacity during neurological recovery should not be overlooked. There have been several reports of non–exercise-induced adaptations after myocardial infarction.176–178 In our lab we documented a significant increase (13%) in Vo2peak over the course of a stroke rehabilitation program that lacked an aerobic training component.179 Haisma and colleagues180 reported that patients with tetraplegia and paraplegia demonstrated improvements in Vo2peak of 17% and 23%, respectively, over the course of inpatient SCI rehabilitation; however, the extent and mode of aerobic training was not indicated. The authors speculated that the improved capacity could be, in part, a result of natural recovery and recuperation from trauma and complications. Dressendorfer and colleagues181 hypothesized that the metabolic demands of unregulated daily activities after myocardial infarction may have an insidious training effect. In support of this prospect, a review of the threshold exercise intensity to improve cardiorespiratory fitness indicated that for deconditioned participants an effective training intensity is lower than previously reported.182
Additional benefits of aerobic training
Cardiopulmonary function
Decreases in HR at a fixed submaximal workload after training have been attributed to increases in total blood volume183 and vagal activity and to concomitant reductions in sympathetic-adrenergic drive and resting heart rate (HRrest).184 However, according to Wilmore and colleagues183 the decrease in HRrest is of minimal physiological significance. Potempa and colleagues185 reported reduction in SBP at submaximal workloads after a 10-week training program for people after stroke. Related to this finding, training can also reduce the rate-pressure product (product of HR and SBP) at submaximal loads,63 which reflects improvement in cardiac efficiency.186 After a 4-week single-limb exercise training program with the hemiparetic limb, Billinger and colleagues122 reported significant improvements in femoral artery blood flow and diameter compared with the nonhemiparetic limb poststroke. The authors reasoned that in order to maintain homeostasis, the diameter increased to adjust for the coupling of increases in metabolic demand and improved blood flow.
In patients with CAD, training has resulted in decreased ST segment depression (a marker of myocardial ischemia) during submaximal exercise performed at the same baseline rate pressure product,168 thus raising the anginal threshold and extending the time that submaximal tasks can be performed without triggering myocardial ischemia. Cardiovascular and muscle adaptations also lower minute ventilation at a given submaximal workload, intimating improved ventilatory efficiency.187 After training, Vo2 at a given submaximal workload is either unchanged19 or modestly reduced188 because the increased a-vO2diff in trained muscles is offset by reduced blood flow to the working muscles and a less pronounced decrease in blood flow to the nonexercising muscles resulting from depressed sympathetic reflex activity.171 As a result of improved pulmonary function resulting from targeted expiratory189 and inspiratory190 muscle training in people with MS, it may be possible for members of this population to increase exercise tolerance.
Cardiovascular risk factor reduction
Although limited physical activity is an independent predictor of risk of stroke,191–193 the capacity of exercise to confer similar protective benefits against stroke recurrence is unknown. It is clear that endurance exercise training lowers resting BP in both young and older hypertensive adults.194 Training is also associated with lower fasting and glucose-stimulated plasma insulin levels and with improved glucose tolerance (if initially impaired), insulin sensitivity,195 and glycemic control in patients with type 2 diabetes.196 A 6-month treadmill exercise training program reduced insulin resistance in stroke survivors.197 Evidence suggests that populations with neurological disorders achieve similar training-induced improvements in lipid profile as previously documented for participants in cardiac rehabilitation.198 Patients with MS showed reductions in triglyceride and very-low–density lipoprotein levels after a 15-week training program.199 Similarly, an 8-week training program for individuals early after SCI led to improved lipid profiles, with more pronounced changes in response to high-intensity training.200 However, these changes may be a result of training-induced reductions in body fat stores.201 The potential for training to reduce intraabdominal fat is particularly significant because it is the body fat depot that increases the most with age and is associated with other cardiovascular disease risk factors.202 Because of the positive effects on glucose homeostasis, lipid lipoprotein profiles, and cardiovascular fitness, exercise training has been found to be effective in reducing the risk of cardiovascular disease and comorbidities (e.g., type 2 diabetes, hypertension, obesity) in people with SCI.151 Stroke survivors participating in a 10-week cardiac rehabilitation program obtained greater improvements in cardiac risk score when compared with stroke patients in usual care.203
Impairments in body structure and function
The benefits of training to impairments in body structure and function of people with neurological disabilities, other than improved endurance and exercise tolerance, have not been well documented. In patients who have had a stroke, training studies have noted enhanced balance204 and paretic lower-extremity muscle strength.164 A 15-week aerobic training program for patients with MS resulted not only in improvement in exercise capacity but also in upper- and lower-extremity strength.199 Children with CP have shown improved gross motor function after participating in an 8-month circuit-training program.205
An exercise training program designed to improve ambulatory efficiency of patients with traumatic brain injury failed to reduce energy costs of walking despite a 15% improvement in Vo2peak.206 In contrast, two studies reported mean reductions in energy costs of walking of 30%53 and 23% after stroke rehabilitation,54 and a pilot study reported a 32% reduction in the energy cost of walking in individuals with incomplete spinal cord lesions after a 12-week program of body-weight–supported treadmill training (BWSTT).193 Macko and colleagues40 interpreted gains observed in ambulatory workload capacity as a reflection of both improved exercise capacity and greater gross motor efficiency. The investigators postulated that central neural motor plasticity, mediated by the repetitive, stereotypic training, underlay these adaptations. In addition, Luft and colleagues207 suggest that training-induced gains in walking ability208,209 may be caused by neuroplastic mechanisms involving cerebellum-midbrain circuits.207
In recent years the possible role that dynamic exercise may play in enhancing cognitive function has come under investigation. In fact, in older adult populations without known cognitive impairment and in cardiac populations, there is evidence supporting the benefit of exercise training on improving cognition.210–212 Neeper and colleagues213 observed up-regulation of brain-derived neurotrophic factor (BDNF) in the cerebral cortex of rats housed in an environment with free access to a running wheel. Since then, several researchers have demonstrated increased BDNF production and synaptic plasticity in the brains214,215 and spinal cords216 of rodent models engaged in voluntary running. Tong and colleagues217 reported that these responses appear to be dose dependent. Van Praag and colleagues218 contributed to this line of inquiry by providing in vitro evidence of neurogenesis in the dentate gyrus of adult mice in response to an enriched environment that included voluntary wheel running. Gordon and co-workers219 drew on the findings from these animal studies by suggesting that the improved cognitive function observed in individuals with traumatic brain injury who exercised regularly may be attributable to exercise-induced increases in BDNF or other growth factors. In another animal study, positive effects of aerobic training on neural functioning through the modulation of synaptic plasticity underlying neuroprotective and neuroadaptive processes were found.220 In terms of fatigue, after an 8-week hospital-based training program, patients with postpoliomyelitis were found to have reduced levels of fatigue. However, limited evidence exists regarding the effect of exercise on fatigue in patients with Guillain-Barré syndrome221 and MS.222
Emotional well-being
Increased exercise capacity has been shown to improve mental well-being (reductions in anxiety and depression) in cardiac patients.223,224 There is moderate evidence regarding the effect of exercise training on improving mood in patients with MS.222 Very limited evidence exists to support the relationship between aerobic exercise and emotional well-being poststroke. Yet 18% to 68% of stroke survivors are depressed,191 making this population at an increased risk for depression.225 High levels of physical disability, cognitive impairment, and severity of stroke have been found to be predictors of poststroke depression.226 Stuart and colleagues227 reported that stroke survivors participating in an exercise group improved their average score on the Hamilton Rating Scale for Depression, which for the control group remained constant. In addition, Lennon and colleagues203 found that greater improvements in depressive symptoms were found in poststroke patients who participated in a 10-week cardiac rehabilitation program than in the usual care group.
Activity, participation, and quality of life
Few investigators have studied training-induced changes in activity, participation, and quality of life for people with neurological disabilities. Evidence has been found regarding the positive impact of exercise training on quality of life for people with MS,199,228,229 CP,205,230 and postpoliomyelitis.231 Turner and colleagues228 reported better physical and mental health, as well as social functioning, in veterans with MS who exercised. However, only 26% of the 2996 veterans surveyed reported engaging in physical activity.228 Dieruf and colleagues230 found that after a 2-week intensive BWSTT program, children with CP reported improvements on a health-related quality-of-life measure. This finding may indicate that with a physically and psychologically challenging intervention program, along with encouragement from their parents and practitioners, children with CP may gain a better perception of their level of control and health and ultimately improve their quality of life.230 In stroke survivors gains in walking capacity have been reported in terms of both gait speed164,204 and walking tolerance.204 However, there is insufficient evidence to support whether cardiovascular exercise improves quality of life after stroke.225,232 Small improvements in Vo2peak can have a substantial impact on the ability to perform daily activities, particularly in individuals with limited cardiac or ventilatory reserves, but there is a lack of documentation of these benefits in people with neurological disorders.
Aerobic exercise prescription to optimize fitness of people with neurological disabilities
Safety and screening
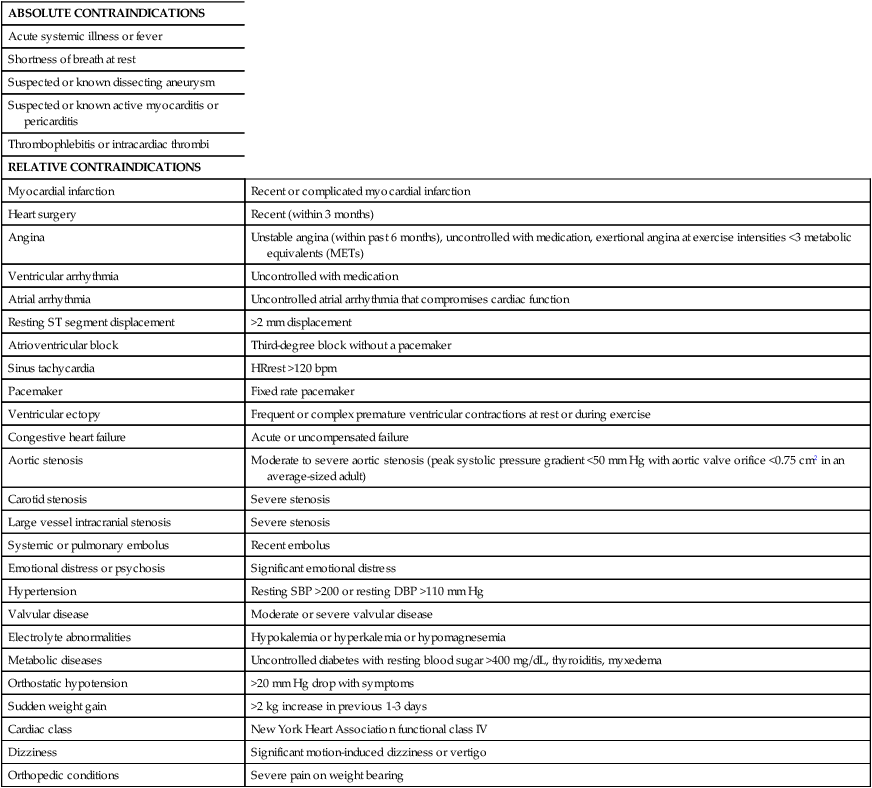
In general terms, the risks imposed by lack of exercise are far greater than those imposed by exercise. Nevertheless, it is of paramount importance to recognize that symptomatic and asymptomatic cardiovascular disease, and related comorbidities such as diabetes, are much more prevalent in patients with many neurological conditions than in the general population. Because there is limited evidence regarding safety of aerobic exercise for people with neurological disorders, best clinical judgment should be used in aerobic exercise prescription. Thorough review of the health records of potential participants is critical to identify problems that may preclude safe participation in aerobic training programs. Cardiac screening, including a physician-monitored exercise stress test with continuous electrocardiographic and periodic BP monitoring, is essential for those with known or suspected cardiac comorbidities. Table 30-3 provides a compilation of contraindications to testing and training.27,233 Before an exercise program is implemented without preliminary exercise testing, the following should be considered: (1) careful screening for possible contraindications must be conducted, (2) training must be done under the close surveillance of trained personnel, (3) a period of continuous electrocardiography and telemetry at the initiation of training is recommended, and (4) monitoring of BP, HR, and signs of exercise intolerance is essential. Furthermore, for subjects with pulmonary comorbidities such as chronic obstructive pulmonary disease, O2 saturation levels should be monitored, with saturation levels less than 85% as the criterion to terminate exercise.234
TABLE 30-3 
CONTRAINDICATIONS TO EXERCISE TESTING AND AEROBIC TRAINING
| ABSOLUTE CONTRAINDICATIONS | |
| Acute systemic illness or fever | |
| Shortness of breath at rest | |
| Suspected or known dissecting aneurysm | |
| Suspected or known active myocarditis or pericarditis | |
| Thrombophlebitis or intracardiac thrombi | |
| RELATIVE CONTRAINDICATIONS | |
| Myocardial infarction | Recent or complicated myocardial infarction |
| Heart surgery | Recent (within 3 months) |
| Angina | Unstable angina (within past 6 months), uncontrolled with medication, exertional angina at exercise intensities <3 metabolic equivalents (METs) |
| Ventricular arrhythmia | Uncontrolled with medication |
| Atrial arrhythmia | Uncontrolled atrial arrhythmia that compromises cardiac function |
| Resting ST segment displacement | >2 mm displacement |
| Atrioventricular block | Third-degree block without a pacemaker |
| Sinus tachycardia | HRrest >120 bpm |
| Pacemaker | Fixed rate pacemaker |
| Ventricular ectopy | Frequent or complex premature ventricular contractions at rest or during exercise |
| Congestive heart failure | Acute or uncompensated failure |
| Aortic stenosis | Moderate to severe aortic stenosis (peak systolic pressure gradient <50 mm Hg with aortic valve orifice <0.75 cm2 in an average-sized adult) |
| Carotid stenosis | Severe stenosis |
| Large vessel intracranial stenosis | Severe stenosis |
| Systemic or pulmonary embolus | Recent embolus |
| Emotional distress or psychosis | Significant emotional distress |
| Hypertension | Resting SBP >200 or resting DBP >110 mm Hg |
| Valvular disease | Moderate or severe valvular disease |
| Electrolyte abnormalities | Hypokalemia or hyperkalemia or hypomagnesemia |
| Metabolic diseases | Uncontrolled diabetes with resting blood sugar >400 mg/dL, thyroiditis, myxedema |
| Orthostatic hypotension | >20 mm Hg drop with symptoms |
| Sudden weight gain | >2 kg increase in previous 1-3 days |
| Cardiac class | New York Heart Association functional class IV |
| Dizziness | Significant motion-induced dizziness or vertigo |
| Orthopedic conditions | Severe pain on weight bearing |
In the past, clinicians were apprehensive about the possibility that the overload necessary to achieve an aerobic training effect could aggravate spasticity in patients with neurological disorders; however, such concerns have not been substantiated.235–238 On observing that the muscles of most patients (81%) in the subacute stroke period were nonspastic, Sommerfeld and colleagues237 postulated that focusing on spasticity may be out of step with its clinical importance. Furthermore, there is evidence from studies of cats239 and humans after SCI240 that treadmill training may, in fact, reduce spasticity by improving stretch reflex modulation.
Another concern raised regarding the implementation of aerobic training in neurological disorders is the potential for eliciting excessive fatigue. For people with MS, increased fatigue levels have been reported after high-intensity exercise241; however, exercising at an appropriate intensity has been shown to yield benefits without aggravating fatigue.242 A preliminary study involving people with MS reported that although fatigue was a significant problem for most subjects, a single bout of low- to moderate-intensity exercise had no deleterious effects on fatigue levels immediately after, and at 24 hours after, the exercise session.243 Dawes and colleagues244 found that for most of their subjects early after traumatic brain injury, increasing the workload during cycling exercises did not elicit a disproportionate increase in Vo2.
Initiation of training
Most of the training studies on populations with neurological disorders have involved patients with chronic neurological impairments; however, the optimal time to introduce training is unknown. Macko and colleagues245 expressed caution about training in the early poststroke period, speculating that abnormal cardiovascular responses to exercise (e.g., hypotension, arrhythmia) may impede perfusion of ischemic brain tissue during the period when cerebral autoregulation is most often impaired. Nevertheless, in one study, training was initiated 8 to 21 days after stroke without complications.50 In addition, an exercise rehabilitation trial, also involving patients in the hyperacute stage poststroke, began early mobilization within 24 hours of stroke onset.246 The intervention group receiving early mobilization training reported fewer nonserious adverse events, and there were no differences in the total number of serious adverse events and fall rate when compared with the group receiving usual care.246 Furthermore, because there is increased plasticity (e.g., axonal sprouting and neurogenesis) of the periinfarct cortex during the first month after an ischemic stroke, early training may accelerate functional recovery.247
Training environment
High-risk individuals, such as patients in the early stages of neurological recovery or with cardiac comorbidities, should be trained in a setting with quick access to emergency medical equipment and trained personnel. An adverse event protocol should be posted and rehearsed. Lower-risk individuals, after appropriate screening to ensure an appropriate response to exercise, can be trained in supervised community248 or home-based204 aerobic exercise programs. One study involving postpolio patients reported reductions in fatigue and improvements in quality of life but found no changes in exercise capacity when patients were trained in either a hospital or home setting.231 However, Hassett and colleagues249 reported similar gains in cardiovascular endurance in poststroke patients training in either an unsupervised home-based or a supervised facility-based exercise program. Regardless of the setting, certain safeguards are required. Because thermal dysregulation is common in patients with neurological disability, particularly MS250 and spinal cord injuries,251 the ambient temperature should be carefully controlled and fans, spray bottles, towels, and a water cooler are recommended. Hydration before and during exercise and rehydration after exercise should be monitored by use of a water bottle with volumetric indicators. The exercise area should be wheelchair accessible, free of obstacles and blunt objects, and sufficiently large to permit safe transfer to and from exercise equipment.
Duration of program
A meaningful increase in aerobic capacity (i.e., greater than 10% improvement) of individuals without neurological impairment is unlikely to occur in less than 4 weeks.252 The minimal exposure required for people with neurological disabilities has not been fully investigated. However, da Cunha and colleagues50 reported a mean improvement of 35% in Vo2peak after 2 to 3 weeks of treadmill ergometry in six people who had had a stroke less than 1 month previously. Regardless of the minimum, participation in training must be sustained indefinitely to prevent return to the deconditioned state measured at the beginning of the program. Therefore a maintenance program should be followed after termination of formal training sessions.
Frequency and duration of sessions
To optimize aerobic training, three to five sessions per week are required, although fitness can improve with twice-weekly sessions.27 Although a minimum of 20 minutes of exercise within the target zone for training per session is required to elicit a training effect,27 we documented that patients engaged in 1-hour sessions of stroke rehabilitation spent, on average, less than 3 minutes per session within the training zone.4 For those with low fitness levels or who are very deconditioned (which would include the majority of patients with neurological involvement) training may be initiated with 5-minute exercise “bouts” with rest periods between bouts. Two additional 5-minute periods are required for warmup and cool down; hence the minimal time required to complete a training session is 30 minutes. Incrementally increasing the duration to a target of 40 to 60 minutes of aerobic training is recommended. However, the greater the intensity of exercise, the shorter the duration needed to achieve improvement in cardiopulmonary fitness; conversely, low-intensity exercise can be compensated for by longer duration.253 As well, accumulation of 10- to 15-minute periods of activity throughout the day can yield similar physiological improvements, provided that the total volume of training is comparable.254
Mode of training
To induce central adaptations, training must incorporate large muscle mass activities that require elevated levels of Vo2. Treadmill or overground walking is a preferred mode because of its direct functional nature; however, a variety of disabilities may preclude this approach. Suitable alternatives include the cycle ergometer with toe clips and heel straps, recumbent ergometer, arm-leg ergometer, wheelchair ergometer, and stepping machine and swimming. Indeed, water-based exercise poststroke has shown positive effects on cardiovascular fitness and coping with life after stroke.163 In addition, body-weight–supported treadmill training can also be used during early aerobic training poststroke.50 Although arm ergometry activates a smaller portion of total muscle mass, its effectiveness in the aerobic training of patients with quadriplegia has been demonstrated.255 Innovative approaches have been introduced to overcome limitations to exercise training imposed by upper motor neuron damage. For example, a combination of electric stimulation of lower-extremity muscles and voluntary upper-extremity rowing has been applied to augment the muscle activation of patients after SCI.166 Grealy and colleagues256 piloted use of a virtual reality recumbent ergometer with patients after traumatic brain injury, postulating that the interaction between the training apparatus and the participant might enhance attention to the task of exercising and increase the potential of structural changes in the brain.
A continuous, interval, or circuit training regimen may be used. Typically, training studies involving patients with neurological disabilities have used short bouts of exercise with a gradual transition to continuous training. However, it has been recommended for some time that if continuous training results in either a lack of improvement or a plateau in response, interval training should be instituted.153,257
Muscle strengthening
Traditionally, aerobic training programs emphasized dynamic exercise. However, the addition of resistance training improves outcome.238,258 Moreover, strength training decreases the cardiac demands of daily tasks such as lifting objects or carrying groceries while simultaneously increasing the endurance capacity to sustain these submaximal activities.259 Muscle strengthening exercises should also be carried out 2 or 3 days per week. Key muscle groups (e.g., triceps, biceps, abdominals, hip and knee flexors and extensors, hip abductors, ankle dorsiflexors, and plantarflexors) should be strengthened with one set of 10 to 15 repetitions starting at a low weight and avoiding a Valsalva maneuver.27 Including strength training with aerobic training may produce greater gains in functional and health outcomes. For example, engaging in a combined strength and aerobic training program has been shown to be more effective in improving Vo2peak, walking endurance, and lipid profile in people with type 2 diabetes.260 Improved fitness outcomes have also been reported in people who have had a stroke,238 despite controversy about whether the benefits of strength training of the paretic upper limb poststroke outweigh the potential risk of increased tone and pain, particularly in the shoulder region. However, the meta-analysis by Harris and Eng261 found no reported adverse affects after upper-limb strength training and concluded that upper-limb strength training improves upper-limb strength and function in people poststroke. In people with SCI, increases in fitness level and reduction in shoulder pain have been observed after circuit training involving resistance exercises and arm cranking.262
Intensity of training
Determining an appropriate intensity is the most challenging aspect of exercise prescription. The cardiovascular system responds to overload; hence, the metabolic load must be sufficient to provoke central and peripheral adaptations. However, excessive stress imposed on the heart and contracting skeletal muscles can evoke abnormal clinical signs or symptoms. The initial exercise intensity and progression must be individualized using the participant’s HR or Vo2peak data (Table 30-4). The RPE can serve as a valid proxy to more physiological measures30; ratings of 11 (“fairly light”) to 13 (“somewhat hard”) on the RPE scale of 6 to 20 are recommended for initiation of training.27 The RPE range associated with physiological adaptation to exercise is 12 to 16 on the Borg (6 to 20) category scale or 4 to 6 on the Borg (0 to 10) scale.27 Despite considerable interindividual variation in RPE,263 the ratings have been shown to correlate well with exercise intensity, even in patients taking β-blockers.264 When exercise intensity is being established, other variables (e.g., anginal symptoms, arrhythmias) should also be considered. Continuous monitoring of HR and periodic monitoring of BP and RPE will ensure that an appropriate intensity is sustained during training.
TABLE 30-4 
FORMULAE USED TO DETERMINE THRESHOLD INTENSITY FOR EXERCISE TRAINING
| FORMULA | COMMENTS |
| Karvonen method: HRrest + x% of heart rate reserve unfit (HRR), where HHR = predicted HRmax* − HRrest | Training intensities of 40%-85% HHR are recommended,27 but for patients intensities of 30% HHR can be effective.182 |
| x% of predicted HRmax = 220 − Age, where predicted | Deconditioned individuals can benefit from intensities as low as 55%-64% of predicted HRmax.27 |
| HRmax = 220 − Age OR = 206.9 − (0.67 × age)329; if on β-blockers, predicted HRmax = 164 − 0.7 × Age269 | |
| HRrest + x beats | The recommended intensity after myocardial infarction is HRrest + 20 beats and after cardiac surgery is HRrest + 30 beats.27 |
| x% of Vo2peak | Deconditioned individuals can benefit from intensities as low as 40%-50% of Vo2peak.27 |
In addition to the RPE, another proxy measure of intensity is the talk test, in which the participant’s intensity is regulated by whether he or she can sing (in which case intensity should be increased) or whether he or she is unable to talk (in which case intensity should be decreased). At an appropriate intensity the participant should be able to talk while exercising, as the point of “hearing your breath” while exercising occurs at or near the ventilatory threshold.265 This relationship was confirmed by Foster and colleagues,266 who reported that the exercise intensity at the ventilatory threshold corresponds to the greatest intensity with which a participant can comfortably speak. Recently, the counting talk test (CTT) was introduced as another proxy measure; it measures how high the participant can count aloud without taking a second breath (e.g., “one, one thousand; two, one thousand…”).267 The percentage of resting CTT has been reported to be strongly correlated with the percentage of HR reserve, Vo2 reserve, and RPE, with moderate intensity coinciding with 50% of CTT.267 It should be noted, however, that the validity of the proxy measures of intensity has yet to be validated in neurological populations. For example, in the SCI population, no association was found between RPE and both HR and Vo2.129
The American College of Sports Medicine guidelines recommend light- to moderate-intensity physical activities to optimize cardiopulmonary health.254 In fact, a meta-analysis revealed that for very unfit patients (which would include many people with chronic neurological conditions), the initial intensity can be much lower than previously recommended.182 However, the only consistent beneficial cardiovascular response to low levels of training is reduction in BP in older hypertensive adults. To reduce cardiovascular risk factors and increase cardiopulmonary fitness, moderate- or high-intensity exercise appears to be necessary.202 In agreement, Fisher and colleagues268 reported greater consistent improvements in gait parameters (self-selected gait speed, stride length, and step length), hip and ankle joint excursion, and sit-to-stand measures and lengthening of cortical silent period durations measured through transcranial magnetic stimulation in people with Parkinson disease participating in high-intensity BWSTT when compared with low-intensity or zero-intensity exercise programs. Nevertheless, light-intensity to moderate-intensity physical activity programs may prove adequate to reduce the rate of age-associated deterioration in a variety of physiological functions and in the long run may improve both quantity and quality of life.202
For many people with neurological involvement, determination of an appropriate intensity of exercise is confounded not only by cardiac status but also by the extent of neurological impairment. We have derived guidelines for determining the initial intensity of treadmill training for people after stroke, based on baseline cardiac signs, prescription of β-adrenergic blockade therapy,269 fitness level, and motor control of the involved lower extremity (i.e., Chedoke-McMaster stage of recovery of the leg)270 (Table 30-5).
TABLE 30-5 
GUIDELINES FOR DETERMINING THE INITIAL INTENSITY OF TRAINING OF PEOPLE POSTSTROKE
| LOW INTENSITY | MODERATE INTENSITY | HIGH INTENSITY | |
| Intensity | Minimum target HR = HRrest + 40% HRR | Minimum target HR = HRrest + 50% HRR | Minimum target HR = HRrest + 60% HRR |
| Cardiac signs | Mild-moderate abnormalities on ECG ± BP ± HR responses | Borderline abnormalities on ECG ± BP ± HR responses | Normal ECG ± BP ± HR responses |
| Fitness level | Vo2peak <40% predicted | Vo2peak 40%-60% predicted | Vo2peak >60% predicted |
| Motor control | Chedoke-McMaster stage of leg: 1 or 2 | Chedoke-McMaster stage of leg: 3 or 4 | Chedoke-McMaster stage of leg: >4 |
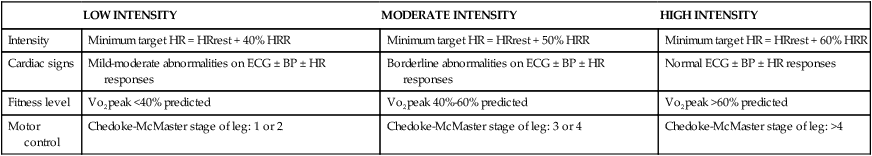
BP, Blood pressure; ECG, electrocardiogram; HR, heart rate; HRR, heart rate reserve.
Music to pace exercise
Music, if properly selected, can be helpful in pacing the repetitive, alternating movements characteristic of aerobic exercise such as walking or cycling. Rossignol and Jones271 found that with close matching of the cadence of music and alternating movements, music can potentiate muscle activation. Similarly, McIntosh and colleagues272 reported that music facilitated the gait pattern of people with Parkinson disease. (Refer to Chapters 4, 20, and 39 for additional information.)
Progression of training program
Exercise progression must be individualized because people with neurological disabilities have a wide range of functional capacities. Progression usually occurs over a 3- to 6-month period from an initial conditioning phase to a training phase and then to a maintenance phase. Generally the first goal of training is to reach a target frequency (i.e., a minimum of 3 days per week), then duration (minimum of 20 minutes), and finally an appropriate intensity (40% to 60% of HR reserve, or 11 to 13 on the Borg scale). Subsequently, exercise duration should be increased as tolerated, every 1 to 3 weeks, with a goal of achieving 20 to 30 minutes of continuous exercise before increasing the intensity.27 Patients with higher baseline fitness levels can be progressed more rapidly than those with lower initial capacities.
Laboratory outcome measures
Laboratory tests are useful not only to identify limitations in exercise capacity and establish exercise training protocols but also to evaluate the effectiveness of a training program. The principal indicator of a training effect is attainment of a higher Vo2peak than was achieved in the pretrained state. The greatest increments occur in individuals with the lowest initial Vo2peak.161 Ideally, Vo2peak should be measured directly because indirect methods of predicting exercise capacity are more variable and prone to error. However, because Vo2peak testing requires special equipment and trained personnel, clinicians often resort to clinical measures of functional capacity.
Clinical outcome measures
Six-minute walk test.
The distance walked in 6 minutes is sometimes used as a clinical surrogate for Vo2peak testing. However, the systemic response to the six-minute walk test (6MWT) is less than that of an incremental test using a treadmill cycle273 or cycle ergometer.274,275 Subjects tend to walk at a constant speed, achieve a Vo2 steady-state condition after the first few minutes of exercise, and, with practice, walk at a pace approaching critical power.275,276 Pang and colleagues277 found a low correlation (r = 0.402) between 6MWT distance and Vo2 in patients after stroke, concluding that the 6MWT alone should not be used as an indication of cardiopulmonary fitness after stroke. The same laboratory recommended that, to enhance the usefulness of the 6MWT, BP and HR should be recorded at initiation and termination of the test.278 Reference equations for the 6MWT can be used to compute the percent of predicted total distance walked in the 6MWT: for men, Distance (m) = (7.57 × Height [cm]) − (5.02 × Age [yr]) − (1.76 × Weight [kg]) − 309; for women, Distance (m) = (2.11 × Height [cm]) − (5.78 × Age [yr]) − (2.29 × Weight [kg]) + 667.279
Shuttle walk test.
The shuttle walk test is a standardized incremental test during which walking is initiated at an audio-guided set pace for a prescribed length of time.280 Walking speed is increased at each stage until the subject can no longer maintain the required pace. Peak systemic responses have been reported to be consistent with those achieved during a progressive cycle test.275 A variation of this test, the endurance shuttle walk test, involves walking as far as possible at a constant speed determined in a previously performed progressive walk test.281
Adherence to program
The benefits of training are lost unless some form of training stimulus is maintained; therefore, sustained behavioral change must be an important goal in any exercise program. A decrease in mobility or inactivity can lead to rapid loss of cardiovascular and pulmonary fitness. For example, a 25% reduction in maximum oxygen uptake has been observed in nondisabled young adults after 3 weeks of bed rest.94 In secondary prevention of stroke, behavioral modifications may be as beneficial as antihypertensive and cholesterol-lowering agents.78 Yet establishing and maintaining a regular fitness regimen in patients with neurological impairments pose challenges. In one study, 39% of 691 patients did not engage in the exercise program created by their physical therapist.282 In addition, 75% of people poststroke reported that they were not ready to incorporate exercise into their lifestyle.203,283
Some individuals are reluctant to engage in exercise owing to the fear of increasing their symptoms. Indeed, people with Parkinson disease avoid exercise out of fear they will increase their already high levels of fatigue.284 Similarly, people with MS avoid exercising to avert increases in their level of fatigue and body temperature.90 Furthermore, the frequency of MS-related symptoms has been found to be significantly and inversely related to physical activity.285 It has been shown that less than 30% of 2995 people with MS reported engaging in any form of exercise,228 with one study revealing an overall adherence rate of 65%.286 Morris and Williams287 reported that many individual factors (e.g., sex, level of disability), social factors, and environmental factors (e.g., access to facilities, travel) influence the level of engagement in exercise and physical activity in people with mixed disabilities. In addition, numerous psychological, cognitive, and emotional factors have been identified as potential mediators of engagement in physical activity (e.g., self-efficacy, attitude, competence, intention, knowledge of health and exercise benefits, motivation, readiness to change, and the value of exercise benefits).288 One study involving people poststroke reported self-efficacy as an important psychological factor predicting engagement in exercise.289 Snook and colleagues285 reported that self-efficacy was significantly and moderately correlated with physical activity in people with MS.
A better understanding of theoretical frameworks of behavior change [see recent overview290] would be helpful for neurorehabilitation clinicians to increase participant engagement. Garner and Page283 exposed community-based, chronic stroke survivors to a theoretically based intervention using the transtheoretical model with five stages of change (i.e., precontemplation, contemplation, preparation, action, and maintenance). Change is mediated at each stage by self-efficacy, decisional balance, and processes of change.291 In a study by Gillham and Endacott,292 a stroke-specific score based on the transtheoretical model was used to assess readiness to change behavior in patients undergoing enhanced secondary stroke prevention. The authors found that the prevention program, which consisted of conventional rehabilitation plus additional advice, motivational interviewing, and telephone support, improved exercise frequency and increased consumption of fruits and vegetables when compared with the control group receiving conventional rehabilitation.292 They also reported a nonsignificant trend of more patients in the enhanced group progressing from contemplation to action stages of change.292 Several other behavioral theories (i.e., social cognitive theory, theory of reasoned action, theory of planned behavior, health belief model, protection motivation theory, and self-determination theory) may also be useful in facilitating long-term engagement.293 The American College of Sports Medicine (ACSM)27 acknowledged that assessing the participants’ self-motivation and readiness for change can provide important information toward adapting the exercise program to meet the specific needs of the participants.
In the cardiac rehabilitation literature, Piepoli and colleagues294 recommended that in order for an individual to pursue and engage in an exercise program, both physiological and psychosocial changes are needed. Progression from promotion of physical activity within the patient’s current domestic, occupational, and leisure settings to participating in vigorous and structured exercise programs is recommended.294 In a systematic review also involving people with cardiac conditions, evidence supported the use of educational sessions, spousal and family involvement, flexible and convenient scheduling of sessions, ongoing positive reinforcement and enjoyment (e.g., motivational letters, pamphlets, conversations), and self-management aids (e.g., self-report diets, activity logs, individualized goal setting).295 Other strategies to enhance long-term exercise adherence include gradually progressing the exercise intensity, establishing regularity of training sessions, minimizing the risk of muscular soreness, and exercising in groups. Training sessions should be scheduled at a convenient time and in an accessible location, and if feasible, assistance with transportation and childcare should be offered. With the established emphasis on patient-centered care, it is consistent to have the patient identify individual goals and time frames to achieve these goals. Incorporating physical activity within everyday life will help to promote cardiovascular and pulmonary fitness as a life activity and not solely an exercise program conducted within a medical environment or rehabilitation setting.
Conclusion
APPENDIX 30-A  Abbreviations Commonly Used When Discussing Cardiovascular and Pulmonary Problems and Their Effect on Function
ADL: Activities of daily living
a-vO2diff: Arteriovenous oxygen difference
a-vO2diffmax: Maximal arteriovenous oxygen difference
ICF: International Classification of Functioning, Disability and Health
RER: Respiratory exchange ratio
RERpeak: Peak respiratory exchange ratio
RPE: Rate of perceived exertion
Vco2: Carbon dioxide production per minute
Vo2: Oxygen consumption per minute