Chapter 7
Cardiopulmonary Exercise Testing
1. Understand and select an appropriate exercise protocol based on the reason for performing the test.
2. Identify the ventilatory/anaerobic threshold.
3. Describe two methods for measuring ventilation, oxygen consumption, and carbon dioxide production during exercise.
4. Identify indications for terminating a cardiopulmonary stress test.
1. Describe the normal physiologic changes that occur during exercise when workload is increased.
2. Classify exercise limitation as caused by cardiovascular, ventilatory, gas exchange, or blood gas abnormalities or deconditioning.
3. Understand the importance of evaluating breathing kinetics during exercise.
1. Presence and nature of ventilatory limitations to work
2. Presence and nature of cardiovascular limitations to work
3. Extent of conditioning or deconditioning
4. Maximum tolerable workload and safe levels of daily exercise
5. Extent of disability for rehabilitation purposes
6. Oxygen (O2) desaturation and appropriate levels of supplemental O2 therapy
7. Outcome measurement after a treatment plan (e.g., surgery or medical)
Exercise protocols
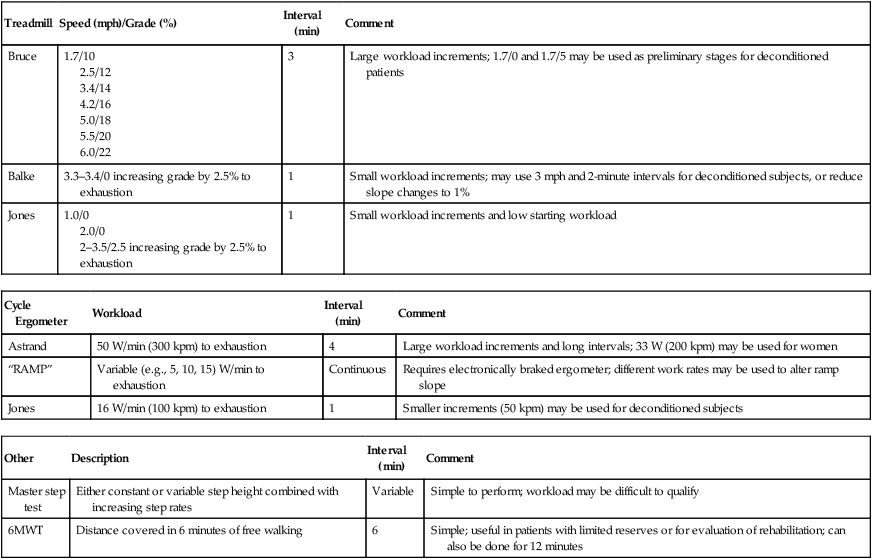
In a typical incremental test, the patient’s workload increases at predetermined intervals (Table 7-1). The workload may be increased at intervals of 1–6 minutes. Measurements (e.g., BP or blood gases) are usually made during the last 20–30 seconds of each or alternating intervals. Complex measurements (e.g., cardiac output) may require longer intervals. Computerized systems that continuously measure ventilation, gas exchange, and cardiopulmonary variables permit shorter intervals to be used. The combination of intervals and work increments should allow the patient to reach exhaustion or symptom limitation within a reasonable period. An incremental test lasting 8–10 minutes after a warm-up is typically used as the target. If a computerized cycle ergometer is used, a “ramp” test may be performed. In a ramp protocol, the ergometer’s resistance is increased continuously at a predetermined rate (usually measured in watts per minute).
Table 7-1
| Treadmill | Speed (mph)/Grade (%) | Interval (min) | Comment |
| Bruce | 1.7/10 2.5/12 3.4/14 4.2/16 5.0/18 5.5/20 6.0/22 |
3 | Large workload increments; 1.7/0 and 1.7/5 may be used as preliminary stages for deconditioned patients |
| Balke | 3.3–3.4/0 increasing grade by 2.5% to exhaustion | 1 | Small workload increments; may use 3 mph and 2-minute intervals for deconditioned subjects, or reduce slope changes to 1% |
| Jones | 1.0/0 2.0/0 2–3.5/2.5 increasing grade by 2.5% to exhaustion |
1 | Small workload increments and low starting workload |
| Cycle Ergometer | Workload | Interval (min) | Comment |
| Astrand | 50 W/min (300 kpm) to exhaustion | 4 | Large workload increments and long intervals; 33 W (200 kpm) may be used for women |
| “RAMP” | Variable (e.g., 5, 10, 15) W/min to exhaustion | Continuous | Requires electronically braked ergometer; different work rates may be used to alter ramp slope |
| Jones | 16 W/min (100 kpm) to exhaustion | 1 | Smaller increments (50 kpm) may be used for deconditioned subjects |
| Other | Description | Interval (min) | Comment |
| Master step test | Either constant or variable step height combined with increasing step rates | Variable | Simple to perform; workload may be difficult to qualify |
| 6MWT | Distance covered in 6 minutes of free walking | 6 | Simple; useful in patients with limited reserves or for evaluation of rehabilitation; can also be done for 12 minutes |
Steady-state tests are designed to assess cardiopulmonary function under conditions of constant metabolic demand. Steady-state conditions are usually defined in terms of HR, oxygen consumption (![]() o2), or ventilation (
o2), or ventilation (![]() E). If the HR remains unchanged for 1 minute at a given workload, a steady state may be assumed. Steady-state tests are useful for assessing responses to a known workload. Steady-state protocols may be used to evaluate the effectiveness of various therapies or pharmacologic agents on exercise ability. For example, an incremental test may be performed initially to determine a patient’s maximum tolerable workload. Then a steady-state test may be used to evaluate specific variables at a submaximal level, such as 50% and 75% of the highest
E). If the HR remains unchanged for 1 minute at a given workload, a steady state may be assumed. Steady-state tests are useful for assessing responses to a known workload. Steady-state protocols may be used to evaluate the effectiveness of various therapies or pharmacologic agents on exercise ability. For example, an incremental test may be performed initially to determine a patient’s maximum tolerable workload. Then a steady-state test may be used to evaluate specific variables at a submaximal level, such as 50% and 75% of the highest ![]() o2 achieved. The patient exercises for 5–8 minutes at a predetermined level to allow a steady state to develop. Measurements are performed during the last 1 or 2 minutes of the period. Successive steady-state determinations at higher power outputs may be made continuously or spaced with short periods of light exercise or rest. A similar protocol may be used for evaluation of exercise-induced bronchospasm (see Chapter 9).
o2 achieved. The patient exercises for 5–8 minutes at a predetermined level to allow a steady state to develop. Measurements are performed during the last 1 or 2 minutes of the period. Successive steady-state determinations at higher power outputs may be made continuously or spaced with short periods of light exercise or rest. A similar protocol may be used for evaluation of exercise-induced bronchospasm (see Chapter 9).
The six-minute walk test is a simple test that does not require any sophisticated equipment. It is typically performed to assess response to a medical or surgical intervention but has also been used to assess functional capacity as well as to estimate morbidity and mortality. A 100-foot (minimum) hallway that is free of obstructions is needed to perform the test (Figure 7-1). Equipment needed includes the following:
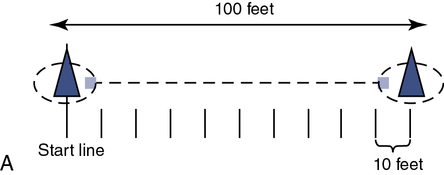
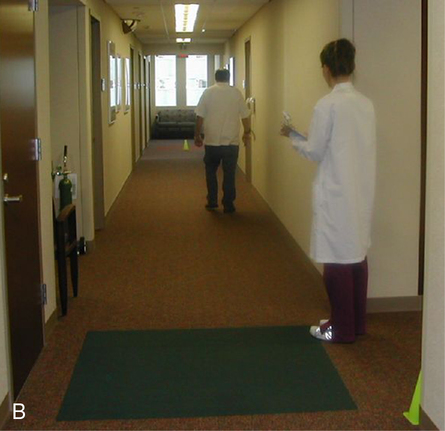
A and B, The corridor should be a minimum of 100 ft (33 m) with the ends of the course marked with small traffic cones. The technologist should remain in the center of the course when feasible and give standardized statements of encouragement to decrease intratester variability. Monitoring oxygenation using pulse oximetry can be facilitated by using telemetry-pulse oximetry. Standard phases of encouragement:
“You are doing well—you have five minutes to go.”
“You are doing well—you have four minutes to go.”
“—you’re half way done.”
• A method to mark the endpoints of the course (small traffic cones)
• Sphygmomanometer and appropriate sized cuff
• Rating of perceived exertion scale (Borg scale)
• Easy access to the emergency response team (e.g., telephone, nurse call light)
An oxygen delivery device should be available, if appropriate. A pulse oximeter is a useful adjunct but is not required. The objective of the test is to have the patient walk as far as possible in 6 minutes. The patient should be encouraged throughout the test, and it has been recommended that standard phrases be used to reduce intratester and test-to-test variability. Resting during the tests is permitted with encouragement to continue walking as soon as possible, while the timer continues to run. If pulse oximetry is measured, it should be done at the beginning and end of exercise but not during exercise unless a telemetry-type oximeter is available. Documentation should include the distance walked, the oxygen flow and delivery device if used, the mode of oxygen transport (e.g., pulling an O2 cart has a different impact on work than carrying a unit), and the ratings of perceived exertion (RPE). See Table 7-2 for an example of a data record used to record six-minute walk data from a patient.
Table 7-2
| Date | Distance (ft) | Inspired Gas | Mode of O2 Transport | SpO2 (End Exercise) | RPE (6–20) |
| 5/18/2011 | 1173 | 3.0 L/min NC | Patient carried unit | 90 | 17 |
| 7/26/2011 | 1266 | 3.0 L/min NC | Patient carried unit | 94 | 18 |
| 8/15/2011 | 1420 | 2.5 L/min | Patient carried unit | 92 | 17 |

Exercise workload
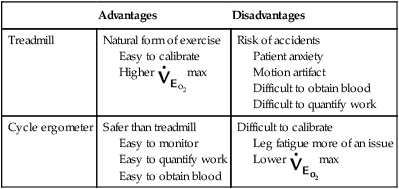
Two methods of varying exercise workload are commonly used: the treadmill and the cycle ergometer (Figures 7-2 and 7-3). Each device has advantages and disadvantages (Table 7-3). Other methods sometimes used include arm ergometers, steps, and free running or walking (as previously described for the 6MWT).
Table 7-3
| Advantages | Disadvantages | |
| Treadmill | Natural form of exercise Easy to calibrate Higher |
Risk of accidents Patient anxiety Motion artifact Difficult to obtain blood Difficult to quantify work |
| Cycle ergometer | Safer than treadmill Easy to monitor Easy to quantify work Easy to obtain blood |
Difficult to calibrate Leg fatigue more of an issue Lower |
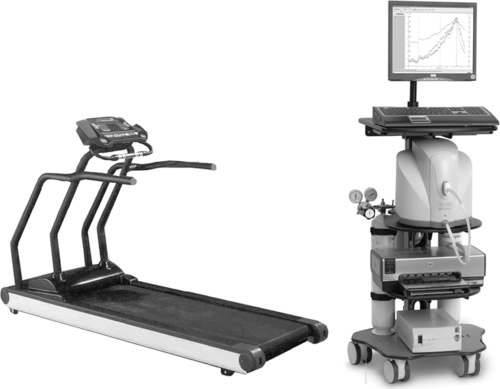
The treadmill is controlled by a programmable interface so that different protocols (e.g., speeds and percent grade) can be selected. Manual control is also provided. Cardiac monitoring and exhaled gas analysis are integrated in a single computer system. The 12-lead ECG recordings or rhythm strips can be taken automatically at each exercise level. Most automated systems provide “freeze-frame” technology that allows for close review during the test and storage of data for retrieval and analysis for significant arrhythmia and ST abnormalities after the test. The same system can be interfaced to a cycle ergometer (see Figure 7-3). (Courtesy Medical Graphics Inc., St. Paul, Minn.)
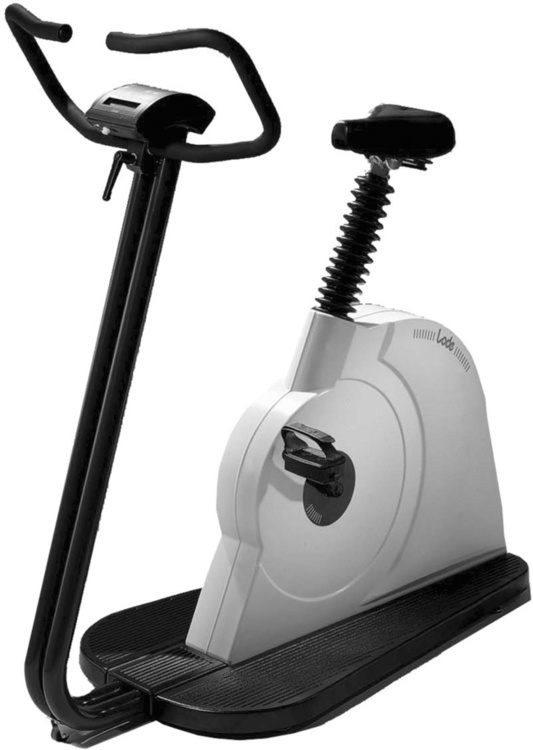
Workload (i.e., resistance) is usually managed by interfacing the ergometer to a computer. (Courtesy Medical Graphics Inc., St. Paul, Minn.)
The cycle ergometer allows workload to be varied by adjustment of the resistance to pedaling and by the pedaling frequency, usually specified in revolutions per minute (rpm). The flywheel of a mechanical ergometer turns against a belt or strap, both ends of which are connected to a weighted physical balance. The diameter of the wheel is known, and the resistance can be easily measured. When pedaling speed (usually 50–90 rpm) is determined, the amount of work performed can be accurately calculated. One of the chief advantages of the cycle ergometer is that the workload is independent of the weight of the patient. Unlike the treadmill, ![]() o2 can be reasonably estimated if the pedaling speed and resistance are carefully measured. The normal relationship of workload in watts to oxygen consumption is 10 mL/watt. Another advantage of ergometers is better stability of the patient for gas collection, blood sampling, and blood pressure monitoring. Electronically braked cycle ergometers (see Figure 7-3) provide a smooth, rapid, and more reproducible means of changing exercise workload than mechanical ergometers. Electronically braked ergometers allow continuous adjustment of workload independent of pedaling speed. However, accuracy of the ergometer output may be dependent on a manufacturer’s specified pedal cadence range (e.g., 40–100 rpm). This feature permits the exercise level to be ramped (i.e., the workload increases continuously rather than in increments). The ramp test allows the patient to advance from low to high workloads quickly and provides all of the information normally sought during a progressive maximal exercise test. A ramp protocol typically requires electronic control (usually by a computer) for adjustment of the workload and rapid collection of physiologic data. Box 7-1 provides a systematic method of determining the desired workload increments using a cycle ergometer.
o2 can be reasonably estimated if the pedaling speed and resistance are carefully measured. The normal relationship of workload in watts to oxygen consumption is 10 mL/watt. Another advantage of ergometers is better stability of the patient for gas collection, blood sampling, and blood pressure monitoring. Electronically braked cycle ergometers (see Figure 7-3) provide a smooth, rapid, and more reproducible means of changing exercise workload than mechanical ergometers. Electronically braked ergometers allow continuous adjustment of workload independent of pedaling speed. However, accuracy of the ergometer output may be dependent on a manufacturer’s specified pedal cadence range (e.g., 40–100 rpm). This feature permits the exercise level to be ramped (i.e., the workload increases continuously rather than in increments). The ramp test allows the patient to advance from low to high workloads quickly and provides all of the information normally sought during a progressive maximal exercise test. A ramp protocol typically requires electronic control (usually by a computer) for adjustment of the workload and rapid collection of physiologic data. Box 7-1 provides a systematic method of determining the desired workload increments using a cycle ergometer.
Workload may be expressed quantitatively in several ways:
• Work is normally expressed in kilopond-meters (kpm). One kilopond-meter equals the work of moving a 1-kg mass a vertical distance of 1 m against the force of gravity.
• Power is expressed in kilopond-meters per minute (i.e., work per unit of time) or in watts. One watt equals 6.12 kpm/min (100 watts = ∼ 600 kpm/min). The normal relationship of work, in watts, to oxygen consumption is 10 mL/watt.
• Energy is expressed by oxygen consumption (![]() o2), in liters or milliliters per minute (STPD) or in terms of metabolic equivalents (METs). Resting or baseline
o2), in liters or milliliters per minute (STPD) or in terms of metabolic equivalents (METs). Resting or baseline ![]() o2 can be measured as described in the following paragraphs or estimated. For purposes of standardization, 1 MET is considered equal to 3.5 mL O2/min/kg.
o2 can be measured as described in the following paragraphs or estimated. For purposes of standardization, 1 MET is considered equal to 3.5 mL O2/min/kg.
A number of cardiopulmonary exercise variables may be used, depending on the clinical questions to be answered. Schemes for measuring these variables are described in Table 7-4. Graded exercise with monitoring of only BP and ECG may be limited to the evaluation of patients with suspected or known coronary artery disease.
Table 7-4
Cardiopulmonary Exercise Variables
| Variables Measured | Uses |
| ECG, blood pressure, SpO2 | Limited to suspected or known coronary artery disease; pulse oximetry may be misleading if used without blood gases |
| All of the above plus ventilation |
Noninvasive estimate of ventilatory/anerobic threshold (AT), quantify workload; discriminate between cardiovascular and pulmonary limitation to work |
| All of the above plus arterial blood gases | Detailed assessment of gas exchange abnormalities; calculation of VD/VT; titration of O2 In exercise desaturation; measurement of pH and lactate possible |
| All of the above plus mixed venous blood gases | Cardiac output by Fick method, noninvasive techniques, calculation of shunt, thermodilution cardiac output, pulmonary artery pressures, calculation of pulmonary and systemic vascular resistances |

Cardiovascular monitors during exercise
Heart Rate and Electrocardiogram
Heart rate and rhythm should be monitored continuously using one or more modified chest leads. Standard precordial chest lead configurations (V1–V6) allow comparison with resting 12-lead tracings (Criteria for Acceptability 7-1). Twelve-lead monitoring during exercise is practical with electrocardiographs designed for exercise testing. These instruments incorporate filters (digital or analog) that eliminate movement artifact and provide ST-segment monitoring. Limb leads normally must be moved to the torso for ergometer or treadmill testing (modified leads). A resting ECG should be performed to record both the standard and modified leads. Single-lead monitoring allows only for gross arrhythmia detection and HR determination. It may not be adequate for testing patients with known or suspected cardiac disease.
The ECG monitor should allow the assessment of intervals and segments up to the patient’s maximal heart rate (HRmax). Computerized arrhythmia recording or manual “freeze-frame” storage allows the subsequent evaluation of conduction abnormalities while the testing protocol continues (Figure 7-4). Some digital ECG systems generate computerized “median” complexes averaged from a series of beats. These may be helpful in analyzing ST-segment depression. The “raw,” or nondigitized, ECG should also be available. Significant ST-segment changes should be easily identifiable from the tracing up to the predicted HRmax.
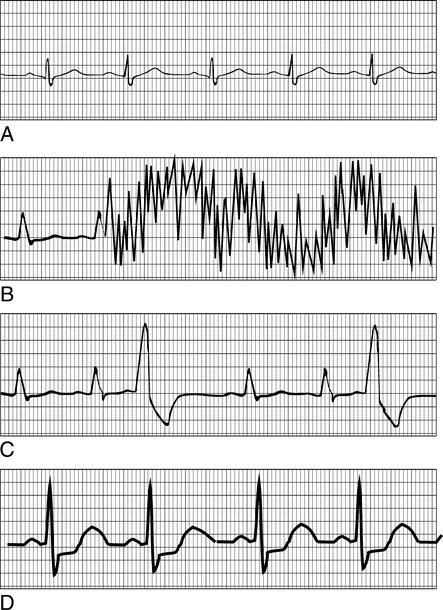
A, Standard rhythm lead showing normal sinus rhythm. B, Motion artifact. The most common monitoring problem during exercise is poor ECG signals because of motion. C, Premature ventricular contractions (PVCs). PVCs are a common occurrence during exercise in patients with underlying cardiac disease. Increased rate of PVCs, couplets (two in a row), or triplets (three in a row) may be indications for limiting the exercise test. D, ST-segment changes. Depression (and sometimes elevation) of the ST segment of the ECG is usually considered evidence of cardiac ischemia. Depression (or elevation) of the ST segment greater than 1–2 mm for 0.08 seconds or longer is consistent with significant ischemia.
Motion artifact is the most common cause of unacceptable ECG recordings during exercise. Allowing the patient to practice pedaling on the ergometer or walking on the treadmill permits adequacy of the ECG signal to be checked. Carefully applied electrodes, proper skin preparation, and secured lead wires greatly minimize movement artifact (see Criteria for Acceptability 7-1). Electrodes specifically designed for exercise testing are helpful. Most of these use extra adhesive to ensure electrical contact even when the patient begins perspiring. The skin sites should be carefully prepared. Removal of surface skin cells by gentle abrasion is recommended. Patients with excessive body hair may require shaving of the electrode site to ensure good electrical contact. Lead wires must be securely attached to the electrodes. Devices that limit the movement of the lead wires can greatly reduce motion artifact. Spare electrodes and lead wires should be available to avoid test interruption in the event of an electrode failure.
 1
1 2
2Equation 1 yields slightly higher predicted values in young adults. Equation 2 produces higher values in older adults. Other methods of predicting HRmax vary, depending on the type of exercise protocol used in deriving the regression data. Specific criteria for terminating an exercise test should include factors based on symptom limitation as well as HR and BP changes (see the section on safety).

Increases in stroke volume account for a smaller portion of the increase in CO, primarily at low and moderate workloads (Figure 7-5). While HR increases from 70 beats/min up to 200 beats/min in young healthy upright patients, SV increases from 80 mL to approximately 110 mL. At low workloads, increase in CO depends on the patient’s ability to increase both HR and SV. At high workloads, further increases in CO result almost entirely from the increase in HR.
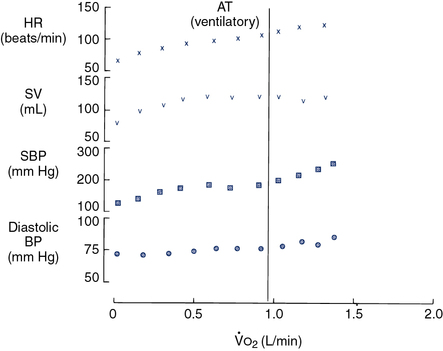
Four cardiovascular parameters are plotted against
 o2 as a measure of work rate, as they might appear in a normal healthy adult. Heart rate (HR) increases linearly with work. Maximal HR is predicted by the age of the patient. Stroke volume (SV) increases initially at low to moderate workloads but then becomes relatively constant. Cardiac output (HR × SV) increases at low and moderate workloads because of increases in both HR and SV (see text). At higher levels of work, increases in HR are responsible for increasing cardiac output. Systolic blood pressure (BP) increases by approximately 100 mm Hg in a linear fashion, whereas diastolic BP increases only slightly.
Reduced HR response may occur in patients who have ischemic heart disease or complete heart block (Interpretive Strategies 7-1). Low HR is also common in patients who have been treated with drugs that block the effects of the sympathetic nervous system (β-blockers, calcium channel blockers). HR response may also be reduced if the autonomic nervous system is impaired or the heart is denervated, as occurs after cardiac transplantation (e.g., chronotropic insufficiency).
The most common arrhythmia that occurs during exercise testing is the premature ventricular contraction (PVC) (see Figure 7-4). Exercise-induced PVCs occurring at a rate of more than 10 per minute are often found in ischemic heart disease. Increased PVCs during exercise may also be seen in mitral valve prolapse. Coupled PVCs (couplets) often precede ventricular tachycardia or ventricular fibrillation. Occurrence of couplets or frequent PVCs may be an indication for terminating the exercise evaluation. Some patients with PVCs at rest or at low workloads may have these ectopic beats suppressed as exercise intensity increases. The most serious ventricular arrhythmias are sometimes seen in the immediate post-exercise phase.
Shortness of breath (SOB) brought on by exertion is perhaps the most widespread indication for cardiopulmonary exercise evaluation. The combination of cardiovascular parameters (e.g., HR, SV) with data obtained from the analysis of exhaled gas (i.e., ![]() o2) permits the assessment of dyspnea on exertion. Table 7-5 generalizes some of the basic relationships between cardiovascular and pulmonary exercise responses. These relationships help delineate whether exertional dyspnea is a result of cardiac or pulmonary disease, or whether the patient is simply deconditioned. In some instances, poor effort may mimic exertional dyspnea. Comparison of data from cardiovascular and exhaled gas variables can confirm inadequate patient effort.
o2) permits the assessment of dyspnea on exertion. Table 7-5 generalizes some of the basic relationships between cardiovascular and pulmonary exercise responses. These relationships help delineate whether exertional dyspnea is a result of cardiac or pulmonary disease, or whether the patient is simply deconditioned. In some instances, poor effort may mimic exertional dyspnea. Comparison of data from cardiovascular and exhaled gas variables can confirm inadequate patient effort.
Table 7-5
Exercise Variables and Dyspnea*
| Cardiac | Ventilatory | Deconditioned | Poor Effort | |
| Less than 80% of predicted | Less than 80% of predicted | Less than 80% of predicted | Less than 80% of predicted | |
| Less than 70% of MVV | Greater than 90% of MVV; |
Less than 70% of MVV | Variable | |
| Anaerobic threshold | Achieved at low |
Usually not achieved | Achieved at low |
Not achieved |
| HR | Greater than 85% of predicted | Less than 85% of predicted | Greater than 85% of predicted | Less than 85% of predicted |
| ECG/signs of ischemia | ST changes, arrhythmias, chest pain | Usually normal | Normal | Normal |
| Sao2 | Greater than 90% | Often less than 90%, hypoxemia | Greater than 90% | Greater than 90% |

MVV, Maximal voluntary ventilation; SaO2, arterial oxygen saturation.
*This table compares the usual findings for the exercise variables listed in subjects with dyspnea caused by cardiac disease, pulmonary disease, or deconditioning. Some subjects may have dyspnea because of a combination of causes. Poor effort during exercise may result from improper instruction, lack of understanding by the subject, or lack of motivation by the subject.
Blood Pressure
Continuous monitoring of the BP may be accomplished by the connection of a pressure transducer to an indwelling arterial catheter (Figure 7-6). An indwelling line allows the continuous display and recording of systolic, diastolic, and mean arterial pressures. In addition, the catheter provides ready access for arterial blood sampling. Arterial catheterization may be easily accomplished using either the radial or the brachial site. The catheter must be adequately secured to prevent loss of patency during vigorous exercise. Insertion of arterial catheters presents some risk of blood splashing or spills. Adequate protection for the individual inserting the catheter, as well as for those withdrawing specimens, is essential. See Chapter 6 for specific recommendations regarding arterial sampling via catheters.
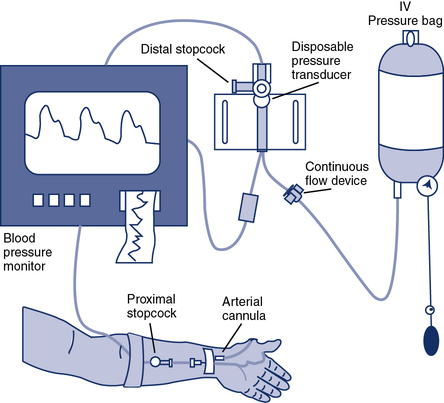
A catheter is inserted into the radial or brachial artery. Pressure tubing connects the catheter to a continuous flow device that maintains a constant pressure (and a small flow of solution) against the arterial line to prevent backflow of blood into the system. The continuous flow device also allows flushing of the system. A pressure transducer assembly is connected in line with the tubing. Pressure changes in the system are transmitted via a thin membrane to the transducer. Blood samples may be drawn by inserting a heparinized syringe at a stopcock located near the indwelling catheter (blood pressure signal is temporarily lost during sampling). A similar assembly can be used for connection to a Swan-Ganz catheter for pulmonary artery monitoring during exercise.
Systolic BP increases in healthy patients during exercise from 120 mm Hg up to approximately 200–250 mm Hg (see Figure 7-5). Diastolic pressure normally rises only slightly (10–15 mm Hg) or not at all. The mean arterial pressure rises from approximately 90 mm Hg to approximately 110 mm Hg, depending on the changes in systolic and diastolic pressures. The increase in systolic pressure is caused almost completely by increased CO and mostly by the SV. Even though CO may increase fivefold, (e.g., from 5–25 L/min), the systolic pressure only increases twofold. Systolic pressure only doubles because of the tremendous decrease in peripheral vascular resistance. Most of this decrease in resistance results from vasodilatation in exercising muscles. Increased systolic pressure (>250–300 mm Hg) should be considered an indication for terminating the exercise evaluation (Box 7-2). Similarly, if the systolic pressure fails to rise with increasing workload, the exercise test should be terminated and the patient’s condition stabilized. Variations in BP during exercise are often caused by the patient’s respiratory effort. Phasic changes with respiration are particularly common in patients who have large transpulmonary pressures because of lung disease (i.e., pulsus paradoxus). Differences of as much as 30 mm Hg between inspiration and expiration may be seen during the continuous monitoring of arterial pressure.
Safety
Safe and effective exercise testing for cardiopulmonary disorders requires careful pre-test evaluation to identify contraindications to the test procedure (Box 7-3). A preliminary workup should include a complete history and physical examination by the referring physician or the physician performing the stress test. Preliminary laboratory tests should include a 12-lead ECG, chest x-ray study, baseline pulmonary function studies before and after bronchodilator therapy, and routine laboratory examinations such as complete blood count and serum electrolytes.
The risks and benefits of the entire exercise procedure should be explained to the patient. Appropriate informed consent should be obtained. This includes an explanation of any alternative tests that might be done and what the consequences of not performing the stress test might be. A physician experienced in exercise testing should supervise the test. Tests may be performed by qualified practitioners on patients younger than 40 years with no known risk factors, provided a physician is immediately available. Criteria for terminating the exercise evaluation before the specified endpoint or symptom limitation occurs are listed in Box 7-2.
Ventilation during exercise
• Frequency of breathing; respiratory rate (fb)
• Oxygen consumption; oxygen uptake (![]() o2)
o2)
• Carbon dioxide production (![]() co2)
co2)
• Respiratory exchange ratio (RER)
Equipment Selection and Calibration
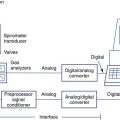
The two common methods of exhaled gas analysis use either a mixing chamber (Figure 7-7) or computerized breath-by-breath measurements (Figure 7-8). Pneumotachometers are used in both mixing chamber and breath-by-breath systems and should be calibrated with a known volume (3-L syringe) or flow signal (Criteria for Acceptability 7-2). The flow sensor’s accuracy should comply with the criteria set by the American Thoracic Society and European Respiratory Society (ATS-ERS) for flow-measuring devices (e.g., ± 3.5% or 50 mL, whichever is greater and at three flow rates). Validation of a flow-measuring device can be performed by connecting it in series with a volume-based spirometer of known accuracy. Gas analyzers should also be calibrated and checked before each test procedure. Two-point calibration with gases that approximate the physiologic range to be tested provide the most appropriate means of ensuring accuracy. Three-point calibration is necessary to check the linearity of the analyzers. Table 7-6 lists some recommended gas concentrations for calibration of analyzers to be used for exercise tests.
Table 7-6
Recommended Calibration Gases for Exercise Systems
| Type of Exercise Test | Suggested Calibration Gases |
| Maximal or submaximal with subject breathing room air | 20.9% O2, 0% CO2 15% O2, 5% CO2 |
| Maximal or submaximal with subject breathing supplementary O2 (may also be used to check linearly) | 20.9% O2, 0% CO2 15% O2, 5% CO2 26% O2, 0% CO2 |
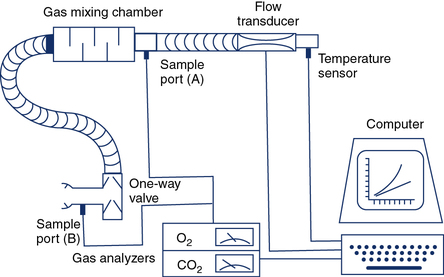
The patient inspires room air through a one-way valve and expires through large-bore tubing into a mixing chamber with a volume of approximately 5 L. Baffles in the chamber cause the gas to be thoroughly mixed so that it is representative of mixed expired gas. A small volume is extracted at sample port A and directed to the O2 and CO2 analyzers for determination of FEo2 and FEco2. Expired gas then passes through a flow-sensing device (pneumotachometer) from which volume can be obtained by integration. The mixing chamber system can be used for exercise protocols as well as for resting metabolic measurements.
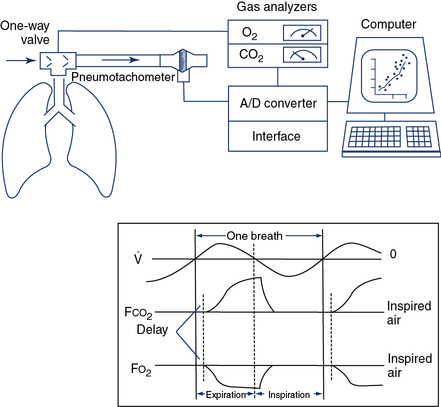
 o2,
o2,  co2, and ventilation.
The patient inspires and expires through a pneumotachometer or similar flow-sensing device, which may or may not require the use of a unidirectional valve. Gas is continuously sampled at the patient’s mouth to determine fractional concentrations of O2 and CO2. The flow signal and signals from the gas analyzers are integrated to measure volume, FEo2, and FEco2, and to calculate
 E,
E,  o2,
o2,  co2, rate, and VT. Simultaneous recording of flow (
 ) and fractional concentrations of O2 and CO2 are shown (insert). During expiration, Fco2 increases and Fo2 decreases. Gas concentrations and flow are out of phase because of the time required to transport gas from the mouthpiece to the analyzers and the response time of the analyzers themselves. Storing appropriate phase-delay corrections (determined during calibration) in the computer can align signals. For exercise tests or metabolic measurements, breath-by-breath data are averaged over a short interval (10–60 seconds) or specific number of breaths.
If a gas collection valve (see Chapter 11) is used in the breathing circuit, it should have a low resistance (1–2 cm H2O at 100 L/min) and a small dead space. In healthy adults, a valve dead space of 100 mL is acceptable. A valve with reduced dead space (25–50 mL) may be more appropriate for children or for patients who have dead space–producing disease or small tidal volumes. Some breath-by-breath systems can be programmed to reject small breaths (<100 mL). If this feature is used, the volume of rejected breaths should be matched to valve dead space. Breaths that do not clear valve dead space should be discarded. If valve dead space is too large for the patient, significant rebreathing may occur. In breath-by-breath exercise systems, this may show up as an expired CO2 level that does not decrease to zero during inspiration. Many modern exercise systems have small flow sensors that do not require a valve system, so dead space and valve resistance become less critical.
If a mixing chamber is used, the patient should be allowed to breathe through the circuit with a noseclip in place long enough to wash out room air with expired gas. The exact washout volume, or time, depends on the volume of the mixing chamber. Breath-by-breath systems (see Figure 7-8) normally require minimal washout because fractional gas concentrations are sampled directly at the mouthpiece. If supplemental O2 is breathed, the inspiratory portion of the breathing circuit as well as the patient’s lungs should be in equilibrium before gas sampling starts.
In gas collection or mixing chamber systems, raw data collected includes the following:
2. Temperature of gas at the measuring device (Celsius)
3. Time of collection, seconds or minutes
4. Respiratory rate during the collection interval
These data can be recorded manually or by a multichannel recorder with appropriate analog signals. In most modern systems, the data are gathered into a computer by means of an analog-to-digital (A/D) converter (see Chapter 11). Computerized data reduction offers the advantage of immediate feedback for all measurements. Automated data collection also offers greater flexibility for using different exercise protocols (see Table 7-1). Breath-by-breath gas analysis requires that signals from the flow sensor be integrated with the gas analyzer signals for Feo2 and Feco2. The phase delay between volume and gas concentration signals must be considered (see Figure 7-8). This is done by measuring phase delay time (for each gas analyzer) during calibration. The phase delay is then stored, and subsequent measurements use this factor to align the volume and gas signals. Sampling flow or sample lines should not be altered after calibration because phase delay values may change. Water or particulate contamination of the gas analyzer sample line or damage to the sample line can also affect phase delay. Alterations of the phase delay can have a profound effect on the accuracy of the data (up to 30% error in the calculated ![]() o2), especially at higher respiratory rates.
o2), especially at higher respiratory rates.
Minute Ventilation

Healthy adults at rest breathe 5–10 L/min. During exercise, this value may increase to more than 200 L/min in trained patients. It commonly exceeds 100 L/min in healthy adults (Figures 7-9 and 7-10). The increase in ventilation removes CO2, the primary product of exercising muscles, as workload increases. Ventilation increases linearly with an increasing workload (i.e., ![]() o2) at low and moderate levels of exercise. In healthy patients, this increase in ventilation during exercise follows the rise in
o2) at low and moderate levels of exercise. In healthy patients, this increase in ventilation during exercise follows the rise in ![]() co2. Relating the
co2. Relating the ![]() Emax to resting ventilatory function provides an index of ventilatory limitations to exercise. Maximal voluntary ventilation (MVV) (see Chapter 2) can be related to the
Emax to resting ventilatory function provides an index of ventilatory limitations to exercise. Maximal voluntary ventilation (MVV) (see Chapter 2) can be related to the ![]() E achieved at the highest workload attained (
E achieved at the highest workload attained (![]() Emax). Ventilatory capacity (sometimes called ventilatory ceiling) is defined by the measured MVV or the FEV1 (forced expiratory volume in 1 second) × 35 (some clinicians prefer FEV1 × 40). The difference between
Emax). Ventilatory capacity (sometimes called ventilatory ceiling) is defined by the measured MVV or the FEV1 (forced expiratory volume in 1 second) × 35 (some clinicians prefer FEV1 × 40). The difference between ![]() Emax and ventilatory capacity is often called the ventilatory (or breathing) reserve (Figure 7-11). Ventilatory reserve is calculated as follows:
Emax and ventilatory capacity is often called the ventilatory (or breathing) reserve (Figure 7-11). Ventilatory reserve is calculated as follows:
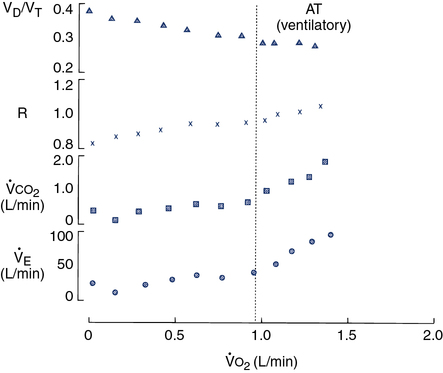
Four variables as they might appear in a healthy young adult are plotted against
 o2. The dotted vertical line represents ventilatory/anerobic threshold (AT).
  E increases linearly with work rate at low and moderate workloads up to the AT, as does
  co2. At higher levels,
  E and
E and  co2 increase at a faster rate as
  buffers lactic acid and as CO2 is produced. The ratio of
  co2 to
  o2 (RER) follows a similar pattern as RER approaches and then exceeds 1. VD/VT initially decreases rapidly as VT increases; it then continues to decrease but at a slower rate (see text).
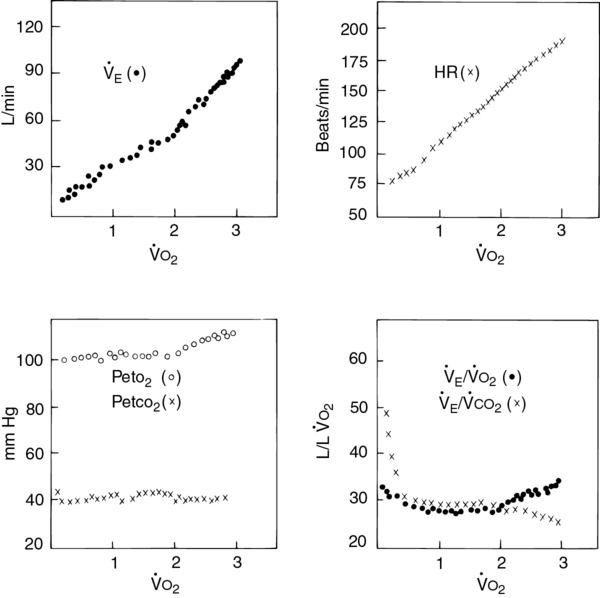
Four plots of data obtained using a breath-by-breath technique, as in Figure 7-8. Although data are recorded for each breath, the plots represent 30-second averages. All parameters are plotted against
 o2 as the measure of work being performed.
  E increases linearly up to approximately 2 L/min
  o2; HR increases linearly throughout the test. Peto2 and Petco2 (end-tidal partial pressures of O2 and CO2, respectively) remain relatively constant up to approximately 2 L/min
  o2. At this point, end-tidal O2 begins to increase and end-tidal CO2 begins to decrease. A similar pattern is seen on the plot of ventilatory equivalents for oxygen and carbon dioxide (
 E/
E/ o2 and
  E/
E/ co2, respectively). A primary advantage of breath-by-breath analysis is that plots may be viewed in “real time,” thus allowing modification of the testing protocol as required. Data in this example indicate the occurrence of ventilatory anerobic threshold at approximately 2 L/min of
  o2.
o2.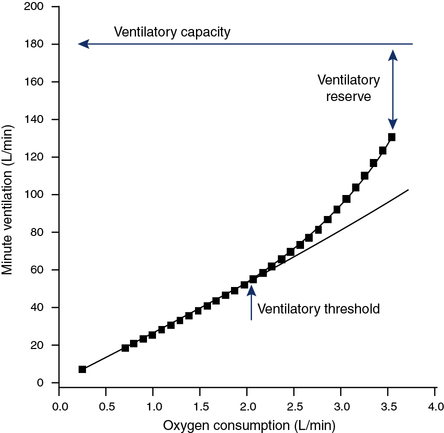
Ventilatory capacity is defined as the measured maximal voluntary ventilation (MVV) or MVV calculated from FEV1 × 35 or 40. The difference between the
 Emax (highest level of ventilation achieved during exercise) and the ventilatory capacity is termed the ventilatory reserve or breathing reserve.
![]() Emax = ventilation at highest exercise level reached, liters/minute
Emax = ventilation at highest exercise level reached, liters/minute
MVV= maximal voluntary ventilation, liters/minute
The ventilatory reserve is usually expressed as a percentage but can also be denoted as the actual difference. In healthy patients, the ventilatory reserve is typically 20%–40%. In patients with pulmonary disease, the reserve is less than 20% or the absolute difference between MVV and ![]() Emax is less than 10–15 L. The latter relationship is important in individuals with a disease process that affects their ability to perform an MVV (i.e., those who have a low or abnormal MVV). In some cases, the abnormally low MVV can yield a
Emax is less than 10–15 L. The latter relationship is important in individuals with a disease process that affects their ability to perform an MVV (i.e., those who have a low or abnormal MVV). In some cases, the abnormally low MVV can yield a ![]() Emax/MVV ratio that is in the normal range, but the actual difference is reduced (see Table 7-5). A valid MVV maneuver is essential to compare exercise ventilation with MVV. Patients who have airway obstruction may actually achieve
Emax/MVV ratio that is in the normal range, but the actual difference is reduced (see Table 7-5). A valid MVV maneuver is essential to compare exercise ventilation with MVV. Patients who have airway obstruction may actually achieve ![]() E during exercise that equals or exceeds their ventilatory capacity. In both scenarios, exercise is limited by their inability to further increase ventilation and they are therefore identified as being “ventilatory limited.”
E during exercise that equals or exceeds their ventilatory capacity. In both scenarios, exercise is limited by their inability to further increase ventilation and they are therefore identified as being “ventilatory limited.”
Tidal Volume and Respiratory Rate
In healthy individuals, the increase in VT is accomplished both by using the inspiratory reserve volume (IRV) and by reducing the end-expiratory lung volume (EELV) (Figure 7-12, left panel). This allows efficient use of the respiratory muscles and chest wall pump. In patients with chronic airflow limitation, the inability to increase ventilation may be related to dynamic compression of the airways and dynamic hyperinflation (i.e., increased lung volume) that can occur during exertion. These patients have large resting lung volumes (hyperinflation). During exercise, EELV tends to increase even more as the patient attempts to optimize expiratory flow to meet ventilatory demand. The dynamic shift in lung volume places the respiratory muscles at an even greater disadvantage. The sensation of dyspnea increases tremendously, and the patient is unable to continue exercise. The consequence for these patients is an increase in the work of breathing from both flow limitation and breathing at higher lung volumes (see Figure 7-12, right panel). Patients who have airway obstruction may also be able to increase their ![]() E but cannot attain predicted values
E but cannot attain predicted values
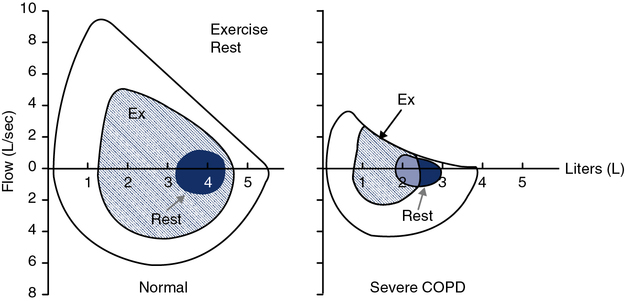
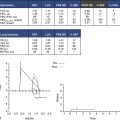
Normal F-V loop kinetics are shown with recruitment of exercise tidal breathing from both the IRV and the ERV, and not touching the resting maximal F-V curve (MFVC) (left). Breathing kinetics of a patient with severe chronic obstructive pulmonary disease (COPD) is also shown (right). The patient has to move up in absolute lung volumes to recruit tidal volume. This, along with the fact that they are flow limited throughout much of the tidal breath, increases the work of breathing. Tracking changes in inspiratory capacity (IC) can characterize the degree of exercise-induced hyperinflation.
(Interpretive Strategies 7-1). If VC is markedly reduced by the obstructive process, there may be little reserve to accommodate an increased VT. Obstructed patients who have a normal VC but increased resistance to flow may increase their VT at a low fb during exercise in an effort to minimize the work of breathing. This pattern continues until the VT reaches a plateau, as described previously. Then the fb must be augmented to further increase ![]() E. Because of flow limitation, particularly during the expiratory phase, increases in fb must be accomplished by shortening the inspiratory portion of each breath. Reduction of the inspiratory time in relation to the total breath time (TI /Ttot) requires the inspiratory muscles to generate increasingly greater flows. The increased load placed on the muscles of inspiration typically results in dyspnea.
E. Because of flow limitation, particularly during the expiratory phase, increases in fb must be accomplished by shortening the inspiratory portion of each breath. Reduction of the inspiratory time in relation to the total breath time (TI /Ttot) requires the inspiratory muscles to generate increasingly greater flows. The increased load placed on the muscles of inspiration typically results in dyspnea.
Flow-Volume Loop Analysis
Another method of determining the degree of ventilatory limitation is by monitoring F-V loop dynamics during exercise. Exercise tidal-volume loops may be plotted against the resting maximal F-V loop. This technique quantifies the amount of time the patient spends on the maximal flow-volume envelope and allows the clinician to identify the percent of flow limitation (Figure 7-13). This method may better define the increased work of breathing in individuals who do not reach a classic definition of ventilatory limitation but have a substantial component of flow limitation during exercise. Monitoring the tidal flow-volume loop during exercise can also show dynamic changes in the flow pattern. These changes can alert the clinician to intrathoracic, extrathoracic, or fixed-airway abnormalities that are demonstrated during exercise only. This technique may also be useful in monitoring breathing kinetics during exercise. As discussed previously, the normal method of increasing tidal volume during exercise is to use both inspiratory and expiratory reserve volumes. Patients with obstructive lung disease have to “move up” in their lung volumes (see Figure 7-12) to recruit tidal volume. In some cases, individuals with normal lung function can use an inappropriate breathing strategy by moving up in their lung volumes to recruit tidal volume without evidence of flow limitation. Using these inappropriate breathing strategies may cause a concomitant sensation of dyspnea. Some patients may breathe at low lung volumes, which approach residual volume. Breathing at these low lung volumes can cause flow limitation resulting from the position of tidal breathing along the absolute lung volume scale. This breathing strategy can elicit wheezing and SOB that can mimic asthma and has been coined a type of “pseudoasthma.” This phenomenon is often seen in morbidly obese subjects secondary to the weight on their thoracic cage that facilitates a reduction in their functional residual capacity (FRC).
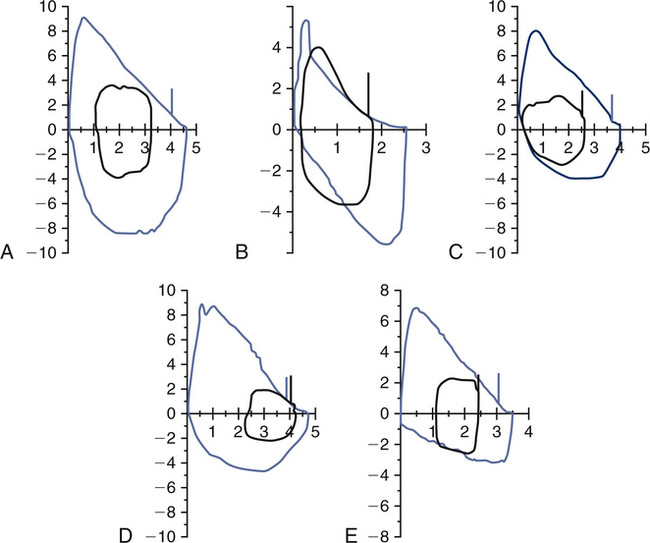
A, Normal exercise tidal loop displayed within the maximal FV loop. B, Flow limitation with tidal loop shifting toward TLC. C, Inappropriate breathing strategy with upward shift without flow limitation. D, Inappropriate breathing strategy with shift toward RV (reduced EELV). E, Reduced inspiratory flows consistent with variable extrathoracic obstruction (e.g., vocal cord dysfunction [VCD]) in both maximal flow volume and tidal volume loops.
Oxygen consumption, carbon dioxide production, and respiratory exchange ratio during exercise
Oxygen Consumption
Oxygen consumption (![]() o2) is the volume of O2 taken up by the exercising (or resting) patient in liters, or milliliters/minute, STPD. Oxygen consumption is also commonly reported in milliliters/kilogram (mL/kg) of body weight.
o2) is the volume of O2 taken up by the exercising (or resting) patient in liters, or milliliters/minute, STPD. Oxygen consumption is also commonly reported in milliliters/kilogram (mL/kg) of body weight. ![]() o2 is the product of ventilation minute and the rate of extraction from the gas breathed (i.e., the difference between the FIo2 and the FEo2; see the following paragraph). Healthy patients at rest have a
o2 is the product of ventilation minute and the rate of extraction from the gas breathed (i.e., the difference between the FIo2 and the FEo2; see the following paragraph). Healthy patients at rest have a ![]() o2 of approximately 0.25 L/min (STPD) or approximately 3.5 mL O2/min/kg (1 MET). During exercise,
o2 of approximately 0.25 L/min (STPD) or approximately 3.5 mL O2/min/kg (1 MET). During exercise, ![]() o2 may increase to over 5.0 L/min (STPD) in trained patients.
o2 may increase to over 5.0 L/min (STPD) in trained patients. ![]() o2 is the best single measure of external work being performed. Exercise limitation caused by ventilatory, gas exchange, or cardiovascular abnormalities may be quantified by relating exercise variables to
o2 is the best single measure of external work being performed. Exercise limitation caused by ventilatory, gas exchange, or cardiovascular abnormalities may be quantified by relating exercise variables to ![]() o2. Figures 7-5 and 7-9 provide examples of ventilatory and cardiovascular variables related to
o2. Figures 7-5 and 7-9 provide examples of ventilatory and cardiovascular variables related to ![]() o2 in healthy patients. The causes of work limitation may be defined by comparing these patterns in the exercising patient. Exercise limitation may be a result of pulmonary disease, cardiovascular disease, muscular abnormalities, deconditioning, poor effort, or a combination of these factors.
o2 in healthy patients. The causes of work limitation may be defined by comparing these patterns in the exercising patient. Exercise limitation may be a result of pulmonary disease, cardiovascular disease, muscular abnormalities, deconditioning, poor effort, or a combination of these factors.
To calculate ![]() o2 and
o2 and ![]() co2, the fractional concentrations of O2 and CO2 in expired gas must be analyzed (Criteria for Acceptability 7-3). Exhaled gas is sampled from a mixing chamber (see Figure 7-7) or a breath-by-breath system (see Figure 7-8). In systems that accumulate gas (e.g., mixing chamber), a pump is used to draw the sample through the O2 and CO2 analyzers. Water vapor is removed from the mixed expired sample by passing the gas through a drying tube (usually containing calcium chloride). In breath-by-breath systems, fractional gas concentrations are sampled at the mouth using rapid gas analyzers. Most systems use sample tubing that is permeable to water vapor, so that the effects of humidity can be accommodated (see Chapter 11). Gas concentration signals from the analyzers are integrated with the expiratory flow signal to measure the volumes of O2 and CO2 exchanged for each breath (see Figure 7-8).
co2, the fractional concentrations of O2 and CO2 in expired gas must be analyzed (Criteria for Acceptability 7-3). Exhaled gas is sampled from a mixing chamber (see Figure 7-7) or a breath-by-breath system (see Figure 7-8). In systems that accumulate gas (e.g., mixing chamber), a pump is used to draw the sample through the O2 and CO2 analyzers. Water vapor is removed from the mixed expired sample by passing the gas through a drying tube (usually containing calcium chloride). In breath-by-breath systems, fractional gas concentrations are sampled at the mouth using rapid gas analyzers. Most systems use sample tubing that is permeable to water vapor, so that the effects of humidity can be accommodated (see Chapter 11). Gas concentration signals from the analyzers are integrated with the expiratory flow signal to measure the volumes of O2 and CO2 exchanged for each breath (see Figure 7-8).
![]() o2 is calculated from an accumulated gas volume using the following equation:
o2 is calculated from an accumulated gas volume using the following equation:

FEo2= fraction of O2 in the expired sample
FEco2 = fraction of CO2 in the expired sample
FIo2= fraction of O2 in inspired gas (room air = 0.2093)


O2 consumption at the highest level of work attainable by normal patients is termed the ![]() o2max.
o2max. ![]() o2max is characterized by a plateau of the oxygen uptake despite increasing external workloads.
o2max is characterized by a plateau of the oxygen uptake despite increasing external workloads. ![]() o2max is useful for comparing exercise capacity between patients.
o2max is useful for comparing exercise capacity between patients. ![]() o2max may also be used to compare a patient with his or her age-related predicted value of
o2max may also be used to compare a patient with his or her age-related predicted value of ![]() o2max. Equations for deriving predicted
o2max. Equations for deriving predicted ![]() o2max are included on Evolve (http://evolve.elsevier .com/Mottram/Ruppel/).
o2max are included on Evolve (http://evolve.elsevier .com/Mottram/Ruppel/).
One measure of impairment is the percentage of expected ![]() o2max attained by the exercising patient. Height, sex, age, and fitness level all affect the “normal” maximal oxygen consumption. Because of these factors, most reference equations show a large variability (±20%). Patients who have a 20%–40% reduction in their
o2max attained by the exercising patient. Height, sex, age, and fitness level all affect the “normal” maximal oxygen consumption. Because of these factors, most reference equations show a large variability (±20%). Patients who have a 20%–40% reduction in their ![]() o2max have mild to moderate impairment. Those who have
o2max have mild to moderate impairment. Those who have ![]() o2max values less than 50% of their predicted values have severe exercise impairment. Some studies have attempted to estimate
o2max values less than 50% of their predicted values have severe exercise impairment. Some studies have attempted to estimate ![]() o2 based on the height and weight of the patient and the speed and slope of a treadmill. O2 consumption estimated from treadmill walking is sufficiently variable so that its use is limited. Power output from a calibrated cycle ergometer may be used to estimate
o2 based on the height and weight of the patient and the speed and slope of a treadmill. O2 consumption estimated from treadmill walking is sufficiently variable so that its use is limited. Power output from a calibrated cycle ergometer may be used to estimate ![]() o2 more accurately than from treadmill exercise. Workload estimated from cycle ergometry is not influenced by weight or stride. Actual
o2 more accurately than from treadmill exercise. Workload estimated from cycle ergometry is not influenced by weight or stride. Actual ![]() o2 may differ significantly from the estimated value, even with an ergometer. Cycle ergometry usually produces slightly lower maximal
o2 may differ significantly from the estimated value, even with an ergometer. Cycle ergometry usually produces slightly lower maximal ![]() o2 values than treadmill walking in healthy patients (see the section on exercise protocols).
o2 values than treadmill walking in healthy patients (see the section on exercise protocols).
Respiratory Exchange Ratio
The respiratory exchange ratio (RER) is defined as the ratio of ![]() co2 to
co2 to ![]() o2 at the mouth. RER is calculated by dividing
o2 at the mouth. RER is calculated by dividing ![]() co2 by
co2 by ![]() o2; it is expressed as a fraction. In some circumstances, RER at rest is assumed to be equal to 0.8. For exercise evaluation or metabolic studies, however, the actual value is calculated. RER normally varies between 0.70 and 1.00 in resting patients, depending on the nutritional substrate being metabolized (see Chapter 10). RER reflects the respiratory quotient (RQ) at the cellular level only when the patient is in a true steady state. RER may differ significantly from RQ, depending on the patient’s ventilation.
o2; it is expressed as a fraction. In some circumstances, RER at rest is assumed to be equal to 0.8. For exercise evaluation or metabolic studies, however, the actual value is calculated. RER normally varies between 0.70 and 1.00 in resting patients, depending on the nutritional substrate being metabolized (see Chapter 10). RER reflects the respiratory quotient (RQ) at the cellular level only when the patient is in a true steady state. RER may differ significantly from RQ, depending on the patient’s ventilation.
RER typically increases from a resting level of between 0.75 and 0.85 as work increases. When anaerobic metabolism (see next paragraph) begins to produce CO2 from the buffering of lactate, ![]() co2 approaches
co2 approaches ![]() o2. As exercise continues,
o2. As exercise continues, ![]() co2 exceeds
co2 exceeds ![]() o2 and the RER becomes greater than 1. RER is commonly elevated at rest because many patients hyperventilate during exhaled gas analysis before exercise begins (see Criteria for Acceptability 7-3). In steady-state exercise tests (i.e., 4–6 minutes at a constant workload), RER may equal RQ, and it then reflects the ratio of
o2 and the RER becomes greater than 1. RER is commonly elevated at rest because many patients hyperventilate during exhaled gas analysis before exercise begins (see Criteria for Acceptability 7-3). In steady-state exercise tests (i.e., 4–6 minutes at a constant workload), RER may equal RQ, and it then reflects the ratio of ![]() co2/
co2/![]() o2 at the cellular level. Under steady-state conditions,
o2 at the cellular level. Under steady-state conditions, ![]() co2 reflects the CO2 produced metabolically at the cellular level.
co2 reflects the CO2 produced metabolically at the cellular level.
Anaerobic or Ventilatory Threshold
At low and moderate workloads, ![]() E increases linearly with increases in
E increases linearly with increases in ![]() co2. When the body’s energy demands exceed the capacity of aerobic pathways, further increases in energy are produced anaerobically. The primary product of anaerobic metabolism is lactate. The increased lactic acid (from lactate) is buffered by HCO3−, resulting in an increase in CO2 in the blood.
co2. When the body’s energy demands exceed the capacity of aerobic pathways, further increases in energy are produced anaerobically. The primary product of anaerobic metabolism is lactate. The increased lactic acid (from lactate) is buffered by HCO3−, resulting in an increase in CO2 in the blood. ![]() co2 measured from exhaled gas increases because CO2 is being produced by both the exercising muscles and the buffering of lactate. To maintain the pH near normal,
co2 measured from exhaled gas increases because CO2 is being produced by both the exercising muscles and the buffering of lactate. To maintain the pH near normal, ![]() E increases to match the increased
E increases to match the increased ![]() co2. This pattern of increasing ventilation and CO2 production can be detected when these parameters are plotted against
co2. This pattern of increasing ventilation and CO2 production can be detected when these parameters are plotted against ![]() o2 (see Figure 7-9). Determination of the ventilatory-anaerobic threshold may be accomplished by visual inspection of an appropriate plot. Statistical analysis can also be used to determine the inflection point as displayed by the graph in Figure 7-14. Several different algorithms may be used to identify the AT. One of the most common techniques uses regression analysis to determine the “breakpoint” at which
o2 (see Figure 7-9). Determination of the ventilatory-anaerobic threshold may be accomplished by visual inspection of an appropriate plot. Statistical analysis can also be used to determine the inflection point as displayed by the graph in Figure 7-14. Several different algorithms may be used to identify the AT. One of the most common techniques uses regression analysis to determine the “breakpoint” at which ![]() o2 and
o2 and ![]() co2 change abruptly (V-slope method).
co2 change abruptly (V-slope method).
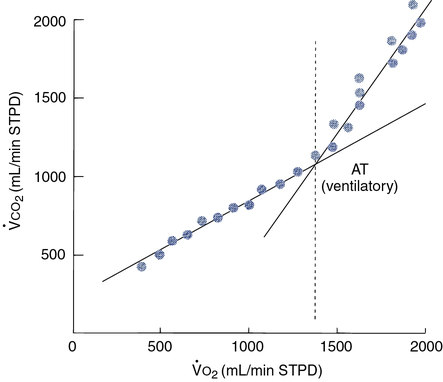
By plotting
 co2 against
  o2, an infection point can typically be identified, indicating an abrupt increase in CO2 production. A more precise method fits two regression lines to the data gathered. One line is a best-fit line through the low and moderate workload portion of the data; the second is fit through the high workload points. These lines are recalculated repeatedly until the best statistical “fit” is obtained. The point at which the two lines intersect represents the onset of lactate production (anaerobic threshold).
Noninvasive AT determination may be useful in assessing cardiovascular or pulmonary diseases (Interpretive Strategies 7-3). In healthy patients, AT occurs at 60%–70% of the ![]() o2max. Patients who have cardiac disease often reach their AT at a lower workload (
o2max. Patients who have cardiac disease often reach their AT at a lower workload (![]() o2). Early onset of anaerobic metabolism occurs when the demands of exercising muscles exceed the capacity of the heart to supply O2. Occurrence of the anaerobic threshold at less than 40% of the
o2). Early onset of anaerobic metabolism occurs when the demands of exercising muscles exceed the capacity of the heart to supply O2. Occurrence of the anaerobic threshold at less than 40% of the ![]() o2max is considered abnormally low. Patients who have a ventilatory limitation to exercise (i.e., pulmonary disease) may be unable to exercise at a high enough workload to reach their anaerobic threshold. In these patients, O2 delivery is limited by the lungs, rather than by cardiac output or extraction by the exercising muscle.
o2max is considered abnormally low. Patients who have a ventilatory limitation to exercise (i.e., pulmonary disease) may be unable to exercise at a high enough workload to reach their anaerobic threshold. In these patients, O2 delivery is limited by the lungs, rather than by cardiac output or extraction by the exercising muscle.
The AT may also be determined by inspecting graphs of the ventilatory equivalents for O2 and CO2 (see the next section) plotted against workload (![]() o2). When
o2). When ![]() E/
E/![]() co2 increases without an increase in
co2 increases without an increase in ![]() E/
E/![]() co2, the AT has been reached. A similar pattern can be seen when the end-tidal O2 and CO2 gas tensions are plotted (see Figure 7-10). Sample calculations of
co2, the AT has been reached. A similar pattern can be seen when the end-tidal O2 and CO2 gas tensions are plotted (see Figure 7-10). Sample calculations of ![]() E,
E, ![]() o2,
o2, ![]() co2, and RER, as used with one of the gas collection methods, are included on Evolve (http://evolve.elsevier.com/Mottram/Ruppel/).
co2, and RER, as used with one of the gas collection methods, are included on Evolve (http://evolve.elsevier.com/Mottram/Ruppel/).
Ventilatory Equivalent for Oxygen
During resting data collection in healthy patients, the ratio is in the range of 30 to 40 L depending on the degree of ventilation, including anticipatory hyperventilation. As the patient begins to exercise, this ratio decreases to about 25 ± 4 (see Figure 7-15). This initial kinetic change is assumed to be related to an improvement in ![]() /
/![]() matching with increased cardiac output during exercise. At low and moderate workloads, ventilation increases linearly with increasing
matching with increased cardiac output during exercise. At low and moderate workloads, ventilation increases linearly with increasing ![]() o2 and
o2 and ![]() co2. The absolute level of ventilation depends on the response to CO2, the adequacy of
co2. The absolute level of ventilation depends on the response to CO2, the adequacy of ![]() A, and the VD/VT ratio. At workloads above 60%–75% of the
A, and the VD/VT ratio. At workloads above 60%–75% of the ![]() o2max,
o2max, ![]() E is more closely related to
E is more closely related to ![]() co2. As ventilation increases to match the
co2. As ventilation increases to match the ![]() co2 above the AT, the ventilatory equivalent for O2 also increases.
co2 above the AT, the ventilatory equivalent for O2 also increases.
Ventilatory Equivalent for Carbon Dioxide
The ventilatory equivalent for CO2 (![]() E/
E/![]() co2) is calculated in a manner similar to that used for the
co2) is calculated in a manner similar to that used for the ![]() E/
E/![]() o2. Minute ventilation (BTPS) is divided by CO2 production (STPD). The
o2. Minute ventilation (BTPS) is divided by CO2 production (STPD). The ![]() E/
E/![]() co2 mimics the initial
co2 mimics the initial ![]() E/
E/![]() o2 kinetic change, decreasing to a normal range of 25–35 L
o2 kinetic change, decreasing to a normal range of 25–35 L ![]() co2.
co2. ![]() E tends to match
E tends to match ![]() co2 from low up to high workloads. Thus, the
co2 from low up to high workloads. Thus, the ![]() E/
E/![]() co2 remains constant in healthy patients until the highest workloads are reached. The
co2 remains constant in healthy patients until the highest workloads are reached. The ![]() E/
E/![]() co2 may be useful for estimating the maximum tolerable workload in patients who have moderate or severe ventilatory limitations. The ventilatory equivalents for O2 and CO2, measured with a breath-by-breath technique, may be useful in identifying the onset of the AT. Anaerobic metabolism is usually accompanied by a steady increase in the
co2 may be useful for estimating the maximum tolerable workload in patients who have moderate or severe ventilatory limitations. The ventilatory equivalents for O2 and CO2, measured with a breath-by-breath technique, may be useful in identifying the onset of the AT. Anaerobic metabolism is usually accompanied by a steady increase in the ![]() E/
E/![]() o2 while the
o2 while the ![]() E/
E/![]() co2 remains constant, or decreases slightly. The period in which
co2 remains constant, or decreases slightly. The period in which ![]() E/
E/![]() o2 is increasing yet
o2 is increasing yet ![]() E/
E/![]() co2 is constant is called the isocapnic buffering zone (Figure 7-15). This zone indicates the onset of metabolic acidosis, where
co2 is constant is called the isocapnic buffering zone (Figure 7-15). This zone indicates the onset of metabolic acidosis, where ![]() E is no longer proportional to
E is no longer proportional to ![]() o2 but is appropriate for
o2 but is appropriate for ![]() co2. Occurrence of this pattern coincides with the buffering of the lactate (AT). Eventually, the buffering system cannot keep pace with the metabolic acidemia, and the
co2. Occurrence of this pattern coincides with the buffering of the lactate (AT). Eventually, the buffering system cannot keep pace with the metabolic acidemia, and the ![]() E/
E/![]() co2 increases as attempts to maintain pH. This same pattern may also be seen on a breath-by-breath display of Peto2 and Petco2 (see Figure 7-10). A markedly elevated
co2 increases as attempts to maintain pH. This same pattern may also be seen on a breath-by-breath display of Peto2 and Petco2 (see Figure 7-10). A markedly elevated ![]() E/
E/![]() co2 (>50) may also be observed in pulmonary hypertensive disease.
co2 (>50) may also be observed in pulmonary hypertensive disease.
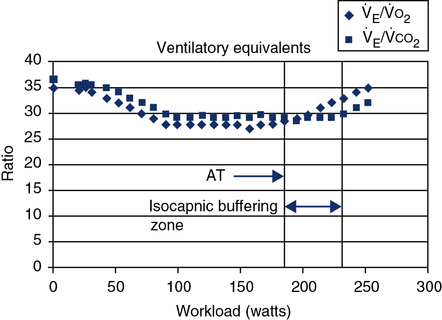
The ventilatory threshold is defined as the point where the
 E/
E/ o2 begins to increase while the
  E/
E/ co2 remains constant or begins to decrease. The period from the onset of AT until
  E/
E/ co2 increases is the isocapnic buffering zone. Minute ventilation is appropriate for
  co2, which now exceeds
  o2 because of acid buffering created by anaerobic metabolism (H++ HCO3− ↔ H2CO3– ↔H2O+CO2).
Oxygen Pulse


In patients with cardiac disease, the O2 pulse may be normal or even low at rest but does not increase to expected levels during exercise. This pattern is consistent with an inappropriately high HR for a particular level of work. Cardiac output normally increases linearly with increasing exercise (see Figure 7-5). A low O2 pulse is consistent with an inability to increase the SV because of the relationship noted in the preceding paragraphs. O2 pulse may even decrease in patients with poor left ventricular function. The pattern of low O2 pulse with increasing work rate may be seen in patients with coronary artery disease or valvular insufficiency, but it is most pronounced in cardiomyopathy. Tachycardia or tachyarrhythmias tend to lower the O2 pulse because of the abnormally elevated heart rate. Conversely, beta-blocking agents, which tend to reduce HR, may elevate the O2 pulse.
Exercise blood gases
Arterial Catheterization
Although invasive, blood gas sampling during exercise testing is often indicated in patients with primary pulmonary disorders. An indwelling arterial catheter permits the analysis of blood gas tensions (Pao2, Paco2), arterial saturation (SaO2), O2 content (CaO2), pH, and lactate levels at various workloads. Box 7-4 lists some of the indications for arterial catheterization for exercise testing.
Arterial catheterization, at either the radial or the brachial site, has been demonstrated to be relatively safe. The modified Allen’s test is performed to ascertain adequate collateral circulation (see Chapter 6). The site is cleaned with a skin preparation antiseptic, typically applied with a sterile applicator. Local anesthetic (1%–2% lidocaine [Xylocaine]) is injected subcutaneously. An appropriately sized catheter is inserted percutaneously. The catheter needs to be secured to prevent being dislodged during the exercise study. The catheter is then connected to a high-pressure flush system to maintain patency. Care must be taken when drawing blood samples from the catheter not to contaminate the specimen with flush solution (Criteria for Acceptability 7-4). If flush solution mixes with the specimen, dilution occurs and can affect pH, Pco2, Po2, and hemoglobin (Hb) values.
The catheter may also be connected to a suitable pressure transducer (see Figure 7-6) for continuous monitoring of systemic BP. The BP transducer should be balanced (“zeroed”) at the level of the left ventricle during exercise. See Chapter 12 for precautions concerning the insertion of arterial catheters.
Arterial Puncture
An alternate technique is to obtain a specimen by a simple arterial puncture at peak exercise. Use of a cycle ergometer for testing allows better stabilization of the radial or brachial artery sites. The site should be identified and the modified Allen’s test performed before beginning exercise. The sample should be obtained within 15 seconds of peak exercise. Blood gas tensions, particularly Pao2, may change rapidly as blood recirculates. A serious disadvantage of the single puncture is that if the specimen cannot be obtained within 15 seconds, the procedure must be repeated. If any of the conditions listed in Box 7-4 are present, arterial catheterization should be considered.
Pulse Oximetry
Oxygen saturation during exercise may be monitored with a pulse oximeter (SpO2) using the ear, finger, or forehead sites (see Chapter 11). Wherever the pulse oximeter is attached, the probe should be adequately secured. Motion artifact is a common problem, particularly with treadmill exercise.
Pulse oximetry may overestimate the true saturation if a significant concentration of carboxyhemoglobin (COHb) is present (Criteria for Acceptability 7-4). A low total Hb level (i.e., anemia) sometimes contributes to exercise limitation. This condition may not be detected by pulse oximetry alone. Inadequate perfusion at the site of the probe (e.g., ear or finger) may also cause erroneous readings (false positive) during exercise testing. Motion artifact, light scattering within the tissue at the probe site, and dark skin pigmentation may all cause discrepancies between Spo2 and actual Sao2 (see Chapter 6). A single arterial sample, preferably at peak exercise, may be used to correlate the Spo2 reading with true saturation if the specimen is analyzed with a multiwavelength blood oximeter (see Chapter 11). If adequate correlation between Sao2 and Spo2 during exercise is established, further blood sampling may be unnecessary.
Arterial Oxygen Tension During Exercise
In healthy patients, Pao2 remains relatively constant even at high workloads (Interpretive Strategies 7-4). Alveolar Po2 increases at maximal exercise from the increased ventilation accompanying the increase in ![]() co2. The alveolar-arterial (A-a) gradient (normally approximately 10 mm Hg) widens as a result of the increase in alveolar oxygen tension. The A-a gradient also increases somewhat because of a lower mixed venous O2 content during exercise. The A-a gradient may increase to 20–30 mm Hg in healthy patients during heavy exercise because of these mechanisms.
co2. The alveolar-arterial (A-a) gradient (normally approximately 10 mm Hg) widens as a result of the increase in alveolar oxygen tension. The A-a gradient also increases somewhat because of a lower mixed venous O2 content during exercise. The A-a gradient may increase to 20–30 mm Hg in healthy patients during heavy exercise because of these mechanisms.
Arterial Carbon Dioxide Tension During Exercise
In healthy patients, Paco2 remains relatively constant at low and moderate work rates (Interpretive Strategy 7-10). ![]() A increases to match the increase in
A increases to match the increase in ![]() co2. End-tidal CO2 increases at submaximal workloads, indicating that less ventilation is “wasted” (VD/VT decreases). At workloads in excess of 50%–60% of the
co2. End-tidal CO2 increases at submaximal workloads, indicating that less ventilation is “wasted” (VD/VT decreases). At workloads in excess of 50%–60% of the ![]() o2max, metabolic acidosis from anaerobic metabolism stimulates an increase in
o2max, metabolic acidosis from anaerobic metabolism stimulates an increase in ![]() E. This occurs in response to the augmented
E. This occurs in response to the augmented ![]() co2 from the buffering of lactic acid as noted previously. Ventilation thus increases in excess of that required to keep Paco2 constant. A progressive decrease in Paco2 results, causing respiratory compensation for the acidosis associated with anaerobic metabolism (see Figures 7-9 and 7-10). Petco2 decreases along with Paco2 at high work rates.
co2 from the buffering of lactic acid as noted previously. Ventilation thus increases in excess of that required to keep Paco2 constant. A progressive decrease in Paco2 results, causing respiratory compensation for the acidosis associated with anaerobic metabolism (see Figures 7-9 and 7-10). Petco2 decreases along with Paco2 at high work rates.
Exercise Variables Calculated from Blood Gases
Arterial blood gases drawn during exercise allow several other parameters of gas exchange to be determined (Interpretive Strategies 7-4). These include physiologic dead space, alveolar ventilation, and the VD/VT ratio.

VT= tidal volume, liters (BTPS)
FEco2= fraction of expired CO2
PB – 47= dry barometric pressure
VDsys= dead space of one-way breathing valve, liters
When VD has been determined, ![]() A can be calculated with the following equation:
A can be calculated with the following equation:

fb= respiratory rate (breaths/minute)
VD= respiratory dead space (BTPS)

 = partial pressure of CO2 in expired gas
VD, which is composed of anatomic and alveolar dead space, is the part of ![]() E that does not participate in gas exchange. VD/VT expresses the relationship between “wasted” and tidal ventilation for the average breath. The healthy adult at rest has a
E that does not participate in gas exchange. VD/VT expresses the relationship between “wasted” and tidal ventilation for the average breath. The healthy adult at rest has a ![]() A of 4–7 L/min (BTPS) and a VD/VT ratio of approximately 0.20–0.35. The absolute volume of dead space increases during exercise in conjunction with increased
A of 4–7 L/min (BTPS) and a VD/VT ratio of approximately 0.20–0.35. The absolute volume of dead space increases during exercise in conjunction with increased ![]() E. Because of increases in VT and increased perfusion of well-ventilated lung units (e.g., at the apices), the VD/VT ratio decreases. This pattern is expected in healthy patients (see Figure 7-9). VD/VT increases with age, but the kinetic change with exercise remains the same. VD/VT may decrease in mild or moderate pulmonary disease states as well. In severe airway obstruction or in pulmonary vascular disease, VD/VT remains fixed or may even increase. An increase in VD/VT with exertion indicates ventilation increasing in excess of perfusion. This pattern is often associated with pulmonary hypertension. The vascular “space” is fixed in pulmonary hypertension; additional lung units cannot be recruited to handle the increased CO during exercise. VD/VT may also be elevated in individuals who use inappropriate breathing strategies. Small tidal volumes and high respiratory rates to recruit
E. Because of increases in VT and increased perfusion of well-ventilated lung units (e.g., at the apices), the VD/VT ratio decreases. This pattern is expected in healthy patients (see Figure 7-9). VD/VT increases with age, but the kinetic change with exercise remains the same. VD/VT may decrease in mild or moderate pulmonary disease states as well. In severe airway obstruction or in pulmonary vascular disease, VD/VT remains fixed or may even increase. An increase in VD/VT with exertion indicates ventilation increasing in excess of perfusion. This pattern is often associated with pulmonary hypertension. The vascular “space” is fixed in pulmonary hypertension; additional lung units cannot be recruited to handle the increased CO during exercise. VD/VT may also be elevated in individuals who use inappropriate breathing strategies. Small tidal volumes and high respiratory rates to recruit ![]() E in an otherwise healthy patient can yield falsely high ratios. Coaching a patient to increase tidal volume and use a more normal breathing pattern can alleviate a falsely elevated VD/VT ratio.
E in an otherwise healthy patient can yield falsely high ratios. Coaching a patient to increase tidal volume and use a more normal breathing pattern can alleviate a falsely elevated VD/VT ratio.
Cardiac output during exercise
There are several methods for calculating CO during exercise. Noninvasive methods include CO2 rebreathing, soluble gas, and Doppler (ultrasound) techniques. Invasive methods measure CO by the direct Fick method or by thermal dilution. The invasive methods require placement of a pulmonary artery catheter (Swan-Ganz) (Criteria for Acceptability 7-5).
Direct Fick Method

![]() o2= oxygen consumption, L/min (STPD)
o2= oxygen consumption, L/min (STPD)
C(a-v–)o2= arterial-mixed venous O2 content difference, mL/dL
![]() o2 is measured using one of the methods described previously. C(a-
o2 is measured using one of the methods described previously. C(a- )o2 is obtained by measuring or calculating oxygen content in both arterial and mixed venous blood (see Chapter 6). Arterial and mixed venous blood specimens should be drawn simultaneously during the last 15–30 seconds of each exercise level. Oxygen consumption averaged over the same interval should be used for the calculation.
Symptoms Scales
The measurement of RPE (or Borg scale) and other symptom scales can be essential for connecting subjective symptoms and the physiologic responses to exercise. Rating scales, when they are discordant, can assist the physician in counseling the patient. There are two versions of the RPE scale, often referred to as the Borg and modified-Borg scales (Table 7-7). These scales are usually printed on a card or poster that the patient can see or “point to” during exercise testing. The scales should be reviewed with the patient before exercise begins. This is particularly important if exhaled gas is being collected because the patient may have a mouthpiece or facial mask in place. The patient should be able to indicate his or her level of exertion even without vocalizing. General symptom (visual analog) scales can be adapted to any chief complaint the patient may be expressing by simply using a scale of 0–4 and grading intensity from “nothing at all” to “severe.” A patient complaining of lightheadedness or chest tightness can then alert the testing staff to his or her level of discomfort during the test using hand signals.
Table 7-7
Ratings of Perceived Exertion (Borg) Scales
| Perceived Exertion Scale | Modified Perceived Exertion Scale | ||
| 6 | 0 | Nothing at all | |
| 7 | Very, very light | 0.5 | Very, very slight (just noticeable) |
| 8 | 1 | Very slight | |
| 9 | Very light | 2 | Slight |
| 10 | 3 | Moderate | |
| 11 | Fairly light | 4 | Somewhat moderate |
| 12 | 5 | Severe | |
| 13 | Somewhat hard | 6 | |
| 14 | 7 | Very severe | |
| 15 | Hard | 8 | |
| 16 | 9 | Very, very severe (almost maximal) | |
| 17 | Very hard | 10 | Maximal |
| 18 | |||
| 19 | Very, very hard | ||
| 20 | |||
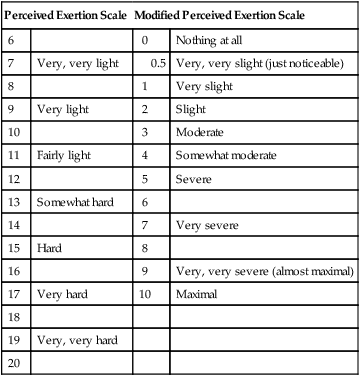
Table 7-8
| *** | Heart rate: | > 85%–90% of predicted |
| *** | End exercise: | 50%–80% MVV − |
| ** | SaO2 | < 80% |
| * | Metabolic work: | RER >1.10 or lactate > 7 mmol/L |
| * | Clinical investigator: | Opinion of effort or early termination criteria met |
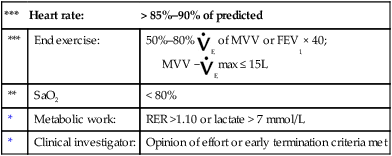
Once a single criterion is met, test is graded a maximal effort.
Quality of Test
General quality assurance and quality control of instrumentation is discussed in Chapter 11. However, the complexity of cardiopulmonary exercise testing warrants additional considerations, including a quality system approach to testing. The Clinical and Laboratory Standards Institute (CLSI): A Quality System Model for Laboratories, discussed in Chapter 12, incorporates the concept of the path of workflow process. This concept integrates pre-test, test, post-test, assessments of processes that can affect any section across the path of workflow. Pre-test processes include patient assessment, test request, patient preparation, and equipment preparation. Patient assessment, as it relates to cardiopulmonary exercise testing, might include a review of laboratory results, current medications affecting exercise performance (e.g., β-blockers, digitalis), or orthopedic issues that may affect ergometer selection. Test processes include, but are not limited to, making sure the subject understands the purpose of the test and the expected effort, testing staff are competent in identifying normal and abnormal responses to exercise, and appropriate response to patient conditions to maintain patient safety. In the post-test period, post-test assessments (i.e., post-FVCs, BP), selecting data for analysis, and the reporting process all need to be considered.
Additional quality processes specific to exercise testing systems include monitoring phase delay data, ergometer calibration, and biologic QC data. The importance of phase delay was previously discussed in the chapter. Cycle ergometer calibration can be specific to the device; however, many of the new electronic ergometers cannot be calibrated without expensive adjunct hardware. Treadmill outputs can be easily validated. Speed can be assessed by knowing the belt length and timing belt revolutions with a stopwatch. Grade can be verified by dividing the length of the treadmill by the height (Figure 7-16). The entire system can be monitored by performing biologic QC (BioQC). Several methods have been suggested; however, all include collecting steady-state data at rest and a predetermined submaximal workload(s). Determining an appropriate workload can be achieved by having the BioQC subject perform a maximal test, identify the anaerobic threshold, and select a workload below the AT. Another suggested method has the subject perform steady-state exercise (3-5 minutes at each stage) at two workloads 50 watts apart (example 25 and 75 watts). The expected oxygen consumption difference between the two workloads should be 500 mL because the normal ![]() o2 to watt relationship is 10 mL/watt. Regardless of the method used, the data can be entered into a spreadsheet with the mean and two standard deviations calculated. The data can be monitored over time to identify “out of control” situations, which may not be recognized with a standard individual module (i.e., pneumotach and gas analyzer) calibration.
o2 to watt relationship is 10 mL/watt. Regardless of the method used, the data can be entered into a spreadsheet with the mean and two standard deviations calculated. The data can be monitored over time to identify “out of control” situations, which may not be recognized with a standard individual module (i.e., pneumotach and gas analyzer) calibration.
Interpretation Strategies
To interpret a study appropriately, the practitioner first needs to assess the degree of effort and determine whether the test is a maximal study (see Table 7-4). Once the test has been qualified as maximal or submaximal, an algorithmic approach to data review and interpretation is essential (see Interpretive Strategies 7-2, 7-3, 7-4, and 7-5).
The following scheme can assist in a stepwise approach to data analysis:
• Determine maximal study (Table 7-8)
• If reduced, why? Review the following responses:
• Cardiovascular response (see Interpretive Strategies 7-2 and Criteria for Acceptability 7-5)
• ECG, BP, CO, O2, pulse, and symptoms
• Ventilatory response (see Interpretive Strategy 7-2)
• Ventilatory reserve, breathing kinetics
• Gas exchange (see Interpretive Strategy 7-4)
• Metabolic (see Interpretive Strategy 7-3)
Summary
• The chapter examines the measurement of cardiopulmonary variables during exercise.
• Various protocols for assessing exercise responses are described, including treadmill and cycle ergometry methods and the six-minute walk.
• Monitoring of the cardiovascular system with a special concern for patient safety is discussed.
• Techniques for measuring ventilation, oxygen consumption, carbon dioxide production, and the associated variables during exercise are delineated.
• The measurement of breathing kinetics and flow volume analysis during exercise is described.
• Special emphasis is given to criteria for acceptability and interpretive strategies for thevarious measurements described.
• Assessment of blood gases and cardiac output is also discussed.


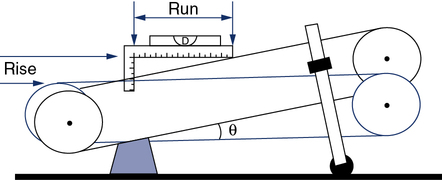
 5 to 10 L/min)? If not, why?