Chapter 3 Cardiac output
FACTORS THAT DETERMINE CARDIAC OUTPUT
If you consider the sequence of events reviewed in Chapter 2 you will see that the volume of blood that can be pumped by the heart will be determined by a number of factors including the frequency of pumping, the efficiency of ventricular filling and the efficiency of ventricular emptying.
Heart rate
The usual resting heart rate of 65–75 beats/min reflects a substantial degree of bradycardic vagal tone, so heart rate can be increased moderately either by reducing that vagal influence or by increasing sympathetic tachycardic drive, or both. Any increase above the intrinsic pacemaker frequency of 100 beats/min, however, relies entirely on sympathetic activation. The sympathetic nerves act through activation of β-adrenoceptors and drugs that antagonize this action (the so-called β-blockers) are frequently used in patients for whom exercise is prescribed as a rehabilitative aid after heart attacks. The reduced capacity to produce normal tachycardia is an important factor in determining the absolute intensities of exercise that these individuals are able to undertake and must also be borne in mind if absolute heart rate is being used to quantify their exercise workload (see Chapter 11, p. 131).
The standard equation to calculate maximum heart rate (HRmax) for an adult of a known age is:

but it is important to bear in mind that this can be applied only to adult subjects. In children, maximum heart rate appears to vary little or not at all with age and remains around a little more than 200 beats/min until approximately 18 years (see Chapter 9, p. 113). In addition, the generalization of HRmax falling by 1 beat/min per year has been derived from population studies, and absolute maxima vary by up to 10 beats/min between people of any given age. For this reason, if heart rate is to be used for quantifying workload during exercise then it is preferable to determine each individual’s HRmax directly.

appears to be more accurate than the standard one (Miller et al 1993).
Ventricular filling time
Simple calculation would indicate that a threefold elevation of heart rate should increase cardiac output by the same amount, but it is clear from looking at the pressure–flow relationships during the cardiac cycle (Fig. 3.1) that the situation is not as straightforward as this. As heart rate increases, the interval between successive ventricular contractions decreases so that the absolute time available for refilling falls. With moderate tachycardia this is not a major problem, since most filling occurs during the first 100 ms of diastole when the atrioventricular pressure gradient is greatest. As heart rate increases further, however, filling efficiency falls dramatically. With typical ventricular action potential durations of 300–350 ms it can be calculated that a heart rate of 180 beats/min (1 beat every 330 ms) would actually allow no time for filling at all. Moreover, if there was no diastolic relaxation period then there could be virtually no coronary perfusion to the left ventricle, so myocardial metabolism could not be sustained. Since maximal exercise capacity involves heart rates in young adults of 200 beats/min and cardiac outputs in excess of 20 L/min, this scenario is clearly too simplistic.
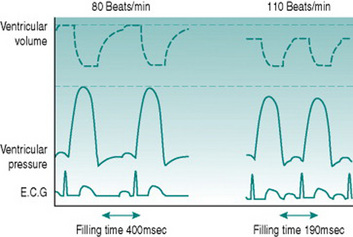
The answer is that, in fact, ventricular action potential duration does not remain constant as heart rate increases, because the sympathetically released catecholamines that produce tachycardia also reduce the cycle time of the voltage-gated calcium channels (Fig. 3.2). In consequence, the normal HRmax for a 20-year-old of 200 beats/min is associated with an endocardial ventricular action potential plateau phase of about 200 ms rather than the 350 ms seen at rest, allowing around 100 ms for ventricular filling. In consequence, stroke volume falls only slightly even at maximal work capacity.
Atrial function
For any finite diastolic period available for ventricular filling, the efficiency of the filling process depends on the pressure gradient between atria and ventricles. This is itself determined by the efficiency of atrial filling, which reflects the pressure gradient from the peripheral veins to the heart. During exercise, two factors facilitate venous return. One is the increased negative pressure inside the thorax during inspiration that results from larger tidal volume. The other is external compression of veins in the moving limbs by muscle contraction (muscle pumping) and in the abdomen by abdominal wall muscle activity during expiration. The importance of the leg muscle pump for efficient cardiac filling is illustrated by comparing circulatory responses to arm and leg exercise. During arm exercise, heart rate rises more with given work increments, because the absence of muscle pumping limits stroke volume (see Chapter 7, p. 89).
Ventricular function
The net consequence of the atrial processes described above is that end-diastolic ventricular volume and pressure rise progressively with exercise until around 60% of maximum work capacity. There are no further changes at workloads higher than this, for three reasons: first, the ongoing reduction in diastolic time limits atrial filling; second, at diastolic volumes above a certain value the ventricular muscle begins to reach its elastic limits and so becomes relatively non-distensible; and third, at these high volumes ventricular expansion becomes restricted also by the stiff pericardial sac that surrounds the heart.
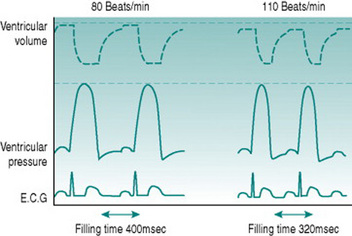
Increased ventricular filling will itself increase stroke volume, due to the Frank-Starling relationship of muscle stretch and active pressure development. In the presence of sympathetic activation, however, systolic pressure generation rises even more, due to the same effects of catecholamines on calcium channel opening as occurs in the atria. The consequences of increased contractility and more rapid contraction of the ventricular syncytium lead to an absolute reduction in end-systolic ventricular volume, so that stroke volume rises with moderate tachycardia even though diastolic filling time is reduced (Fig. 3.3).
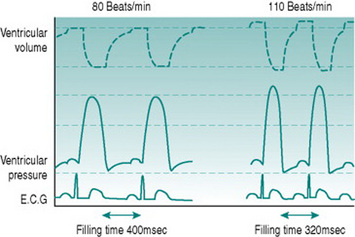
Figure 3.3 Simulated ventricular pressure and volume curves at 80 and 110 beats/min in a heart with ventricular action potential duration reduced and myocardial contractility increased as heart rate increases. Note that despite the reduced filling time (compare with Fig. 3.2), stroke volume is now higher at the higher heart rate, due to both increased ventricular filling and increased ventricular emptying.
Ventricular afterload
Just as the atrioventricular pressure gradient influences ventricular filling, the pressure gradient between ventricles and arteries must affect the efficiency of ventricular ejection. A higher diastolic arterial pressure must delay equalization of ventricular and arterial pressures during the isovolumetric phase of ventricular contraction, so shortening the proportion of systole during which ejection occurs. In theory, therefore, cardiac output should be elevated most effectively when diastolic blood pressure is minimized. In practice, however, as we shall see in Chapter 7 (p. 85), certain types of exercise are associated with increased diastolic pressure, so this can be regarded as a further factor in setting the upper effective limit for cardiac performance.
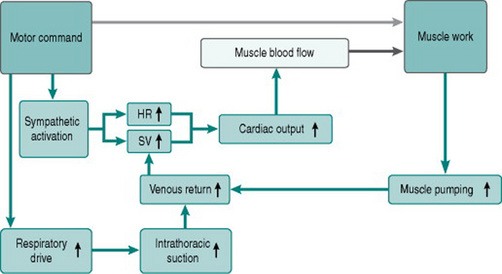
Figure 3.4 shows how the factors discussed above contribute to the exercise response.
CHARACTERISTICS OF CARDIAC EJECTION
Turbulent flow
With equal volumes of fluid movement per unit time, flow velocity is higher in narrow than wide tubes, so turbulence should be more likely in a narrow tube. Paradoxically, however, turbulence is also facilitated by large tube diameter; so absolute flow velocities that are not high enough to create turbulent flow in narrow tubes may produce turbulence in larger ones. During the cardiac cycle, the absolute velocity of blood flow is highest during the early part of ventricular ejection, when intraventricular pressure is still rising. Normally, this velocity is slightly less than that required to produce turbulence in tubes the size of the aorta and pulmonary arterial trunk. It does, however, cause turbulence in the larger diameter environment of the ventricle itself. This serves a valuable purpose.
Heart sounds
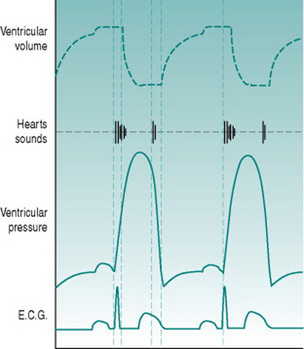
Because the heart sounds have a predictable relationship to mechanical events, they can be used to time the cardiac cycle (Fig. 3.5). Thus, the period between the beginning of the first and second sounds must define the period during which the ventricles are contracting. More important, since the isovolumetric phase of systole is short and varies only relatively little over a wide range of afterloads, the period between first and second sounds approximates the duration of ejection. Although the interval between R and T waves in the ECG also gives some information on this, timing of the end of ejection from the ECG is uncertain because of the long timecourse of the T wave.
PRACTICAL APPROACHES TO MEASUREMENT OF CARDIAC OUTPUT
For satisfactory use in normal healthy subjects, it is important that the techniques used to measure cardiovascular parameters are non-invasive wherever possible. This minimizes potential for adverse events, is more comfortable for subjects and is more likely to encourage participation. A variety of non-invasive approaches is available for estimation of cardiac output. The choice between these depends on the accuracy required, the technologies that are to hand and the experimental environment. The following section summarizes the principles underlying those methods that are in common use and indicates their advantages and limitations.
Extrapolation from oxygen consumption
Some years ago (Astrand et al 1964) it was shown that with workloads below the lactate threshold cardiac output can be estimated from oxygen consumption according to the following equations, where both cardiac output and oxygen consumption are expressed in L/min:
Application of the Fick principle to carbon-dioxide production


that is, cardiac output is 5 L/min.
In practice, the rapid equilibration of CO2 between blood and alveolar air means that we do not need to measure blood concentrations of CO2 directly in order to make reasonably accurate estimates of cardiac output, provided that pulmonary function is normal and the subject is at a steady state for CO2 production. The end-expiratory CO2 concentration can be regarded as in equilibrium with that leaving the lung in the pulmonary venous blood (PaCO2) and this can be calculated as:

and then converted to arterial CO2 content by reference to a CO2 dissociation table. The assumption that complete equilibrium is achieved between air and plasma has to be recognized as a potential source of error, because the steep slope of the CO2 dissociation curve means that significant changes in CO2 content could occur with only minor shifts in alveolar PCO2.
Thoracic conductance and impedance
If the resting electrical resistance of the thorax is measured along the rostrocaudal axis, a decreased resistance can be detected during the rostral movement of blood into the aortic arch that is associated with cardiac ejection. The magnitude of this change is proportional to the volume of blood involved and is, therefore, an index of stroke volume. Resistance measurement is by means of adhesive skin electrodes positioned above and below the rostrocaudal limits of the heart and stroke volume is calculated using an algorithm that incorporates the resistivity of blood and the period of ejection as measured from the ECG or a phonocardiogram.
Imaging
Astrand P, Cuddy PTE, Saltin B, Stenberg J. Cardiac output during submaximal and maximal work. Journal of Applied Physiology. 1964;19:268-274.
Miller WC, Wallace JP, Eggert KE. Predicting max HR and the HR-VO2 relationship for exercise prescription in obesity. Medicine and Science of Sports and Exercise. 1993;25:1077-1081.
Hayes B. Doppler ultrasound monitoring, including echocardiography. In Non-Invasive Cardiovascular Monitoring. London: BMJ Publishing; 1997. Chapter 13
Hayes B. Electrical impedance monitoring. In Non-Invasive Cardiovascular Monitoring. London: BMJ Publishing; 1997. Chapter 14
Myers JN. Essentials of Cardiopulmonary Exercise Testing. Champaign, IL: Human Kinetics, 1996.
Peyton PJ, Thompson B. Agreement of an inert gas rebreathing device with thermodilution and the direct oxygen Fick method in measurement of pulmonary blood flow. Journal of Clinical Monitoring. 2004;18:373-378.