[level-membership-for-pulmolory-and-respiratory-category]
CHAPTER 9 CARDIAC MONITORING
PRETEST QUESTIONS
1. Which statement about the P wave on an ECG is FALSE?
2. Artifacts found on an ECG may be caused by which of the following?
3. In which of the following cardiac arrhythmias is the QRS complex abnormally shaped as well as wider than normal?
4. A patient with a blood pressure of 110/50 mm Hg and a pulse rate of 75 beats/min has which of the following pulse pressures?
5. A weak pulse is detected distal to the arterial catheter in a patient. This is indicative of which of the following?
6. Which of the following conditions results in a decreased central venous pressure (CVP) reading?
REVIEW
CRT Exam Content Matrix: IA8a, IB9a, IB10a, IIA17-18
RRT Exam Content Matrix: IA8a, IB9a, IB10a
 Exam Note
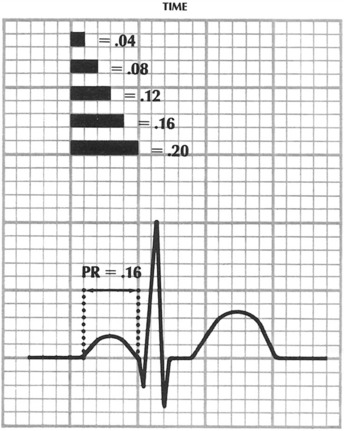
FIGURE 9-2 Normal electrocardiographic (ECG) pattern.
From Davis D: Differential diagnosis of arrhythmias, ed 2, Philadelphia, 1997, Saunders.
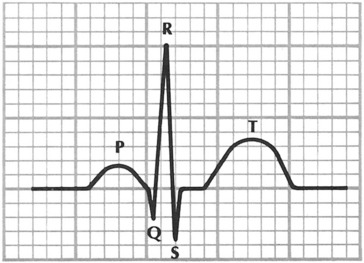
FIGURE 9-3 One cardiac cycle.
From Davis D: Differential diagnosis of arrhythmias, ed 2, Philadelphia, 1997, Saunders.
FIGURE 9-4 Electrocardiographic (ECG) tracing showing the widened QRS complex.
From Levitsky MG, Cairo JN, Hall SM: Introduction to respiratory care, Philadelphia, 1990, Saunders.
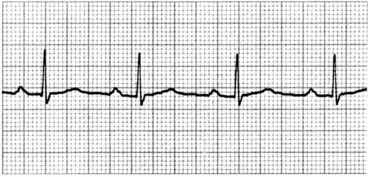
FIGURE 9-5 Electrocardiographic (ECG) tracing showing a prolonged PR interval.
From Davis D: Differential diagnosis of arrhythmias, ed 2, Philadelphia, 1997, Saunders.
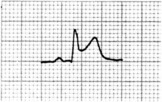
FIGURE 9-6 Electrocardiographic (ECG) tracing showing ST segment depression.
From Davis D: Differential diagnosis of arrhythmias, ed 2, Philadelphia, 1997, Saunders.
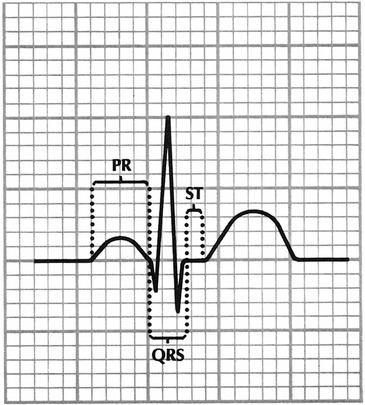
FIGURE 9-7 Normal heart rhythm.
From Davis D: Differential diagnosis of arrhythmias, ed 2, Philadelphia, 1997, Saunders.
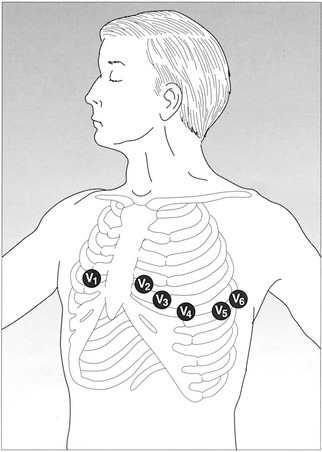
 Blood supply to the heart is supplied by two main arteries: the right and left coronary arteries, which originate from the aorta. The right coronary artery extends down to feed the right ventricle and then separates into several branches. The left coronary artery divides into two major branches: the circumflex branch, which feeds the upper lateral wall of the left atrium and left ventricle, and the left anterior descending branch (anterior interventricular artery), which feeds the anterior portion of the heart.
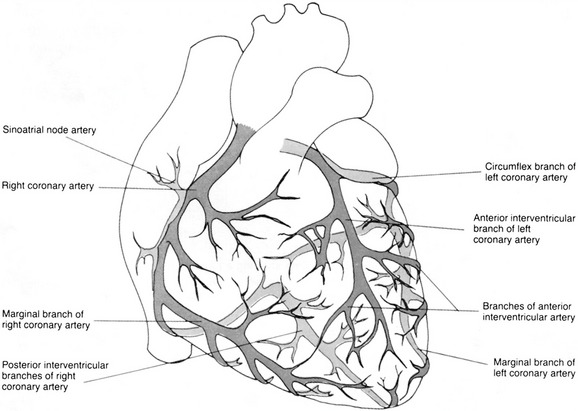
FIGURE 9-8 Primary and secondary arteries in the heart.
From O’Toole M, editor: Miller-Keane encyclopedia and dictionary of medicine, nursing, and allied health, revised revision, Philadelphia, 2005, Saunders.
 Exam Note
If all the above observations are within normal limits, the ECG shows normal sinus rhythm.
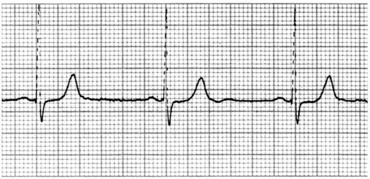
FIGURE 9-9 Sinus bradycardia.
From Davis D: Differential diagnosis of arrhythmias, ed 2, Philadelphia, 1997, Saunders.
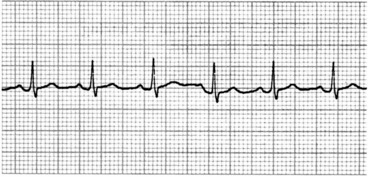
FIGURE 9-10 Sinus tachycardia.
From Davis D: Differential diagnosis of arrhythmias, ed 2, Philadelphia, 1997, Saunders.
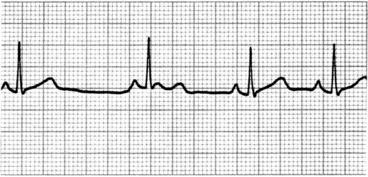
FIGURE 9-11 Sinus arrhythmia.
From Davis D: Differential diagnosis of arrhythmias, ed 2, Philadelphia, 1997, Saunders.
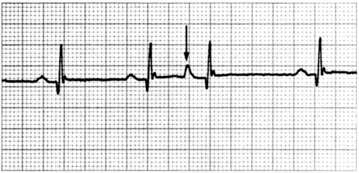
FIGURE 9-12 Premature atrial contraction (PAC).
From Davis D: Differential diagnosis of arrhythmias, ed 2, Philadelphia, 1997, Saunders.
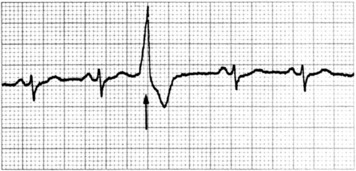
FIGURE 9-13 Premature ventricular contraction (PVC).
From Davis D: Differential diagnosis of arrhythmias, ed 2, Philadelphia, 1997, Saunders.
 Exam Note
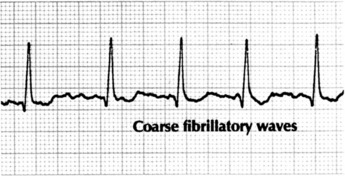
FIGURE 9-14 Atrial fibrillation.
From Davis D: Differential diagnosis of arrhythmias, ed 2, Philadelphia, 1997, Saunders.
 Exam Note
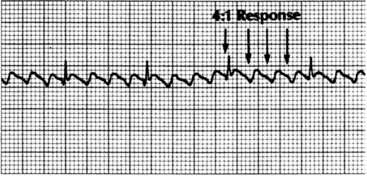
FIGURE 9-15 Atrial flutter.
From Davis D: Differential diagnosis of arrhythmias, ed 2, Philadelphia, 1997, Saunders.
 Atrial flutter is an arrhythmia that results in blockade of atrial impulses in what is called a 2 : 1, 3 : 1, or 4 : 1 block. In a 2 : 1 block, there are two atrial impulses for each ventricular beat, and there are three or four impulses to each ventricular beat in a 3 : 1 or 4 : 1 block, respectively.
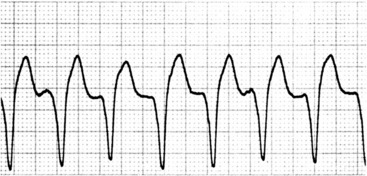
FIGURE 9-16 Ventricular tachycardia (lethal).
From Davis D: Differential diagnosis of arrhythmias, ed 2, Philadelphia, 1997, Saunders.
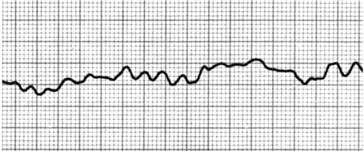
FIGURE 9-17 Ventricular fibrillation (lethal).
From Davis D: Differential diagnosis of arrhythmias, ed 2, Philadelphia, 1997, Saunders.
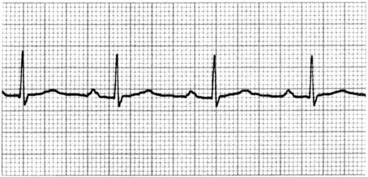
FIGURE 9-18 First-degree heart block.
From Davis D: Differential diagnosis of arrhythmias, ed 2, Philadelphia, 1997, Saunders.
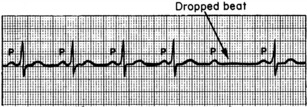
FIGURE 9-19 Second-degree heart block. Electrocardiographic (ECG) tracing showing the widened QRS complex.
From Levitsky MG, Cairo JN, Hall SM: Introduction to respiratory care, Philadelphia, 1990, Saunders.
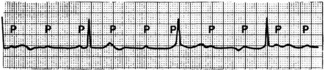
FIGURE 9-20 Third-degree heart block. Electrocardiographic (ECG) tracing showing the widened QRS complex.
From Levitsky MG, Cairo JN, Hall SM: Introduction to respiratory care, Philadelphia, 1990, Saunders.
CRT Exam Content Matrix: IA8b, IB9i, IB10i, IC10, IIIE3e, IIIE4c
RRT Exam Content Matrix: IA8b, IB9i, IB9r, IB10m, IB10s, IC11-12, IIA9a-b, IIIE3d, IIIE4a, IIIJ6
 Exam Note
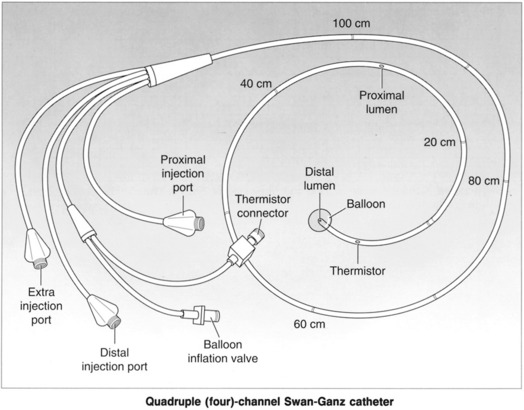
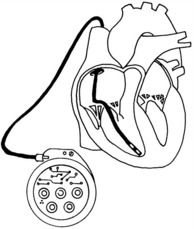
 Some catheters are equipped with only two channels, the distal channel and the balloon inflation channel.
 Exam Note
 Exam Note
 Exam Note
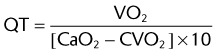
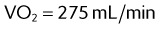
VO2 = oxygen consumption (mL/min)
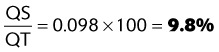
 Milliliters per deciliter (mL/dL) must be converted to mL/L to express the cardiac output in L/min. This is accomplished by multiplying the oxygen content difference by 10. Normal cardiac output is 5 L/min.

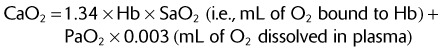
 1.34 mL of O2 is capable of binding with 1 g of Hb, and 0.003 mL of O2 is dissolved in the plasma for each 1 mm Hg of PaO2.
EXAMPLE:
Calculate the total arterial O2 content from the following data:
| Hb | 15 g% |
| SaO2 | 98% |
| PaO2 | 86 mm Hg |


EXAMPLE:
Calculate the total venous O2 content, given the following data.
| Hb | 15 g% |
| SvO2 | 75% |
| PvO2 | 40 mm Hg |


 Exam Note
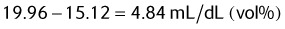
 C(a − v)O2 is useful in determining the effects that PEEP and mechanical ventilation have on the patient’s cardiac output and in evaluating the patient’s need for more circulatory support.
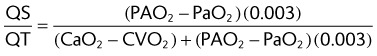
This formula requires a 100% Hb saturation of O2 in arterial blood.

EXAMPLE:
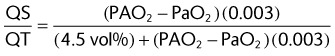
Calculate a patient’s percentage of shunt given the following data
| pH | 7.37 |
| PaCO2 | 45 mm Hg |
| PAO2 | 60 mm Hg |
| FiO2 | 0.40 |
| PB | 747 mm Hg |

*
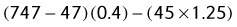

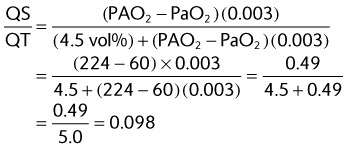
This means that almost 10% of the patient’s cardiac output is not being oxygenated in the lungs.
 Exam Note
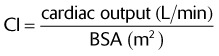
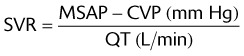
MSAP = mean systemic arterial pressure
 This resistance formula may be multiplied by 80 to convert to resistance units of dyne × s × cm−5.
MPAP = mean pulmonary artery pressure
PAWP = pulmonary artery wedge pressure
 This resistance formula may be multiplied by 80 to convert to resistance units of dyne × s × cm−5.
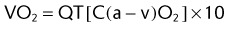
10 = factor to convert C(a − v)O2 to milliliters of O2 per liter
EXAMPLE:
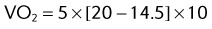
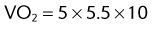
Given the following data, calculate a patient’s O2 consumption (uptake).
| QT | 5 L/min |
| CaO2 | 20 vol% |
| CVO2 | 14.5 vol% |
III. CARDIOPULMONARY STRESS TESTING
CRT Exam Content Matrix: IB9r, IB10r, IIIE7e
RRT Exam Content Matrix: IB9s, IB10t, IIIE7e
The examination should include
POSTCHAPTER STUDY QUESTIONS
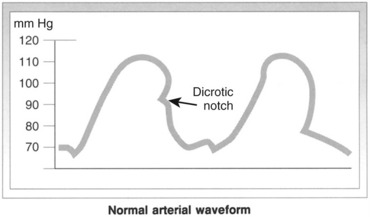
1. List four causes of a “damped” arterial pressure waveform.
2. List five conditions that cause an increased CVP.
3. List four conditions that cause a decreased CVP.
4. What are three drugs used to treat PVCs.
5. What is the treatment for ventricular tachycardia?
6. List three conditions that cause an increased PAP.
7. List two conditions that cause a decreased PAP.
8. PAWP is a measurement of what function?
9. List four conditions that cause an increased PCWP.
10. List two conditions that cause a decreased PCWP.
11. List the normal values for CVP, PAP, and PCWP.
12. Calculate the QT of a patient who has a VO2 of 240 mL/min and a C(a − v)O2 of 6 vol%.
13. In a healthy person, what percentage of the cardiac output makes up the intrapulmonary shunt?
14. Calculate the C(a − v)O2, given the following information
15. List four conditions that increase physiologic shunting.
16. Calculate the percentage of intrapulmonary shunt given the following information
17. List four factors that cause an increased SVR.
18. List three factors that cause a decreased SVR.
19. List five factors that cause an increased PVR.
20. List three factors that cause a decreased PVR.
21. Calculate the oxygen consumption given the following information
22. List four factors that cause an increased O2 consumption.
23. List three factors that cause a decreased O2 consumption.
Davis D. How to quickly and accurately master ECG interpretation. Philadelphia: JB Lippincott; 1985.
Davis D. Differential diagnosis of arrhythmias, ed 2. Philadelphia: Saunders; 1997.
Des Jardins T. Cardiopulmonary anatomy and physiology, ed 5. Albany, NY: Delmar; 2008.
Hess D. and others, Respiratory care principles and practice, ed 1. Philadelphia: Saunders; 2002.
Levitsky MG, Cairo JN, Hall SM. Introduction to respiratory care. Philadelphia: Saunders; 1990.
O’Toole M. Miller-Keane encyclopedia and dictionary of medicine, nursing, and allied health. Philadelphia: Saunders; 2005.
Wilkins RL, Stoller JK, Kacmarek R. Egan’s fundamentals of respiratory care, ed 9. St Louis: Mosby; 2009.
Wilkins R, Krider S, Sheldon R. Clinical assessment in respiratory care, ed 6. St Louis: Mosby; 2010.
[/level-membership-for-pulmolory-and-respiratory-category][not-level-membership-for-pulmolory-and-respiratory-category]
CHAPTER 9 CARDIAC MONITORING
PRETEST QUESTIONS
1. Which statement about the P wave on an ECG is FALSE?
2. Artifacts found on an ECG may be caused by which of the following?
3. In which of the following cardiac arrhythmias is the QRS complex abnormally shaped as well as wider than normal?
4. A patient with a blood pressure of 110/50 mm Hg and a pulse rate of 75 beats/min has which of the following pulse pressures?
5. A weak pulse is detected distal to the arterial catheter in a patient. This is indicative of which of the following?
6. Which of the following conditions results in a decreased central venous pressure (CVP) reading?
REVIEW
CRT Exam Content Matrix: IA8a, IB9a, IB10a, IIA17-18
RRT Exam Content Matrix: IA8a, IB9a, IB10a
FIGURE 9-2 Normal electrocardiographic (ECG) pattern.
From Davis D: Differential diagnosis of arrhythmias, ed 2, Philadelphia, 1997, Saunders.
FIGURE 9-3 One cardiac cycle.
From Davis D: Differential diagnosis of arrhythmias, ed 2, Philadelphia, 1997, Saunders.
FIGURE 9-4 Electrocardiographic (ECG) tracing showing the widened QRS complex.
From Levitsky MG, Cairo JN, Hall SM: Introduction to respiratory care, Philadelphia, 1990, Saunders.
FIGURE 9-5 Electrocardiographic (ECG) tracing showing a prolonged PR interval.
From Davis D: Differential diagnosis of arrhythmias, ed 2, Philadelphia, 1997, Saunders.
FIGURE 9-6 Electrocardiographic (ECG) tracing showing ST segment depression.
From Davis D: Differential diagnosis of arrhythmias, ed 2, Philadelphia, 1997, Saunders.
FIGURE 9-7 Normal heart rhythm.
From Davis D: Differential diagnosis of arrhythmias, ed 2, Philadelphia, 1997, Saunders.
FIGURE 9-8 Primary and secondary arteries in the heart.
From O’Toole M, editor: Miller-Keane encyclopedia and dictionary of medicine, nursing, and allied health, revised revision, Philadelphia, 2005, Saunders.
Exam Note
If all the above observations are within normal limits, the ECG shows normal sinus rhythm.
FIGURE 9-9 Sinus bradycardia.
From Davis D: Differential diagnosis of arrhythmias, ed 2, Philadelphia, 1997, Saunders.
FIGURE 9-10 Sinus tachycardia.
From Davis D: Differential diagnosis of arrhythmias, ed 2, Philadelphia, 1997, Saunders.
FIGURE 9-11 Sinus arrhythmia.
From Davis D: Differential diagnosis of arrhythmias, ed 2, Philadelphia, 1997, Saunders.
FIGURE 9-12 Premature atrial contraction (PAC).
From Davis D: Differential diagnosis of arrhythmias, ed 2, Philadelphia, 1997, Saunders.
FIGURE 9-13 Premature ventricular contraction (PVC).
From Davis D: Differential diagnosis of arrhythmias, ed 2, Philadelphia, 1997, Saunders.
FIGURE 9-14 Atrial fibrillation.
From Davis D: Differential diagnosis of arrhythmias, ed 2, Philadelphia, 1997, Saunders.
FIGURE 9-15 Atrial flutter.
From Davis D: Differential diagnosis of arrhythmias, ed 2, Philadelphia, 1997, Saunders.
[/not-level-membership-for-pulmolory-and-respiratory-category]
