[level-membership-for-pulmolory-and-respiratory-category]
Cardiac Electrophysiology and ECG Interpretation
I The electric conduction system of the heart functions in the:
A Provision of electric excitation of the myocardial fibers without extrinsic stimuli (automaticity).
B Conduction of electric impulses through the myocardium.
C Organized distribution of the electric impulses to the myocardium in a repetitive, sequential fashion.
II Electroconduction System of the Heart (Figure 11-1)
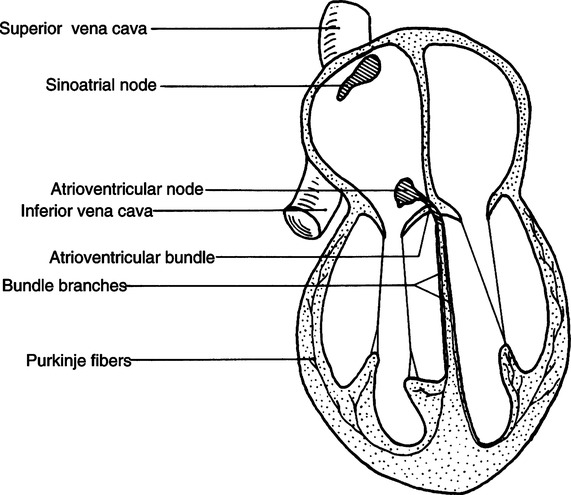
1. The SA node is located in the right atrium just inferior and posterior to the entrance of the superior vena cava.
2. It is commonly referred to as the pacemaker of the heart, its primary function.
3. The SA node has an intrinsic rate of depolarization of 60 to 100/min.
4. The rate of depolarization ordinarily is under the control of the sympathetic and parasympathetic nervous systems.
a. Sympathetic stimulation of the SA node increases the rate of depolarization-positive chronotropism.
b. Parasympathetic stimulation of the SA node decreases the rate of depolarization-negative chronotropism.
5. The wave of depolarization initiated from the SA node travels outwardly through the atrial musculature in concentric circles, thus depolarizing the atria and ultimately the atrioventricular (AV) node.
6. For all practical purposes, the left and right atria depolarize simultaneously.
1. The AV node is located in the right atrium between the opening of the coronary sinus and interatrial septum.
2. Histologically it comprises cells identical to those of the SA node.
3. The function of the AV node is threefold:
a. Backup cardiac pacemaker because of its intrinsic depolarization rate of 40 to 60/min.
b. The only electrical bridge between atria and ventricles.
c. Responsible for delaying impulses from atria to ventricles.
4. The AV node becomes continuous with the common bundle branch (bundle of His) and is the only normal pathway for electric conduction between atria and ventricles. The fibroskeleton of the heart electrically separates atrial from ventricular muscle. The AV node and common bundle penetrate the cardiac fibroskeleton.
5. The tissue of the AV node slows the rate of electrical conduction and accounts for the time delay between atrial and ventricular depolarization. This time delay also allows optimal ventricular filling before ventricular contraction (systole).
6. The rate of conduction of electrical impulses through the AV node is under the control of the sympathetic and parasympathetic nervous systems.
1. It is also known as the AV bundle or bundle of His.
2. It is located on the right side of the interventricular septum and penetrates the right fibrous trigone.
a. To conduct impulses from the AV node to the left and right bundle branches.
b. To penetrate the fibroskeleton of the heart, electrically bridging the atrial conduction system to the ventricular conduction system.
4. The common bundle branch travels inferiorly in the interventricular septum for approximately 10 to 12 mm and then divides into one right and two left bundle branches.
D Right and left bundle branches
1. The right bundle branch appears simply as a continuation of the common bundle branch and follows an inferior course toward the apex of the heart.
2. The left bundle branch penetrates the interventricular septum and divides into an anterior and posterior left bundle branch. Both bundle branches course inferiorly on the left side of the interventricular septum.
3. The function of the three major bundle branches is to conduct electric impulses from the common bundle branch to the Purkinje fibers.
1. The Purkinje fibers are fine ramifications of the bundle branches, which terminate on the endocardial layer of the heart.
2. They are located throughout the entire endocardial layer of both ventricles and conduct the electrical impulses from the bundle branches to the ventricles. Depolarization of the ventricles begins when impulses leaving the Purkinje fibers invade the endocardial layer.
3. The wave of depolarization travels from the endocardial layer outward toward the epicardium and also from the apex toward the base of the ventricles.
F Summary of pathway of normal electrical conduction
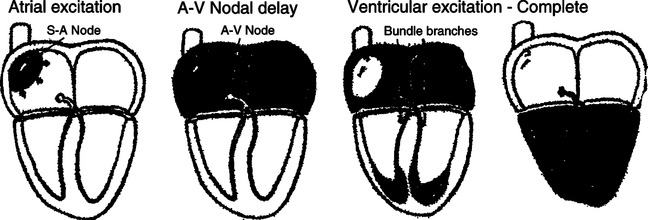
1. Impulses originate in the right atrium by spontaneous depolarization of the SA node.
2. Impulses are conducted through atrial muscle, which results in depolarization of right and left atria and AV node.
3. The impulse is delayed at the AV node and then conducted through the cardiac fibroskeleton by the AV node and common bundle branch.
4. The impulse is then conducted from the common bundle branch through the right and left bundle branches to the Purkinje fibers.
5. The impulses exit the Purkinje fibers and cause depolarization of the ventricle from inside out and from apex to base.
6. Design of the electrical conduction system of the heart allows simultaneous depolarization of the right and left atria totally separate from simultaneous depolarization of the right and left ventricles. This fact has important implications for the mechanical function of the heart (Figure 11-2).
A Electrocardiography (ECG) provides a graphic display of current generated by the heart at the surface of the body. It depicts depolarization and repolarization of atria and ventricles.
B ECG is used to assess the electrical activity of the heart and should be clearly delineated from the mechanical activity of the heart. However, the electrical activity possesses significant potential implications in the mechanical activity of the heart.
C Each portion of the cardiac cycle generates a specific type of electrical impulse. These impulses are repetitious and produce characteristic patterns on an ECG recording.
D The four major electrical cardiac events are atrial depolarization, atrial repolarization, ventricular depolarization, and ventricular repolarization.
1. The polarized state is the normal resting state of cardiac muscle fiber. The extracellular charge is positive with respect to the intracellular charge (Figure 11-3, A).
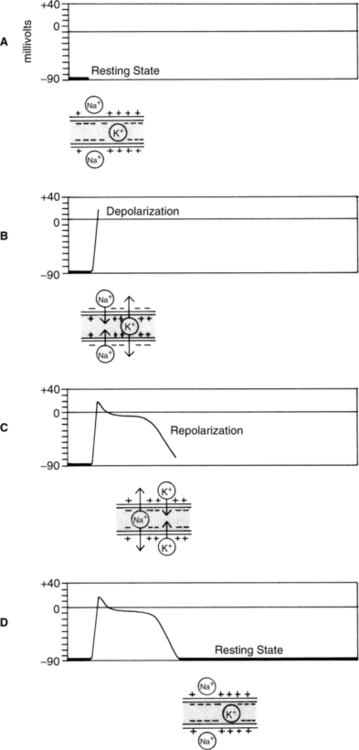
2. Depolarization is the process of reversing the normal state of polarity. Thus depolarization causes the extracellular charge to be negative with respect to the intracellular charge. This is largely because inflow of extracellular sodium ions is faster than outflow of intracellular potassium ions. Reversal of the cellular membrane charge is transmitted along cardiac muscle fiber, depolarizing subsequent fibers (see Figure 11-3, B). If the muscle fibers are normal, this electrochemical stimulation results in mechanical activity (e.g., shortening of muscle fibers and cardiac contraction).
3. Repolarization is the process of reestablishing the normal state of polarity (i.e., reestablishing a positive extracellular charge with respect to the intracellular charge). The reestablishment of the resting cellular membrane charge is transmitted along the cardiac muscle fiber, repolarizing subsequent fibers (see Figure 11-3, C). If muscle fibers are normal, this electrochemical stimulation results in lengthening of muscle fibers and cardiac relaxation. (Note: It is a mistake to assume that the mechanical activity of the heart is normal simply because the electric activity [ECG] is normal.)
E The electric deflections of the ECG in normal sequence are P wave, QRS complex, and T wave when measured by electrodes with specific polarities placed in standardized positions on the chest and limbs (Figure 11-4).
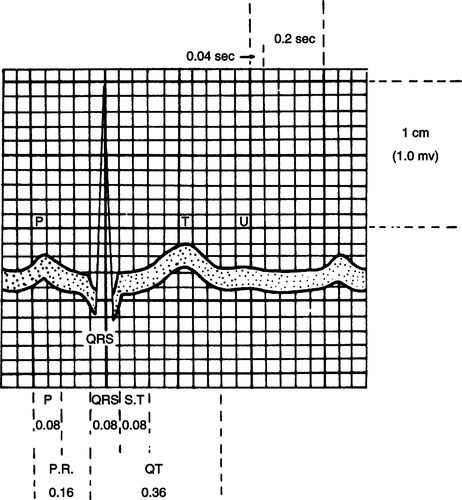
1. The P wave is produced by atrial depolarization and normally is 0.06 to 0.11 second in duration.
2. The QRS complex is produced by ventricular depolarization and normally is 0.03 to 0.12 second in duration. Repolarization of the atria occurs simultaneously with ventricular depolarization and is masked by the overwhelming electric event of the QRS complex.
3. The T wave is produced by ventricular repolarization and normally is 0.14 to 0.26 second in duration.
1. PR interval: Time from the beginning of atrial depolarization to the beginning of ventricular depolarization. The PR interval normally is 0.12 to 0.20 second in duration.
2. RR interval: Time from the peak of one QRS complex to the next QRS complex. It is used to measure the total cardiac cycle and normally is 0.6 to 1.0 second in duration.
3. PP interval: Time from the beginning of one P wave to the beginning of the next P wave. It can be used to measure the total cardiac cycle time and hence the cardiac rate. It is normally equal to the RR interval (0.6 to 1.0 second in duration).
G Summary of normal time values for ECG events (Table 11-1)
TABLE 11-1
Normal Time Values for Electrocardiographic (ECG) Events
| ECG Event | Time |
| P wave | 0.06-0.11 second |
| PR interval | 0.12-0.20 second |
| QRS complex | 0.03-0.12 second |
| T wave | 0.14-0.26 second |
| PP/RR intervals | 0.60-1.00 second |
H Standard leads for measuring/monitoring ECG events
1. The three standard limb leads are lead I, lead II, and lead III (Figure 11-5).
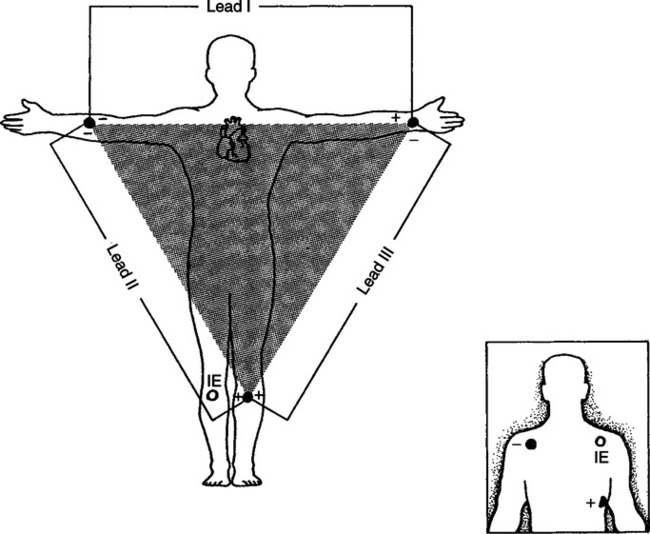
a. Lead I has the negative (−) electrode on the right arm and the positive (+) electrode on the left arm.
b. Lead II has the negative (−) electrode on the right arm and the positive (+) electrode on the left leg.
c. Lead III has the (−) electrode on the left arm and the positive (+) electrode on the left leg.
d. The three standard limb leads comprise Einthoven’s triangle and measure the electrical activity of the heart from three different orientations each in the coronal (plane) dimension.
2. The six standard unipolar precordial leads are V1, V2, V3, V4, V5, and V6, where the V represents voltage and each of the numbers 1 through 6 designates a standard position on the chest of the positive (+) electrode (Figure 11-6).
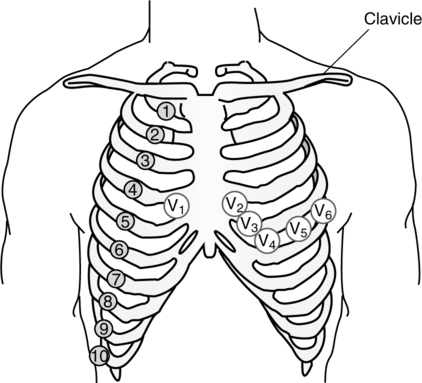
a. The V1 lead has the positive electrode placed at the right sternal margin and the fourth intercostal space.
b. Successive positioning for V2 through V6 is located laterally left all at the same transverse level, with V6 being positioned at the left midaxillary line.
c. The six precordial leads measure the electrical activity of the heart from six different orientations each in the transverse (plane) dimension.
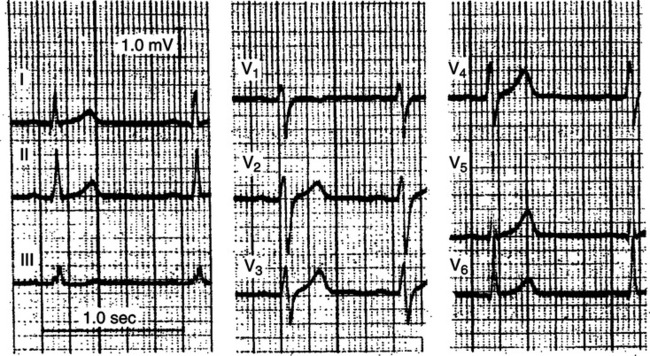
3. Therefore the same consistently generated electrical activity of the heart will be depicted graphically differently for each lead (Figure 11-7).
4. The standard monitoring lead for acutely ill patients is typically a modified lead II position with the electrodes moved onto the chest and somewhat arbitrarily placed to generate the clearest, consistent representation of ECG events (see Figure 11-5, insert).
5. There are three more unipolar extremity leads, VR,, VL, and VF, which along with the aforementioned nine standard leads comprise the diagnostic 12-lead ECG. Each of the VR, VL, and VF leads has the positive electrode placed on the right arm, left arm, and left leg, respectively. These leads measure the electrical activity of the heart in the coronal (plane) dimension and provide an orientation similar to that of the standard limb leads.
6. The P wave, QRS complex, and T wave each represent the collective amount of electrical current and instantaneous direction of that current as measured by a single lead (unidimensional orientation).
a. For example, depolarization of the atria proceeds from the superior aspect of the atria and heads in an inferior and slightly leftward direction with successively more collective current generated by greater amounts of atrial muscle fibers depolarized, then decreasing current because there are fewer fibers involved, and eventually no current when depolarization is complete. When measured at a monitoring lead (modified lead II) there is a steadily increasing, then steadily decreasing, collective wave of positive charges heading toward the positive (+) electrode and away from the negative (−) electrode. This is represented on the ECG as a positive deflection (wave) above the baseline or the classic P wave. When depolarization of the atria is complete there is no electrical current, and the ECG tracing returns to baseline, generating the flat PR segment.
b. Depolarization of the ventricles is a little more complex, initially heading from the apex toward the base with septal emphasis. The majority of ventricular depolarization then heads from the base toward the apex, followed by a small portion of depolarization heading in the initial apex to base direction. When measured at a monitoring lead there is a small initial wave of positive charges heading toward the negative (−) electrode, generating the small negative deflection from baseline (Q wave). This is followed by a steadily increasing (and eventually large) wave of positive charges heading toward the positive (+) electrode, which generates the large R wave on the ECG. The collective end of ventricular depolarization heads toward the base of the heart, generating a small wave of positive charges toward the negative (−) electrode and a small negative deflection (S wave). Collectively these ventricular events are represented on the ECG as the classic QRS complex.
c. ECG representation of the repolarization of the atria is masked by the large electrical event of ventricular depolarization as it occurs simultaneously.
d. Repolarization of the ventricles proceeds interestingly from the apex to the base and is characterized by a steadily increasing, then steadily decreasing, collective wave of negative charges heading toward the negative (−) electrode. This is represented on the ECG as a positive deflection (wave) above the baseline or the classic T wave.
e. Note that if the orientation of the lead was changed with the positive electrode placed on the upper right chest and the negative electrode placed on the lower left chest, the same electrical current generated by the heart would generate negative deflections from the baseline for the P, R, and T waves and positive deflections for the Q and S waves, all with the same general configuration and magnitude as compared with what was previously described.
A The following system represents one simple, organized approach to the evaluation of ECG tracings. There exists a multitude of approaches to the evaluation of ECGs. No matter which one is used, it should provide an organized, repetitive system, which evaluates, at the very least, the following aspects of the ECG.
b. Should have a configuration similar to that of other P waves.
c. Should be related on a one-to-one basis to the QRS complex.
a. Should have a normal duration of 0.12 to 0.20 second.
b. Should have consistent duration when compared with other PR intervals.
a. Should have a duration of <0.12 second.
b. Should have a similar configuration when compared with other QRS complexes.
a. RR intervals should have a consistent duration when compared with other RR intervals.
b. PP intervals should have a consistent duration when compared with other PP intervals.
c. RR interval should be approximately equal to the PP interval in duration.
a. Should be 60 to 100 events/min.
b. Atrial rate should be equal to the ventricular rate.
c. The atrial and ventricular rates can be determined by using the PP and RR interval measurements on calibrated ECG paper (see Figure 11-4).
(1) The ECG paper is divided into small (fine-lined) and large (bold-lined) squares that measure 1 mm and 5 mm, respectively, on each side.
(2) Each small (1 mm) horizontal square represents 0.04 second, and each larger (5 mm) horizontal square represents 0.2 second.
(3) Therefore if the RR interval spans four large boxes, it measures 0.8 second; 60 sec/min divided by 0.8 sec/ventricular cycle = 75 ventricular cycles/min. If the PP and RR intervals are equal, then the cardiac rate = 75 events/min.
(4) The resulting rate for the RR interval spanning one large box is 300/min. The RR interval spanning two large boxes is 150/min; three large boxes is 100/min; four large boxes is 75/min; five large boxes is 60/min; six large boxes is 50/min; seven large boxes is 43/min; and eight large boxes is 37/min. This provides for a quick estimate of rate of any cardiac event by simply memorizing and counting off large (bold-lined) boxes spanned by cardiac events, with the descending rates of 300, 150, 100, 75, 60, 50, 43, and 37/min.
(5) The small (1 mm) vertical square represents 0.1 mV, and each larger (5 mm) vertical square represents 0.5 mV of electrical amplitude. This measurement is of little importance in the clinical setting when the ECG is being used on a continuous monitoring basis. Further the amplitude is commonly amplified to generate a large R wave that will easily be recognized by the monitor and therefore provide an accurate heart rate.
6. After careful evaluation of the previous five steps, the underlying aberration, if any, should be revealed and the rhythm easily identified.
7. Treatment, if any, should then be guided by the existent and/or potential mechanical consequences of the identified cardiac rhythm.
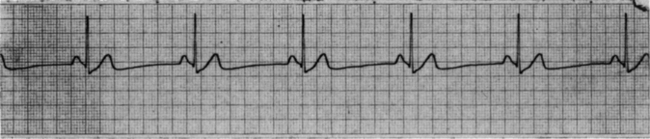
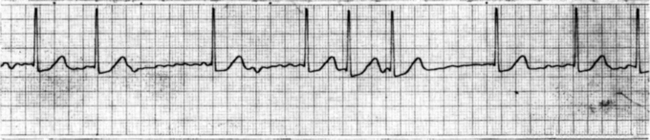
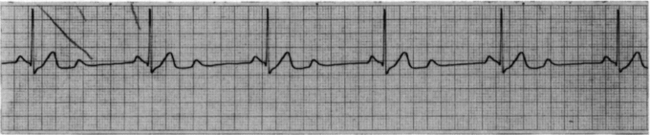
B Normal sinus rhythm (Figure 11-8)
1. P waves are present, have similar configurations, and are related to QRS complexes.
2. PR interval is 0.12 to 0.20 second and equal to other PR intervals.
3. QRS complex is <0.12 second and similar in configuration to other QRS complexes.
4. RR intervals are regular and equal to PP intervals.
C Sinus arrhythmia (Figure 11-9)
1. P waves are present, have similar configuration, and are related to the QRS complexes.
2. PR interval is normal in duration and equal to other PR intervals.
3. QRS complex is normal in duration and similar in configuration to other QRS complexes.
4. PP and RR intervals vary (typically with the ventilatory cycle); however, they are equal to one another for a given cardiac cycle.
5. Cardiac rate varies; however, it generally averages 60 to 100 events/min.
6. Generally no treatment is warranted unless there are significant alterations in arterial blood pressure (i.e., symptomatic hypotension), in which (rare) case, atropine may be used to accelerate cardiac rate.
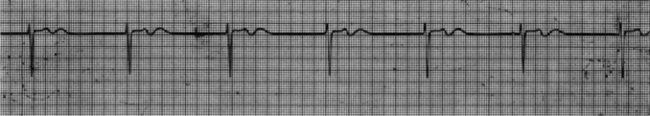
D Sinus bradycardia (Figure 11-10)
1. P waves are present, have similar configuration, and are related to QRS complexes.
2. PR interval is normal in duration and equal to other PR intervals.
3. QRS complex is normal in duration and similar in configuration to other QRS complexes.
4. RR intervals are regular and equal to PP intervals.
5. Cardiac rate is <60 events/min.
6. Generally no treatment is warranted unless there are significant alterations in arterial blood pressure (i.e., symptomatic hypotension). Treatment is aimed at increasing the heart rate, in which case intravenous atropine is the drug of choice. Further therapies include transcutaneous and transvenous pacing and epinephrine, dopamine, and isoproterenol administration.
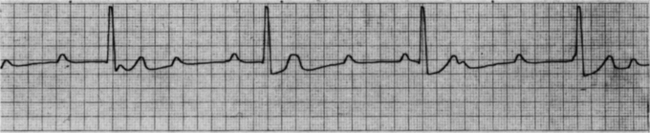
E Sinus tachycardia (Figure 11-11)
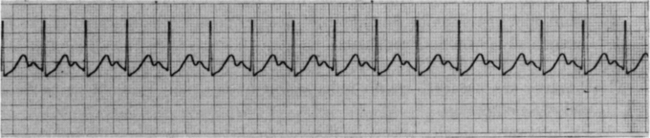
1. P waves are present, have similar configuration, and are related to QRS complexes.
2. PR interval is normal in duration (lower limits of normal) and equal to other PR intervals.
3. QRS complex is normal in duration and similar in configuration to other QRS complexes.
4. RR intervals are regular and equal to PP intervals.
5. Cardiac rate is >100 events/min.
6. This rhythm is the normal physiologic response to stress and occurs with infection, hypovolemia, hypoxemia, and myocardial infarction and in response to stimulant drugs; therefore, intervention should be aimed at treating the underlying cause. The rate usually has a gradual onset and elimination.
F Premature atrial contraction (PAC) (Figure 11-12)
1. P wave occurs earlier than expected and may have a normal or abnormal configuration.
2. PR interval is usually normal and equal in duration to other PR intervals.
3. QRS complex is usually normal in duration and similar in configuration to other QRS complexes; however, it may be absent if the P wave is not conducted through the AV node.
4. PP and RR intervals vary with the PAC; however, they are equal to one another for a given cardiac cycle.
5. Cardiac rate: PACs can occur at any rate.
6. No treatment is warranted if the PACs are infrequent. There are many causes, including increased sympathetic stimulation, exogenous stimulants, drug interactions, cardiac ischemia, and acute myocardial infarction. PACs indicate increased automaticity; therefore, when they are frequent, discontinuation of stimulants such as tobacco, caffeine, and/or sympathomimetics is generally indicated.
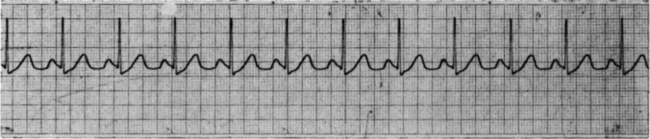
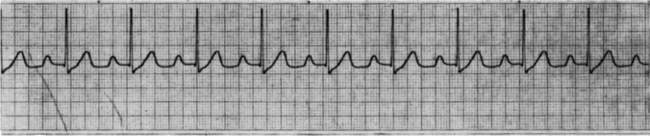
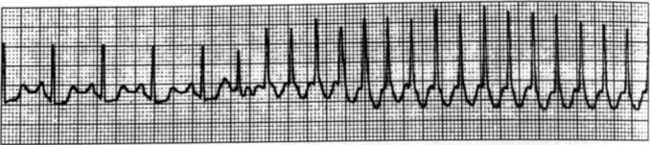
G Atrial tachycardia (Figure 11-13)
1. P waves are present; however, they may be superimposed on a preceding T wave.
2. PR interval is usually normal in duration and equal to other PR intervals. However, with rapid rates it may be difficult to determine.
3. QRS complex is usually normal in duration and similar in configuration to other QRS complexes.
4. PP and RR intervals are regular and usually equal to each other.
5. Rate: Atrial rate is usually 160 to 220/min, and ventricular rate is 160 to 220/min with 1:1 conduction; however, it may be 80 to 110/min with 2:1 conduction.
6. Conservative treatment, such as vagal stimulation (i.e., carotid sinus massage or Valsalva maneuver), should be used for the symptomatic but hemodynamically stable patient, followed by intravenous adenosine administration to allow identification of the tachycardic source, underlying cause, and appropriate treatment. If cardiac function remains good, sequential priority-based administration of β-blockers, Ca2+channel blockers, and amiodarone is warranted. Conversely, for patients with poor cardiac function (e.g., congestive heart failure or ejection fraction <40%), amiodarone and diltiazem, without synchronized direct current (DC) countershock, are used. When the arrhythmia has resulted in significant hemodynamic instability, synchronized DC countershock with sequentially increasing power (50, 100, 200, 300, and 360 J) is the treatment of choice.
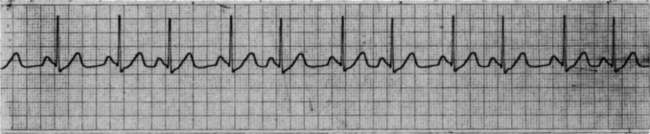
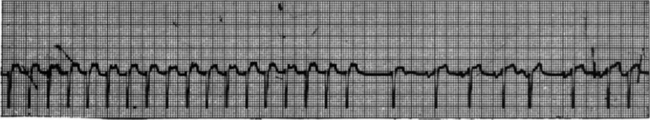
H Atrial flutter (Figure 11-14)
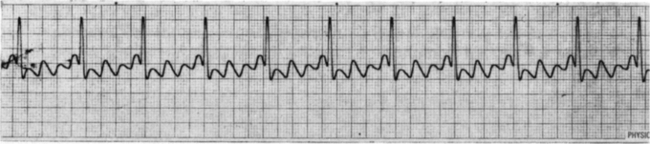
1. P waves are present, have similar configuration, and resemble a saw-tooth or picket fence pattern.
2. PR interval is usually normal and equal in duration to other PR intervals; however, it may be difficult to measure.
3. QRS complex is usually normal in duration and similar in configuration to other QRS complexes.
4. PP interval is regular and equal to other PP intervals; RR interval is regular and equal to other RR intervals; PP interval is usually not equal to RR interval as a result of AV nodal block.
5. Atrial rate is typically 220 to 350/min; ventricular rate depends on the degree of conduction through the AV node (i.e., 2:1, 3:1, or 4:1 conduction).
6. When a rapid ventricular rate has resulted in hemodynamic instability, synchronized DC countershock is the treatment of choice. If cardiac function is poor and/or the patient is not a candidate for cardioversion, a course of digoxin, esmolol HCL, or amiodarone is used. Controlled, definitive treatment is surgical or catheter ablation.
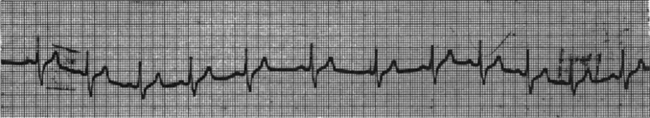
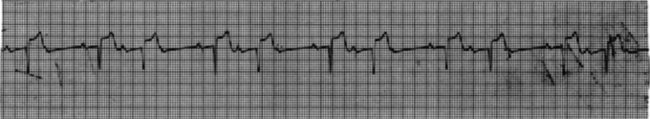
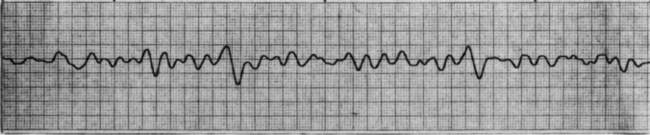
I Atrial fibrillation (Figure 11-15)
1. P waves are not truly present; rather, fine or coarse irregular rapid baseline undulations called fibrillatory waves (f waves) occur, characterized by an undulating baseline replacing P waves and an irregularly irregular ventricular response.
2. PR interval is not present.
3. QRS complex is usually normal in duration and similar in configuration to other QRS complexes.
4. PP interval is not measurable; RR interval is irregular and not equal to other RR intervals.
5. Atrial rate is approximately 350 to 700/min; ventricular rate is 100 to 200/min.
6. Initial treatment typically consists of anticoagulation and increasing doses of digoxin, esmolol HCL, or amiodarone in an attempt to block the number of impulses reaching the ventricles. However, as for atrial flutter, the treatment of choice is synchronized DC countershock when the individual is manifesting hemodynamic compromise.
J First-degree heart block (Figure 11-16)
1. P waves are present, are similar in configuration to other P waves, and are related to the QRS complex.
2. PR interval is >0.20 second and usually equal in duration to other PR intervals but may vary.
3. QRS complex is normal in duration and similar in configuration to other QRS complexes.
4. RR intervals are regular and equal to PP intervals.
5. Rate: First-degree heart block can occur at any rate.
6. Is seen in normal patients, however, may occur as a result of insult to AV node, hypoxemia, myocardial infarction, digitalis toxicity, ischemia of the conduction system, and/or increased vagal tone. No treatment is warranted with the exception of monitoring for the occurrence of higher order forms of heart block (i.e., second or third degree).
K Type I (Wenckebach) second-degree heart block (Figure 11-17)
1. P waves are present, are similar in configuration to other P waves, and are related to QRS complexes, except for the nonconducted P waves.
2. PR interval may begin with normal duration but lengthens progressively until one P wave is not conducted.
3. QRS complex is normal in duration and similar in configuration to other QRS complexes.
4. PP interval is regular and equal to other PP intervals. RR intervals vary with absent QRS complexes.
5. Atrial rate is typically 60 to 100/min; ventricular rate varies with degree of block (i.e., 2:1, 3:2, or 4:3 conduction).
6. Generally no treatment is warranted unless there are significant alterations in arterial blood pressure (i.e., symptomatic hypotension), in which case atropine, dopamine, and epinephrine should be used to accelerate cardiac rate. A transcutaneous pacemaker is indicated when pharmacologic intervention is either not effective or contraindicated. In any case, monitoring for higher order heart block is advised but rarely does this conduction abnormality progress to higher degree heart blocks.
L Type II (Mobitz II) second-degree heart block (Figure 11-18)
1. P waves are present, are similar in configuration to other P waves, and are related to QRS complexes, except for the nonconducted P waves.
2. PR interval may be normal or prolonged; however, it is equal in duration to other PR intervals.
3. QRS complex is usually normal in duration and similar in configuration to other QRS complexes.
4. PP interval is regular and equal to other PP intervals. RR intervals vary with absent QRS complexes; however, the PP and RR intervals are equal in cardiac cycles where the P wave is conducted.
5. Atrial rate is typically 60 to 100/min; ventricular rate varies with the degree of block.
6. A permanent pacemaker is the treatment of choice to ensure adequate ventricular rate. Intravenous atropine, transcutaneous pacing, dopamine, epinephrine, and lastly transvenous pacing are used to ensure an adequate ventricular rate in the interim.
M Third-degree or complete heart block (Figure 11-19)
1. P waves are present, are similar in configuration to other P waves, but are unrelated to the QRS complexes.
2. PR interval is completely variable and of no consequence.
3. QRS complexes are normal in configuration and duration when block occurs at the AV node or bundle of His. QRS complexes are wide and aberrant when block occurs at the bundle branches.
4. PP and RR intervals are regular but are not equal to each other.
5. Atrial rate is typically 60 to 100/min; ventricular rate is typically 40 to 60/min with block at the AV node and <40/min with infranodal block.
6. Left alone it may progress to ventricular standstill. A permanent pacemaker is the treatment of choice to ensure adequate ventricular rate. Intravenous atropine, transcutaneous pacing, dopamine, epinephrine, and lastly transvenous pacing are used to ensure an adequate ventricular rate in the interim.
N Junctional or nodal rhythm (Figure 11-20)
1. P waves are typically absent; however, they may be conducted retrogradely and appear anywhere in the cardiac cycle.
2. PR interval is usually not measurable.
3. QRS is usually normal in duration and is similar in configuration to other QRS complexes.
4. PP interval usually not measurable. RR interval is regular.
5. Ventricular rate is typically 40 to 60/min.
6. This arrhythmia occurs with increased vagal tone to the SA node, hypoxemia, and/or digitalis toxicity. Atropine, dopamine, and epinephrine should be used to accelerate cardiac rate and maintain blood pressure. A transcutaneous pacemaker is indicated when pharmacologic intervention is either not effective or contraindicated.
O Supraventricular tachycardia (Figure 11-21)
1. P waves are usually indiscernible. They may be absent, conducted retrogradely, or buried in the preceding T wave.
2. PR interval cannot be measured.
3. QRS complex is normal in duration and similar in configuration to other QRS complexes.
4. PP interval is not measurable. RR interval is regular and equal to other RR intervals.
5. Rate is typically >150/min.
6. Intervention for the hemodynamically stable patient commonly includes vagal maneuvers, followed by intravenous adenosine administration to allow identification of the tachycardic source, underlying cause, and appropriate treatment. However, in the instance of hemodynamic compromise, synchronized DC countershock with sequentially increasing power (50, 100, 200, 300, and 360 J) is the treatment of choice.
P Premature ventricular contraction (PVC) (Figure 11-22)
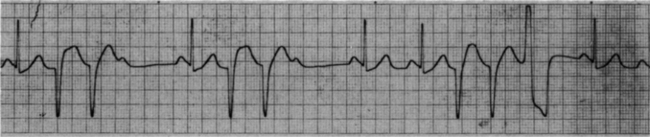
1. P waves are typically absent.
2. PR interval with PVC is not measurable.
3. QRS complex is wide (>0.12 second), bizarre, and unlike normal QRS complexes. It appears earlier in the cardiac cycle than expected and has a T wave on the opposite side of the baseline from the terminal portion of the QRS (PVC) complex.
4. PP interval with PVC is not measurable. RR interval varies with the occurrence of PVC.
5. PVCs can occur at any rate.
6. In the healthy heart no treatment is warranted. However, with impaired cardiac function, increased frequency, or multiform variations, treatment is indicated. PVCs may indicate acute myocardial ischemia requiring rapid intervention, including oxygen, nitroglycerin, or morphine. However, intravenous procainamide or lidocaine is the treatment of choice along with eventual identification and treatment of the underlying cause.
Q Ventricular tachycardia (Figure 11-23)
1. P waves are generally indiscernible.
2. PR interval is not measurable.
3. QRS complex is wide, bizarre, and generally similar in configuration to other QRS complexes.
4. PP interval is not measurable. RR interval is regular or slightly irregular.
5. Ventricular rate is 100 to 250/min.
6. Intravenous procainamide is the treatment of choice for the hemodynamically stable patient. For the hemodynamically unstable (with pulse) patient, synchronized DC cardioversion with sequentially increasing power (100, 200, 300, and 360 J) is indicated. In contrast, for the pulseless patient, a precordial thump is initiated if witnessed; support with cardiopulmonary resuscitation (CPR) until defibrillation can be implemented sequentially at progressively higher power (200 J, 200 to 300 J, and 360 J) and is successful.
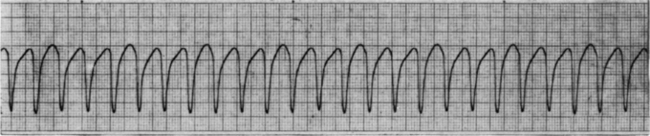
R Ventricular flutter (Figure 11-24)
3. QRS complex appears as a smooth sinusoidal wave with QRS complex and T waves merged and no clear separation of cardiac cycles.
4. PP interval is absent. RR interval is regular.
5. Ventricular rate is typically 200 to 300/min.
6. Initially support with CPR (if witnessed, initiate a precordial thump) until defibrillation can be implemented at progressively higher power (200 J, 200 to 300 J, and 360 J) and is successful.
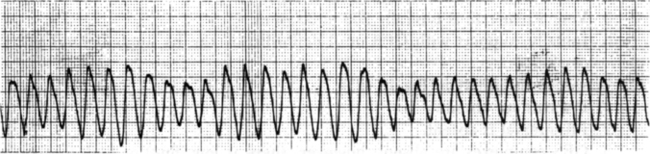
S Ventricular fibrillation (Figure 11-25)
3. QRS complexes are absent; however, there is low (fine) or high (coarse) amplitude undulation from the baseline that varies in shape and represents varying degrees of depolarization and repolarization.
4. PP and RR intervals are absent.
6. Treat with CPR (if witnessed, initiate a precordial thump) until defibrillation can be implemented at progressively higher power (200 J, 200 to 300 J, and 360 J) and is successful.
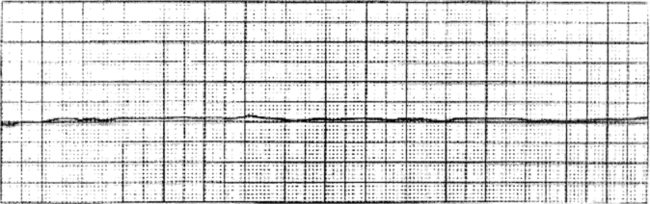
1. Represented by the total absence of electrical activity; however, there may be erratic undulations from baseline.
2. Treat with CPR, confirm true asystole (versus fine ventricular fibrillation) with second ECG lead, and then implement transcutaneous pacemaker and intravenous epinephrine and atropine.
[/level-membership-for-pulmolory-and-respiratory-category][not-level-membership-for-pulmolory-and-respiratory-category]
Cardiac Electrophysiology and ECG Interpretation
I The electric conduction system of the heart functions in the:
A Provision of electric excitation of the myocardial fibers without extrinsic stimuli (automaticity).
B Conduction of electric impulses through the myocardium.
C Organized distribution of the electric impulses to the myocardium in a repetitive, sequential fashion.
II Electroconduction System of the Heart (Figure 11-1)
1. The SA node is located in the right atrium just inferior and posterior to the entrance of the superior vena cava.
2. It is commonly referred to as the pacemaker of the heart, its primary function.
3. The SA node has an intrinsic rate of depolarization of 60 to 100/min.
4. The rate of depolarization ordinarily is under the control of the sympathetic and parasympathetic nervous systems.
a. Sympathetic stimulation of the SA node increases the rate of depolarization-positive chronotropism.
b. Parasympathetic stimulation of the SA node decreases the rate of depolarization-negative chronotropism.
5. The wave of depolarization initiated from the SA node travels outwardly through the atrial musculature in concentric circles, thus depolarizing the atria and ultimately the atrioventricular (AV) node.
6. For all practical purposes, the left and right atria depolarize simultaneously.
1. The AV node is located in the right atrium between the opening of the coronary sinus and interatrial septum.
2. Histologically it comprises cells identical to those of the SA node.
3. The function of the AV node is threefold:
a. Backup cardiac pacemaker because of its intrinsic depolarization rate of 40 to 60/min.
b. The only electrical bridge between atria and ventricles.
c. Responsible for delaying impulses from atria to ventricles.
4. The AV node becomes continuous with the common bundle branch (bundle of His) and is the only normal pathway for electric conduction between atria and ventricles. The fibroskeleton of the heart electrically separates atrial from ventricular muscle. The AV node and common bundle penetrate the cardiac fibroskeleton.
5. The tissue of the AV node slows the rate of electrical conduction and accounts for the time delay between atrial and ventricular depolarization. This time delay also allows optimal ventricular filling before ventricular contraction (systole).
6. The rate of conduction of electrical impulses through the AV node is under the control of the sympathetic and parasympathetic nervous systems.
1. It is also known as the AV bundle or bundle of His.
2. It is located on the right side of the interventricular septum and penetrates the right fibrous trigone.
a. To conduct impulses from the AV node to the left and right bundle branches.
b. To penetrate the fibroskeleton of the heart, electrically bridging the atrial conduction system to the ventricular conduction system.
4. The common bundle branch travels inferiorly in the interventricular septum for approximately 10 to 12 mm and then divides into one right and two left bundle branches.
D Right and left bundle branches
1. The right bundle branch appears simply as a continuation of the common bundle branch and follows an inferior course toward the apex of the heart.
2. The left bundle branch penetrates the interventricular septum and divides into an anterior and posterior left bundle branch. Both bundle branches course inferiorly on the left side of the interventricular septum.
3. The function of the three major bundle branches is to conduct electric impulses from the common bundle branch to the Purkinje fibers.
1. The Purkinje fibers are fine ramifications of the bundle branches, which terminate on the endocardial layer of the heart.
2. They are located throughout the entire endocardial layer of both ventricles and conduct the electrical impulses from the bundle branches to the ventricles. Depolarization of the ventricles begins when impulses leaving the Purkinje fibers invade the endocardial layer.
3. The wave of depolarization travels from the endocardial layer outward toward the epicardium and also from the apex toward the base of the ventricles.
F Summary of pathway of normal electrical conduction
1. Impulses originate in the right atrium by spontaneous depolarization of the SA node.
2. Impulses are conducted through atrial muscle, which results in depolarization of right and left atria and AV node.
3. The impulse is delayed at the AV node and then conducted through the cardiac fibroskeleton by the AV node and common bundle branch.
4. The impulse is then conducted from the common bundle branch through the right and left bundle branches to the Purkinje fibers.
5. The impulses exit the Purkinje fibers and cause depolarization of the ventricle from inside out and from apex to base.
6. Design of the electrical conduction system of the heart allows simultaneous depolarization of the right and left atria totally separate from simultaneous depolarization of the right and left ventricles. This fact has important implications for the mechanical function of the heart (Figure 11-2).
A Electrocardiography (ECG) provides a graphic display of current generated by the heart at the surface of the body. It depicts depolarization and repolarization of atria and ventricles.
B ECG is used to assess the electrical activity of the heart and should be clearly delineated from the mechanical activity of the heart. However, the electrical activity possesses significant potential implications in the mechanical activity of the heart.
C Each portion of the cardiac cycle generates a specific type of electrical impulse. These impulses are repetitious and produce characteristic patterns on an ECG recording.
D The four major electrical cardiac events are atrial depolarization, atrial repolarization, ventricular depolarization, and ventricular repolarization.
1. The polarized state is the normal resting state of cardiac muscle fiber. The extracellular charge is positive with respect to the intracellular charge (Figure 11-3, A).
2. Depolarization is the process of reversing the normal state of polarity. Thus depolarization causes the extracellular charge to be negative with respect to the intracellular charge. This is largely because inflow of extracellular sodium ions is faster than outflow of intracellular potassium ions. Reversal of the cellular membrane charge is transmitted along cardiac muscle fiber, depolarizing subsequent fibers (see Figure 11-3, B). If the muscle fibers are normal, this electrochemical stimulation results in mechanical activity (e.g., shortening of muscle fibers and cardiac contraction).
3. Repolarization is the process of reestablishing the normal state of polarity (i.e., reestablishing a positive extracellular charge with respect to the intracellular charge). The reestablishment of the resting cellular membrane charge is transmitted along the cardiac muscle fiber, repolarizing subsequent fibers (see Figure 11-3, C). If muscle fibers are normal, this electrochemical stimulation results in lengthening of muscle fibers and cardiac relaxation. (Note: It is a mistake to assume that the mechanical activity of the heart is normal simply because the electric activity [ECG] is normal.)
E The electric deflections of the ECG in normal sequence are P wave, QRS complex, and T wave when measured by electrodes with specific polarities placed in standardized positions on the chest and limbs (Figure 11-4).
1. The P wave is produced by atrial depolarization and normally is 0.06 to 0.11 second in duration.
2. The QRS complex is produced by ventricular depolarization and normally is 0.03 to 0.12 second in duration. Repolarization of the atria occurs simultaneously with ventricular depolarization and is masked by the overwhelming electric event of the QRS complex.
3. The T wave is produced by ventricular repolarization and normally is 0.14 to 0.26 second in duration.
1. PR interval: Time from the beginning of atrial depolarization to the beginning of ventricular depolarization. The PR interval normally is 0.12 to 0.20 second in duration.
2. RR interval: Time from the peak of one QRS complex to the next QRS complex. It is used to measure the total cardiac cycle and normally is 0.6 to 1.0 second in duration.
3. PP interval: Time from the beginning of one P wave to the beginning of the next P wave. It can be used to measure the total cardiac cycle time and hence the cardiac rate. It is normally equal to the RR interval (0.6 to 1.0 second in duration).
G Summary of normal time values for ECG events (Table 11-1)
TABLE 11-1
Normal Time Values for Electrocardiographic (ECG) Events
| ECG Event | Time |
| P wave | 0.06-0.11 second |
| PR interval | 0.12-0.20 second |
| QRS complex | 0.03-0.12 second |
| T wave | 0.14-0.26 second |
| PP/RR intervals | 0.60-1.00 second |
H Standard leads for measuring/monitoring ECG events
1. The three standard limb leads are lead I, lead II, and lead III (Figure 11-5).
a. Lead I has the negative (−) electrode on the right arm and the positive (+) electrode on the left arm.
b. Lead II has the negative (−) electrode on the right arm and the positive (+) electrode on the left leg.
c. Lead III has the (−) electrode on the left arm and the positive (+) electrode on the left leg.
d. The three standard limb leads comprise Einthoven’s triangle and measure the electrical activity of the heart from three different orientations each in the coronal (plane) dimension.
2. The six standard unipolar precordial leads are V1, V2, V3, V4, V5, and V6, where the V represents voltage and each of the numbers 1 through 6 designates a standard position on the chest of the positive (+) electrode (Figure 11-6).
a. The V1 lead has the positive electrode placed at the right sternal margin and the fourth intercostal space.
b. Successive positioning for V2 through V6 is located laterally left all at the same transverse level, with V6 being positioned at the left midaxillary line.
c. The six precordial leads measure the electrical activity of the heart from six different orientations each in the transverse (plane) dimension.
3. Therefore the same consistently generated electrical activity of the heart will be depicted graphically differently for each lead (Figure 11-7).
4. The standard monitoring lead for acutely ill patients is typically a modified lead II position with the electrodes moved onto the chest and somewhat arbitrarily placed to generate the clearest, consistent representation of ECG events (see Figure 11-5, insert).
5. There are three more unipolar extremity leads, VR,, VL, and VF, which along with the aforementioned nine standard leads comprise the diagnostic 12-lead ECG. Each of the VR, VL
[/not-level-membership-for-pulmolory-and-respiratory-category]
