[level-membership-for-cardiovascular-category]
1 Cardiac Electrical Stimulation
 Concepts Related to Electrical Stimulation of the Heart

 with ε being the permittivity of free space. According to Coulomb’s law, the force attracting or repelling charged objects increases with the magnitude of charge and decreases with the square of the distance that separates them.


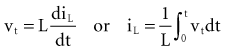
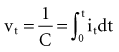
 is the net area under the instantaneous current-versus-time plot.
Inductance
Note that the voltage across the inductor is directly proportional to the rate of change of current flowing through the inductor. Cell membrane currents have some of the current- and voltage-versus-time characteristics of an inductance in parallel with a capacitance.1 These inductance-like effects are related to the timing and magnitude of potassium ions moving into and out of the cell.2
Reactance (Capacitance and Inductance)
For reactive elements connected in series, net reactance is the scalar sum of inductive reactance (positive in the mathematical complex plane) and capacitive reactance (negative in complex plane). Pure reactance values depend on the rates of change of current and voltage, whereas pure resistance values do not. Phenomena of this type are caused by differences in the timing of the peaks (phase angles) of the voltages or currents in the various reactive components. These reactive effects can be important in biventricular pacing threshold measurements (see later discussion). The component of reactance that is most relevant to both pacing electrodes and cell membranes is capacitance, with inductance being much less important. For example, the cardiac action potential spreading throughout the heart generates a changing magnetic field that transiently stores a very small amount of energy. However, the changing magnetic field generated by spread of the action potential is so small that it is not clinically significant except in the research setting.3
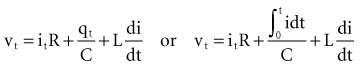
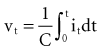
(remembering that  and that the voltage across a capacitor at time t is
  ).
).
 , that has accumulated in the capacitor from time 0 to the instantaneous time t. The equations show that the capacitance effect on the voltage decreases as the capacitance increases. This has clinical relevance in that, for example, the polarization voltage that interferes with autosensing pulse generators decreases as the electrode capacitance increases.
 Cellular Aspects of Myocardial Stimulation
Cell Membrane Characteristics
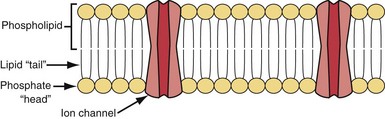
Cell membrane characteristics are major determinants of tissue excitability. The membrane of the cardiac myocyte is composed principally of phospholipids, cholesterol, and proteins.4 The membrane phospholipids have a charged polar headgroup and two long hydrocarbon chains arranged as shown in Figure 1-1. The cell membrane comprises two layers of phospholipids with their hydrophobic aliphatic chains oriented toward the central portion of the bilayer membrane and their polar headgroup regions toward the outside boundaries of the membrane. Because the membrane is composed of two layers of phospholipids, the polar regions of the phospholipid molecules interface with the aqueous environments inside and outside the cell. The lipid-soluble hydrocarbon chains are forced away from the aqueous phase to form a nonpolar interior.
Determinants of the Resting Transmembrane Potential
Relatively large gradients of individual ion concentrations exist across the cardiac cell membrane.5 The gradient of sodium ions (Na+) across the membrane is approximately 145 millimoles per liter (mmol/L) outside to 10 mmol/L inside. In contrast, the potassium ion (K+) concentration outside the cell is approximately 4.5 mmol/L, whereas the inside concentration is 140 mmol/L. In the absence of a cell membrane, both Na+ and K+ would rapidly move in a direction determined by the concentration gradient. The diffusion force tending to move K+ out of and Na+ into the cell is proportional to the concentration gradients of those ions. The potential energy attributable to the diffusion force (PEd) tending to move K+ out of the cell is given by the following equation:
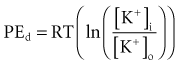

where z here is the valence (the number of positive or negative electrical charges) of the ion, F is the Faraday constant (96,500 coulombs/equivalent), and Vm is the transmembrane potential difference (transmembrane voltage, measured in millivolts). During equilibrium, the total of the potential energies from diffusion and electric forces is zero, and no net ionic movement occurs. Therefore, the sum of Equation 1-1 and Equation 1-2 may be set to zero. This yields the Nernst equation, which describes (in measurable electrical units) the potential that must exist for a single ionic species, here K+, to be in equilibrium across the membrane of a resting cardiac cell:
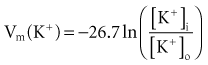
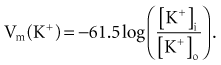
Using known values for extracellular K+, Vm(K+) = −90 mV. When Equation 1-3 is solved using Na+ concentrations, a Vm(Na+) of +50 mV is obtained. Therefore, it is the equilibrium potential for potassium ion (not sodium ion) that is the major factor responsible for the resting transmembrane potential. This suggests that the resting membrane is more permeable to K+ than to Na+.
To calculate the transmembrane potential when multiple ionic species exist in different concentrations across the membrane, the Goldman constant field equation (modified by Hodgkin and Katz6) is used:
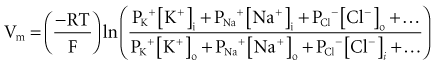
where PK+, PNa+, and PCl− are the cell membrane permeabilities for the respective ions. At physiologic concentrations, this equation yields a transmembrane potential of −90 mV (the equilibrium potential for K+). Equation 1-4 describes how resting potentials vary as sodium and potassium ion concentrations are changed. Because there is a passive leak of charged ions through the membrane, the resting potential would not exist at the level of −90 mV unless it were actively maintained. This is accomplished by two active transport mechanisms that exchange Na+ ions for K+ and calcium (Ca2+) ions.
 Ion Channels
Protein molecules embedded within the cell membrane have numerous functions, including those of being ion channels and signal transducers. The concept of ion channels was proposed in the 1950s by Hodgkin and Huxley.7 However, it was not until the introduction of the patch clamp technique by Neher and Sakmann in 1976 that the properties of these channels could be directly studied.8,9 There are two basic types of ion channels, distinguished by the factors that control opening and closing of the channel. Ion channels at muscle fiber end plates are chemically gated by specific transmitters. The opening of these channels is triggered by the binding of acetylcholine, and their closing is induced by its unbinding. In neuronal axons, conduction is mediated by faster, voltage-gated channels. These channels respond to differences in electric potential between the inside and outside of the cell, across the membrane. Voltage-gated channels for sodium, potassium, and calcium appear to operate in similar ways, sharing many of the same structural features. In addition, each type of channel can be subdivided into several subtypes with different conductance or gating properties (Fig. 1-2).
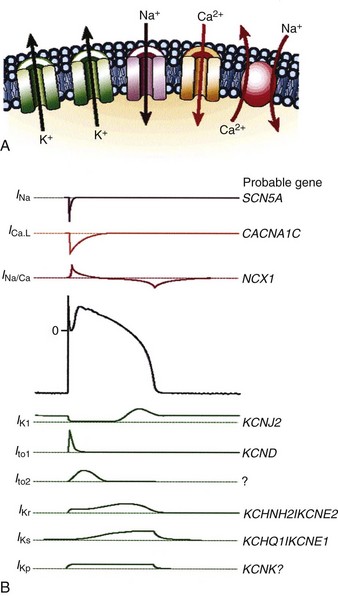
Figure 1-2 Ion channels underlie cardiac excitability.
(From Marban E: Cardiac channelopathies. Nature 415:213-218, 2002. ©Nature Publishing Group, http://www.nature.com.)
Voltage-Gated Channels
Voltage-gated channels open in response to an applied electric potential. The source of this voltage can be an action potential propagated from an adjacent cell or the electric field of an artificial pacemaker electrode. If depolarization of the membrane exceeds a threshold voltage, an action potential is triggered, resulting in a complex cascade of ionic currents flowing across the membrane into and out of the cell. As a result of this flow of charge across the membrane, the potential gradient across the membrane changes in a characteristic pattern of events that produce the cardiac action potential (Fig. 1-3).
Selective membrane-bound proteins (ion channels) determine the passive transmembrane flux of an individual ion species. The transmembrane currents determine or influence cellular polarization at rest, action potential depolarization and repolarization, conduction, excitation-contraction coupling, and myofibril contraction. The channels that regulate transmembrane conductance of Na+ and Ca2+ are voltage gated. The sodium channel is a large protein molecule composed of approximately 1830 amino acids.10 It contains four internally homologous repeating domains, believed to be arranged around a central water-filled pore lined with hydrophilic (“water-loving”) amino acids. It is estimated that there are 5 to 10 Na+ channels per square micrometer (µm2) of cell membrane. When an alteration changes the membrane potential to about −70 to −60 mV (the threshold potential), four to six positively charged amino acids move across the membrane in response to the change in electric field. This causes a change in the conformations of the channel proteins, resulting in opening of the channel. After a single Na+ channel changes to the open conformation, about 104 Na+ ions enter the cell. On depolarization of the membrane, the Na+ channels remain open for less than 1 millisecond (msec). After rapid depolarization of the membrane, the Na+ channel again changes to the closed conformation. In addition to the Na+ channel, specialized proteins are suspended in the cell membrane that have differential selectivity for K+, Ca2+, and Cl− ions, with much different time constants for activation and inactivation.
Sinoatrial and Atrioventricular Nodal Cells
In these nodal structures, depolarization is primarily mediated by inward Ca2+ conductance through specialized Ca2+ channels. There are two types of Ca2+ channels in the mammalian heart. The L-type channels are the major voltage-gated pathway for entry of Ca2+ into the myocyte, and they are heavily modulated by catecholamines.11 The T-type channels contribute to spontaneous depolarization of the cell associated with automaticity (pacemaker currents). The pore of the Ca2+ channel has a functional diameter of about 0.6 nanometers (nm), larger than that of the Na+ channels (0.3-0.5 nm).12 The selectivity for Ca2+ is high, up to 10,000-fold greater than that for Na+ or K+. The key elements are high-affinity binding sites for Ca2+, positioned along a single file pore. “Elution” of a Ca2+ ion occurs when another Ca2+ ion enters and is selectively bound.
Maintenance of Resting Membrane Potential
The resting membrane potential is maintained by the pumping of Na+ ions out of the cell and K+ ions into the cell. The Na+,K+—adenosine triphosphatase (ATPase) pump moves three Na+ ions out of the cell in exchange for two K+ ions moved into the cell.13–15 The basic unit of the Na+,K+-ATPase protein (pump) consists of one alpha (α-) and one beta (β-) subunit. The α-subunit is large (1016 amino acids) and spans the entire membrane, whereas the β-subunit is a smaller glycoprotein. There appear to be about 1000 pump sites/µm2 of cardiac cell membrane. The fully activated pump cycles about 50 to 70 times per second (interval of 15-20 msec/cycle). Similarly, the Na+-Ca2+ pump moves three Na+ ions out of the cell in exchange for one Ca2+ ion.16,17 Therefore, both transport mechanisms result in the net movement of one positive charge out of the cell, polarizing the membrane and maintaining a negatively charged interior. The function of both exchange mechanisms depends on the expenditure of energy in the form of high-energy phosphates and is susceptible to interruptions in aerobic cellular metabolism (e.g., during ischemia).
The Cardiac Action Potential
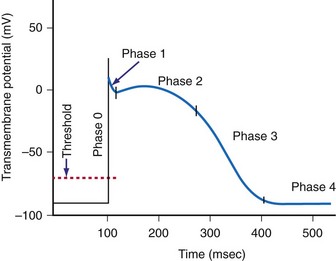
When the voltage gradient across the membrane of a myocyte decreases so that the inside of the cell becomes less negatively charged with respect to the outside of the cell, a critical transmembrane voltage difference is reached, the threshold voltage. At threshold, the cell membrane suddenly undergoes a further depolarization that is out of proportion to the intensity of the applied stimulus. This abrupt change in the potential across the membrane is the start of a cascade of inward and outward currents that together are known as an action potential.18
The cardiac action potential is an enormously complex event and consists of five phases19 (see Fig. 1-3): phase 0, the upstroke phase of rapid depolarization; phase 1, the overshoot phase of initial rapid repolarization; phase 2, the plateau phase; phase 3, the rapid repolarization phase; and phase 4, characterized by a slow, spontaneous depolarization of the membrane in cells with spontaneous pacemaker activity, until the threshold potential is again reached and a new action potential is generated.
Phase 1: Initial Repolarization
After voltage-dependent activation of the Na+ current in phase 0, the membrane potential rapidly changes from negative to positive. The increased conductance of Na+ is rapidly followed by voltage-dependent inactivation. Phase 1 is characterized by the transient outward K+ current (IKto). The outward movement of K+ is a major contributor to the various repolarization phases. It is complex and has a number of discrete pathways.20,21 Most K+ currents demonstrate rectification, that is, decreased K+ conductance with depolarization. The K+ currents include the instantaneous inward rectifier K+ current, the outward (delayed) rectifier K+ current, the transient outward currents, and ATP-, Na+-, and acetylcholine-regulated K+ currents. The initial repolarization, however, is mainly the result of activation of a transient outward K+ current and inactivation of the fast inward Na+ current.22 The transient outward K+ current has two components, one voltage gated and the other activated by a local rise in Ca2+.
Phase 2: Plateau
The net current during the plateau phase is apparently small, although the individual currents (inward Na+ and Ca2+ and outward K+) are each about an order of magnitude larger.23 Among the inward currents are the slowly activating Na+ current, a Ca2+ current, and an Na+-Ca2+ exchange current. Outward currents include a slowly activating K+ current (IKs), a Cl− current, a more rapidly activating K+ current (IKr), an ultra-rapidly activating K+ current (IKur), and the Na+-K+ electrogenic pump. During phase 2 of the action potential, the absolute refractory period, the cardiac cell cannot be excited by an electrical stimulus, regardless of its intensity.
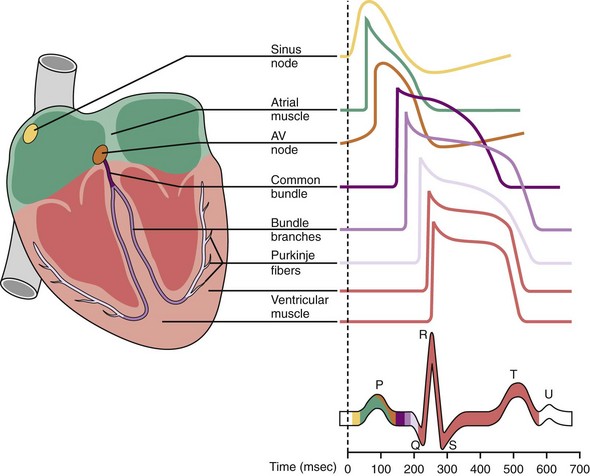
Phase 4: Automaticity and the Conduction System
Automaticity is the property of certain cells by which they are able to initiate an action potential spontaneously. It has been known for centuries that the heart can exhibit spontaneous contraction even when completely denervated. Leonardo da Vinci observed that the heart could “move by itself.”24 William Harvey reported that pieces of the heart could “contract and relax” separately.25 Many cells within the specialized conduction system have the potential for automaticity.
Normally, depolarization is initiated at the SA node.26,27 Figure 1-4 shows action potentials from different types of cardiac cells.28 Rather than maintaining a stable resting membrane potential, the repolarization of the action potential is followed by a slow depolarization from about −71 to −54 mV, the threshold required to initiate another action potential. This slow, spontaneous depolarization drives cardiac automaticity and is related to a specialized current (If). In the case of AV nodal cells, the fast upstroke is carried predominantly by an inward Ca2+ current. Repolarization is caused by delayed activation of the K+ current. The balance of inward and outward currents determines the net “pacemaker” current and is finely regulated by both adrenergic and cholinergic neurotransmitters. In the presence of AV block or abnormal SA nodal function, AV junctional cells in the region of the proximal penetrating bundle usually assume the role of pacemaker at rates slower than that of the sinus node. In the absence of disease in the AV junction, the escape rhythm occurs with a frequency that is about 67% of the sinus rate.29
 Artificial Electrical Stimulation of Cardiac Tissue
Artificial lipid membranes in their pure form are electrical insulators. The myocyte cell membrane (sarcolemma) is much more complicated. Specialized protein molecules in the membrane allow it to be conductive.30,31 These proteins, either singly or in certain groupings, form channels that open and close for transport of specific ions through the membrane in response to particular stimuli. The channel proteins are the end stages of processes that provide both active and passive transport of ions and molecules through the membrane.
The effect of the stimulus is to change the transmembrane voltage of nearby myocytes sufficiently so that depolarization begins in and spreads from these myocyte membranes. Propagation of the stimulus to nearby myocytes occurs because the local transmembrane depolarization changes the voltage gradient across adjacent membranes sufficiently to trigger depolarization of those membranes. To cause an action potential to spread throughout the whole heart, an electrical pulse must stimulate a minimum of approximately 50 closely coupled cardiac cells.5 The result is a self-regenerating action potential that progresses in a wavelike, relatively slow manner beyond the local effect of the pacemaker stimulus. Away from immediate vicinity of the electrode, transmission of depolarization and its velocity depend in part on the resistance and capacitance properties of the membrane, on the opening and closing of ion channels, and on ion flows through the sarcolemma.
Myocardial Cell Electrical Properties
A single Purkinje fiber typically has an internal resistance that is two to three times greater than that of blood. The specific membrane resistance of a Purkinje fiber is on the order of 104 ohms–square centimeter (Ω-cm2). The time constant of the surface membrane is on the order of 10 msec, and the membrane capacity is about 1 microfaraday (µF)/cm2. Gap junctions are intercellular channels that provide a pathway for electrical communication between myocytes. Their diameter is about 2 nm and length about 12 nm. Gap conductance is voltage sensitive.32 Under pathologic conditions, such as severe hypoxia or ischemia, gap junctions will not function normally.
Single-Cell Excitation by Electrical Stimulus
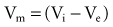
In reality, an applied external electrical stimulus initiates cardiac excitation as a result of passive effects on the transmembrane potential. This is a result of a change in potential that is induced in the extracellular space. Because of the relatively high impedance between cells across the membrane and through the gap junctions compared with the lower impedance path through the extracellular space, relatively small amounts of current pass through the cell membrane. When an external stimulus is applied, the potential within the intracellular space does not vary appreciably over the length and width of a cardiac myocyte (Fig. 1-5). However, near the stimulating electrode, the extracellular stimulus causes a field gradient to develop in the extracellular space. The transmembrane voltage (Vm) is equal to the difference in potential inside the cell (Vi) minus the potential outside the cell in the extracellular space (Ve), so a change in extracellular potential with little change in intracellular potential across the length of the cell results in a net difference in Vm. This is represented as follows:
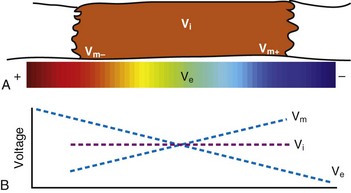
Figure 1-5 Response of a cardiomyocyte to electric field.
(From Dosdall DJ, Fast VG, Ideker RE: Mechanisms of defibrillation. Annu Rev Biomed Eng. 12:233-258, 2010.)
Current Density, Electric Field Gradient, and Propagation of Depolarization
There are two approaches to thinking about how an electrical stimulus induces a self-propagating wavefront of depolarization within myocardium. The current density approach considers the magnitude of current flowing through a given mass of myocardium between the stimulating electrodes and finds this to be the critical factor required to induce a regenerative wavefront of depolarization. From this point of view, the stimulation threshold is a function of current density (amperes/cm2) in the excitable myocardium underlying the electrode.33–36 The electric field approach holds that the critical factor affecting myocardial depolarization is the magnitude of the electric field gradient (volts/cm in viable tissue) that is induced in the myocardium beneath the stimulating electrode.37,38 These approaches are fundamentally the same in that there is a mathematical relationship between the electric field gradient and the current density at the stimulating electrode.


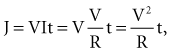
where Jt is the energy delivered (expressed in joules) from time zero to time t during the pulse, vt is the voltage, and it is the current at the electrode at instantaneous time t during the pulse. This equation indicates that the total energy delivered during the pulse is proportional to the area under a curve. The curve is formed in the vertical dimension by the instantaneous product of voltage and current applied to the electrode, and in the horizontal dimension by the time elapsing during the pulse. When the time t reaches the programmed pulse duration, the pulse ends. The area under the curve then represents the electrical energy transferred during the time span of the pulse. The equation can easily be solved in real time with a small digital computer, provided that continuous phasic measurements of the voltage and current in the wire going to the electrode are available. (Note that this equation has blood flow and pressure energy analogs.39)
The stimulation threshold of isolated cardiac myocytes depends on their orientation within an electric field. The threshold is lowest when the myocytes are oriented parallel to the field and highest when the axis of the myocytes is perpendicular to the field.40 It is clear that myocardial stimulation may be induced with anodal or cathodal stimulation, or both, although with somewhat different characteristics. Various investigators have used several different parameters to express stimulation threshold, including current (mA), potential (V), energy (J), charge (Q), pulse width (t, msec), and voltage multiplied by stimulus duration (V-sec).41–47 For the purposes of this chapter, the myocardial stimulation threshold for pacing is defined as the minimum stimulus amplitude at any given pulse width required to consistently achieve myocardial depolarization outside the heart’s refractory period.48 Stimulation thresholds measured with a constant-voltage (CV) generator are stated in volts, and those of a constant-current (CI) generator are stated in milliamperes (mA). Note that a true constant-voltage generator may yield a slightly different stimulation threshold than the pseudoconstant-voltage generators in ordinary use.
In contrast to cardiac pacing with direct production of only local depolarization and dependence on self-propagation of depolarization, defibrillation involves direct depolarization or hyperpolarization of a large portion of the heart. This is necessary to provide at least the minimum local voltage gradient required to produce depolarization over major portions of the myocardium. To do so requires a stimulus intensity that is much greater than that required for pacing49 (see Chapter 2 for a thorough discussion of defibrillation).
Electric Potential Gradients and Currents for Stimulation and Defibrillation
When the electric field exceeds approximately 1 V/cm in the extracellular space during diastole, myocardial stimulation (capture) results. The electric field must be achieved only in the area of several dozen cells and may be achieved typically with less than 0.5 mA. When the electric field strength is increased to 6 V/cm, ventricular fibrillation may occur if the stimulus is applied during the vulnerable period (approximately the peak of the T wave). An area where the voltage gradient is at least 6 V/cm must be achieved at a distance of 1 cm from the electrode. To accomplish this, a current of approximately 20 mA is required to initiate ventricular fibrillation. This same field strength (6 V/cm) is also required to interrupt ventricular fibrillation (defibrillation). However, defibrillation requires the minimum field intensity to be approximately 6 V/cm at almost all points in the myocardium. In order to achieve this minimum electric field gradient at the same instant over the entire heart, a very large shock current, typically more than 10 A, must be applied. This current is thousands of times greater than the current required for pacing.49
Virtual Electrode Effect
Virtual electrodes are important because they can serve as sites that initiate or prevent depolarization of myocytes.50 Newton and Knisley51 defined virtual electrodes as “experimentally observed regions of large delta Vm that arise distant from the stimulating electrode.” “Delta Vm” (ΔVm) here represents the change in voltage difference across the myocyte membrane during application of the stimulation current.
A virtual electrode can be described as a collection of charge predominately of one sign at a site away from a regular electrode. If, in an electrically neutral solution, ions of one charge sign are moved away by an electric field, a relative excess of ions of the other charge sign will be left or will move in the opposite direction. For example, if the regular electrode is paced with a negative-going stimulus, a site elsewhere in the tissue (i.e., not at this physical electrode) may become transiently positive and alter the transmembrane potentials of cells at that site.52–55 In cardiac tissue, a virtual electrode can occur as an effect of anisotropy after a defibrillation shock and can initiate refibrillation. A virtual electrode may also result from ion redistribution patterns in a nonanisotropic medium. In anisotropic tissue, charge redistribution produced by a physical electrode can have a “dog bone” shape.56
The virtual electrodes occur at sites where ions flow into or out of cells by crossing the cell membrane. An applied unipolar stimulation current flows into some cells while simultaneously flowing out of others, thus producing negative and positive virtual electrodes at different locations. In an anisotropic medium, a cathodal pulse produces a virtual electrode with a dog bone shape oriented perpendicular to cardiac fibers and containing a large ΔVm, and a pair of virtual electrodes containing negative ΔVm at locations along the fibers. Theoretical models have shown that this effect can be attributed to unequal tissue anisotropy in the intracellular and extracellular spaces; that is, intracellular current at a given location favors the longitudinal direction 10 to 1, whereas extracellular current favors the longitudinal direction only 3 to 1 (Knisley, personal communication, 2005). Knisley and Pollard57 studied the effects of electrode-myocardial separation on cardiac stimulation of rabbit hearts in conductive solution. The electrode-myocardial separation altered the spatial distribution of ΔVm and increased the pacing threshold.
In regard to electrode-myocardial tissue separation, Shepard et al.,58 during 1980s transthoracic defibrillator implantation procedures, sewed the electrodes used for rate sensing onto the outer surface of the pericardium. Sensing voltages were normal. Pacing thresholds of these electrodes measured were high (3.7 ± 1.9 mA and 4.5 ± 2.19 V at 0.5-msec stimulus duration), as would be expected both from current density considerations and from Knisley’s findings. The initial impedance was 1209 ± 383 Ω, and the chronic impedance was 1550 ± 358 Ω at a median follow-up time of 964 days. The thresholds had by then decreased to 3.8 ± 2.07 V and 2.7 ± 1.8 mA. The transpericardial distance from underlying myocardium did result in high initial pacing thresholds (and in the special distribution of ΔVm near the electrodes). However, the long-term tissue reaction of pericardium and underlying myocardium to the presence of these electrodes was not detrimental in terms of threshold evolution.
Virtual electrodes normally exist near an electrode when a pacing pulse is applied. Nikolski and Sambelashvili,59 studying Langendorff-perfused rabbit hearts, found that stimuli of magnitude five times threshold produced “make” or stimulus-onset excitation from virtual cathodes, whereas near-threshold stimuli produced “break” or stimulus-termination excitation from virtual anodes.
In studying how cardiac tissue damage at an electrode results in a pacing threshold increase, Sambelashvili et al.60 found that the virtual electrode effect was destroyed by very strong (40 mA, 4 msec, biphasic, 240/min) pacing pulses applied for 5 minutes. Fluorescent optical mapping showed that decrease or loss of the virtual electrode polarization was associated with pacing threshold increase. Propidium iodide staining showed tissue damage within an area about 1 mm in diameter surrounding the electrode.
Anodal and Cathodal Stimulation
Cathode make excitation occurs adjacent to a cathode from the high current density immediately surrounding the electrode. Current flows in the extracellular space and causes hyperpolarization and depolarization of opposite ends of the cell, as shown in Figure 1-5. Current also passes through the cell membrane and causes an increase in Vm that exceeds the threshold for fast Na+ channels to activate. Excitation spreads outward from the central excitation site in an elliptical shape because of tissue anisotropy (Fig. 1-6). Cathode make occurs on the rising edge of the stimulation pulse (Fig. 1-7, A).
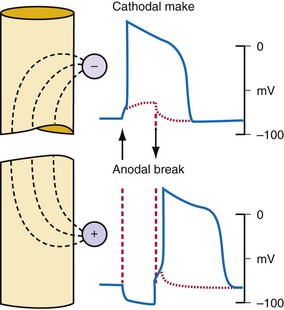
Figure 1-6 Action potentials are initiated by cathodal and anodal excitation.
(From Antoni H: Electrical properties of the heart. In Reilly JP, editor: Applied bioelectricity: from electrical stimulation to electropathology. New York, 1998, Springer, p 160.)
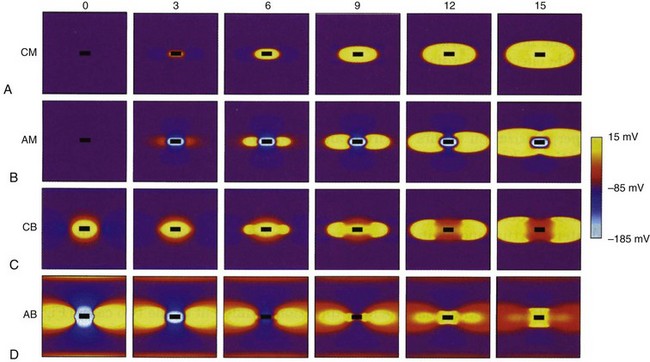
Figure 1-7 Computer simulation of four types of excitation with stimulating electrode (black rectangle).
(From Wikswo JP, Roth BJ: Virtual electrode theory and pacing. In Efimov IR, Kroll MW, Tchou PJ, editors: Cardiac bioelectric therapy: mechanisms and practical implications. New York, 2009, Springer Science, pp 283-330.)
An anode tends to hyperpolarize cells immediately adjacent to the electrode, but virtual cathodes form on both sides of the central anode. Anode make excitation causes activation to spread on both sides of the central hyperpolarized region until the excitation merges into a single wavefront and spreads elliptically (Fig. 1-7, B). The threshold for stimulation with cathode make is typically higher than for anode make because the virtual cathodes that form at a distance from the central anode are weaker and have less depolarizing power than the direct effects of a central cathode.
Cathode break excitation occurs when the stimulating pulse is turned off (Fig. 1-7, C). While the stimulation pulse is turned on, the tissue under the stimulating electrode is depolarized, and the fast Na+ channels open and then become unexcitable. Propagation of the excitation is repressed somewhat by the virtual anodes on either side. On termination of the stimulating pulse, the virtual anodes disappear, and excitation spreads from the active tissue under the electrode to the hyperpolarized regions under the virtual anodes. Because the tissue under the virtual anodes was hyperpolarized, the Na+ channels are fully excitable, and the excitation wavefront spreads rapidly through the area previously covered by virtual anodes. Cathode make occurs at a lower threshold than cathode break and is not observed unless tissue is refractory when the stimulation pulse commences but becomes excitable during the pulse. If the tissue has recovered by the time the pulse turns off, cathode break may occur.
If the tissue is unexcitable surrounding an anode at the beginning of a stimulation pulse, anode break excitation may result from a mechanism similar to that of cathode break. Excitation may be initiated by the termination of the excitation pulse (Fig. 1-7). Hyperpolarization directly below the anode causes the Na+ channels to become excitable. Depolarization from the virtual cathodes then rapidly propagates into the hyperpolarized region under the anode (Fig. 1-7, D). The virtual cathodes are relatively weak compared to the hyperpolarizing effect of the anode, but the activation spreads from the depolarized region into the hyperpolarized region because the cell membrane has a nonlinear response by which hyperpolarization decays more rapidly than does depolarization. Because anode break relies on virtual cathodes to initiate excitation in recently recovered tissue, however, this mechanism of excitation has the highest threshold of all, the make or break excitation mechanisms.
Anode and cathode make and break phenomenon have been detected in computer models and verified in animal experiments.54,61 Optical mapping techniques with voltage-sensitive dye have been particularly useful in illuminating these mechanisms of stimulation.
 Strength-Duration Relationships
Chronaxie, Rheobase, Energy, and Pulse Duration Thresholds
The intensity of an electrical stimulus (measured in volts or milliamperes) that is required to capture the atrial or ventricular myocardium depends on the duration of the stimulus.62,63 The historical background and the relations between the various electrical factors have been reviewed, further studied, and clearly stated by Blair,64 and by Geddes65 for electrode-electrolyte interface function and models.
The interaction of stimulus amplitude and stimulus duration (pulse width) defines the strength-duration curve (Fig. 1-8). Lapique described this exponential relationship of stimulus intensity (current), I, and pulse duration, t, as follows:

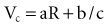
In 1892, Hoorweg66 used a voltage source, a galvanometer, and low-leakage capacitors to conduct quantitative stimulation studies. He found that the voltage at which a capacitor must be charged to cause depolarization of nerves and muscles is an inverse function of the capacitance of the capacitor, as follows:

In 1901, Weiss67 reported that the threshold charge required for stimulation increases linearly with stimulus duration. He called this relationship the “formule fondamentale.” If I represents the magnitude of the current, t is the stimulus duration, and a and b are constants determined by analyzing the data, Weiss found that:
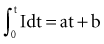
 = Q, the charge in the capacitor at threshold stimulus duration t, Q = at + b. For a constant-current stimulus, this can be stated in words as threshold charge requirement = a amperes times t seconds + b, where b is a constant with dimensional units of ampere-seconds. The values of the constants a and b vary with the tissue tested.
The left-hand side of Equation 1-7 indicates that the charge delivered into the electrode is, for a constant current, the magnitude of the current multiplied by the duration of the current. The right-hand side states that the charge required to stimulate at threshold is a minimum of b ampere-seconds plus the product of the current level a and the stimulus duration t. Weiss67 noted that, for various stimulus durations tested, the quantity of charge required to initiate depolarization remained constant.
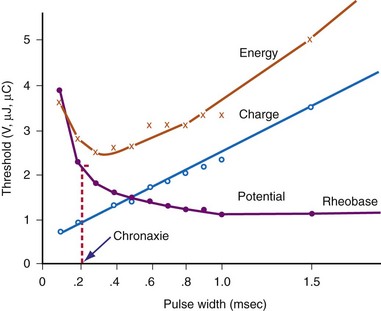
The statement that the threshold charge requirement does not change with stimulus duration is true only within a limited range. The limitation leads to the concept of rheobase, as stated in 1909 by Lapique;68 when pulse duration is increased beyond a limited range, the current requirement does not decrease further. The charge delivered continues to increase as pulse duration is increased. Lapique called this minimum current the rheobase, or the lowest stimulus current that continues to capture the heart when the stimulus duration is made extremely long. In this situation, further increases in stimulus duration no longer reduce the magnitude of current required to stimulate the heart.
Note from Equation 1-7 that the ratio a/b has the dimensions/amperes divided by (ampere-seconds); this expression reduces in dimensions to the reciprocal of the stimulus duration. Lapique called the time seen in the a/b ratio the chronaxie, specified in seconds. Chronaxie time experimentally turns out to be approximately the threshold pulse duration at twice rheobase amplitude, and it has become defined as such; this is illustrated in Figure 1-8. Note again that rheobase is specified in terms of current, and chronaxie is specified in terms of time.
Lapique69 determined that stimulation at the chronaxie pulse width approaches the minimum threshold energy. Therefore, the two most important reference points on a current or voltage strength-duration curve are rheobase and chronaxie. Obtaining a true rheobase typically requires pulse widths of 10 msec or greater. For clinical purposes, rheobase can be approximately measured at pulse widths of 1.5 to 2 msec. The value obtained may be slightly greater than the true rheobase. Therefore, the chronaxie stimulus duration obtained by setting the stimulus current at twice the approximate rheobase current and then finding the minimum stimulus duration that will result in capture is slightly low. In a time-saving, useful, and reasonable clinical sense, one may empirically set the stimulus duration at a value determined from experience, such as 0.4 to 0.5 msec and then determine the current and voltage thresholds. Safety factor allowances of current and voltage are then added or subtracted based on the patient’s current and projected clinical status (see later discussion).
The goal is to find the combination of pacing threshold stimulus current, voltage, and pulse width that results in minimal charge drain from the pulse generator battery at normal pulse rates. Figure 1-8 shows that, for capture to be accomplished, the least charge was required at the shortest pulse duration (0.1 msec in the figure), but the least energy was required at about 0.3-msec stimulus duration. A very short pulse duration puts thresholds close to the steeply ascending limb of the voltage or current curve, where slight fluctuations can risk loss of capture. For this reason, Irnich70,71 recommended that chronaxie, or the pulse duration slightly to the left of chronaxie, is the most efficient pulse duration for both pacing and defibrillation. In most cases, the pulse duration at chronaxie or slightly greater appears to represent the best overall compromise between adequate safety and generator longevity. One also considers the expected stability or instability of the patient’s status, patient compliance, and follow-up arrangements, both short and long term.
Pacing thresholds can also be specified in terms of only energy (microjoules, µJ) or only pulse duration (milliseconds). However, reliance on specifications in either of these units alone can be misleading. Doing so discounts that, regardless of the pulse duration or energy used, the heart cannot be stimulated unless the stimulus amplitude exceeds the rheobase current.72
For example, if rheobase is achieved with a pulse amplitude of 0.5 V and 10 msec, the pulse at this point on the strength-duration curve will have 5 µJ of energy (current × voltage × time) with a 500-Ω lead (1 mA × 0.5 V × 10 msec = 5 µJ). A 0.4-V, 20-msec pulse on a 500-Ω lead has 6.4 µJ of energy (28% greater than the “threshold” energy at 10 msec) but will not result in cardiac capture. Increasing the pulse duration to 100 msec at 0.4 V results in 32 µJ of energy (540% greater than “threshold” energy at 10 msec) but will still not capture the heart, for the same reason. No matter how far the pulse duration is extended (with increased energy), the myocardium will not be captured unless the stimulus amplitude is at least as great as the rheobase value. Therefore, calculation of the energy threshold at very long pulse durations does not provide clinically useful information.73
Coates and Thwaites74 studied the strength-duration curve in 229 patients with 325 leads. The mean atrial chronaxie (n = 101) was 0.24 ± 0.07 msec, and the mean ventricular chronaxie (n = 224) was 0.25 ± 0.07 msec. Mean atrial and ventricular rheobase values were 0.51 ± 0.2 V and 0.35 ± 0.14 V, respectively. Because the pulse generators were set at factory-nominal pulse durations of 0.45 to 0.50 msec, the authors concluded that pacing was suboptimal from the efficiency point of view. They pointed out that battery drain would be reduced by programming pulse duration to the chronaxie value and then programming the voltage to double the chronaxie value. In a study of excitability of rat atria during postnatal development up to 120 days, Gurjao de Godoy et al.75 found that atrial rheobase decreased with animal age and was altered by electric field orientation. Atrial chronaxie increased only with age. The clinician might keep in mind that the chronaxie is influenced not only by electrode material, size, and stimulation mode, but also by clinically varying biochemical factors. Certainly, marked variations in pacing threshold, either up or down, do occur months and years after implantation in some children and adults.76
Practical Application to Threshold Measurement
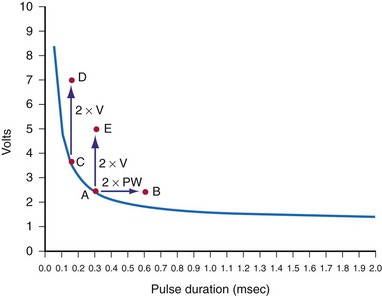
For example, if the pulse duration threshold is 0.5 msec at an amplitude of 2 V, reprogramming the pacemaker stimulus to a pulse duration of 1 or even 1.5 msec would provide a very small margin of safety (Fig. 1-9). Instead, doubling the stimulus amplitude to 4 V at a pulse duration of 0.5 msec would provide an adequate margin of safety. In contrast, consider that, in this same patient, the pulse duration threshold is 0.15 msec at a pulse amplitude of 3.5 V. Increasing the pulse width to 0.45 msec would also provide an adequate safety margin. The reason that a threefold increase in pulse width is not adequate in the first example but is acceptable in the second relates to the location of the threshold stimulus on the strength-duration curve.
Capture Hysteresis (Wedensky Effect)
The threshold stimulus amplitude measured by decreasing the voltage or current until loss of capture occurs is sometimes less than that determined by increasing the stimulus intensity from below threshold until gain of capture occurs. This hysteresis-like phenomenon is the Wedensky effect,77 the effect of subthreshold stimulation on the subsequent suprathreshold stimulation when the stimulus amplitude is being increased (Fig. 1-10).
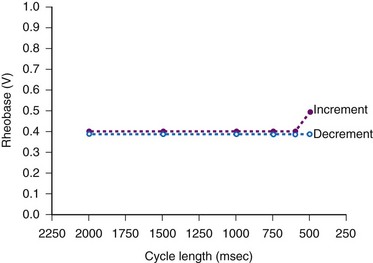
Langberg et al.78 observed no demonstrable capture hysteresis at pacing cycles longer than 400 msec. They concluded that the Wedensky effect was related to asynchronous pacing in the relative refractory period when incrementing the stimulus intensity, versus the synchronous late-diastolic stimulation when decrementing the stimulus amplitude until loss of capture.
Swerdlow et al.79 showed in a study of 40 patients that cardiovascular collapse occurs at AC current levels less than the ventricular fibrillation current threshold. The continuous capture threshold for AC current is less than the capture threshold for a single ordinary pacing stimulus. The authors suggested that continuous capture at low levels of AC current requires a cumulative effect of subthreshold stimuli; this is a variation of the Wedensky effect. The safety standard for 60-hertz (Hz) current leakage longer than 5 seconds should be 20 microamperes (µA) or less to avoid intermittent capture.
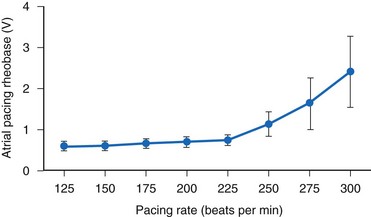
Effect of Pacing Rate on Stimulation Threshold
Hook et al.80 reported a significant increase in ventricular pacing threshold in 10 of 16 patients at 400 msec and in 15 of 16 at 300 msec (relative to a pacing cycle length of 600 msec). The phenomenon was not observed at every trial (e.g., 12 of 72 trials at 400 msec). The patients were all candidates for ICDs, and 9 of 12 were receiving antiarrhythmic drugs. The leads were bipolar: a pair of epicardial corkscrews in 11 patients and endocardial screw-in lead in five patients.
The atrial stimulation threshold has also been shown to vary as a function of pacing rate.81,82 Katsumoto et al.83 reported that 29 of 36 patients exhibited constant-current atrial pacing threshold energy and current variations as a function of pacing rate in the range of 60 to 120 beats per minute (bpm). The pacing was done with activated vitreous carbon electrodes.
Kay et al.84 found significant human atrial threshold changes as a function of pacing rate (125-300 bpm) using constant-voltage stimulation. They found a significant increase in rheobase voltage (Fig. 1-11), chronaxie, and minimum threshold energy at pacing rates greater than 225 bpm using platinized (low-polarizing) unipolar electrodes. They also determined strength-interval curves and found no correlation between atrial effective refractory period and rheobase voltage, chronaxie, or rate-dependent changes in either of these values. They concluded that the phenomenon is probably related to the “opposing effects of decreasing cycle length on the action potential duration and the slope of the strength-interval curve. Thus, if the pacing interval shortens to a greater extent than the refractory period and pacing stimuli are delivered during the ascending limb of the strength-interval curve (the relative refractory period), the diastolic threshold will increase.”84
 Strength-Interval Relationships
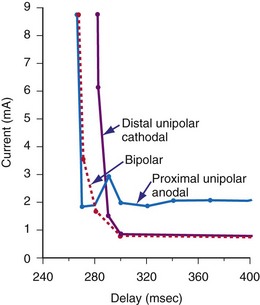
Voltage and current stimulation thresholds vary as a function of the coupling interval of the stimulus to prior beats and to the stimulation frequency used for the basic drive train. Figure 1-12 shows a typical ventricular constant-current strength-interval curve. At relatively long extrastimulus coupling intervals (>270 msec), the intensity of the extrastimulus required for ventricular capture is relatively constant, approaching the rheobase value. At shorter extrastimulus coupling intervals (<250 msec), the intensity of the extrastimulus must be increased for it to elicit myocardial capture.
 Factors Opposing Pacemaker Current Flow
Conductor Resistance and Conduction Losses
Impedance at Electrode-Tissue Interface
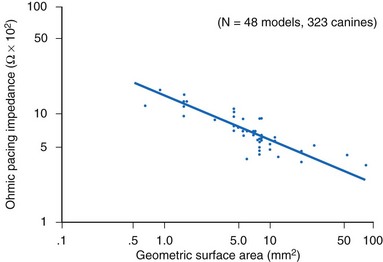
The resistance (ohmic polarization) of the stimulating electrode is inversely and exponentially proportional to the size of the electrode and the temperature and conductivity of the tissue.85,86 For practical purposes, in vivo temperature and conductivity are essentially constant. Decreasing the geometric surface area of the electrode, as illustrated in Figure 1-13, is a way to increase the current density at the electrode for any given level of output current from the pulse generator.

How does one obtain a very large surface area to contact the tissue and not use a large-diameter electrode? Initially, this was accomplished by making the electrodes porous.87–89 Microporous electrodes, such as activated carbon or platinized platinum, have a higher real surface area.90,91 The capacitance of microporous surfaces is greater than that of porous surfaces and still greater than that of polished surfaces. Fractal-surface electrodes have been best at meeting the requirements of very small geometric areas and large Helmholtz interface areas at the same time.
Another approach to the problem of decreasing polarization is to use a material that supplies its own majority charge carriers. An example is the silver–silver chloride (Ag/AgCl) electrode in chloride solution. The majority carrier, in this case Cl−, cannot be depleted; Cl− evolves at the cathode and is formed at the anode. Therefore, voltage across the electrode interface has a waveshape (waveform) essentially identical to that of the applied constant current, and the electrode is “nonpolarizing.” Unfortunately, no clinically usable, nonpolarizing (charge-carrier supplying) electrode material seems available for permanent implantation. Ag/AgCl electrodes, for example, are not used for permanent pacing because the anode erodes and the AgCl eventually dissolves from the cathode.92,93
Impedance
for a single R-X series combination. For various combinations of reactance and resistive elements in parallel and in parallel-series combinations, each component of impedance (Z1, Z2, Z3,… ) used in determining the total impedance must be treated as a vector quantity. Serial and parallel connection calculations using such vector components cannot be accurately performed by ordinary scalar, algebraic, Ohm’s law manipulations.94
Reactance and Charge Movement at Electrode-Electrolyte Interface
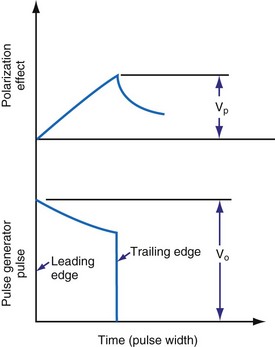
When the pacing pulse begins, several events occur almost immediately. Electron motion in the lead wires and electrodes must result in ion motion in the interstitial fluid. The electric field between the electrodes results in (1) reversible or irreversible oxidation-reduction processes occurring at the interface between the electrode and the electrolyte, and/or (2) the electrode-tissue interface’s acceptance of current without charge crossing the interface. In the latter case, the interface acts as a capacitor. Figure 1-14 shows the result is the sequence of events. The leading-edge voltage/current ratio is referred to as ohmic polarization. The increasing charge on the Helmholtz capacitor results in increasing opposition to further current inflow. The figure shows this as polarization overvoltage. The rates of voltage and current change depend on rates of ion movement within the electrolyte. These in turn depend on the mass and charge of ion species, species interactions and concentrations, and the applied electric field. The result is that lead wire current and voltage are not linearly related. The circuit is reactive. The vector combination of this reactance and the resistive elements (e.g., lead wires) make up the impedance faced by the pulse generator output.
Charge Conduction and Transmembrane Potential Changes in Cardiac Pacing and Defibrillation
In 1969, Otto Schmidt95 described biologic information processing using the concept of “interpenetrating domains.” In the heart, two domains of charge flow exist: extracellular and intracellular. The two domain pathways are different in their anisotropic characteristics, and they are interwoven. Current passes from one domain to the other through cell membranes. Bidomain theory and studies are based on the concept that at every point in the heart, there are two electric potential vectors, one intracellular and one extracellular. Mathematically, each domain is continuous and occupies the entire domain. Membrane current leaves one domain and enters the other at the same coordinates. The analytical and experimental work from these concepts has provided insight about depolarization wavefront passage over the myocardium, current flow directions in relation to wavefront direction, and virtual electrode formation.96–99
Roth99 showed that stimulation of myocytes by application of a defibrillation shock can result in transmembrane voltage (Vm) changes by four mechanisms: (1) direct polarization of the tissue, as described by cable theory (see later discussion); (2) production of virtual anodes and cathodes, as described by bidomain models with unequal anisotropy ratios of the intracellular and extracellular spaces; (3) polarization of the tissue secondary to change in orientation of cardiac fibers (curving); and possibly, (4) polarization of individual cells or groups of cells because of a sawtooth electric potential effect. Sawtooth alterations in potential may result from resistive discontinuities introduced by intercellular gap junctions. Plonsey and Barr100 predicted the occurrence of sawtooth effects in 1986. Under what circumstances and to what degree, if any, the sawtooth effect might become important in fibrillation or defibrillation is uncertain.101–103
Electrical Charge Movement in Wires and in Tissue
Irnich104,105 discussed fundamental laws of electrostimulation in 1990, then three myocardial stimulation theorems in 2002, introduced by George Weiss 100 years earlier: (1) the pacing threshold, as measured by the voltage-time product of the stimulus, is a linear function of the pulse duration; (2) there is a minimum of the delivered threshold energy requirement that depends on the pulse duration; and (3) pulse shape plays no role in electrostimulation. The third theorem is a concept with clinically apparent limitations and requires some interpretation,106,107 as discussed later.
Capacitance and Polarization
and the instantaneous current i entering or leaving the capacitor is

 , is directly proportional to the net area under the curve of instantaneous current entering and leaving the capacitor plotted against time. Note also that, for a given amount of charge, the voltage across the capacitor is inversely proportional to the capacitance. A perfect capacitor with no energy loss in storage or discharge is described by these equations.
The capacitance of canine myocytes in isosmotic solution is about 175 picofarads (pF). Cell membrane capacitance is about 0.01 microfarad (µF) per square millimeter of membrane surface area.108 The capacitance of pacemaker electrodes has been reported to range from 0.2 µF/mm2 (smooth surface) to 40 µF/mm2 (fractal-surface electrode). The area of pacemaker tip electrodes is usually in the range of 4 to 10 mm2. Therefore, the capacitance might be 200 µF or more. The time constant for a 200-µF capacitor C discharging through a 500-Ω resistor R is R × C, or 100 msec. This means that the voltage across the capacitor, or across an ideal electrode-electrolyte interface, if the capacitance were a truly constant 200 µF and the interface impedance 500 Ω, would on discharge decrease from its maximum level to 37% of maximum in 100 msec.
Figure 1-15 shows the Helmholtz capacitance and Warburg impedance in a schematic representation of a typical pacing configuration. These effects are caused by the electrode/tissue interface and the conversion of electric charge from electron flow to ion flow.
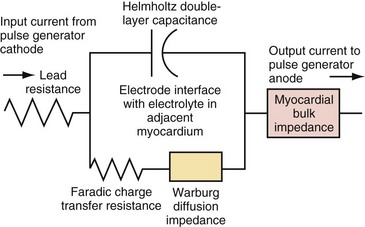
(Modified from Rodman JE: Solution, Surface and solid state assembly of porphyrins [PhD thesis]. Cambridge, University of Cambridge, 2000, Fig 4.6.)
Figure 1-16 demonstrates the decay of the Helmholtz capacitance following a constant current pulse. After termination of the pacing pulse, the voltage decays slowly toward baseline, but does not reach it before the second pulse is delivered. If the impedance between the positive and negative sockets of the pulse generator were made to go to very high impedance when the pacemaker pulse ends, almost no current would flow in the catheter wires between pulses. The Helmholtz capacitor at the electrode would discharge mainly through resistive components in the electrode-electrolyte interface. In that case, when the constant-current stimulus stops, the voltage measured across the catheter pins would keep the same polarity and would decay slowly rather than go to zero precipitously.
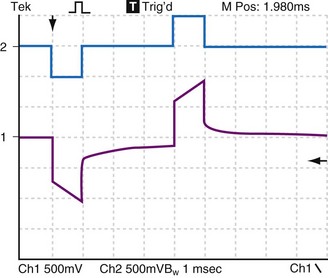
Figure 1-16 also illustrates this decay by an electronic circuit simulation during pacing of a fibroblast cell culture through a bipolar cardiac catheter. The top trace shows a biphasic constant-current pulse with 3 msec between the end of the initial, negative phase and the beginning of the positive phase. The duration of each phase is 1 msec. The pulse generator circuit here goes to a high impedance rather than a low impedance when each phase ends. The bottom trace shows the voltage response. At the end of each phase, the voltage measured at the pulse generator terminals initially goes rapidly toward zero but, partway toward zero, it begins to change only slowly. This is the effect of the Helmholtz capacitor discharging into the surrounding electrolyte, and it is a function of the rates of ion movement at that time during the discharge cycle.
Biphasic Stimulus Effect
Of great interest is the effect of decreasing the delay time between the end of the first and the beginning of the second phase. Compare Figure 1-16 with Figure 1-17. When the stimulus is biphasic with almost no delay (here about 10 µsec) between phases, the slow decay of voltage at the end of the first phase is aborted by the beginning of the second, opposite-polarity phase. The amplitude and duration of the voltage decay after the second phase are each less when the second phase occurs immediately rather than being delayed by 3 msec. In practical terms, because of Helmholtz effects, electrical activity continues to occur at and near the electrode after the stimulating pulse stops. Details of the activity depend on the stimulus (uniphasic or biphasic), delay time between phases, characteristics of each phase, and the action of the pulse generator output circuit when the stimulus stops (high impedance, low impedance, or recharge pulse). The electrical activity also depends on the characteristics of the electrode (e.g., geometric vs. electrical surface area), the ionic solution, and the tissue.
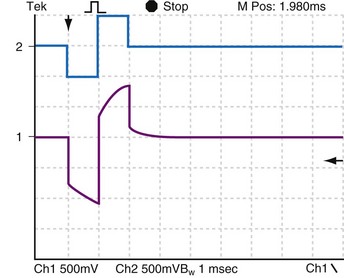
Figure 1-17 Effect of near-zero delay between phases on voltage response to biphasic constant-current pulse.
This plot was made under the same conditions as Figure 1-16, except that the delay between phases was decreased from 3 msec to approximately 100 µsec. When the stimulus is biphasic with almost no delay between phases, the slow decay of voltage at the end of the first phase is aborted by the beginning of the second, opposite-polarity phase.
Capacitance, Polarization, and True Impedance
When using an ordinary pacing systems analyzer, one thinks of impedance as a voltage/current ratio. If reactance is present, as it is at a pacemaker or defibrillator electrode because of the Helmholtz capacitance effect, the voltage/current ratio as seen on the PSA can be deceptive (see Biventricular Pacing). Because of the charging and discharging of the Helmholtz capacitor at the electrode-electrolyte interface, the applied voltage and resultant current are not linearly related. Therefore, the circuit is reactive, and impedance rather than resistance is the correct measure of opposition to current flow (see earlier discussion).
Charge Grouping and Polarization
Capacitance Effect of Helmholtz Double Layer
About 1879, Helmholtz suggested that a layer of ions (inner Helmholtz layer) is attracted to the surface of a charged electrode, and that this layer is bounded on its nonelectrode side by a layer of oppositely charged ions (outer Helmholtz layer) in the solution.109 This interface acts as a capacitor. Helmholtz assumed for this model that no electron transfer reactions occur at the electrode and that the electrode environment is only an electrolyte. These (and more complicated charge redistributions) occur because of attraction and repulsion interactions between an electrode held at a given electric potential (e.g., 2 V negative during 0.5-msec pacemaker pulse) and the ions and charged molecules in the interstitial fluid. The charge placed on the electrode, by electrostatic attraction, forces the accumulation of a polarized water layer and a second layer of hydrated, oppositely charged ions adjacent to the electrode surface. The oppositely charged ions come from the electrolyte. The interface at the electrode becomes an electrical double layer. This is in effect a charged capacitor.110
However, the actual interface is not a simple double layer. The Helmholtz model does not take into account other factors, such as absorption on the surface, thermal buffeting, and interaction between solvent dipole moments and the electrode. Models more complicated than the Helmholtz include the Gouy-Chapman and Gouy-Chapman-Stern.111 These models have dissimilar shapes for the plot of electric potential variation with distance from the electrode. The layers have relatively high dielectric constants and form an interface that behaves electrically like a capacitor (Cc and Ca in Fig. 1-18). In a semiconductor or in localized regions of an electrolyte, an excess of positive or of negative charge may be present. If the excess is of positive charge carriers, the positive carriers are the majority carriers and the negative charge carriers the minority carriers. An excess of negative carriers makes these the majority and the positive carriers the minority.
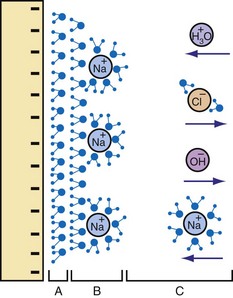
The second layer of the double layer is formed of hydrated ions and more water (Fig. 1-19). In physiologic electrolytes, the ions include Na+ and Cl− in major concentrations (majority carriers). Other ions present in lower concentrations (minority carriers) include hydronium (H3O+), hydroxyl (OH−), and phosphate (HPO42−).
Electrode-Electrolyte Interface Processes
At equilibrium, an electrode in a solution will have, relative to a reference electrode, a potential that depends on the composition of the electrode, the composition of the solution, and other factors such as temperature.112 When a pacemaker pulse is applied, the electrode is forced to a different electric potential. This new potential forces ion flow to occur in the vicinity of the electrode. Ion secondary rearrangements occur distally. The net ion drift near the electrode is in a direction that will produce a new equilibrium, a balance of charge across the interface.
Faradic Current Flow
Faradic current is so named because Michael Faraday (1791-1867) quantitatively described the effects of electric current through an electrolyte in 1834, stating that “the chemical decomposing action of a current is constant for a constant quantity of electricity, notwithstanding the greatest variations in its sources, in its intensity, in the size of the electrodes used, in the nature of the conductors (or nonconductors) through which it is passed, or in other circumstances.”113
Capacitive Current Flow
The resulting arrangement of ion groupings at and near the electrode-electrolyte interface can be very complicated.114 The accumulation of charge separated by charge sign at the interface defines the Helmholtz double-layer capacitance.115 Energy is stored as an electrostatic field that exists between the positive and negative charge layers.
At a pacemaker electrode, the capacitance is not constant. It is dependent on current density, electrolyte composition, and the area and other surface characteristics (e.g., fractal surface) of the electrode material.116
Because of the minute distances separating positive and negative charge layers at an electrode in electrolyte, the capacitance is high, ranging from about 0.2 to 40 mF/mm2 of geometric area of the electrode.117 The fractal-surface electrode has a much higher capacitance than a smooth-surface electrode.
 states that the current i entering or leaving a capacitor at time t varies directly as the magnitude of the capacitance (C, measured in farads) multiplied by the rate of change of the voltage difference across the capacitor. Because a constant-voltage pulse is nominally a rectangular wave, its rate of change is small except when the pulse is being turned on or off. Therefore, current flow into the capacitor (i.e., into the pacemaker electrode-electrolyte interface, Helmholtz capacitance) occurs very rapidly during the leading edge of a nominal constant-voltage pacemaker pulse. Then, as charge accumulates at the electrode-electrolyte interface, the accumulating negative charge collection at the electrode surface slows the rate of further accumulation. It does so because the accumulating negative charge opposes the inflow of additional negative charge. Finally, unless the pacemaker output voltage were to be raised during the pulse, no further accumulation can occur. The voltage across the capacitor becomes equal and opposite to the constant-voltage pulse that had been driving current flow into the lead. Note that the Helmholtz capacitance is influenced by the current density at the electrode, the types and numbers of ions in the electrolyte, the material and surface of the electrode, the temperature, and other factors.
Relation of Electrode-Tissue Interface Capacitance to Polarization Voltage
 , describing the voltage that occurs across a capacitor when current flows into it, the developed voltage varies inversely as the capacitance (C, measured in farads). If both sides of this equation are multiplied by C, the equation becomes Cvt =
  . The amount Qt of stored charge at any time t is
  . Therefore, Cvt = Qt, and vt = Qt/C. That is, for a given amount of charge put into the defibrillator or pacemaker electrode, the voltage across the interface will be decreased if the surface area of the electrode (and therefore the capacitance) is increased. This voltage is the polarization voltage. During its decay time after the stimulation pulse has ended, the polarization voltage can interfere with autosensing of capture.
For a given stimulus voltage, the greater the polarization voltage at the electrode-tissue interface, the lesser the voltage gradient elsewhere in the tissue between the cathode and the anode. A fractal-surface electrode, with its high capacitance,117 has, for the same charge flow in and out, a lesser potential difference across the electrode-electrolyte interface than a smooth-surface electrode. Therefore, the fractal surface is preferred.
For present-day implantable pacemaker electrodes, if the pulse duration is short, or if the pulse is biphasic with a sufficiently short time between balanced phases, the charge transfer reactions do not normally result in gross corrosion or gross tissue changes. Therefore, those reactions that do occur must be largely reversible.118
Ideal and Non-Ideal Electrodes
To avoid corrosion and deposition of toxic products in the adjacent tissue, electrodes that undergo irreversible reactions only minutely are highly desirable for pacemakers and defibrillators. Michael Faraday worked out the quantitative relationship between electrode-electrolyte chemical changes and the total amount of charge passed through the electrode into the electrolyte.119 Electrodes that under the conditions of use produce irreversible electrochemical reactions by means of these faradic currents entering or leaving the electrolyte are non-ideal electrodes.
When biphasic pulses are used, minimal postpulse polarization persists, provided the time between phases is in the microsecond range. If the time between phases is increased into the millisecond range, the duration and amplitude of persisting polarization increases (see Figs. 1-16 and 1-17).
Optimizing Impedance for Minimum Battery Consumption
All these factors influence the impedance as seen at the pulse generator. Note that fibrous tissue formation around an electrode does not necessarily increase the impedance but does increase the pacing threshold. (For further discussion of these issues, see Clinical Aspects of Myocardial Stimulation by Pacemakers.)
[/level-membership-for-cardiovascular-category][not-level-membership-for-cardiovascular-category]
1 Cardiac Electrical Stimulation
Concepts Related to Electrical Stimulation of the Heart
Inductance
Note that the voltage across the inductor is directly proportional to the rate of change of current flowing through the inductor. Cell membrane currents have some of the current- and voltage-versus-time characteristics of an inductance in parallel with a capacitance.1 These inductance-like effects are related to the timing and magnitude of potassium ions moving into and out of the cell.2
Reactance (Capacitance and Inductance)
For reactive elements connected in series, net reactance is the scalar sum of inductive reactance (positive in the mathematical complex plane) and capacitive reactance (negative in complex plane). Pure reactance values depend on the rates of change of current and voltage, whereas pure resistance values do not. Phenomena of this type are caused by differences in the timing of the peaks (phase angles) of the voltages or currents in the various reactive components. These reactive effects can be important in biventricular pacing threshold measurements (see later discussion). The component of reactance that is most relevant to both pacing electrodes and cell membranes is capacitance, with inductance being much less important. For example, the cardiac action potential spreading throughout the heart generates a changing magnetic field that transiently stores a very small amount of energy. However, the changing magnetic field generated by spread of the action potential is so small that it is not clinically significant except in the research setting.3
(remembering that and that the voltage across a capacitor at time t is ).
Cellular Aspects of Myocardial Stimulation
Cell Membrane Characteristics
Cell membrane characteristics are major determinants of tissue excitability. The membrane of the cardiac myocyte is composed principally of phospholipids, cholesterol, and proteins.4 The membrane phospholipids have a charged polar headgroup and two long hydrocarbon chains arranged as shown in Figure 1-1. The cell membrane comprises two layers of phospholipids with their hydrophobic aliphatic chains oriented toward the central portion of the bilayer membrane and their polar headgroup regions toward the outside boundaries of the membrane. Because the membrane is composed of two layers of phospholipids, the polar regions of the phospholipid molecules interface with the aqueous environments inside and outside the cell. The lipid-soluble hydrocarbon chains are forced away from the aqueous phase to form a nonpolar interior.
Determinants of the Resting Transmembrane Potential
Relatively large gradients of individual ion concentrations exist across the cardiac cell membrane.5 The gradient of sodium ions (Na+) across the membrane is approximately 145 millimoles per liter (mmol/L) outside to 10 mmol/L inside. In contrast, the potassium ion (K+) concentration outside the cell is approximately 4.5 mmol/L, whereas the inside concentration is 140 mmol/L. In the absence of a cell membrane, both Na+ and K+ would rapidly move in a direction determined by the concentration gradient. The diffusion force tending to move K+ out of and Na+ into the cell is proportional to the concentration gradients of those ions. The potential energy attributable to the diffusion force (PEd) tending to move K+ out of the cell is given by the following equation:
where z here is the valence (the number of positive or negative electrical charges) of the ion, F is the Faraday constant (96,500 coulombs/equivalent), and Vm is the transmembrane potential difference (transmembrane voltage, measured in millivolts). During equilibrium, the total of the potential energies from diffusion and electric forces is zero, and no net ionic movement occurs. Therefore, the sum of Equation 1-1 and Equation 1-2 may be set to zero. This yields the Nernst equation, which describes (in measurable electrical units) the potential that must exist for a single ionic species, here K+, to be in equilibrium across the membrane of a resting cardiac cell:
Using known values for extracellular K+, Vm(K+) = −90 mV. When Equation 1-3 is solved using Na+ concentrations, a Vm(Na+) of +50 mV is obtained. Therefore, it is the equilibrium potential for potassium ion (not sodium ion) that is the major factor responsible for the resting transmembrane potential. This suggests that the resting membrane is more permeable to K+ than to Na+.
To calculate the transmembrane potential when multiple ionic species exist in different concentrations across the membrane, the Goldman constant field equation (modified by Hodgkin and Katz6) is used:
where PK+, PNa+, and PCl− are the cell membrane permeabilities for the respective ions. At physiologic concentrations, this equation yields a transmembrane potential of −90 mV (the equilibrium potential for K+). Equation 1-4 describes how resting potentials vary as sodium and potassium ion concentrations are changed. Because there is a passive leak of charged ions through the membrane, the resting potential would not exist at the level of −90 mV unless it were actively maintained. This is accomplished by two active transport mechanisms that exchange Na+ ions for K+ and calcium (Ca2+) ions.
Ion Channels
Protein molecules embedded within the cell membrane have numerous functions, including those of being ion channels and signal transducers. The concept of ion channels was proposed in the 1950s by Hodgkin and Huxley.7 However, it was not until the introduction of the patch clamp technique by Neher and Sakmann in 1976 that the properties of these channels could be directly studied.8,9 There are two basic types of ion channels, distinguished by the factors that control opening and closing of the channel. Ion channels at muscle fiber end plates are chemically gated by specific transmitters. The opening of these channels is triggered by the binding of acetylcholine, and their closing is induced by its unbinding. In neuronal axons, conduction is mediated by faster, voltage-gated channels. These channels respond to differences in electric potential between the inside and outside of the cell, across the membrane. Voltage-gated channels for sodium, potassium, and calcium appear to operate in similar ways, sharing many of the same structural features. In addition, each type of channel can be subdivided into several subtypes with different conductance or gating properties (Fig. 1-2).
Figure 1-2 Ion channels underlie cardiac excitability.
(From Marban E: Cardiac channelopathies. Nature 415:213-218, 2002. ©Nature Publishing Group, http://www.nature.com.)
Voltage-Gated Channels
Voltage-gated channels open in response to an applied electric potential. The source of this voltage can be an action potential propagated from an adjacent cell or the electric field of an artificial pacemaker electrode. If depolarization of the membrane exceeds a threshold voltage, an action potential is triggered, resulting in a complex cascade of ionic currents flowing across the membrane into and out of the cell. As a result of this flow of charge across the membrane, the potential gradient across the membrane changes in a characteristic pattern of events that produce the cardiac action potential (Fig. 1-3).
Selective membrane-bound proteins (ion channels) determine the passive transmembrane flux of an individual ion species. The transmembrane currents determine or influence cellular polarization at rest, action potential depolarization and repolarization, conduction, excitation-contraction coupling, and myofibril contraction. The channels that regulate transmembrane conductance of Na+ and Ca2+ are voltage gated. The sodium channel is a large protein molecule composed of approximately 1830 amino acids.10 It contains four internally homologous repeating domains, believed to be arranged around a central water-filled pore lined with hydrophilic (“water-loving”) amino acids. It is estimated that there are 5 to 10 Na+ channels per square micrometer (µm2) of cell membrane. When an alteration changes the membrane potential to about −70 to −60 mV (the threshold potential), four to six positively charged amino acids move across the membrane in response to the change in electric field. This causes a change in the conformations of the channel proteins, resulting in opening of the channel. After a single Na+ channel changes to the open conformation, about 104 Na+ ions enter the cell. On depolarization of the membrane, the Na+ channels remain open for less than 1 millisecond (msec). After rapid depolarization of the membrane, the Na+ channel again changes to the closed conformation. In addition to the Na+ channel, specialized proteins are suspended in the cell membrane that have differential selectivity for K+, Ca2+, and Cl− ions, with much different time constants for activation and inactivation.
Sinoatrial and Atrioventricular Nodal Cells
In these nodal structures, depolarization is primarily mediated by inward Ca2+ conductance through specialized Ca2+ channels. There are two types of Ca2+ channels in the mammalian heart. The L-type channels are the major voltage-gated pathway for entry of Ca2+ into the myocyte, and they are heavily modulated by catecholamines.11 The T-type channels contribute to spontaneous depolarization of the cell associated with automaticity (pacemaker currents). The pore of the Ca2+ channel has a functional diameter of about 0.6 nanometers (nm), larger than that of the Na+ channels (0.3-0.5 nm).12 The selectivity for Ca2+ is high, up to 10,000-fold greater than that for Na+ or K+. The key elements are high-affinity binding sites for Ca2+, positioned along a single file pore. “Elution” of a Ca2+ ion occurs when another Ca2+ ion enters and is selectively bound.
Maintenance of Resting Membrane Potential
The resting membrane potential is maintained by the pumping of Na+ ions out of the cell and K+ ions into the cell. The Na+,K+—adenosine triphosphatase (ATPase) pump moves three Na+ ions out of the cell in exchange for two K+ ions moved into the cell.13–15 The basic unit of the Na+,K+-ATPase protein (pump) consists of one alpha (α-) and one beta (β-) subunit. The α-subunit is large (1016 amino acids) and spans the entire membrane, whereas the β-subunit is a smaller glycoprotein. There appear to be about 1000 pump sites/µm2 of cardiac cell membrane. The fully activated pump cycles about 50 to 70 times per second (interval of 15-20 msec/cycle). Similarly, the Na+-Ca2+ pump moves three Na+ ions out of the cell in exchange for one Ca2+ ion.16,17 Therefore, both transport mechanisms result in the net movement of one positive charge out of the cell, polarizing the membrane and maintaining a negatively charged interior. The function of both exchange mechanisms depends on the expenditure of energy in the form of high-energy phosphates and is susceptible to interruptions in aerobic cellular metabolism (e.g., during ischemia).
The Cardiac Action Potential
When the voltage gradient across the membrane of a myocyte decreases so that the inside of the cell becomes less negatively charged with respect to the outside of the cell, a critical transmembrane voltage difference is reached, the threshold voltage. At threshold, the cell membrane suddenly undergoes a further depolarization that is out of proportion to the intensity of the applied stimulus. This abrupt change in the potential across the membrane is the start of a cascade of inward and outward currents that together are known as an action potential.18
The cardiac action potential is an enormously complex event and consists of five phases19 (see Fig. 1-3): phase 0, the upstroke phase of rapid depolarization; phase 1, the overshoot phase of initial rapid repolarization; phase 2, the plateau phase; phase 3, the rapid repolarization phase; and phase 4, characterized by a slow, spontaneous depolarization of the membrane in cells with spontaneous pacemaker activity, until the threshold potential is again reached and a new action potential is generated.
Phase 1: Initial Repolarization
After voltage-dependent activation of the Na+ current in phase 0, the membrane potential rapidly changes from negative to positive. The increased conductance of Na+ is rapidly followed by voltage-dependent inactivation. Phase 1 is characterized by the transient outward K+ current (IKto). The outward movement of K+ is a major contributor to the various repolarization phases. It is complex and has a number of discrete pathways.20,21 Most K+ currents demonstrate rectification, that is, decreased K+ conductance with depolarization. The K+ currents include the instantaneous inward rectifier K+ current, the outward (delayed) rectifier K+ current, the transient outward currents, and ATP-, Na+-, and acetylcholine-regulated K+ currents. The initial repolarization, however, is mainly the result of activation of a transient outward K+ current and inactivation of the fast inward Na+ current.22 The transient outward K+ current has two components, one voltage gated and the other activated by a local rise in Ca2+.
Phase 2: Plateau
The net current during the plateau phase is apparently small, although the individual currents (inward Na+ and Ca2+ and outward K+) are each about an order of magnitude larger.23 Among the inward currents are the slowly activating Na+ current, a Ca2+ current, and an Na+-Ca2+ exchange current. Outward currents include a slowly activating K+ current (IKs), a Cl− current, a more rapidly activating K+ current (IKr), an ultra-rapidly activating K+ current (IKur), and the Na+-K+ electrogenic pump. During phase 2 of the action potential, the absolute refractory period, the cardiac cell cannot be excited by an electrical stimulus, regardless of its intensity.
Phase 4: Automaticity and the Conduction System
Automaticity is the property of certain cells by which they are able to initiate an action potential spontaneously. It has been known for centuries that the heart can exhibit spontaneous contraction even when completely denervated. Leonardo da Vinci observed that the heart could “move by itself.”24 William Harvey reported that pieces of the heart could “contract and relax” separately.25 Many cells within the specialized conduction system have the potential for automaticity.
Normally, depolarization is initiated at the SA node.26,27 Figure 1-4 shows action potentials from different types of cardiac cells.28 Rather than maintaining a stable resting membrane potential, the repolarization of the action potential is followed by a slow depolarization from about −71 to −54 mV, the threshold required to initiate another action potential. This slow, spontaneous depolarization drives cardiac automaticity and is related to a specialized current (If). In the case of AV nodal cells, the fast upstroke is carried predominantly by an inward Ca2+ current. Repolarization is caused by delayed activation of the K+ current. The balance of inward and outward currents determines the net “pacemaker” current and is finely regulated by both adrenergic and cholinergic neurotransmitters. In the presence of AV block or abnormal SA nodal function, AV junctional cells in the region of the proximal penetrating bundle usually assume the role of pacemaker at rates slower than that of the sinus node. In the absence of disease in the AV junction, the escape rhythm occurs with a frequency that is about 67% of the sinus rate.29
Artificial Electrical Stimulation of Cardiac Tissue
Artificial lipid membranes in their pure form are electrical insulators. The myocyte cell membrane (sarcolemma) is much more complicated. Specialized protein molecules in the membrane allow it to be conductive.30,31 These proteins, either singly or in certain groupings, form channels that open and close for transport of specific ions through the membrane in response to particular stimuli. The channel proteins are the end stages of processes that provide both active and passive transport of ions and molecules through the membrane.
The effect of the stimulus is to change the transmembrane voltage of nearby myocytes sufficiently so that depolarization begins in and spreads from these myocyte membranes. Propagation of the stimulus to nearby myocytes occurs because the local transmembrane depolarization changes the voltage gradient across adjacent membranes sufficiently to trigger depolarization of those membranes. To cause an action potential to spread throughout the whole heart, an electrical pulse must stimulate a minimum of approximately 50 closely coupled cardiac cells.5 The result is a self-regenerating action potential that progresses in a wavelike, relatively slow manner beyond the local effect of the pacemaker stimulus. Away from immediate vicinity of the electrode, transmission of depolarization and its velocity depend in part on the resistance and capacitance properties of the membrane, on the opening and closing of ion channels, and on ion flows through the sarcolemma.
