Chapter 2 Cardiac activation
REQUIREMENTS FOR AN EFFECTIVE HEART
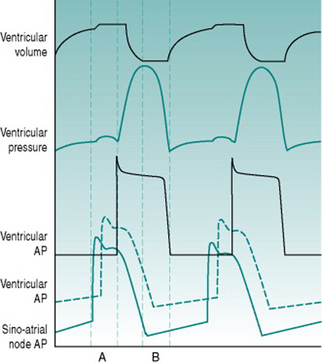
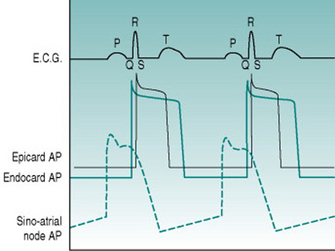
As a foundation from which to explore the responses of the circulation to exercise and environment, it is worthwhile to review the characteristics that the heart requires in order to fulfil its role as a pump. At least most of the material covered in this first section is probably familiar to you from earlier courses, but it may be helpful to have it set out again. As you read through the first section of this chapter, use the simulated records in Figure 2.1 to remind yourself of the sequences of electrical and mechanical events that make up the cardiac cycle.
Rhythmic excitation
For a muscular pump to provide continuous blood flow through the circulation there must be a system that guarantees generation of muscle action potentials at regular intervals. The normal rhythm generator or pacemaker is a small group of cells that lies high in the wall of the right atrium, constituting the so-called sinoatrial node. The membranes of these cells have an unusually high sodium conductance and contain metabolic pumps that progressively reduce potassium conductance. These two properties together result in the membrane potential depolarizing gradually towards zero in what is termed the pacemaker potential, rather than them having a stable resting membrane potential of around −70 mV as is characteristic of the normal cardiac muscle cells. Since the threshold membrane potential for action potential initiation is around −40 mV, the pacemaker cells fire an action potential as soon as they depolarize to this threshold. As in any excitable cell, the action potential activates a delayed potassium efflux and this repolarizes the cells to around −70 mV but, once these voltage-gated potassium channels close, the membrane starts to depolarize once more and initiates another action potential.
The period between successive action potentials in a sinoatrial node cell at 37° C (98.5° F) is around 600 ms, giving an inherent frequency of cardiac excitation of about 100 beats/min. In the intact body, however, the slope of the pacemaker potential is subject to tonic influences by thoracic sympathetic nerves that increase the slope and speed up heart rate (tachycardia) and vagal parasympathetic nerves that reduce the slope and slow the heart down (bradycardia). In a resting subject, both of these neural inputs are continuously active but the bradycardic effect of the parasympathetic input predominates, so that resting heart rate is normally less than 100 beats/min and typically around 65–75 beats/min.
Direction of ventricular pressure gradient
The ventricular chambers are elongated, with the outlets into the arterial system lying at their rostral ends adjacent to the A/V margin. Efficient blood ejection, therefore, requires progressive development of pressure from the ventricular apex towards the exit site, although the apical region is furthest away from the point of entry of action potentials through the A/V node. To achieve the appropriate sequence of ventricular activation, the ventricular end of the A/V node is connected to a branching system of large-diameter (that is, fast-conducting) cells forming the Purkinje system. This conducting system travels down each side of the interventricular septum, bypassing the more rostral regions of the ventricular muscle and directing excitation directly to the endocardial surface of the ventricular apices. Excitation then propagates back through the syncytium towards the A/V margin, pushing the ventricular contents towards its arterial exit points. The efficiency of ejection is further enhanced by the fact that the muscle making up the outer ventricular walls is arranged spirally, so that when it contracts it produces a wringing movement.
Guaranteed time for filling
Existence of a finite relaxation period is a prerequisite for nutritional perfusion of the ventricular myocardium. The coronary arteries that supply the heart arise from the aorta and so the pressure gradient responsible for coronary blood flow is essentially identical to that generated by the left ventricle. Because ventricular ejection must involve at least equivalent pressure being developed within the left ventricular wall, the left coronary arteries are mechanically occluded during the ejection phase of the cardiac cycle (termed systole) and nutritional perfusion can occur only during the relaxation phase (termed diastole). As will be discussed in Chapter 8 (p. 95), coronary perfusion of the right ventricle is more continuous, since the ventricular pressure developed there is much lower than systemic arterial pressure, and so the vasculature is perfused during systole as well as diastole.
Coordination of right and left outputs
Since the systemic and pulmonary circulations are in series, they must each pump identical volumes of blood per unit time. It is, therefore, essential that both ventricles eject blood simultaneously. This coordinated timing is ensured by the fact that the Purkinje system conveys action potentials simultaneously to the apices of both ventricles. Even with exact timing, however, the left ventricle needs to generate a far greater ejection pressure than the right ventricle in order to eject the same volume of blood, because the systemic vasculature has a much higher resistance than does the pulmonary vasculature. To provide the extra degree of pressurization, the left ventricle is wrapped with an additional spiral layer of muscle.
MONITORING ELECTRICAL ACTIVITY OF THE HEART
Basis of the electrocardiogram
Timecourses and amplitudes of events
When voltage is recorded between two points in an excitable tissue, the electrode towards which a wave of membrane depolarization is moving becomes positive relative to the other electrode, while a wave of repolarization causes the reverse voltage difference. During excitation of the heart, the sequence of electrical events is highly predictable. Continual measurement of voltage difference across the heart can, therefore, be used to identify the timing of depolarization of atria and ventricles, while the magnitude of voltage changes indicates the volume of muscle that is involved. The characteristic voltage record obtained is termed the electrocardiogram, or ECG, and the sequence of electrical events that occurs during cardiac excitation can be tracked by identifying each of the phases of the ECG waveform with a specific letter (Fig. 2.2).
With normal excitation originating from the sinoatrial node, measurement of the time between the beginning of atrial depolarization (beginning of P wave) and the entry of action potentials into the muscle of the ventricular apices (beginning of R wave) is always between 120 and 200 ms. Most of this delay is due to action potential travel through the slowly conducting A/V pathway, producing the so-called P–R interval which provides an index of the efficiency of this path. Ventricular excitation occurs by simultaneous entry of action potentials into both apices and coordinated spread of depolarization over both ventricles. This process takes only 60–80 ms and is indicated by the duration of the QRS complex. Once ventricular depolarization is complete the muscle cells all remain depolarized for the duration of the action potential plateau and then progressively repolarize, producing the T wave. This sequence produces an initial isoelectric period typically around 150 ms in duration while all cells are depolarized, and then a T wave whose timecourse of around 200 ms represents the range of action potential durations in different regions of the ventricular wall.
Orientations of ECG recording
The voltage changes occurring across the heart spread without diminution throughout the highly conductive medium of the body interior and can be detected from the body surface, so long as electrolyte-rich liquid is rubbed into the skin under the recording electrodes in order to overcome the high electrical resistance of the epidermis. Recording can be made most simply between right and left arms (Lead II) or between one arm and the left leg (Leads I and III). This so-called frontal lead system allows detection of impulse movement across the heart either horizontally or in a semi-vertical direction. Usually, the primary concerns for human physiologists are simply to have a signal large enough for you to be certain whether or not the sequence of excitation is normal, and to be able to reliably trigger a ratemeter from the R wave. Lead II usually provides the best record for these purposes but, because different people’s hearts have different vertical-horizontal orientations, larger signals are seen with one of the other lead orientations in some individuals.
Although the frontal lead system is usually referred to as using arms and legs, the only criterion for placement of electrodes is that they should be outside the limits of the heart. During exercise, contraction of superficial muscles underneath an electrode can produce a voltage deflection that looks something like a QRS complex. Therefore, when movement patterns involve activation of arm muscle, positioning the electrodes on wrists or arms sometimes leads to apparently abnormal records (Chatterjee 2006). For this reason, it is best practice in studies involving limb movement to place the electrodes on the chest wall or shoulders.
Electrical activity moving at right angles to the orientation of the ECG electrodes produces no voltage signal, so frontal leads provide only limited information on the three-dimensional spread of activity through the heart. For this purpose, it is necessary to also record voltage differences between the heart and different points along the ventrodorsal diameter of the chest. The standard points used are six locations ranging from the right side of the sternum overlying the right ventricle (Lead V1), to the left axilla overlying the left ventricle (Lead V6). With these leads, one would expect to see a positive R wave in V6, but a reversed R wave in V1 reflecting the relative muscle masses in the two ventricles. So it is not surprising that at one or two of the intermediate locations, where the recording electrodes overlie the interventricular septum, the R wave appears bipolar. The chest leads are particularly useful for recognizing changes in absolute muscle volume in one or other ventricle, which alters the pattern of R wave polarity between the six locations. In addition, the R wave in V6 is the largest in amplitude of any lead but never normally exceeds 2.5 mV. An R wave from this lead that is 3 mV or more in height can, therefore, be used as a reliable index of left ventricular hypertrophy, and constitutes one of the indices for assessing training-induced cardiovascular adaptation in athletes (see Chapter 11, p. 131).
Arrhythmias in the normal heart
Exercise tachycardia
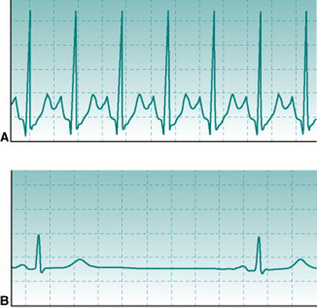
At heart rates of 150 beats/min or higher, successive T and P waves follow each other without time for any isoelectric period. The absence of an isoelectric period makes the record look as if there is some irregularity of excitation (Fig. 2.3A). However, inspection will confirm that there is a regular sequence of P, QRS and T waves.
Training bradycardia
Chronic aerobic activity results in a progressive fall in resting heart rate. With moderate activity the reduction is typically only 5–10 beats/min and occurs over several weeks’ activity. With the more intense levels of training associated with competitive aerobic exercise, resting rate continues to fall to values that may be as low as 30–35 beats/min in elite athletes. The mechanisms that underlie this progressive training bradycardia will be examined in Chapter 11 (p. 133). As with exercise tachycardia, extreme bradycardia makes the ECG record look strange (Fig. 2.3B). However, its normality can be confirmed easily by checking that the PR interval is normal and that there is a consistent sequence of P, R and T waves. Note that, without an ECG, it would be impossible to know whether somebody with a very slow heart rate is a normal, athletically fit person or has some cardiac abnormality that slows down the heart beat.
Respiratory sinus arrhythmia
Heart rate shows a sinusoidal oscillation during the respiratory cycle, with a relative tachycardia developing during inspiration and waning during expiration. This oscillation is due to the fact that vagal drive to the sinoatrial node falls progressively as inspiration progresses. Two inhibitory inputs to the vagal centre in the hindbrain are involved, one from stretch receptors in the lung and one from inspiratory neurons in the hindbrain respiratory centre. As the discharges of both these inhibitory pathways are proportional to the amount of inspiratory effort, the magnitude of sinus arrhythmia is much greater during deep than shallow breathing. Even at rest, however, there is typically a variation of at least 5–10 beats/min in individuals below the age of 30. A representative example of sinus arrhythmia can be seen in Figure 4.3 (p. 37).
The bradycardia that results from chronic physical training is accompanied by increased magnitude of sinus arrhythmia, probably reflecting the increased range over which altered vagal tone can alter heart rate. In fact, the absolute magnitude of the arrhythmia has been suggested to provide a quantitative index of fitness, similar to that derived from measurement of  (Lopes & White 2006).
Abnormal arrhythmias
Absence of P waves
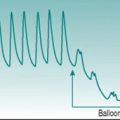
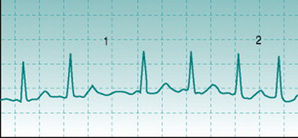
Atrial fibrillation has relatively little effect on the efficiency of cardiac pumping because most ventricular filling has occurred before atrial systole (Fig. 2.1). But it does create a potential problem. Instead of the atrial contents being regularly ejected, some blood tends to lie stationary in the extremities of the atrial chambers. When blood is stagnant, it tends to form clots and cell aggregates (thrombi) (see also Chapter 5, p. 48). If these thrombi are mobilized into the cardiac output, for instance during the vigorous respiratory effort of exercise, then they may occlude vessels in the coronary or cerebral circulation, causing a heart attack or stroke. Individuals with evidence of atrial fibrillation should, therefore, not be recruited into exercise programmes without careful clinical assessment.
Atrial fibrillation can be identified by two characteristics. First, no P wave exists because the action potentials that spread through the atria do not all travel in the same direction and so do not produce a reproducible voltage deflection on the ECG trace. Second, heart rate varies widely from beat to beat, in an unpredictable pattern (Fig. 2.4). This is because the disorganized direction of action potential travel means that they arrive at the A/V node at irregular intervals, with some arriving while the node cells are still in their refractory period from the previous action potential. In all other arrhythmias that involve varying heart rate there is either a progressive rise and fall in frequency (see Sinus arrhythmia, above) or intermittent insertion of extra R waves into an otherwise regular sequence (see Ventricular extrasystole, below).
Abnormal relationship between P and R waves
Damage to the cells of the A/V node may occur due to local ischaemia, inflammation, physical pressure by scar tissue or local calcification. This can have either of two separate effects on impulse conduction. In some cases there is slowing of action potential propagation with prolongation of the P–R interval beyond the normal upper limit of 200 ms, typically to 300–400 ms (Fig. 2.5A). In other cases, the effect of the damage is not to slow conduction velocity, but instead to slow calcium channel cycle time, so that following passage of one action potential the node is still refractory when the next impulse arrives. As a result, only every second or third action potential enters the ventricle and the ECG shows QRS complexes and T waves associated only with every second or third P wave (Fig. 2.5B).
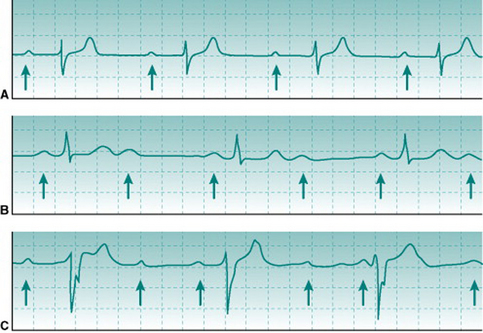
If the nodal cells are damaged severely enough then they are unable to propagate impulses at all, and ventricles and atria become electrically insulated from each other. Although the sinoatrial node continues to discharge and, therefore, P waves occur at their normal frequency, ventricular activation can originate only from within the ventricular system. The intraventricular Purkinje system contains a number of cells that have similar membrane properties to those of the sinoatrial cells but depolarize much more slowly. These cells normally never reach action potential threshold before they are activated by an impulse arriving from the A/V node. When this is prevented, however, these slower pacemakers can take over control of ventricular rhythm with frequencies in the range of 30–45 beats/min. The result is QRS complexes and T waves at a much lower frequency than that of the P waves and with no consistent association between P and R waves (Fig. 2.5C).
Clearly, lack of synchrony between atrial and ventricular pumping frequency denotes a heart that is not likely to be able to accommodate efficiently to demands for increased output. Individuals in whom you suspect A/V block should, therefore, not be recruited into exercise programmes without referral to a cardiologist.
Abnormal QRS complexes
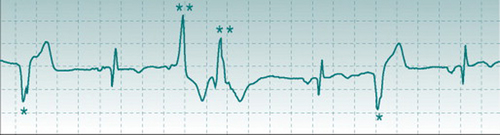 Brian K, a sedentary male, heavy smoker, 50 years old, volunteered for an exercise training study. His ECG was recorded at rest and part of the record is shown above.
Discussion
Interspersed with normal ECG waveforms, this record showed frequent R waves that were followed by T waves but were not preceded by P waves. The prolonged duration of these R waves and the fact that they were dissimilar in shape to those in the normal beats indicates that they originated from the ventricular musculature. More important, however, was the danger sign that they were of two different shapes and polarities (marked * and **), indicating that they arose from two quite different areas of the ventricular syncytium. This is often a warning of poor coronary perfusion. Brian was advised that he could not be admitted safely into the training programme and was referred to a cardiology clinic.