Calcium Signaling in Cardiomyocyte Models With Realistic Geometries
Electrophysiological Structure of the Ventricular Myocyte
Anatomy of the Myocyte Sarcolemma
The plasma membrane of ventricular myocytes, and of most mammalian striated muscle, exhibits regular invaginations that project into the cell perpendicular to its surface (Figure 33-1). These structures align with the sarcomeric Z-disc and were originally termed transverse tubules (T-tubules) for their dominant orientation with respect to the long axis of the cell. However, in most species, a large number of longitudinal branches have also been observed,1,2 and this has caused different authors to describe the lattice architecture variously as the transverse-axial-tubular system (TATS),3 the sarcolemmal tubule system,4 the T-system,5 and the sarcolemmal Z-rete.6 At a macroscopic level, the T-tubular lattice affects myocyte function through at least two important mechanisms. First, it expands VM surface area, and thereby increases the density (per unit cell volume) of all sarcolemmal transport mechanisms. Second, it provides a platform for regionalization of specialized signaling structures. Here we focus on structures that are directly involved in cardiac Ca2+ signaling; the best described are the calcium release unit (CRU; Figure 33-1, right panel) and the cardiac couplon.
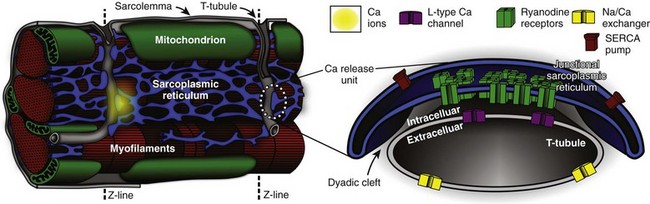
Figure 33-1 Overview of structures involved in cardiac Ca2+ handling and excitation-contraction (E-C) coupling. T-tubules are invaginations of the sarcolemma that facilitate spatiotemporal synchronization of intracellular Ca2+ release by bringing L-type Ca2+ channels (LCCs) into close proximity with most of the cell’s volume. Ca2+ release units (CRUs) juxtapose the T-tubules along their length, and the narrow space separating the jSR and the T-tubules is named the dyadic cleft. LCCs reside in the sarcolemma, predominantly at dyadic clefts, and the surface of the release unit that faces the T-tubule (the dyadic surface) contains ryanodine receptors (RyRs). In a ventricular myocyte, typically ≈20 000 CRUs are present, and these are synchronously activated during an action potential (AP). Upon arrival of the AP, LCCs open and permit Ca2+ influx, which then triggers further Ca2+ release from the sarcoplasmic reticulum (SR) via binding to local RyRs. Ca2+ release from a single CRU is called a Ca2+ spark. After a spark, the SERCA pump and the Na/Ca exchanger either resequester the released Ca2+ into the SR, or extrude it from the cell, respectively. (Left panel is retouched from Fawcett DW, McNutt NS: The ultrastructure of the cat myocardium. I. Ventricular papillary muscle. J Cell Biol 42:1–45, 1969.)
A Brief Ultrastructural History of Cardiac Excitation-Contraction (E-C) Coupling
Initial impressions of the shape and structure of the CRU first appeared roughly half a century ago—well before the function of the couplon was understood, or the term itself had been coined.7 At that time, transmission electron microscopy (EM) had shown junctions between the SR and T-tubular membranes, which, in cardiac muscle, were termed dyads for their characteristic two-component appearance in longitudinal tissue sections. A few years later, Constantin et al8 identified these SR structures as the site of intracellular calcium storage; Winegrad’s landmark study9 shortly thereafter showed that they were also the site of intracellular Ca2+ release. Facett and McNutt5 accordingly refined Porter and Palade’s well-known sketch of the cardiac sarcomere,10 and their rendition remains popular today (Figure 33-1, left panel). In this schematic, Ca2+ is released from specialized projections of the SR, which closely juxtaposes the T-tubular membrane. These projections were originally named for their anatomical appearance in transmission EM (i.e., junctional—jSR; terminal—cisternal SR) or for characteristics of physical separation (i.e., heavy SR). Over the next several decades, classic studies were published by a number of groups to define Ca2+-induced Ca2+ release (CICR) as the essential mechanism of E-C coupling occurring at cardiac dyads, and responsible for activating contraction of the heart.11,12 Key aspects of CICR are detailed in the next sections, but to review briefly, voltage-dependent opening of local L-type Ca2+ channels (LCC) permits influx of Ca2+, which binds to and activates nearby ryanodine receptors (RyRs) in the jSR membrane. This results in release, from the jSR, of the bulk of Ca2+, which goes on to participate in contraction.12
Over the past two decades, it has become clear that a number of important properties of cardiac E-C coupling are critically dependent upon the biophysical characteristics of Ca2+-mediated interaction between the LCC and RyR. These processes and phenomena will be discussed in detail below, but at this point it behooves us to introduce several terms that have been adopted to reflect fundamental structure-function relationships in the current paradigm of E-C coupling, which is known as “local control.”13 First, the term CRU refers to an individual jSR terminal and its associated RyR ensemble14 and helps to indicate the discrete functional nature of these structures, that is, individual CRUs are generally activated in an all-or-nothing fashion but are otherwise functionally isolated from one another by a sufficiently large inter-CRU diffusion distance. The term couplon was introduced to explicitly define the combination of an LCC cluster and juxtaposed CRU, which together are capable of functionally interacting to contribute to E-C coupling.7 For this reason, the couplon is, by definition, the elementary site of E-C coupling in the heart (see Figure 33-1) and along with the CRU will be a feature of much further discussion in this chapter.
Role of Imaging in Defining Cardiac Ultrastructure and Subcellular Modeling
Much of our knowledge of cardiac ultrastructure has been permitted by steadily improving approaches to both EM and light microscopy (LM). In combination with tomographic reconstruction algorithms, high-voltage EM (HVEM) has both enhanced resolution and improved penetration of thick-section preparations, which has now permitted 3-dimensional (3D) reconstruction of the T-tubule system and associated E-C coupling structures.15,16 Improvements in acquisition and analysis of LM images have now permitted imaging at or below the optical diffraction limit. This progress has brought the living T-tubule,6,17 and even the detailed morphology of individual RyR clusters,18,19 into view. Together, these techniques have been central to defining the structural characteristics of VM microdomains, describing protein localization in and around those domains, and permitting the geometrically detailed quantitative approaches we describe here.
Structure-Function Relationships at the Nanometer Scale (CRU and Couplon)
Couplon and CRU Microarchitecture
The small space between the jSR and T-tubular membranes provides a confined volume (“dyadic cleft,” “junctional cleft,” or “fuzzy space”) in which large and rapid changes in local [Ca2+] can be generated by local transporters, particularly LCCs and RyRs. This constrained architecture is fundamental to high-fidelity coupling between those transporters, and is maintained by the specialized anchoring protein, junctophilin, which tethers the jSR to the T-tubular membrane.19–21 In healthy myocytes, junctophilin keeps the distance between the jSR and the T-tubule to within 12 to 15 nm, and appears to be interspersed among the RyR molecules within the dyadic surface of the jSR membrane.19
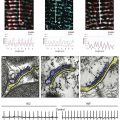
The exact numbers of LCCs and RyRs inside the couplon are still debated. Early studies employed transmission EM to measure the cross-sectional diameter of individual CRU terminals, and to show that, in mammalian cardiac muscle, RyRs form dense clusters at these terminals.22 Assuming that the CRU terminals are circular (i.e., that the size corresponds to the diameter) and are densely packed with receptors, these authors were able to approximate the number of RyRs per couplon. This estimate suggested that 130 to 150 receptors are present in mouse ventricular couplons.22 Given that the RyR tetramer is 30 nm at each side, this would require a dyad containing 100 RyRs to be 440 nm in diameter and 1.8 × 10⁻¹² µℓ in volume. Recent studies have challenged these initial estimates.15,18,23 Using 3D EM tomography, Hayashi et al15 reported that the size of each dyad is almost an order of magnitude smaller than was previously reported (mean 0.44 × 10⁻¹² µℓ) and that each dyad includes a large fraction of tiny dyads (median 0.28 × 10⁻¹² µℓ). They also showed that the density of RyRs within each CRU was sparse. By segmenting features, such as the T-tubule (green), jSR (yellow), dyadic space (white), and RyR occupancy (blue), they observed spaces within the dyad that did not contain any RyRs (Figure 33-2, E). It is interesting to note that Hayashi et al also found that 80% of all dyads have a neighboring dyad within 25 nm, which is dramatically closer than was previously thought. Using super-resolution light microscopy, Baddeley et al18 found support for most of these surprising results. They similarly observed RyR clusters to be much smaller, more closely arranged, and more irregularly shaped than had been reported or assumed in earlier work. It is not completely clear why recent studies have retrieved such different estimates of couplon size compared with those of Franzini-Armstrong et al,22 although it is at least clear that the early assumption of a circular dyadic geometry was oversimplified, and this fact may contribute to the discrepancy. Based on agreement among recent structural studies and even earlier functional work,24 it is probably safe to conclude that the number of RyRs in the average CRU is on the order of tens rather than greater than 100.
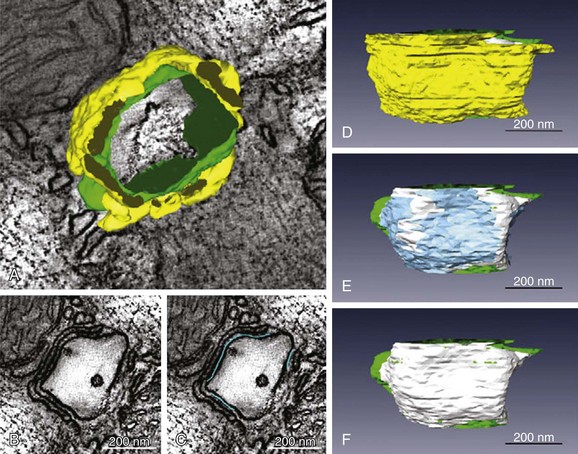
Figure 33-2 Fine anatomy of dyadic clefts in the mouse myocardium. A, High- resolution mesh models of a T-tubule (green) and jSRs (yellow) shown with a slice image; these were constructed by dual-axis electron microscopy (EM) tomography. B and C, The ultrathin serial slice images of this structure revealed inhomogeneous distribution of ryanodine receptor (RyR) feet in dyadic cleft spaces (B), and their RyR foot–rich subdomains were segmented (light blue lines in C). D through F, The intra-anatomy of three closely assembled dyadic clefts. From the complete mesh model (D), jSR membranes are removed to expose eight RyR foot–rich subdomains (the surface meshes of these subdomains are shown in light blue in E) that partially occupy dyadic cleft spaces (the whole dyadic cleft spaces are indicated as the junctional regions of T-tubular membranes in white). Both jSR meshes and meshes that identify the RyR-rich subdomains are removed in F. Scale bars: 200 nm. (From Hayashi T, et al: Three-dimensional electron microscopy reveals new details of membrane systems for Ca2+ signaling in the heart. J Cell Sci 122[Pt 7]:1005–1013, 2009.)
The observation by both Baddeley et al18 and Hayashi et al15—that many small RyR clusters exist very close to each other—may have important functional implications. Baddeley et al defined a class of RyR super clusters, which combined small clusters within 100 nm of each other, because conventional understanding suggests that these clusters would function as a single CRU. However, at some combination of short intercluster distance and low SR release flux, these clusters might be expected to exhibit a variety of spark amplitudes as the result of partial activation of the super cluster. Such subspark amplitude CRU activations have been observed experimentally and have been called quarks or sparklets.25 It is conceivable that the sparse distribution of RyRs within a single dyad (observed by Hayashi et al15) could yield such behavior, and this sparse arrangement has since been observed by other investigators.23
Immunofluorescence-based colocalization studies have definitively shown that the LCCs present in ventricular myocytes exhibit a punctate pattern of distribution, and that ∼90% of these puncta are coincident with RyR.26,27 Thus, a vast majority of LCCs are probably components of couplon structures. The number of LCCs within each couplon is less certain, as is the number of active LCCs required to trigger local Ca2+ release during physiological E-C coupling. One range of estimates suggests that 17 to 53 LCCs are likely to be involved in couplon activation28–30; others have observed higher coupling fidelities and therefore suggest that fewer LCCs are required to trigger local SR Ca2+ release.31 Part of the uncertainty here is due to discrepancy in the estimates of RyR cluster size, which are required to extrapolate the LCC number in some studies.29 Otherwise, differences in the details of approach across studies, such as the potential ranges for LCC activation and partial pharmacological inhibition of the LCC pool, have made it difficult to determine truly physiologically representative constraints for E-C coupling. Localization of the myocardial Na+/Ca2+ exchanger (NCX) is also worth mentioning at this point, as its potential involvement in E-C coupling is a long-debated topic that has recently been revisited.32 Although NCX does exhibit a punctate distribution in the T-tubules, precise colocalization of NCX with RyR occurs for only ∼10 % of the total NCX signal.27,33 With this in mind, the latter authors also note that ∼40% of NCX puncta reside within 150 nm of the nearest RyR cluster. Thus, even though NCX is probably not selectively concentrated within the dyadic portion of the T-tubular membrane, it is likely to be nearby.
The protein exhibiting strongest colocalization with RyR is calsequestrin (CSQN). A total of 95% of all CSQN labeling is coincident with RyR, and only ∼10% of RyR occur in the absence of CSQN. These observations are consistent with our understanding of the function of CSQN, which, through its ability to rapidly buffer Ca2+, acts to both limit the thermodynamic gradient that opposes SR Ca2+ reuptake and provide a large local supply of Ca2+ for RyR-mediated Ca2+ release. Finally, localization of the sarco-endoplasmic reticulum Ca2+ ATPase (SERCA2) is less clear than that of RyR or CSQN. It is generally agreed that both major (SERCA2a) and minor (SERCA2b) cardiac splice variants are present at the Z-disc, and therefore in the vicinity of the jSR.34–36 However, fluorescent labeling also appears to decorate the M-line SR,34 and no investigation to date has definitively demonstrated that SERCA2 exists within the same functional domain as RyR, and CSQN. As mentioned below, our quantitative approaches suggest that uncertainty in SERCA2 localization at this level may be functionally important, particularly with respect to Ca2+ spark dynamics.
Subcellular Modeling at the Nanometer Scale
Functional data gained from LM and patch-clamp electrophysiology have formed the basis for multiple model studies of whole-cell E-C coupling and single Ca2+ sparks over the past 20 years.37,38 A set of four specific properties of macroscopic E-C coupling, and isolated RyR function, have been used to drive and constrain the development of these computational models: (1) RyR activation should exhibit a steep and nonlinear dependence upon submembrane cytosolic [Ca2+]; (2) reliable termination of release should be achieved by experimentally defined RyR gating properties; (3) the total Ca2+ released from the SR should be about an order of magnitude larger than that entering through activated LCCs, that is, E-C–coupling gain should be high; and (4) the total Ca2+ released from the SR should be proportional to the macroscopic LCC current, that is, SR Ca2+ release should be graded by L-type Ca2+ current (ICaL).
The multiscale aspects of modeling E-C coupling became obvious quite early, as (3) and (4) are whole-cell measures, and E-C coupling is controlled locally within each of the ∼20 000 couplons in a myocyte. The first attempts to model E-C coupling used the mean cytosolic [Ca2+] as a trigger for RyR release. None of these early models, however, were able to reconcile (1) to (3) with (4).13 The remedy was to let local [Ca2+] within each CRU control the gating of the local RyRs,13,39,40 and thus “local control” models were born. These models kept a steep all-or-none control of RyR release within each couplon, and graded release was accomplished by a probabilistic recruitment of the CRUs, where CRUs were activated in proportion with ICaL. The problem of combining local control and whole-cell aspects of Ca2+ signaling is an inherently multiscale problem that has been addressed by several approaches of varying complexity.41
At the level of a single CRU, modelers have been challenged by the lack of direct measurements of local SR Ca2+ release current. Because RyRs are not members of the sarcolemma, patch-clamping techniques are not available to assay channel function in the intact cell. Instead local SR release current has been estimated from indirect measures, such as Ca2+ spark fluorescence.42 For this uncertainty, modelers have turned to functionalistic models of the CRU43 or have constrained their approaches to lipid bilayer recordings of RyRs extracted from their native environment.44 The former have been most popular in integrative models.45,46 However, we still lack a proper understanding of how models based on bilayer experiments can be incorporated into integrative models, and whether they fulfill the four E-C coupling properties previously described. One of the reasons for this is that to be able to reliably terminate a Ca2+ spark (property (2) mentioned earlier), the functionalistic models have employed Ca2+-dependent inactivation as the main termination mechanism. However, lipid bilayer experiments do not support such an inactivation mechanism at physiologically relevant cytosolic [Ca2+].47 Alternatively, experimental measurements have demonstrated that RyR channel activity is also regulated by luminal SR [Ca2+], and it has been thought for some time that this mechanism may contribute to spark termination via local jSR Ca2+ depletion.48 When luminal Ca2+ regulation was included in the model, together with a limited supply of Ca2+ in the jSR, reliable spark termination was accomplished without inactivation by cytosolic [Ca2+].49 A requirement of this model, however, is that luminal [Ca2+] is depleted to a level not supported by direct measurements during a spark.50 Sobie and Lederer recently suggested that this discrepancy may be resolved if the luminal Ca2+ signal is averaged over neighboring SR compartments, which is probably the most realistic reference to experimental measurements, where recording volumes are much larger than a single CRU.51 To determine whether physiological spark termination can be achieved with this modification, a more detailed computer model of spark generation, including Ca2+ diffusion within local SR compartments, was needed.
To that end, Hake et al managed to combine recent developments in 3D EM tomography with new techniques in computational mesh generation to develop a 3D model of the Ca2+ spark.52 The CRU geometry (Figure 33-3, A) was manually segmented from 3D EM tomography data for a mouse ventricular myocyte.15 An annotated surface mesh then was generated from the segmented features (Figure 33-3, B-E), and eventually was transformed into a volumetric tetrahedral mesh, seen in Figure 33-3, F. The SR was compartmentalized by dividing the SR geometry into individual parts (Figure 33-3, G).
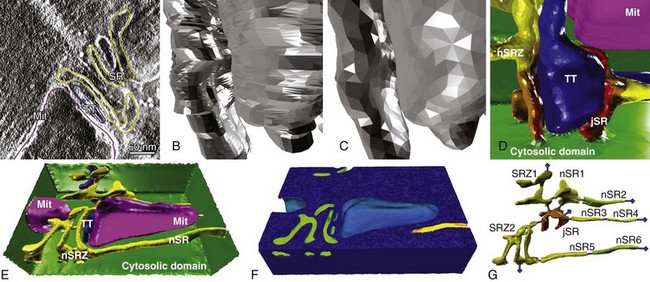
Figure 33-3 Generation of reconstructed geometries is a multistage process. A, First, features are segmented from electron tomography data. B, From the segmented data, an initial low-quality surface mesh is generated. C, The quality of the surface mesh is improved. D, The surface mesh is annotated, for easy application of boundary fluxes. Blue is the T-tubule; red, orange, and yellow show the sarcoplasmic reticulum; and purple is a mitochondrion. E, The full, annotated surface mesh. The dimensions of the mesh are 1430 × 940 × 406 nm. F, The surface mesh is converted to an annotated volumetric mesh using TetGen. G, The geometry included a full representation of the local SR. (Panels A, D, E, and G from Hake J, et al: Modeling cardiac calcium sparks in a three-dimensional reconstruction of a calcium release unit. J Physiol 590[Pt 18]:4403–4422, 2012.)
Modeling of Ca2+ Sparks in a Realistic CRU Geometry
In Hake’s model, Ca2+ release was simulated by coupling Ca2+ diffusion within the local SR to Ca2+ diffusion in the cytosol. By including the SR Ca2+ dye, Fluo5, these authors also modeled the impact of dye dynamics on experimental measurements of luminal [Ca2+]. Specific RyR dynamics were not used to define release termination in this model. Instead release was terminated such that the modeled Fluo5 signal decayed to a level corresponding with experimentally measured values.50 In this way, Hake et al applied a functionalistic termination criterion to directly relate experimentally measured Fluo5 fluorescence with jSR [Ca2+] at the end of a spark. It is important to note that these dynamics included local competition between Fluo5 and CSQN, and a maximal RyR release flux that was within the range of the best available experimental estimates. These analyses suggest that the jSR [Ca2+] at spark termination is indeed low (∼10% of resting value, see Figure 33-4, C), even though Fluo5 fluorescence decays to only 60% of the resting value.52 The available Ca2+ reserve within the neighboring SR compartments (44 %) was also comparable with experimentally measured values.53
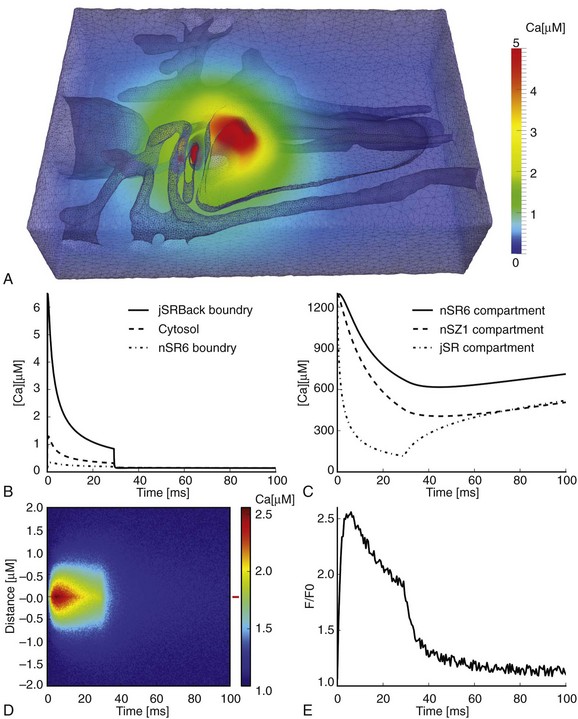
Figure 33-4 Large Ca2+ gradients within a single Ca2+ release unit (CRU). A, Volumetric representation of the [Ca2+] in the cytosolic domain after 5 ms. B, Average [Ca2+] at three different positions in the CRU: backside boundary of jSR (continuous line), the whole cytosolic domain (dashed line), and at the boundary of the 6th nSR compartment (dash-dotted line). C, Free Ca2+ content in three SR domains during a spark: the 6th nSR compartment (continuous line), the 1st Z-line SR compartment (dashed line), and the jSR compartment (dash-dotted line). D, A generated line-scan image from the cytosolic Fluo4 signal with added noise. The width and duration of the spark are 1.0 µm and 28.5 ms, respectively. E, A Fluo4 trace from the red marker at the right of the line-scan image; SR, Junctional sarcoplasmic reticulum; nSR, network sarcoplasmic reticulum. (From Hake J, et al: Modeling cardiac calcium sparks in a three-dimensional reconstruction of a calcium release unit. J Physiol 590[Pt 18]:4403–4422, 2012.)
Another advantage of the realistic geometry used in this model is that it inherently provides the correct surface area-to-volume relationship for local structures. This is crucial to finding correct quantitative relationships between the local surface fluxes represented in the model by the RyRs, SERCA, and NCX. SERCA localized close to the CRU will experience a much larger cytosolic [Ca2+] during the spark than peripherally located pumps, as is illustrated by the cytosolic [Ca2+] gradients shown in Figure 33-4, B. Hake et al identified a new potential role for the SERCA pump during the Ca2+ spark. By pumping Ca2+ back into the SR during the spark, local SERCA activity was able to slow down the depletion of luminal Ca2+, and hence increase spark duration. This was possible because at the late phase of a Ca2+ spark, when luminal Ca2+ in jSR is low and cytosolic Ca2+ close to the CRU is high, the SERCA pump operates under thermodynamically optimal conditions. This modulatory role needs to be investigated further, but it is a clear prediction of the model, which was made possible by the correct surface area-to-volume relationship for local SR components.
Future Work
Using models to quantitatively demonstrate mechanisms of disease associated with ultrastructural remodeling is a clear and important application of these techniques. To date, a couple of studies have looked at the effects of altered phosphorylation of RyR, LCC, and SERCA/phospholamban in failing cells.54–56 However, because of the lack of published structural data on disease-induced remodeling of CRU geometry, very few modeling studies have addressed this problem. Koh et al showed that spark dynamics were highly sensitive to changes in dyadic cleft height—a hypothetical characteristic of heart failure.57 For the cleft height to be changed, expression or distribution of junctophilin most probably has to be altered.58 In a model based on experimental junctophilin knockdown in the mouse, van Oort et al showed that the E-C coupling gain was lowered as a result of decreased size of the CRU.21 Similarly, Cannell et al demonstrated that increasing the height of the dyadic cleft may reduce spark synchrony during simulated E-C coupling.59 As described in next section, this lack of synchrony has become a hallmark characteristic of E-C coupling dysfunction in a variety of cardiac pathologies. To our knowledge, these studies have provided the only available theoretical analyses of disease-associated couplon remodeling. More broadly, the potential for using reconstructed geometries of the CRU to model Ca2+ sparks and other microdomain-defined processes is huge. As 3D EM tomography and super-resolution microscopy techniques improve, large volumes of ultrastructural imaging data will become available. 3D computer models enable us to investigate the structure-function relationships of localized proteins in geometrically confined environments. Therefore, many questions remain to be investigated with respect to how E-C is controlled locally, particularly those associated with the structural basis for subspark release events (quarks and sparklets) and the role of protein localization in shaping spark dynamics. It is exciting to consider what these detailed analyses can uncover if they can be scaled up to reference the volumes of data available to describe macroscopic properties of E-C coupling.
Structure-Function Relationships at the Micron Scale (T-Tubule and T-System)
T-Tubule Microanatomy and Its Role in Regulating E-C Coupling
As is true for the CRU, advancements in imaging modalities have driven progress in defining the architecture of cardiac T-tubules, and a consistent finding among these studies is the strong species specificity of T-tubular structure. In the rat, the average ventricular tubule is ∼250 nm in diameter, and exhibits longitudinal (axial) branches every 6.87 µm.6 Rabbit and human myocytes generally have larger T-tubular diameters (∼450 nm), and exhibit less pronounced branching.1,17,60,61 This frequency of T-tubular branching indicates a key aspect of species differences in the relationship between T-tubular structure and function: The T-tubular rete of rodents is generally more intricate than that of larger mammals, particularly humans. The most important outcome of this complex branching is a decreased distance from any part of the cytoplasm to the sarcolemmal membrane, within the rodent cell. Two-dimensional analyses of transverse sections indicate that, in the human, ∼64% of the cytoplasm resides within 250 nm of a T-tubular membrane, compared with ∼94% in the rat.1 It is generally held that this intricate lattice-like structure facilitates a more synchronous Ca2+ release in the roden (e.g., mice, rats, squirrels, porcupine, beavers, guinea, hamsters), thereby reducing the intracellular heterogeneity of E-C coupling, which may be necessary to support efficient contraction at the very high heart rates of these animals. As we describe at the end of this chapter, this principle probably also applies in the converse under circumstances of pathologic remodeling, which degrades the lattice architecture, resulting in a sparse T-tubular architecture.
Although it has not been directly tested, a commonly held hypothesis is that these differences in T-tubular density influence E-C coupling by altering the density of functional couplons. As described earlier, CRU nearest neighbor distances (from the edge of one CRU to the edge of its closest adjacent CRU) appear to be somewhere on the order of tens of nanometers in the rat.15,18 Center-to-center distances are larger on average, typically 300 to 800 nm.18,22,26 These distances are ∼15% to 50% greater in the human, resulting in an RyR cluster density (per unit cell volume) that is roughly halved compared with that of the rat.62 Remodeling accompanying heart failure, also in humans, reduces RyR cluster density by a further 20%,61 and, as is described below, the density of functional couplons is probably even more severely degraded by pathologic remodeling.
As is true within the couplon, protein localization is a key component of T-tubular structure-function relationships, and a number of sarcolemmal transporters are selectively enriched within the T-tubules. Functionalistic approaches involving rapid changes in permeant ion concentration, or experimental detubulation, indicate that currents carried by LCC,63,64 NCX,65 and Na+/K+-ATPase65,66 exhibit a dominant T-tubular distribution. The fold enrichment (ICaL : INaCa:INaK) of each of these currents, with respect to the surface sarcolemma, and after accounting for differences in corresponding membrane areas, is approximately 6 : 3 : 3.63 It is interesting to note that the neuronal Na+ current (INaN), which has recently been proposed to be a driver of reverse mode INaCa,32 exhibits strong T-tubular localization (∼9-fold), as does the sustained K+ current (ISS).60 Other K+ currents appear to be homogeneously distributed. Many of these current carriers are sensitive to local ionic concentrations, particularly Na+ and Ca2+, and this is just one reason why spatially realistic quantitative models will be fundamental in developing a complete understanding of their function.
Subcellular Modeling at the Micron Scale
Whole-cell computational models have proved to be powerful tools for predicting and analyzing interactions among sarcolemmal ion fluxes, the action potential, and intracellular Ca2+ handling under normal and pathologic conditions. For a complete view of successes and failures in modeling pursuits of this type, we refer the reader to excellent recent reviews from Noble and colleagues.67,68 Using whole-cell modeling approaches, Orchard and collaborators also investigated how changes in T-system volume and distribution of ion fluxes between the surface and the T-tubular membrane affect whole-cell electrophysiology.69,70 However, as was the case for modeling of the couplon, an important limitation of these whole-cell models is that they treat subcellular spaces as lumped compartments, and are thus unable to dissect the impact of structural changes in the T-tubule system and other organelles. To overcome this limitation, recent modeling approaches have introduced simplified representations of T-system geometry to enable introduction of spatial control of Ca2+ handling. In rodents, Lu et al and Yao and Yu assumed a cylindrical T-tubule geometry.71,72 These studies suggest that the Ca2+ transient is tightly regulated by the localization of sarcolemmal Ca2+ transporters and is strongly reliant upon the presence of Ca2+ buffers when SR Ca2+ fluxes are pharmacologically inhibited. Hatano and collaborators73,74 extended the approach of Lu et al by developing a detailed 3D geometric model of a guinea pig cardiomyocyte in which the subcellular structures (T-tubules, myofibrils, SR, mitochondria) were modeled using simplified geometries. Their analyses of sarcomere dynamics revealed that the dyssynchronous contraction caused by detubulation leads to impairment of contractile efficiency.
The use of idealistic shapes, however, may alter diffusion distances in longitudinal and axial directions and, consequently, the predicted local and global Ca2+ signals. Using published images of T-tubule ultrastructure from rodents and rabbits, investigators have examined Ca2+ dynamics in 3D reconstructions of single-tubule and multi-tubule geometric domains.75–77 Before discussing work that has made use of this relatively new paradigm in subcellular modeling, it is best to briefly describe the process by which these geometries are generated.
3D Imaging and Geometric Modeling of a Native Ventricular T-Tubular System
As has been described, Hake et al made use of 3D EM tomograms to generate a computational geometry of a single CRU, but it is not only EM data that can be used for these purposes. The gap between imaging and simulation involves two major steps: (1) extracting features (boundary or skeleton) from imaging data; and (2) constructing geometric models (represented by meshes) from the detected features. Thus, the simple requirement of this approach is that the imaging modality provides sufficient resolution and dimension to both (1) capture the volume of the desired microarchitectural feature; and (2) permit sufficiently accurate segmentation of that feature. To this end, image preprocessing is usually necessary for better feature extraction, particularly when the original image is noisy, or the contrast between features and background is low. With 3D two-photon microscopy (T-PM) images, Yu and collaborators developed a set of image processing and analysis tools, which, combined with the mesh generator, GAMer, were able to generate high-quality meshes for 3D T-tubular systems in mice (Figure 33-5, lower left).16,78
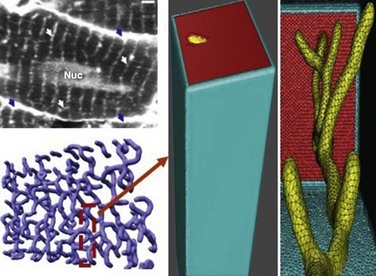
Figure 33-5 The rodent ventricular T-tubular network and a single-tubule geometric model. Upper left panel: Cardiac sarcolemma including T-tubules is visualized by 2-photon microscopy: external membrane (blue arrows); T-tubules (white arrows); nucleus (Nuc); bar 2 µm. Lower left panel: Geometric model of the T-tubule subsystem extracted from the 2-photon image. Middle and right panels: Expanded view of single T-tubule geometry and its surrounding half-sarcomeres. (Adapted from Cheng Y, et al: Numerical analysis of Ca2+ signaling in rat ventricular myocytes with realistic transverse-axial tubular geometry and inhibited sarcoplasmic reticulum. PLoS Comput Biol 6:e1000972, 2010.)
Modeling the Effects of Normal T-Tubule Ultrastructure on Subcellular Ca2+ Signals
Cheng and collaborators75 used the Yu et al16 geometry to investigate the role of individual T-tubular architecture and Ca2+ buffer activity in determining the characteristics of Ca2+ signaling in rat ventricular myocytes. A small compartment containing a single T-tubule and its surrounding half-sarcomeres was considered because the entire T-tubular system in ventricular myocytes is roughly periodic.15,79 The surrounding half-sarcomeres were modeled as a rectangular box of 2 µm × 2 µm in the plane of external sarcolemma and 5.96 µm in depth (Figure 33-5, middle). Because Yu’s T-tubule model did not include the realistic cell surface, one of the box faces (top red surfaces in Figure 33-5) was assumed to be the external sarcolemma. The T-tubule inside this compartment was extracted from the T-PM data corresponding to the region indicated in Figure 33-5 (lower left). T-tubule diameter varied from 0.19 µm to 0.469 µm, and T-tubule depth was 5.645 µm. The volume of the model compartment was ∼23.31 µm3. The compartment membrane area measured ∼9.00 µm2 where the percentage of cell membrane within the T-tubule was 64% (∼5.75 µm2), and that within the external membrane was 36% (∼3.25 µm2). Four exogenous and endogenous Ca2+ buffers (Fluo3, ATP, calmodulin, and troponin C) were modeled within the cytosolic domain (Figure 33-6, left panel). When 100 µM Fluo3 was included, along with ∼1.7-fold enrichment of LCC and 3-fold enrichment of NCX in the T-tubular membrane, the model-predicted [Ca2+] dynamics closely resembled experimental data collected in rat ventricular myocytes with blocked SR Ca2+ fluxes80 (Figure 33-6, right panels). Counterintuitively, when LCC density was heterogeneously distributed within the T-tubule model, the spatial heterogeneity of cytosolic [Ca2+] was reduced relative to a homogeneous sarcolemmal LCC distribution. Strongly nonuniform spatial Ca2+ gradients, not observed during experiments, were found when LCC and NCX fluxes were uniformly distributed along the sarcolemma. This unexpected result may be due to the high curvature of the membrane near the mouth of the T-tubule, which increases the LCC flux per unit cytosolic volume in that region. When the LCC distribution is homogeneous, this effect is exaggerated at these points of high curvature. A second important finding of this study, which may contribute to the effects regarding LCC distribution, is that including the mobile Ca2+ buffering effect of 100 µM Fluo3, allowed masking of spatial nonuniformities in cytosolic [Ca2+] that occurred in the absence of dye (even when Ca2+ transporters were heterogeneously distributed). Thus, during physiological Ca2+ influx, (i.e., no Fluo3), large and steep Ca2+ gradients might be expected in the narrow subsarcolemmal space (∼40 to 50 nm in depth). It is interesting to note that in examining rabbit cells, Kekenes-Huskey et al revealed qualitatively similar results to those of Cheng et al. Local [Ca2+] gradients within the cytosol and subsarcolemmal regions were highly sensitive to details of T-tubule ultrastructure and membrane Ca2+ flux distribution, when SR Ca2+ fluxes were blocked.76 For this reason, it seems likely that several of the key effects of single T-tubule microarchitecture on local Ca2+ dynamics are conserved across species.
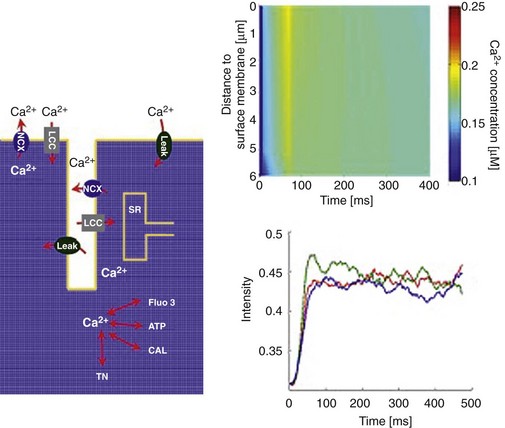
Figure 33-6 Left panel: Diagram illustrating Ca2+ entry and extrusion via the sarcolemma, and Ca2+ buffering and diffusion inside the cytosol with sarcoplasmic reticulum (SR) Ca2+ fluxes pharmacologically blocked: L-type Ca2+ channel (LCC); Na+/Ca2+ exchanger (NCX); membrane Ca2+ leak (Leak); sarcoplasmic reticulum (SR); troponin C (TN), adenosine triphosphate (ATP); calmodulin (CAL); Ca2+ fluorophore (Fluo3). Upper right panel: Calcium concentrations visualized as line-scan images in the transverse cell direction. LCC current density heterogeneously distributed along the length of the T-tubule. Na+/Ca2+ flux density was three times higher in the T-tubule, and the Ca2+ leak current was homogeneously distributed. Line scan was positioned 200 nm from the T-tubule membrane at an angle of 120 degrees. Lower right panel: Local Ca2+ time courses with re-plot from experimental data.80 The re-plots are taken along the scan line at 0 µm (blue), 3.96 µm (green), and 5.65 µm (red) from the near-surface location. The scan line in the Cheng et al experiments80 was located 200 nm from the surface of the T-tubule. (Adapted from Cheng Y, et al: Numerical analysis of Ca2+ signaling in rat ventricular myocytes with realistic transverse-axial tubular geometry and inhibited sarcoplasmic reticulum. PLoS Comput Biol 6:e1000972, 2010.)
In attempting to reach beyond these limitations, Yu et al extended the approach of Cheng et al by reconstructing a 3D geometry of several T-tubules in the mouse.77 Briefly, this study affirmed that local Ca2+ dynamics are sharply affected by T-system ultrastructure and Ca2+ fluxes at the surface membrane. Finally, Soeller et al constructed a model of stochastic Ca2+ dynamics in rat myocytes using measured 3D distributions of RyR clusters, which are adjacent to the T-system.81 These authors found that spatial irregularities of RyR cluster distribution may significantly influence Ca2+ dynamics, although the role of T-tubular microanatomy was not directly assessed in that study.
Toward a Quantitative Understanding of Pathologic T-Tubule Remodeling
Over the past 5 to 15 years, remodeling of the T-tubular lattice has emerged as a consistent characteristic of a number of cardiac pathologies82 and across a range of species, including humans.61,83 The characteristics and pathology specificity of these processes are not yet firmly established. However, various investigators have observed a reduction in the number or density of T-tubules,83 expansion of T-tubular diameter,61 and/or an increase in the prevalence of axial/longitudinal tubule elements.84 A consistent functional outcome associated with these remodeling processes is reduced synchrony of CICR,82,85 which is generally thought to contribute to contractile dysfunction.
The precise mechanisms by which remodeling leads to CICR dyssynchrony are not completely clear, although decoupling of RyR clusters appears to be the dominant end point.86,87 This decoupling may occur through orphaning of entire T-tubules from the surface membrane, such that they can no longer conduct the AP to their associated CRUs, or as the result of local changes in couplon geometry that orphan individual receptor clusters. As was mentioned earlier, it is also possible that reduced overall CRU density causes heterogeneity in Ca2+ release accompanying T-tubule loss.61 The approach presented by Heinzel et al85 offers some promise for describing these structure-function relationships experimentally. These authors measured regional CICR kinetics and T-tubular density in the same patch-clamped myocytes. Although they did not quantitatively correlate delayed CICR with distance from the local T-tubule, they were able to characterize spark kinetics at sites that were designated as decoupled based on the latency of their activation.
To date, no modeling study has attempted to explicitly simulate the effects of T-tubular remodeling with realistic geometries. As mentioned earlier, some researchers have taken idealized approaches to understanding how increases in junctional cleft width promote heterogeneity in CICR latency59 or E-C coupling gain,21 but more complex structural changes have not been investigated. These questions remain an obvious target of the approaches we have described in this chapter.
References
1. Jayasinghe, I, et al. Comparison of the organization of t-tubules, sarcoplasmic reticulum and ryanodine receptors in rat and human ventricular myocardium. Clin Exp Pharmacol Physiol. 2012; 39:469–476.
2. Sommer, JR, Waugh, RA. The ultrastructure of the mammalian cardiac muscle cell—with special emphasis on the tubular membrane systems: A review. Am J Pathol. 1976; 82:192–232.
3. Forbes, MS, Hawkey, LA, Sperelakis, N. The transverse-axial tubular system (TATS) of mouse myocardium: Its morphology in the developing and adult animal. Am J Anat. 1984; 170:143–162.
4. Bers, D. Excitation Contraction Coupling and Cardiac Contractile Force. Boston: Kluwer Academic Publishers; 2001.
5. Fawcett, DW, McNutt, NS. The ultrastructure of the cat myocardium. I. Ventricular papillary muscle. J Cell Biol. 1969; 42:1–45.
6. Soeller, C, Cannell, MB. Examination of the transverse tubular system in living cardiac rat myocytes by 2-photon microscopy and digital image-processing techniques. Circ Res. 1999; 84:266–275.
7. Stern, MD, Pizarro, G, Rios, E. Local control model of excitation-contraction coupling in skeletal muscle. J Gen Physiol. 1997; 110:415–440.
8. Constantin, LL, Franzini-Armstrong, C, Podolsky, RJ. Localization of calcium-accumulating structures in striated muscle fibers. Science. 1965; 147:158–160.
9. Winegrad, S. Autoradiographic studies of intracellular calcium in frog skeletal muscle. J Gen Physiol. 1965; 48:455–479.
10. Porter, KR, Palade, GE. Studies on the endoplasmic reticulum. III. Its form and distribution in striated muscle cells. J Biophys Biochem Cytol. 1957; 3:269–300.
11. Endo, M, Tanaka, M, Ogawa, Y. Calcium induced release of calcium from the sarcoplasmic reticulum of skinned skeletal muscle fibres. Nature. 1970; 228:34–36.
12. Fabiato, A, Fabiato, F. Contractions induced by a calcium-triggered release of calcium from the sarcoplasmic reticulum of single skinned cardiac cells. J Physiol. 1975; 249:469–495.
13. Stern, MD. Theory of excitation-contraction coupling in cardiac muscle. Biophys J. 1992; 63:497–517.
14. Isenberg, G, Han, S. Gradation of Ca(2+)-induced Ca2+ release by voltage-clamp pulse duration in potentiated guinea-pig ventricular myocytes. J Physiol. 1994; 480(Pt 3):423–438.
15. Hayashi, T, et al. Three-dimensional electron microscopy reveals new details of membrane systems for Ca2+ signaling in the heart. J Cell Sci. 2009; 122(Pt 7):1005–1013.
16. Yu, Z, et al. Three-dimensional geometric modeling of membrane-bound organelles in ventricular myocytes: Bridging the gap between microscopic imaging and mathematical simulation. J Struct Biol. 2008; 164:304–313.
17. Savio-Galimberti, E, et al. Novel features of the rabbit transverse tubular system revealed by quantitative analysis of three-dimensional reconstructions from confocal images. Biophys J. 2008; 95:2053–2062.
18. Baddeley, D, et al. Optical single-channel resolution imaging of the ryanodine receptor distribution in rat cardiac myocytes. Proc Natl Acad Sci U S A. 2009; 106:22275–22280.
19. Jayasinghe, ID, et al. Nanoscale organization of junctophilin-2 and ryanodine receptors within peripheral couplings of rat ventricular cardiomyocytes. Biophys J. 2012; 102:L19–L21.
20. Takeshima, H, et al. Junctophilins: A novel family of junctional membrane complex proteins. Mol Cell. 2000; 6:11–22.
21. van Oort, RJ, et al. Disrupted junctional membrane complexes and hyperactive ryanodine receptors after acute junctophilin knockdown in mice. Circulation. 2011; 123:979–988.
22. Franzini-Armstrong, C, Protasi, F, Ramesh, V. Shape, size, and distribution of Ca(2+) release units and couplons in skeletal and cardiac muscles. Biophys J. 1999; 77:1528–1539.
23. Asghari, P, et al. The structure and functioning of the couplon in the mammalian cardiomyocyte. Protoplasma. 2012; 249(Suppl 1):S31–S38.
24. Bridge, JH, Ershler, PR, Cannell, MB. Properties of Ca2+ sparks evoked by action potentials in mouse ventricular myocytes. J Physiol. 1999; 518(Pt 2):469–478.
25. Brochet, DX, et al. Quarky calcium release in the heart. Circ Res. 2011; 108:210–218.
26. Scriven, DR, et al. Analysis of Cav1. 2 and ryanodine receptor clusters in rat ventricular myocytes. Biophys J. 2010; 99:3923–3929.
27. Scriven, DR, Dan, P, Moore, ED. Distribution of proteins implicated in excitation-contraction coupling in rat ventricular myocytes. Biophys J. 2000; 79:2682–2691.
28. Louch, WE, et al. Control of Ca2+ release by action potential configuration in normal and failing murine cardiomyocytes. Biophys J. 2010; 99:1377–1386.
29. Polakova, E, et al. Local calcium release activation by DHPR calcium channel openings in rat cardiac myocytes. J Physiol. 2008; 586:3839–3854.
30. Sobie, EA, Ramay, HR. Excitation-contraction coupling gain in ventricular myocytes: Insights from a parsimonious model. J Physiol. 2009; 587(Pt 6):1293–1299.
31. Altamirano, J, Bers, DM. Voltage dependence of cardiac excitation-contraction coupling: Unitary Ca2+ current amplitude and open channel probability. Circ Res. 2007; 101:590–597.
32. Torres, NS, et al. Na+ currents are required for efficient excitation-contraction coupling in rabbit ventricular myocytes: A possible contribution of neuronal Na+ channels. J Physiol. 2010; 588(Pt 21):4249–4260.
33. Jayasinghe, ID, Cannell, MB, Soeller, C. Organization of ryanodine receptors, transverse tubules, and sodium-calcium exchanger in rat myocytes. Biophys J. 2009; 97:2664–2673.
34. Dally, S, et al. Multiple and diverse coexpression, location, and regulation of additional SERCA2 and SERCA3 isoforms in nonfailing and failing human heart. J Mol Cell Cardiol. 2010; 48:633–644.
35. Greene, AL, et al. Overexpression of SERCA2b in the heart leads to an increase in sarcoplasmic reticulum calcium transport function and increased cardiac contractility. J Biol Chem. 2010; 275:24722–24727.
36. Vangheluwe, P, et al. Ca2+ transport ATPase isoforms SERCA2a and SERCA2b are targeted to the same sites in the murine heart. Cell Calcium. 2003; 34:457–464.
37. Soeller, C, Cannell, MB. Analysing cardiac excitation-contraction coupling with mathematical models of local control. Prog Biophys Mol Biol. 2004; 85:141–162.
38. Williams, GS, et al. Models of cardiac excitation-contraction coupling in ventricular myocytes. Math Biosci. 2010; 226:1–15.
39. Greenstein, JL, Winslow, RL. An integrative model of the cardiac ventricular myocyte incorporating local control of Ca2+ release. Biophys J. 2002; 83:2918–2945.
40. Hinch, R, et al. A simplified local control model of calcium-induced calcium release in cardiac ventricular myocytes. Biophys J. 2004; 87:3723–3736.
41. Williams, GS, et al. Models of cardiac excitation-contraction coupling in ventricular myocytes. Math Biosci. 2010; 226:1–15.
42. Cheng, H, Lederer, WJ, Cannell, MB. Calcium sparks: Elementary events underlying excitation-contraction coupling in heart muscle. Science. 1993; 262:740–744.
43. Stern, MD, et al. Local control models of cardiac excitation-contraction coupling: A possible role for allosteric interactions between ryanodine receptors. J Gen Physiol. 1999; 113:469–489.
44. Zahradnik, I, Gyorke, S, Zahradnikova, A. Calcium activation of ryanodine receptor channels—reconciling RyR gating models with tetrameric channel structure. J Gen Physiol. 2005; 126:515–527.
45. Tanskanen, AJ, et al. Protein geometry and placement in the cardiac dyad influence macroscopic properties of calcium-induced calcium release. Biophys J. 2007; 92:3379–3396.
46. Winslow, RL, et al. Integrative modeling of the cardiac ventricular myocyte. Wiley Interdiscip Rev Syst Biol Med. 2011; 3:392–413.
47. Laver, DR, Honen, BN. Luminal Mg2+, a key factor controlling RYR2-mediated Ca2+ release: Cytoplasmic and luminal regulation modeled in a tetrameric channel. J Gen Physiol. 2008; 132:429–446.
48. Gyorke, S, et al. Regulation of sarcoplasmic reticulum calcium release by luminal calcium in cardiac muscle. Front Biosci. 2002; 7:1454–1463.
49. Sobie, EA, et al. Termination of cardiac Ca(2+) sparks: An investigative mathematical model of calcium-induced calcium release. Biophys J. 2002; 83:59–78.
50. Zima, AV, et al. Termination of cardiac Ca2+ sparks: Role of intra-SR [Ca2+], release flux, and intra-SR Ca2+ diffusion. Circ Res. 2008; 103:e105–e115.
51. Sobie, EA, Lederer, WJ. Dynamic local changes in sarcoplasmic reticulum calcium: Physiological and pathophysiological roles. J Mol Cell Cardiol. 2012; 52:304–311.
52. Hake, J, et al. Modeling cardiac calcium sparks in a three-dimensional reconstruction of a calcium release unit. J Physiol. 2012; 590(Pt 18):4403–4422.
53. Antoons, G, et al. Mechanisms underlying the frequency dependence of contraction and [Ca(2+)](i) transients in mouse ventricular myocytes. J Physiol. 2002; 543(Pt 3):889–898.
54. Hashambhoy, YL, Greenstein, JL, Winslow, RL. Role of CaMKII in RyR leak, EC coupling and action potential duration: A computational model. J Mol Cell Cardiol. 2010; 49:617–624.
55. Saucerman, JJ, Bers, DM. Calmodulin binding proteins provide domains of local Ca2+ signaling in cardiac myocytes. J Mol Cell Cardiol. 2008; 52:312–316.
56. Stokke, MK, et al. Ca(2+) wave probability is determined by the balance between SERCA2-dependent Ca(2+) reuptake and threshold SR Ca(2+) content. Cardiovasc Res. 2011; 90:503–512.
57. Koh, X, et al. A 3D Monte Carlo analysis of the role of dyadic space geometry in spark generation. Biophys J. 2006; 90:1999–2014.
58. Wei, S, et al. T-tubule remodeling during transition from hypertrophy to heart failure. Circ Res. 2010; 107:520–531.
59. Cannell, MB, Crossman, DJ, Soeller, C. Effect of changes in action potential spike configuration, junctional sarcoplasmic reticulum micro-architecture and altered t-tubule structure in human heart failure. J Muscle Res Cell Motil. 2006; 27:297–306.
60. Brette, F, Orchard, C. T-tubule function in mammalian cardiac myocytes. Circ Res. 2003; 92:1182–1192.
61. Crossman, DJ, et al. Changes in the organization of excitation-contraction coupling structures in failing human heart. PLoS One. 2011; 6:e17901.
62. Soeller, C, et al. Analysis of ryanodine receptor clusters in rat and human cardiac myocytes. Proc Natl Acad Sci U S A. 2007; 104:14958–14963.
63. Brette, F, Orchard, C. Resurgence of cardiac t-tubule research. Physiology (Bethesda). 2007; 22:167–173.
64. Pasek, M, et al. Quantification of t-tubule area and protein distribution in rat cardiac ventricular myocytes. Prog Biophys Mol Biol. 2008; 96:244–257.
65. Despa, S, et al. Na/Ca exchange and Na/K-ATPase function are equally concentrated in transverse tubules of rat ventricular myocytes. Biophys J. 2003; 85:3388–3396.
66. Despa, S, Bers, DM. Functional analysis of Na+/K+-ATPase isoform distribution in rat ventricular myocytes. Am J Physiol Cell Physiol. 2007; 293:C321–C327.
67. Noble, D. Successes and failures in modeling heart cell electrophysiology. Heart Rhythm. 2011; 8:1798–1803.
68. Noble, D, Garny, A, Noble, PJ. How the Hodgkin-Huxley equations inspired the cardiac Physiome Project. J Physiol. 2012; 590(Pt 11):2613–2628.
69. Pasek, M, Simurda, J, Christe, G. The functional role of cardiac T-tubules explored in a model of rat ventricular myocytes. Philos Transact A Math Phys Eng Sci. 2006; 364:1187–1206.
70. Pasek, M, Simurda, J, Orchard, CH. Role of t-tubules in the control of trans-sarcolemmal ion flux and intracellular Ca(2+) in a model of the rat cardiac ventricular myocyte. Eur Biophys J. 2012; 41:491–503.
71. Lu, S, et al. Multiscale modeling in rodent ventricular myocytes. IEEE Eng Med Biol Mag. 2009; 28:46–57.
72. Yao, G, Yu, Z. A localized meshless approach for modeling spatial-temporal calcium dynamics in ventricular myocytes. Int J Numer Method Biomed Eng. 2012; 28:187–204.
73. Hatano, A, et al. Critical role of cardiac t-tubule system for the maintenance of contractile function revealed by a 3D integrated model of cardiomyocytes. J Biomech. 2012; 45:815–823.
74. Hatano, A, et al. A three-dimensional simulation model of cardiomyocyte integrating excitation-contraction coupling and metabolism. Biophys J. 2011; 101:2601–2610.
75. Cheng, Y, et al. Numerical analysis of Ca2+ signaling in rat ventricular myocytes with realistic transverse-axial tubular geometry and inhibited sarcoplasmic reticulum. PLoS Comput Biol. 2010; 6:e1000972.
76. Kekenes-Huskey, PM, Cheng, Y, Hake, J, et al. Modeling effects of L-type Ca2+ current and Na2+-Ca2+ exchanger on Ca2+ trigger flux in rabbit myocytes with realistic T-tubule geometries. Front Comp Physiol Med: Calcium Signaling in Cardiac Myocyte. 2012; 3:351.
77. Yu, Z, et al. Multiscale modeling of calcium dynamics in ventricular myocytes with realistic transverse tubules. IEEE Trans Biomed Eng. 2011; 58:2947–2951.
78. Yu, Z, et al. Feature-preserving adaptive mesh generation for molecular shape modeling and simulation. J Mol Graph Model. 2008; 26:1370–1380.
79. Bers, DM, Despa, S. Na+ transport in cardiac myocytes: Implications for excitation-contraction coupling. IUBMB Life. 2009; 61:215–221.
80. Cheng, H, Cannell, MB, Lederer, WJ. Propagation of excitation-contraction coupling into ventricular myocytes. Pflugers Arch. 1994; 428:415–417.
81. Soeller, C, et al. Three-dimensional high-resolution imaging of cardiac proteins to construct models of intracellular Ca2+ signalling in rat ventricular myocytes. Exp Physiol. 2009; 94:496–508.
82. Louch, WE, Sejersted, OM, Swift, F. There goes the neighborhood: Pathological alterations in T-tubule morphology and consequences for cardiomyocyte Ca2+ handling. J Biomed Biotechnol. 2010; 2010:503906.
83. Lyon, AR, et al. Loss of T-tubules and other changes to surface topography in ventricular myocytes from failing human and rat heart. Proc Natl Acad Sci U S A. 2009; 106:6854–6859.
84. Louch, WE, et al. T-tubule disorganization and reduced synchrony of Ca2+ release in murine cardiomyocytes following myocardial infarction. J Physiol. 2006; 574(Pt 2):519–533.
85. Heinzel, FR, et al. Remodeling of T-tubules and reduced synchrony of Ca2+ release in myocytes from chronically ischemic myocardium. Circ Res. 2008; 102:338–346.
86. Biesmans, L, et al. Subcellular heterogeneity of ryanodine receptor properties in ventricular myocytes with low T-tubule density. PLoS One. 2011; 6:e25100.
87. Song, LS, et al. Orphaned ryanodine receptors in the failing heart. Proc Natl Acad Sci U S A. 2006; 103:4305–4310.