Chapter 6
Blood Gases and Related Tests
1. Describe how pH and Pco2 are used to assess acid-base status.
2. Interpret Po2 and oxygen saturation to assess oxygenation.
3. Identify the appropriate procedure for obtaining an arterial blood gas specimen.
4. List situations in which pulse oximetry can be used to evaluate a patient’s oxygenation.
1. Describe at least two limitations of pulse oximetry.
2. Describe the use of capnography to assess changes in ventilation-perfusion patterns of the lung.
3. Assess oxygenation, using arterial oxygen content.
4. Calculate the shunt fraction, using appropriate laboratory data.

The chapter addresses how blood gas measurements are used in the pulmonary function laboratory. A complete description of blood gas electrodes and other measuring devices is included in Chapter 11. The use of pulse oximetry and capnography as adjuncts to traditional invasive measures is discussed. Two methods of calculating shunt fraction are detailed so that the most appropriate method may be used.
Oxygen tension
Po2 measures the partial pressure exerted by oxygen (O2) dissolved in the blood. Like Pco2, it is recorded in millimeters of mercury or in kilopascals. The normal range for arterial Po2 is 70–100 mm Hg (10.64–13.30 kPa) for healthy young adults breathing air at sea level. The normal range declines slightly in older adults. Mixed venous Po2 averages 40 mm Hg (5.32 kPa) in healthy patients. Barometric pressure (at altitudes significantly above sea level) also influences the expected arterial Po2 (see Evolve site http://evolve.elsevier.com/Mottram/Ruppel/ for Conversion and Correction Factors).
Techniques
pH
Blood pH is measured by exposing the specimen to a glass electrode (see Figure 11-28) or by measuring light absorbance with an optical pH indicator under anaerobic conditions. pH measurements are made at 37°C. The pH of arterial blood is related to the Paco2 by the
Henderson-Hasselbalch equation:
pK=negative log of dissociation constant for carbonic acid (6.1)
 []=molar concentration of serum bicarbonate
[CO2]=molar concentration of CO2
Carbon Dioxide Tension
Pco2 has been measured traditionally by exposing whole blood to a modified pH electrode contained in a jacket with a Teflon membrane at its tip (see Chapter 11). The jacket contains a bicarbonate buffer. As CO2 diffuses through the membrane, it combines with water to form carbonic acid (H2CO3). The H2CO3 dissociates into H+ and  , thereby changing the pH of the bicarbonate buffer. The change in pH is measured by the electrode and is proportional to the Pco2. Newer blood gas analyzers use a spectrophotometer to measure the absorbance of CO2 in the infrared portion of the spectrum. The blood must be anticoagulated and kept in an anaerobic state until analysis. Pco2 may also be estimated using a transcutaneous electrode. Measurement of end-tidal CO2 (Petco2) is sometimes used to track Pco2 (see later section, Capnography).


Oxygen Tension
The Po2 (arterial or mixed venous) has been traditionally measured by exposing whole blood, obtained anaerobically, to a platinum electrode covered with a thin polypropylene membrane. This type of electrode is called a polarographic electrode or Clark electrode. Oxygen molecules are reduced at the platinum cathode after diffusing through the membrane (see Chapter 11). Newer blood gas analyzers use an optical system that senses the ability of O2 to change the intensity and duration of phosphorescence in a phosphorescent dye. Po2 may also be measured using a transcutaneous electrode (see Chapter 11).
Blood gas values (pH, Pco2, Po2) are influenced by the patient’s temperature. Alteration of body temperature affects the partial pressure of dissolved CO2, which influences pH as described in the previous equations. Table 6-1 describes the expected blood gas changes when the patient’s temperature is not 37°C. Although blood gas measurements are made at 37°C, the value reported is sometimes corrected to the patient’s temperature.
Table 6-1
Effects of Body Temperature on Blood Gas Values*
| Temperature (°C) | 34° | 37° | 40° |
| pH | 7.44 | 7.40 | 7.36 |
| Pco2 | 35 | 40 | 46 |
| Po2 | 79 | 95 | 114 |
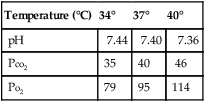
*Temperature corrections based on algorithms from CLSI (formerly NCCLS): C46-A2. Definitions of quantities and conventions related to blood pH and gas analysis; approved standard, 2009.
Specimen Collection for Blood Gases
Before a radial artery puncture, adequacy of collateral circulation to the hand from the ulnar artery should be established, using the modified Allen’s test (Figure 6-1). The original Allen’s test was described by Dr. Edgar Allen, a vascular surgeon at the Mayo Clinic in the 1920s, to assist in the diagnosis of thromboangiitis obliterans (e.g., Raynaud’s disease). A positive test in his description denoted reduced circulation; however, using the modified technique, a “positive test” demonstrates adequate collateral circulation. In performing the modified Allen’s test, the technologist occludes both the radial and ulnar arteries by pressing down over the wrist. The patient is instructed to make a fist, then open the hand and relax the fingers. The palm of the hand is pale and bloodless because both arteries are occluded. The ulnar artery is released while the radial remains occluded. The hand should be reperfused rapidly (5–15 seconds) if the ulnar supply is adequate. If perfusion is inadequate, an alternative site should be used.
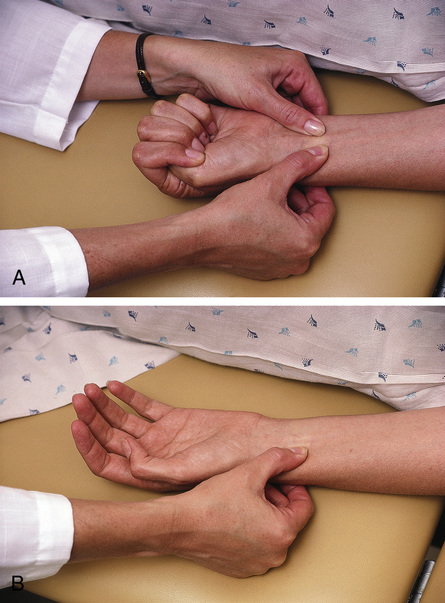
The modified Allen’s test assesses collateral circulation for the hand. A “positive test” demonstrates adequate collateral circulation and the radial artery may be used to harvest an arterial blood gas sample. (From Pagana K. Mosby’s manual of diagnostic and laboratory testing. 2nd ed. St. Louis: Mosby; 2010.)
Arterial puncture should not be performed through any type of lesion. Similarly, puncture distal to a surgical shunt (e.g., shunts used for dialysis) should be avoided. Infection or evidence of peripheral vascular disease should prompt selection of an alternative site. Some patients may be using anticoagulant drugs such as heparin, warfarin (Coumadin), or streptokinase. High doses of these drugs or a history of prolonged clotting times may be relative contraindications to arterial puncture. Box 6-1 lists some of the potential hazards associated with arterial puncture.
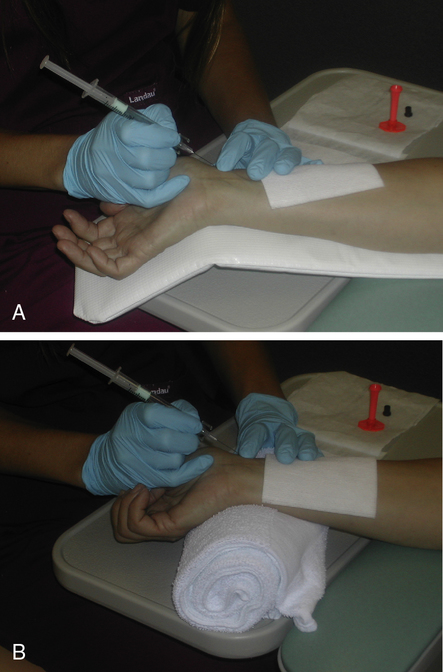
Success in obtaining an arterial specimen by radial puncture requires careful positioning of the patient’s wrist. The hand should be hyperextended with good support under the wrist (Figure 6-2, arterial puncture). A topical anesthetic may be useful for some patients, but is usually unnecessary. Always perform the modified Allen’s test to ensure adequate collateral circulation before puncturing the artery. The person drawing the sample should be in a comfortable position (i.e., sitting) to maximize control of the needle during insertion. It is recommended that the person drawing the sample use standard precautions and personal protective equipment, including gloves and eyewear. A vented syringe or similar device allows the blood to “pulse” into the syringe, ensuring that the needle is in the lumen of the artery.
Blood is usually collected in a syringe to which an anticoagulant (e.g., heparin) has been added, and sealed from the atmosphere immediately (Criteria for Acceptability 6-1). Blood gases are typically drawn using specially designed syringes containing a dry anticoagulant (i.e., a blood gas “kit”). Dry heparin is applied to the lumen of the needle and the interior of the syringe. A small heparin pellet is often placed in the syringe to provide additional anticoagulation. Care must be taken that heparin solution (sometimes used for flushing arterial catheters) does not contaminate the sample. Contamination by flush solution may affect Po2 and Pco2 values by dilution, but the buffering capacity of whole blood prevents large changes in pH.
After the syringe has been capped (see Chapter 12 for safe handling of blood specimens), the sample should be thoroughly mixed by rolling or gently shaking. Mixing helps prevent the sample from clotting, whether dry or liquid heparin is used. Mixing is also important for analyzers that use spectrophotometric methods for measuring blood gases. Lithium heparin or a similar preparation should be used for specimens that will also be used for electrolyte analysis.
Air contamination of arterial or mixed venous blood specimens can seriously alter blood gas values. Room air at sea level has a Po2 of approximately 150 mm Hg, and a Pco2 near 0. If air bubbles are present in a blood gas specimen, equilibration of gases between the sample and air occurs (Table 6-2). Contamination commonly occurs during sampling when air is left in the syringe after the sample is collected. Small bubbles may also be introduced if the needle does not connect tightly to the syringe. Other sources of air contamination include poorly fitting plungers and failure to properly cap the syringe. Use of a vented syringe or one in which the pulse pressure of the blood displaces the plunger can help prevent air bubble contamination.
Table 6-2
Air Contamination of Blood Gas Samples
| In Vivo Values | Air Contamination* | |
| pH | 7.40 | 7.45 |
| Pco2 | 40 | 30 |
| Po2 | 95 | 110 |
*Typical values that might occur when a blood gas specimen is exposed to air, either directly or by mixing with a solution that has been exposed to air (e.g., heparinized flush solution). The change in pH occurs because of the change in Pco2.
Capillary samples are useful in infants when arterial puncture is impractical. The area for collection (the heel is commonly chosen) should be heated by a warm compress and lanced. Blood is then allowed to fill the required volume of heparinized glass/plastic capillary tubes. Squeezing the tissue should be avoided because predominantly venous blood will be obtained. The capillary tubes should be carefully sealed to avoid air bubbles. Guidelines for quality control of blood gas analyzers and for the safe handling of blood specimens are included in Chapter 12.
Significance and Pathophysiology
See Interpretive Strategies 6-1.
Interpretive Strategies 6-1 Blood Gases
1. Was the blood gas specimen obtained acceptably? Free of air bubbles and clots? Analyzed promptly and/or iced appropriately?
2. Did the blood gas analyzer function properly? Was there a recent acceptable calibration of all electrodes or sensors? Was analyzer function validated by appropriate quality controls?
3. Is pH within the normal limits (7.35–7.45)? If so, go to Step 4. If below 7.35, acidosis is present; if above 7.45, alkalosis is present. Otherwise, look for compensatory changes or combined disorders.
4. Calculate the anion gap. Is it within the normal range?
5. Is Pco2 within normal limits (35–45 mm Hg)? If so, go to Step 6.
If Pco2 >45 and pH <7.35, then respiratory acidosis is present.
If Pco2 >45 and pH >7.35, then compensated respiratory acidosis is present.
If Pco2 <35 and pH >7.45, then respiratory alkalosis is present.
If Pco2 <35 and pH <7.45, then compensated respiratory alkalosis is present.
6. Is calculated  within the normal limits (22–27 mEq/L)? If so, the acid-base status is probably normal; go to Step 7.
If HCO3 <22 and pH <7.35, then metabolic* acidosis is present.
If HCO3 <22 and pH >7.35, then compensated metabolic* acidosis is present.
If  >27 and pH >7.45, then metabolic* alkalosis is present.
If  >27 and pH <7.45, then compensated metabolic* alkalosis is present.
7. Is Po2 within the normal limits (80–100 mm Hg) on room air? If so, the oxygenation status is probably normal; check O2Hb saturation via hemoximetry. Is Po2 appropriate for FIO2? Is A-a gradient increased? If Po2 <55, significant hypoxemia is present.
8. Are blood gas results consistent with the patient’s clinical history and status? Are additional tests indicated (hemoximetry, shunt study)?
pH
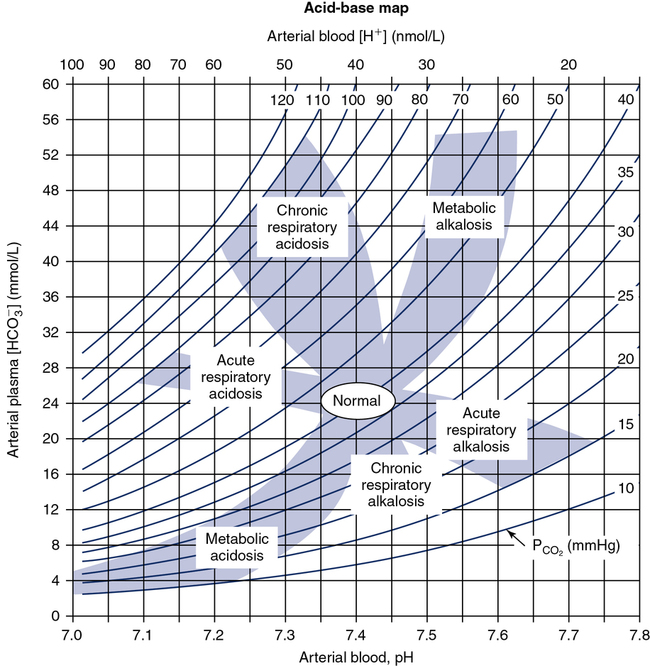
The pH of arterial blood in healthy adults averages 7.40 with a range of 7.35–7.45. Arterial pH below 7.35 constitutes acidemia. A pH above 7.45 constitutes alkalemia. Because of the logarithmic scale, a change of 0.3 pH units represents a twofold change in [H+] concentration. If the pH decreases from 7.40 to 7.10 with no change in Pco2, the concentration of hydrogen ions has doubled. Conversely, if the concentration of [H+] is halved, the pH increases from 7.40 to 7.70, assuming the Pco2 remains at 40 mm Hg. Changes of this magnitude represent marked abnormalities in the acid-base status of the blood and are almost always accompanied by clinical symptoms (e.g., cardiac arrhythmias) (Figure 6-3). If a metabolic acidemia is present, examination of the Anion Gap (AG) needs to be assessed. The anion gap is the difference between routinely measured cations (sodium) and anions (chloride and bicarbonate) in serum, plasma, or urine. The magnitude of the difference in serum is calculated to help identify the cause of a metabolic acidemia. The anion gap also reflects unmeasured cations (e.g., proteins, organic acids, phosphates) and anions (e.g., calcium, potassium, magnesium) (Table 6-3). The AG is expressed in units of mEg/L or mmol/L and is calculated by subtracting the serum concentrations of chloride and bicarbonate from the concentrations of sodium and potassium. However, in routine clinical practice, the potassium is frequently ignored, which leaves the following equation:
Table 6-3
| Metabolic Acidosis | |
| Wide Gap | Normal Gap |
| “MUDPILES” | “HARDUP” |
| Methanol (Osm gap high) | Hyperventilation |
| Uremia | Acid infusion/carbonic anhydrase inhibitors/Addison’s disease |
| Diabetic/alcoholic ketoacidosis | Renal tubular acidosis (urine gap positive) |
| Paraldehyde | Diarrhea (urine gap normal; i.e., negative) |
| Isoniazid/Iron | Ureterosigmoidostomy |
| Lactic acidosis | Pancreatic fistula/drainage |
| Ethylene glycol (Osm gap high) | |
| Salicylates/solvents | |
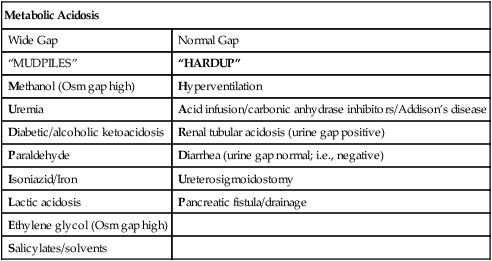
This tool assists the user to identify and characterize the acid base disturbance. (From Cogan MG, Rector FC Jr. Acid-base disturbances. In Brenner BM, Rector FC Jr., eds. The kidney. Philadelphia: WB Saunders, 1986.)
Acid-base disorders arising from lung disease are often related to Pco2 and its transport as carbonic acid. If the pH is outside of its normal range (i.e., acidemia or alkalemia) but Pco2 is within normal limits, the condition is termed nonrespiratory or metabolic (Table 6-4). The calculated  is a useful indicator of the relationship between pH and Pco2. In the presence of acidemia (pH less than 7.35) and normal CO2 (Pco2 35–45 mm Hg),
  will be low and a metabolic acidosis is present. A Pco2 of less than 35 mm Hg in the presence of acidosis suggests that ventilatory compensation for acidemia is occurring. The acid-base status would be considered partially compensated nonrespiratory (i.e., metabolic) acidosis. Complete compensation occurs if pH returns to the normal range. This happens when ventilation reduces Pco2 in proportion to the
  .
.
Table 6-4
| Status | pH | Pco2 |  |
| Simple Disorders | |||
| Metabolic acidosis | Low | Normal | Low |
| Metabolic alkalosis | High | Normal | High |
| Respiratory acidosis | Low | High | Normal |
| Respiratory alkalosis | High | Low | Normal |
| Compensated Disorders | |||
| Compensated respiratory acidosis, or metabolic alkalosis | Normal* | High | High |
| Compensated metabolic acidosis, or respiratory alkalosis | Normal* | Low | Low |
| Combined Disorders | |||
| Metabolic/respiratory acidosis | Low | High | Low |
| Metabolic/respiratory alkalosis | High | Low | High |
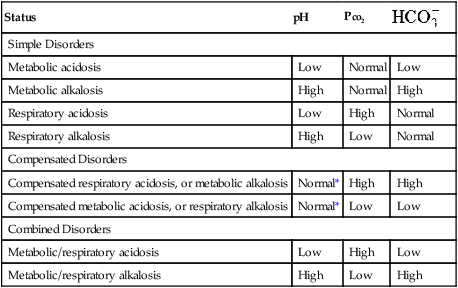
*Compensation cannot return values to within normal limits in severe acid-base disturbances. In addition, a normal pH may result in instances of respiratory and metabolic disturbances that occur together but are not compensatory.


Carbon Dioxide Tension
The arterial carbon dioxide tension (Paco2) in a healthy adult is approximately 40 mm Hg; it may range from 35–45 mm Hg. The Pco2 of venous or mixed venous blood is seldom used clinically. Body temperature affects Paco2, as described in Table 6-1.
Paco2 is inversely proportional to alveolar ventilation ( A) (see Chapter 5). When
  A decreases, CO2 may not be removed by the lungs as fast as it is produced. This causes Paco2 to increase. The pH falls (i.e., [H+] increases) as CO2 is hydrated to form carbonic acid:

 E) may be required to adequately ventilate alveoli and keep Pa
 E to provide more alveolar ventilation of functional lung units. This mechanism compensates for lung units that do not participate in gas exchange. Hypoxemia is a common cause of hyperventilation (i.e., respiratory alkalosis). Hyperventilation may be seen in patients with asthma, emphysema, bronchitis, or foreign body obstruction. Anxiety, stress or central nervous system disorders may also cause hyperventilation. Hyperventilation may also be an intentional or unintentional result of mechanical ventilation.
Increased Paco2 (i.e., hypercapnia) commonly occurs in patients who have advanced obstructive or restrictive disease. These individuals are characterized by markedly abnormal ventilation-perfusion ( /
/ ) patterns. They are unable to maintain adequate alveolar ventilation. Not all patients with advanced pulmonary disease retain CO2. Those who do become hypercapnic often have a low ventilatory response to CO2 (see Chapter 5). Their response to the increased work of breathing caused by obstruction or restriction is to allow CO2 to increase rather than increase ventilation. When respiratory acidosis results from increased Pco2, renal compensation usually occurs (see Table 6-4).

 /
/ abnormalities. Because O2 therapy is common in these patients, changes in P
Oxygen Tension
FIO2= fractional concentration of inspired O2
47= partial pressure of water vapor at 37°C

Paco2= arterial CO2 tension (presumed equal to alveolar CO2 tension)
R= respiratory exchange ratio ( co2/
co2/ o2)
o2)
Substituting 40 mm Hg for Paco2, and 0.8 for R:


Hyperventilation may increase Pao2 as high as 120 mm Hg in a patient with normal lung function (see the previous alveolar air equation). Healthy subjects breathing 100% O2 may exhibit Pao2 values higher than 600 mm Hg. The alveolar Po2 (PAo2) for a particular inspired O2 fraction can be calculated, as previously described. Decreased Pao2 can result from hypoventilation, diffusion abnormalities,  /
/ imbalances, shunt, and inadequate atmospheric O2 (high altitude) (see Table 6-4).
Table 6-1 lists changes that occur in Pao2 because of body temperatures above and below normal (37°C). Changes in Po2 and Pco2 reflect solubility of the gas. The partial pressure of each gas is a measure of its activity. Hypothermia (low body temperature) is accompanied by decreased partial pressure as more gas dissolves. Hyperthermia (elevated body temperature) causes elevated gas tensions as gas comes out of solution. All blood gas analyzers perform analyses at 37°C, and most allow temperature corrections to be made. Although blood gas tensions vary with temperature, the clinical significance of correcting measurements is unclear. Blood gas values should be reported at 37°C. Care must be taken to ensure that blood gas analyzers are maintained at 37°C. Measurements made at other temperatures can significantly alter results.
Po2 is the pressure of O2 dissolved in blood. The amount of Hb and whether it is capable of binding O2 has only a minimal effect on Po2. Hypoxemia (decreased O2 content of the blood) may occur even if Pao2 is normal or elevated by breathing O2. Hypoxemia commonly results from inadequate or abnormal Hb. Many automated blood gas analyzers calculate oxygen saturation (SaO2). Saturation may be calculated from the Pao2 and pH, assuming a normal oxygen-hemoglobin reaction occurs (Figure 6-4). Calculated SaO2 may differ significantly from true saturation measured by a spectrophotometer (see the section on oxygen saturation) because a number of factors can affect the relationship of the binding capacity of hemoglobin (see Figure 6-4)
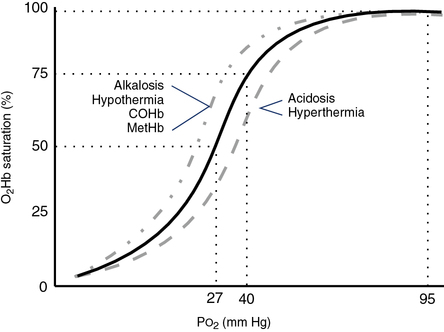
The S-shaped curve represents the relationship between partial pressure of O2 in blood (x-axis) and Hb saturation (y-axis). “Shift to the left”: ↓ 2, 3, DPG; temp; Pco2; ↑pH; results in an increase in oxygen affinity. “Shift to the right”: ↑ 2, 3, DPG; temp; Pco2; ↓pH; results in a decrease in oxygen affinity.
 /
/ mismatching), pulmonary capillary blood has reduced O2 content. Pa
 /
/ cannot compensate for their poorly functioning counterparts because pulmonary capillary blood leaving them is already almost fully oxygenated. O2 binding to Hb is almost complete when the Pa
1.34= O2 binding capacity of Hb, mL/g
Hb= hemoglobin concentration, g/dL
SaO2= arterial oxygen saturation as a fraction
Pao2= arterial oxygen tension, mm Hg
0.0031= solubility coefficient for O2 at 37°C
The mixed venous oxygen tension (P o2) in healthy patients at rest ranges from approximately 37–43, with an average of 40 mm Hg (see Figure 6-4). Mixed venous O2 content (C
 o2) averages 15 mL/dL. In healthy individuals, arterial oxygen content (Cao2) averages 20 mL/dL. The resulting content difference, or C(a-
 )o2, is thus 5 mL/dL (or 5 vol%). Although Pao2 varies with the inspired O2 fraction and matching of
  /
/ , P
, P o2 changes in response to alterations in cardiac output and O2 consumption. If cardiac output increases while oxygen consumption (
 o2) remains constant, the C(a-
 )o2 decreases. Conversely, if cardiac output decreases with no change in O2 consumption, C(a-
 )o2 increases. Increased cardiac output sometimes occurs in response to pulmonary shunting. This allows mixed venous oxygen content to increase, reducing the deleterious effect of the shunt. Critically ill patients often have low P
 o2 values and increased C(a-
 )o2 as a result of poor cardiovascular performance. Alterations in P
 o2 often occur even if Pao2 is normal. P
 o2 values less than 28 mm Hg in critically ill patients, accompanied by C(a-
 )o2 greater than 6 vol%, suggest marked cardiovascular decompensation.
 /
/ abnormalities.
 E, tidal volume, dead space), and lung volumes (VC, RV, TLC) to distinguish pulmonary from nonpulmonary causes of inadequate oxygenation.
Hemoximetry
Description

rHb= reduced hemoglobin concentration
COHb= carboxyhemoglobin concentration
MetHb= methemoglobin concentration
Technique
O2 saturation of Hb (O2Hb, or SaO2 when referring to arterial saturation) may be measured in several ways. In the first method, O2 saturation is measured using a spectrophotometer (see Chapter 11). Whole blood is hemolyzed and the absorbances of the various components measured. The total Hb, O2Hb, COHb, and MetHb are usually reported. Hemoximetry is usually performed in conjunction with blood gas analysis, using a single specimen of blood.

Blood specimens for hemoximetry should be prepared, as described for arterial blood gas specimens. Guidelines for quality control of blood gas analysis are included in Chapter 12. Measurement of percent saturation allows the calculation of the O2 content of either arterial or mixed venous blood (Cao2 and C o2, respectively) (see section, Oxygen Tension).
Significance and Pathophysiology
See Interpretive Strategies 6-2. SaO2 for a healthy young adult with a Pao2 of 95 mm Hg is approximately 97%. The O2Hb dissociation curve is relatively flat when the Pao2 is above 60 mm Hg (i.e., SaO2 is 90% or more). Saturation changes only slightly when there is a marked change in Pao2 at partial pressures above 60 mm Hg (see Figure 6-4). Therefore, Pao2 is a more sensitive indicator of oxygenation in lungs that do not have gross abnormalities. At Pao2 values of approximately 150 mm Hg, Hb becomes completely saturated (SaO2 is 100%). At Pao2 values above 150 mm Hg, further increases in O2 content are caused by increased dissolved oxygen. Alterations in  /
/ patterns in the lungs can be monitored by allowing the patient to breathe 100% O2 and by measuring the changes in dissolved oxygen. In practice, this is accomplished by using the clinical shunt equation (see section, Shunt Calculation).
The ability of Hb to bind O2 may be measured by the P50. P50 specifies the partial pressure at which Hb is 50% saturated (see Figure 6-4). The P50 of normal adult Hb is approximately 27 mm Hg. P50 may be determined by equilibrating blood with several gases at low oxygen tensions. An O2Hb dissociation curve is then constructed to estimate the partial pressure at which Hb is 50% saturated. A second method of estimating P50 compares measured SaO2 (using a spectrophotometer) with the expected saturation. Calculated saturations presume a P50 of 26–27 mm Hg, but it may differ significantly, depending on the types of Hb and interfering substances present.
COHb interferes with O2 transport in two ways: it binds competitively to Hb, and it shifts the O2Hb curve to the left (see Figure 6-4). Increased COHb causes reduced O2Hb with a decrease in O2 content. The left shift of the dissociation curve causes O2 to be bound more tightly to Hb. The combination of these two effects can seriously reduce O2 delivery to the tissues. COHb concentrations in blood begin to decrease once the source of CO has been removed. Removal of CO from the blood depends on the minute ventilation. Breathing air may require several hours to reduce even moderate levels to normal. Breathing 100% O2 speeds the washout of CO. High concentrations of O2 (often including hyperbaric therapy) are indicated whenever dangerously high levels of COHb are encountered.
Methemoglobin (MetHb) forms when iron atoms of the Hb molecule are oxidized from Fe++ to Fe+++. The normal MetHb level is less than 1.5% of the total Hb in adults. High levels of MetHb can result from ingestion of or exposure to strong oxidizing agents. Methemoglobinemia has also been linked to high doses of medications such as benzocaine, dapsone, nitroprusside and inhaled nitric oxide. Like COHb, MetHb reduces O2 carrying capacity of the blood by reducing the available Hb and shifting the O2Hb dissociation curve to the left (see Figure 6-4).


S o2 is useful in assessing cardiac function in the critical care setting and during exercise, but does require the placement of a pulmonary artery catheter. Patients who have good cardiovascular reserves maintain a mixed venous saturation of 70%–75%. Patients whose S
 o2 values are in the 60%–70% range have a limited ability to deliver more O2 to the tissues. S
 o2 values less than 60% usually indicate cardiovascular decompensation and may be associated with tissue hypoxemia. The indwelling reflective spectrophotometer (see Chapter 11) allows continuous monitoring of this important parameter. S
 o2 also decreases during exercise. Despite increased cardiac output, O2 extraction by the exercising muscles reduces the content of blood returning to the lungs.
Estimation of SaO2 by most pulse oximeters (SpO2) is based on the absorption of light at two wavelengths. When only two wavelengths are analyzed, only two species of Hb can be detected. Absorption in the red and near-infrared portions of the visible spectrum allows measurement of the oxyhemoglobin and reduced Hb, providing an estimate of the oxygen saturation of available Hb (see section, Pulse Oximetry).
Pulse oximetry
Description
Technique
Pulse oximeters (see Chapter 11) measure the light absorption of a mixture of two forms of Hb: O2Hb and reduced Hb (rHb). The relative absorptions at 660 nm (red) and 940 nm of light (near infrared) can be used to calculate the combination of the two Hb forms. Absorption at two wavelengths provides an estimate of the saturation of available Hb (see the section on oxygen saturation). Most pulse oximeters use a stored calibration curve to estimate oxygen saturation.
Some pulse oximeters display a representation of the pulse waveform derived from the absorption measurements (see Chapter 11). Such waveforms may be helpful in selecting an appropriate site or troubleshooting questionable SpO2 values. Most pulse oximeters report heart rate (HR), which is also detected from pulsatile blood flow at the sensor site. Comparison of oximeter HR with palpated pulse or with an electrocardiograph (ECG) signal can assist with selection of an appropriate site. Inability to obtain a valid HR reading or acceptable pulse waveform suggests that SpO2 values should be interpreted cautiously (Criteria for Acceptability 6-2).
A number of factors limit the validity of SpO2 measurements (Box 6-2). To validate pulse oximetry readings, direct measurement of arterial saturation is required. Simultaneous measurement of SpO2 and SaO2 can be used to confirm pulse oximeter readings. Pulse oximetry used during exercise testing has been shown to produce variable results. Hemoximetry may be necessary to validate pulse oximetry readings at peak exercise.
COHb absorbs light at wavelengths similar to oxyhemoglobin. Most pulse oximeters sense COHb as O2Hb and overestimate the O2 saturation; however, pulse oximeters that measure O2Hb and COHb are available. MetHb increases absorption at each of the two wavelengths used by pulse oximeters. This causes the ratio of the two Hb forms to approach 1, which is usually represented as a saturation of 85% (see Chapter 11). Other interfering substances may cause the pulse oximeter to underestimate saturation.
Significance and Pathophysiology
See Interpretive Strategies 6-3. Arterial oxygen saturation estimated by pulse oximetry (SpO2) should approximate that measured by hemoximetry (SaO2) in healthy nonsmoking adults. Most pulse oximeters are capable of accuracy of ±2% of the actual saturation when SaO2 is above 90%. For SaO2 values of 85%–90%, accuracy may be slightly less. For very low saturations (i.e., less than 80%), pulse oximeter accuracy is less of an issue because the clinical implications are the same.
Pulse oximetry is most useful when it has been shown to correlate with blood oximetry in a patient in a known circumstance. When this is the case, pulse oximetry can be used for noninvasive monitoring, either continuously or by taking discrete measurements. Uses include monitoring of O2 therapy, ventilatory support, pulmonary or cardiac rehabilitation, bronchoscopy, surgical procedures, sleep studies, and cardiopulmonary exercise testing. In each of these applications, careful attention must be paid to minimizing known interfering agents or substances (see Box 6-2).
Capnography
Description
Technique
Continuous monitoring of expired CO2 is performed by sampling gas from the proximal airway. This gas may be pumped to an infrared analyzer (see Chapter 11) or to a mass spectrometer. An alternative method inserts a “mainstream” sample window directly into the expired gas stream. The analyzer signal is then passed to either a recorder or a computer. CO2 waveforms may be displayed either individually (Figure 6-5) or as a series of deflections to form a trend plot. Petco2 may be read from the peaks of the waveforms. It can also be obtained by a simple peak detector and displayed digitally. Continuous CO2 monitoring is commonly used in patients with artificial airways in the critical care setting. Paco2 can be measured at intervals to establish a gradient with Petco2. Respiratory rate may be determined from the frequency of the CO2 waveforms. The change in CO2 concentration during a single expiration may be analyzed to detect ventilation-perfusion abnormalities (see Figure 6-5).
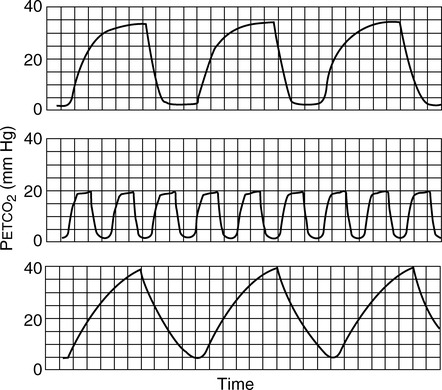
Plots of expired CO2 versus time for three patients are displayed. In each example, expiration is marked by a rapid increase in carbon dioxide to a peak (Petco2) followed by a return to the baseline during inspiration. Top, Normal respiratory pattern with Petco2 near 40 mm Hg and a relatively flat alveolar phase. Middle, Rapid respiratory rate and low Petco2 (20 mm Hg), which may be found in a patient who is hyperventilating; the expiratory waveform has a normal configuration. Bottom, Abnormal expired CO2 waveform is consistent with
 /
/ abnormalities; no alveolar plateau is present, and the baseline does not return to zero.
Technical problems involved in capnography include the necessity of accurate calibration and management of the gas sampling system (Criteria for Acceptability 6-3). Calibration using known gases (preferably two gas concentrations) is required if the system will be used to monitor Paco2. Many systems use ambient air, containing minimal CO2, and a 5% CO2 mixture for calibration (see Chapter 12). Condensation of water in sample tubing, connectors, or the sample chamber can affect accuracy. Some infrared analyzers may be affected if sample flow changes after calibration. Saturation of a desiccator column, if used, can also lead to inaccurate readings. Long sample lines or low sample flows can cause damping of the CO2 waveform, invalidating analysis of the shape of the expired gas curve.
Significance and Pathophysiology
See Interpretive Strategies 6-4. In healthy patients, CO2 rises to a plateau as alveolar gas is expired (Figure 6-5). If all lung units empty CO2 evenly, the plateau appears flat. However, even healthy lungs have ventilation and blood flow imbalances. Healthy lung units empty CO2 at varying rates. Alveolar CO2 concentration increases slightly as the exhalation continues. Petco2 theoretically should not exceed Paco2. In healthy patients at rest, the Petco2 is usually close to the arterial value. During maximal exercise Petco2 may exceed Paco2. When ventilation and perfusion become grossly mismatched (e.g., in severe obstruction), end-tidal CO2 may exceed the Paco2 as well. Paco2 reflects gas-exchange characteristics of the entire lung. Thus, Petco2 may differ significantly if some lung units are poorly ventilated.
 /
/ abnormalities). When a reference blood gas sample is obtained, P
Shunt calculation
Description
 s) to total perfusion (
 t). Shunt is reported as a percent of total cardiac output, or sometimes as a simple fraction. Left-to-right shunting can occur when cardiac physiology is abnormal, such as patent ductus arteriosus (PDA). These types of shunts are usually detected by Doppler echocardiography rather than by the shunt measurement, as described.
Technique
CcO2= O2 content of end-capillary blood, estimated from saturation associated with calculated PAo2
CaO2= arterial O2 content, measured from an arterial sample
C o2= mixed venous O2 content, measured from a sample obtained from a pulmonary artery catheter
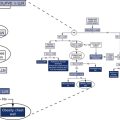
The second method is more commonly used in clinical practice. The patient breathes 100% O2 in a unidirectional valved system until the Hb is completely saturated (see Figure 6-6). Twenty minutes of O2 breathing is usually sufficient. Percent shunt is then calculated from differences in dissolved O2. The second method is called the clinical shunt equation:
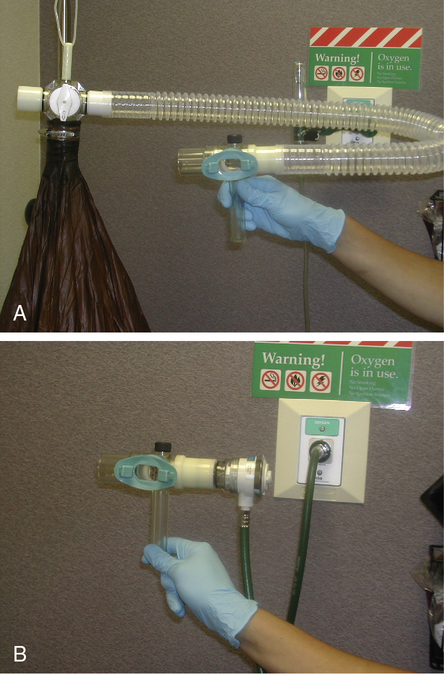
(A) Shunt performed using a unidirectional breathing valve attached to a reservoir bag filled with 100% oxygen; (B) Shunt performed using a unidirectional breathing valve attached to a demand valve driven with oxygen.
C(a– )o2= arteriovenous O2 content difference
0.0031= solubility factor for O2 at 37°C

PH2O= partial pressure of water vapor at body temperature (47 mm Hg)
Paco2= arterial CO2 tension (as an estimate of alveolar Pco2)
0.8= normal (assumed) respiratory exchange ratio
This calculation of alveolar Po2 assumes that the inspired gas is 100% O2. If the FIO2 is measured and found to be less than 1, the standard alveolar air equation can be used (see Evolve http://evolve.elsevier.com/Mottram/Ruppel/).
Several technical considerations should be noted regarding shunt measurement (Criteria for Acceptability 6-4). Using O2 content differences (equation 1) requires a pulmonary artery catheter to obtain mixed venous O2 content. Using dissolved O2 differences (equation 2) also relies on measured C(a- )o2. If placement of a pulmonary artery catheter is not practical, the clinical shunt equation may be used with an assumed a-
 content difference or a presentation of the calculated data with several a-
 content differences (Table 6-5) (see the discussion on Significance and Pathophysiology in this section). The estimated technique assumes the subject is breathing 100% oxygen, so a closed circuit with directional value is required. This can be accomplished with a demand valve driven with a 50 psig 100% oxygen gas source or reservoir bag (e.g., Douglas bag) filled with 100% oxygen connected to a directional value. The subject needs to be monitored for leaks around the mouth or noseclips. The sample should be collected in a glass syringe or analyzed immediately to reduce the decrease in Pao2 secondary to environmental exposure (How To Box 6-3).
Criteria For Acceptability 6-4 Shunt Calculation
1. For physiologic shunt, patient must have simultaneous arterial and mixed venous blood specimens drawn over a 30-second interval.
2. For clinical shunt, patient should breathe 100% O2 for at least 20 minutes, or until Hb is completely saturated (Pao2 >150 mm Hg). If Pao2 >150 mm Hg cannot be achieved, clinical shunt calculation may underestimate true shunt.
3. Cao2 and C o2 must be measured for physiologic shunt. Measured contents should be used for clinical shunt if available; otherwise, the estimated a-
 content difference should be based on clinical status.
4. FIO2 should be accurately determined; this is required to calculate capillary content for physiologic shunt. FIO2 of 1.00 can be assumed for clinical shunt calculation, but measured value improves accuracy.
Table 6-5
Shunt Study
Male, Age 48, Barometer: 719, Time: 10:00
| Sample No. | Position | Activity | Pao2 (mm Hg) | Paco2 (mm Hg) | P(a-a)o2 (mm Hg) |
C(a- )o2 (cc/100 mL) )o2 (cc/100 mL) |
 sp/ sp/ tot tot(%) |
| 3 | Supine | Rest | 228.0 | 38-6 | 405-4 | 4 | 23.9 |
| 5 | 20.1 | ||||||
| 6 | 17.3 | ||||||
| 8 | 13.6 | ||||||
| 4 | Stand | Rest | 355.0 | 36 | 281.0 | 4 | 17.9 |
| 5 | 14.8 | ||||||
| 6 | 12.7 | ||||||
| 8 | 9.8 |
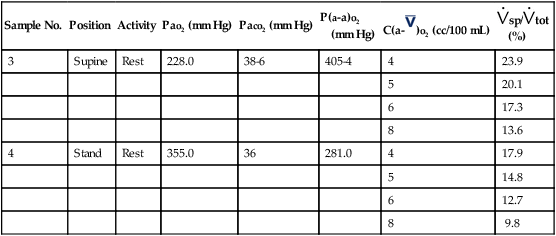
 sp/
sp/ tot) is estimated from arterial blood gas while breathing at 100% oxygen. Mixed venous blood is not sampled (
 sp/
sp/ tot) is reported assuming 4, 5, 6, and an 8 CcO2/100-mL difference between arterials and mixed venous blood. Clinical evaluation should dictate which value is appropriate.)
Significance and Pathophysiology
See Interpretive Strategies 6-5. In healthy individuals, approximately 5% of the cardiac output is shunted past the pulmonary system. An increased pulmonary shunt fraction indicates that some lung units have little ventilation in relation to their blood flow. These patterns may be found in both obstructive and restrictive diseases. However, even in severe obstruction or restriction, blood flow to areas of poor ventilation may be reduced by the lesions themselves. In emphysema, destruction of the alveolar septa obliterates pulmonary capillaries. As the terminal airways lose their support, they also have reduced blood flow. In poorly ventilated lung units, vasoconstriction of pulmonary arterioles redirects blood flow away from the affected area. In these cases, there may be minimal shunting, even though severe ventilatory impairment exists.
 /
/ ratios close to zero.
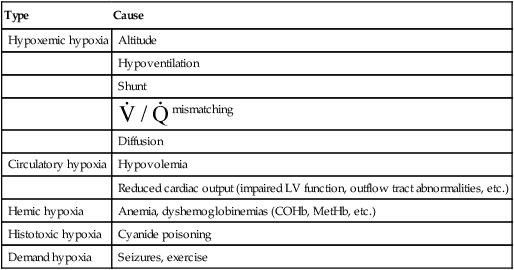
Table 6-6
Causes of Hypoxia and Hypoxemia
| Type | Cause |
| Hypoxemic hypoxia | Altitude |
| Hypoventilation | |
| Shunt | |
 mismatching mismatching |
|
| Diffusion | |
| Circulatory hypoxia | Hypovolemia |
| Reduced cardiac output (impaired LV function, outflow tract abnormalities, etc.) | |
| Hemic hypoxia | Anemia, dyshemoglobinemias (COHb, MetHb, etc.) |
| Histotoxic hypoxia | Cyanide poisoning |
| Demand hypoxia | Seizures, exercise |


In some instances, a- content difference cannot be reliably estimated, or Hb cannot be maximally saturated by breathing 100% oxygen. In such cases, the alveolar-arterial oxygen gradient P(a−a)o2 may be useful as an index of ventilation to blood flow. In healthy patients breathing 100% O2 at sea level, arterial Pao2 should increase to approximately 600 mm Hg.
  s/
s/ t does not directly provide absolute values for
  s, but if the cardiac output (
 t) is known,
  s can be determined simply. Measurement of the shunt fraction is sometimes performed in conjunction with the determination of the VD/VT ratio (see Chapter 5) to assess both types of gas exchange abnormalities together.
Summary
• The chapter describes the measurement of pH, Pco2, Po2, and blood oximetry used as part of pulmonary function testing. Technical aspects of obtaining samples are discussed in detail because accurate interpretation makes numerous assumptions regarding proper specimen handling.
• Two noninvasive methods of assessing gas exchange are commonly used: pulse oximetry and capnography. Pulse oximetry offers a simple means of assessing oxyhemoglobin saturation. Capnography is useful for monitoring changes in Petco2, particularly for patients in critical care settings.
• Shunt measurements allow estimates of severe ventilation-perfusion imbalances in the lungs. Two methods are described: the clinical and physiologic equations. The advantages and disadvantages of each are also discussed.
Case Studies
Case 6-1
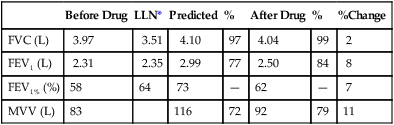
| Before Drug | LLN* | Predicted | % | After Drug | % | %Change | |
| FVC (L) | 3.97 | 3.51 | 4.10 | 97 | 4.04 | 99 | 2 |
| FEV1 (L) | 2.31 | 2.35 | 2.99 | 77 | 2.50 | 84 | 8 |
| FEV1% (%) | 58 | 64 | 73 | — | 62 | — | 7 |
| MVV (L) | 83 | 116 | 72 | 92 | 79 | 11 |
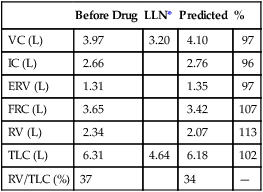
| Before Drug | LLN* | Predicted | % | |
| VC (L) | 3.97 | 3.20 | 4.10 | 97 |
| IC (L) | 2.66 | 2.76 | 96 | |
| ERV (L) | 1.31 | 1.35 | 97 | |
| FRC (L) | 3.65 | 3.42 | 107 | |
| RV (L) | 2.34 | 2.07 | 113 | |
| TLC (L) | 6.31 | 4.64 | 6.18 | 102 |
| RV/TLC (%) | 37 | 34 | — |
| Before Drug | LLN* | Predicted | % | |
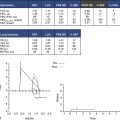
| Dlco (mL/min/mm Hg) | 16.7 | 19.5 | 26.3 | 63 |
| Dlco (corrected) | 16.7 | 26.3 | 63 | |
| Dl/VA | 5.09 | 4.38 | 86 |
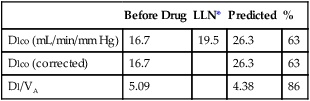

Diffusing capacity is also reduced in a pattern consistent with mild to moderate airway obstruction. The predicted Dlco has been corrected for an elevated Hb and COHb. The combination of these two corrections results in a predicted Dlco that is identical to the uncorrected predicted value (see Chapter 5).
Case 6-2


1. A patient referred for a pulmonary function test has blood gases drawn, and the following data are reported:
| pH | 7.43 |
| Paco2 (mm Hg) | 38 |
| Hco3– (mEq/L) | 25.1 |
These values are consistent with:
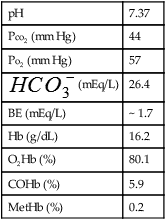
2. A patient with COPD has blood gases drawn and the following values are reported:
| pH | 7.37 |
| Pco2 | 47 mm Hg |
| Po2 | 52 mm Hg |
| Hco3− | 27.1 mEq/L |
| Hb | 15.8 g/dL |
| O2Hb | 82% |
Which of the following best describes these results?
3. A patient being monitored by ECG has a heart rate (HR) of 120/min. A pulse oximeter on this patient displays a saturation of 84% with an HR of 118. Which of the following should the pulmonary function technologist conclude, based on these findings?
a. The patient’s COHb level is likely elevated.
b. The pulse oximeter’s sensor should be moved to an alternate site.
4. An outpatient is referred for arterial blood gas analysis. While performing the modified Allen’s test, the pulmonary function technologist notes that the patient’s hand reperfuses after 30 seconds. The technologist should:
a. Use a 23-gauge or smaller needle for the puncture
b. Proceed to obtain the specimen
5. A patient with interstitial lung disease has an arterial oxygen tension (Pao2) of 60 mm Hg, but hemoximetry is not performed. What calculated SaO2 should the pulmonary function technologist report?
6. A patient with chronic bronchitis has a resting SpO2 of 80%, but an arterial blood gas reveals an SaO2 of 90%. Which of the following should the pulmonary function technologist conclude?
a. The patient has an elevated COHb.
b. The patient has compensated respiratory acidosis.
c. The pulse oximeter reading is erroneous.
d. These results are expected in patients with polycythemia.
7. A patient who has COPD performs a maximal exercise test. At peak exercise, his SpO2 is 94% and a blood gas shows an SaO2 of 87%. Which of the following might explain these results?
8. A patient being monitored by capnography shows the following data
| Time | 8:35 | 8:40 | 8:45 | 8:50 | 8:55 | 9:00 |
| Petco2 | 38 | 39 | 39 | 29 | 25 | 26 |
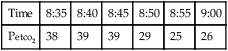
Which of the following best explains the change occurring at 8:50?
9. A patient with dyspnea on exertion has arterial blood gases drawn at rest before beginning an exercise test, and the following data are obtained:
| pH | 7.44 |
| Paco2 | 36 mm Hg |
 |
24.4 mEq/L |
| Pao2 | 64 mm Hg |
| SaO2 | 91% |
| Hb | 6.9 mg/dL |
| COHb | 1.2% |
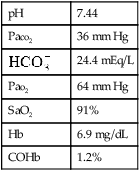
What is the subject’s arterial oxygen content (Cao2)?
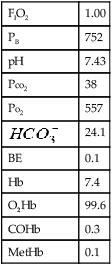
10. A patient with dyspnea at rest has a clinical shunt study performed. The following data are obtained:
| PB | 761 mm Hg |
| FIO2 | 1.00 |
| Pao2 | 597 mm Hg |
| Paco2 | 38 mm Hg |
| SaO2 | 100% |
| Hb | 15.1 mg/dL |
On the basis of these results, the patient’s  s/
s/ t is approximately: