[level-membership-for-critical-care-medicine-category]
W2 Bedside Ultrasonography
 Use of Bedside Ultrasonography in the Intensive Care Unit
General Indications
Ultrasonography has become an invaluable tool in the management of critically ill patients. Its safety and portability allow for use at the bedside to provide rapid, detailed information regarding the cardiovascular system1 and the function and anatomy of certain internal organs. It also can be used by the clinician to assess the pleural and intraabdominal spaces and to perform some invasive procedures safely. General indications for performance of echocardiography in the ICU are listed in Box W2-1. Box W2-2 lists major indications for performance of primary TEE in the ICU. Other indications for use of bedside ultrasonography by the intensivist in critically ill patients are listed in Box W2-3.
Box W2-1
General Indications for Performance of an Echocardiographic Examination in the Intensive Care Unit
Box W2-2
Major Indications for Performance of Primary Transesophageal Echocardiography Study in the Intensive Care Unit
PEEP, positive end-expiratory pressure; TTE, transthoracic echocardiography.
Technical Aspects
Acoustic Window in a Critically Ill Patient
The practical value of bedside ultrasonography in the management of critically ill patients is now widely accepted despite the inherent limitations of the technique.2 These limitations are related mostly to suboptimal imaging conditions that commonly are encountered when performing studies of critically ill patients. The constrained physical environment of the ICU also can compromise the quality of the images obtained. For an ultrasound study to be deemed adequate, a good acoustic “window” is required to allow accurate analysis. Ultrasonography uses the physical principle that sound is reflected from tissue interfaces, allowing a two-dimensional (2D) image of the anatomic structure studied to be constructed.3 Anything hindering the reflection of this acoustic signal—air, bone, calcium, a foreign body, or another interposed structure—interferes with ultrasound transmission and diminishes the overall quality of the examination. In the ICU, many patients are mechanically ventilated. In these patients, adequate imaging can be limited by pneumothorax, pneumomediastinum, or subcutaneous emphysema.2 Other important factors limiting data acquisition in critically ill patients are related to surgical wounds and dressings, tapes, tubing, obesity, and chronic obstructive pulmonary disease. In addition, lack of patient cooperation and the impossibility of moving some patients into the optimal position for the examination contribute to a high prevalence of technically inadequate studies.2
Although ultrasonography permits evaluation of the structure and function of the heart and other important organs and structures, acquisition of data and interpretation of results are fraught with potential traps.4 Performing an ultrasound examination requires a thorough knowledge of anatomy and instrumentation, including attention to gain control, grayscale settings, Doppler velocity settings, and transducer placement.
Preparation of the Patient
An awake patient should be informed about the importance of the ultrasound investigation and should be provided with an explanation of how the clinician will perform the examination.3 These steps are especially important when the examination uses the transesophageal route.
Sedation
To optimize the ultrasound examination, the patient must be cooperative and nonagitated. Noninvasive procedures such as TTE and abdominal ultrasound usually are well tolerated by patients, and additional sedation rarely is needed to perform these procedures. When performing TEE, however, certain precautions need to be taken. Patients should fast (or have their tube feeds stopped) for at least 4 hours before the procedure. Topical anesthesia of the oropharynx also is helpful before insertion of the TEE probe, especially in patients who are not endotracheally intubated.3 Even if adequate topical anesthesia is provided, insertion of the TEE probe still can cause significant discomfort and anxiety, so providing adequate sedation and analgesia is important. Frequently used sedative or analgesic agents include intravenous (IV) midazolam, fentanyl, and propofol. Dosing should be titrated according to clinical parameters including arterial blood pressure, minute ventilation, and arterial oxygen saturation.3 Sedative-induced hypotension is a frequent problem in patients with depressed ventricular function or decreased systemic vascular resistance, and occasionally patients may require transient support with IV volume infusion or rarely a vasopressor agent. If the patient is extremely uncooperative and biting, transient paralysis accompanied by increased sedation may have to be used to perform TEE safely.
Monitoring During the Procedure
Most ICU patients are monitored continuously, at least for certain respiratory, cardiac, or hemodynamic parameters. It is essential that patients undergoing an ultrasound examination in the ICU be monitored at least with noninvasive recording of blood pressure, pulse oximetry, and electrocardiogram. Even TTE or abdominal ultrasound examinations can be associated with inadvertent pulling of tubes or drains, and anxiety can be encountered during the procedure. Because of its more invasive nature, TEE may induce complications such as increased agitation, respiratory distress, and discomfort during insertion of the probe. These effects can be associated with substantial changes in blood pressure and ventilatory status. Administration of sedatives and sometimes paralytic agents can induce further changes in hemodynamic and respiratory status.3,5
Safety
Performance of ultrasound examinations in the ICU allows procedures that previously required transport to the radiology suite to be performed at the bedside. This is an important advantage to a critically ill patient, because transport out of and back to the ICU is known to be associated with increased risk of complications.6 Performance of bedside TTE and of other noninvasive ultrasound examinations is safe and not associated with significant risks to the patient. Performance of bedside TEE also is associated with a low incidence of serious complications (<0.5% in the general population and the elderly).5 The reported mortality rate associated with TEE is 0.01% to 0.03%.7 Most patients undergoing TEE examinations in the ICU usually are receiving mechanical ventilation and have continuous monitoring of arterial blood pressure, electrocardiogram, and oxygen saturation.8 Transient hypotension, typically attributable to administration of sedative medications, usually can be treated with vasopressors or IV fluids or both. The risk of injury to the pharynx or esophagus is greater in anesthetized and endotracheally intubated critically ill patients than in awake patients, because anesthetized patients cannot assist with probe insertion by swallowing and do not resist when insertion is difficult.8 Increased difficulty in directing the TEE probe also can be encountered owing to the presence of a nasogastric tube. Coagulopathy and thrombocytopenia, common problems in critically ill patients, can increase the risk of hemorrhage due to mucosal injury during blind insertion of the TEE probe. Daniel et al.9 reported significant complications related to TEE in 18 (0.18%) of 10,218 examinations. In 11 studies reporting on 943 patients undergoing TEE, the rate of complications was 1.7%.5 Serious complications occurred in only two patients (0.2%). Colreavy et al.8 studied the safety and utility of TEE performed by ICU physicians in 255 critically ill patients and showed that TEE was associated with a complication rate of only 1.6%. It is reasonable to conclude that TEE is associated with few complications, given the high severity of illness among ICU patients.5 Close monitoring of hemodynamic and oxygenation parameters is essential. Box W2-4 lists specific contraindications to the insertion of a TEE probe.
 Bedside Echocardiography in a Critically Ill Patient
Echocardiography can provide diagnostic information noninvasively regarding cardiac structure and mechanical function. The supplementary information provided by this technique can help determine the cause of hypotension refractory to inotropic support or vasopressor infusions.3 It also can help in the diagnosis of a wide spectrum of other cardiovascular abnormalities and guide therapeutic management. An adequate understanding of the proper use of echocardiography is a prerequisite for the intensivist. General indications for performance of an echocardiographic examination in the ICU are listed in Box W2-1.
Transthoracic Versus Transesophageal Echocardiography in a Critically Ill Patient
Accurate and prompt diagnosis is crucial in the ICU. The easiest and least invasive way to image cardiac structures is TTE.3 This noninvasive imaging modality is of great value in the critical care setting because of its portability, widespread availability, and rapid diagnostic capability. In the ICU, TTE in certain cases may fail to provide adequate image quality because of different factors that potentially can hinder the quality of the ultrasound signal, as was described previously. The failure rate (partial or complete) of TTE in the ICU has been reported to be 30% to 40%.10,11 Improvements have been made in transthoracic imaging (e.g., harmonics and contrast and digital technologies), however, resulting in a lower failure rate of TTE in the ICU (10%-15% in our institution).
TEE is particularly useful for evaluation of suspected aortic dissection, prosthetic heart valves (especially in the mitral position), source of cardiac emboli, valvular vegetations, possible intracardiac shunts, and unexplained hypotension. TEE allows better visualization of the heart in general and especially the posterior structures, owing to the proximity of the probe and favorable acoustic transmission.1 TTE also has limitations, however. For several areas of the heart and great vessels, TEE may provide limited images. The view of the left ventricular apex often is foreshortened with TEE, and an apical left ventricular clot can be missed. TTE usually is superior for visualization of the apex. Because of interposition of the left mainstem bronchus, the superior portion of the ascending aorta is another important area that may not be well visualized with TEE. With TEE, transducer position and angulation are constrained by the relative positions of the esophagus and heart. The relatively fixed relationship between the position of the probe and the heart often makes it impossible to align the Doppler beam parallel to the flow of interest (e.g., to evaluate the jet of blood resulting from aortic stenosis). In addition, the 2D image planes of TEE often make standard anatomic measurements more difficult to obtain.
As a result of the significantly improved technical quality of TTE, most ICU patients can be studied satisfactorily with this modality. Immediate TEE is still preferable, however, in certain specific clinical situations in which TTE is likely to fail or be suboptimal.11 The major indications for primary TEE in the ICU12,13 are listed in Box W2-2. Even when TEE is necessary, data from the TTE examination are often essential for the final clinical interpretation.
Hemodynamic Evaluation
Ventricular Function
Left Ventricular Systolic Function
The simplest quantitative approach is to measure the mid-left ventricular short-axis dimension at end diastole and end systole for determination of the percent fractional shortening. Fractional shortening is related directly to EF; normal fractional shortening is 30% to 42%.1

In the setting of regional wall motion abnormalities, fractional shortening may underestimate or overestimate global ventricular function and must be interpreted in light of what is seen in all of the 2D imaging planes of the ventricle.14
Global systolic ventricular function also can be assessed quantitatively by fractional area change (normal value is 36% to 64%)15 and EF (normal value is 55% to 75%) (Figure W2-1):

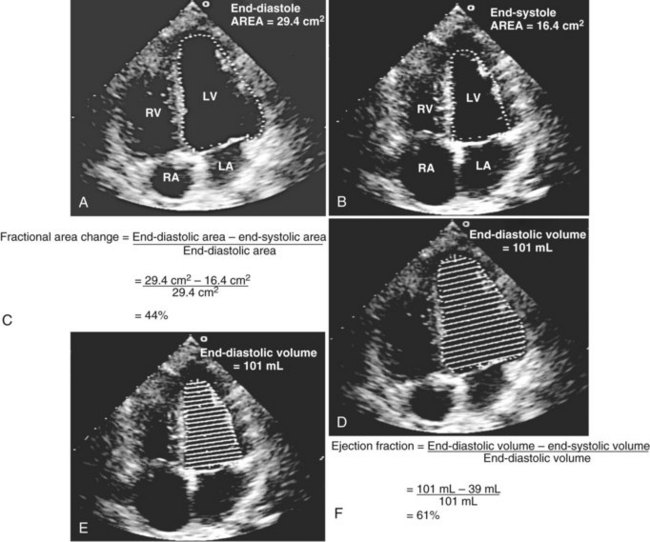
Figure W2-1 Fractional area change and ejection fraction calculation. Endocardial contour of the left ventricular cavity is traced at end diastole (A) and at end systole (B) in the transthoracic apical four-chamber view. Machine-integrated software computes the data and gives corresponding end-diastolic and end-systolic areas. Fractional area change can be calculated with these data (C). Normal values are 36% to 64%.15 Corresponding end-diastolic (D) and end-systolic (E) volumes are computed using the modified Simpson’s method. The data are used to calculate the ejection fraction (F). Normal values are 55% to 75%. LA, left atrium; LV, left ventricle; RA, right atrium; RV, right ventricle.
These measurements require good image quality, because endocardial border contours must be traced (see Figure W2-1). Machine-integrated software computes the data and provides volumes, areas, and the resultant EF (see Figure W2-1). In patients with regional wall motion abnormalities, more precise measures of stroke volume can be made by approximating ventricular volumes as a stack of elliptical discs on biplane imaging (modified Simpson’s method).1,15
In the critical care setting, endocardial border definition may be suboptimal because of poor image quality.10,16,17 In these cases, global ventricular function often is assessed qualitatively by visual inspection alone. This method has been found to be reliable when used by experienced clinicians.18 By simple visualization of the kinetics and size of the cardiac cavities in real time, an experienced intensivist with a sufficient echocardiographic background can establish a functional diagnosis immediately.
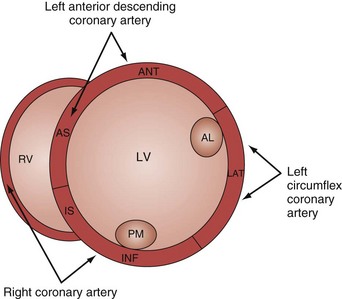
Analysis of regional wall motion includes a numerical scoring system to describe the movement of the different regions of the left and right ventricle (1 = normokinesia; 2 = hypokinesia; 3 = akinesia; 4 = dyskinesia; 5 = aneurysmal change).15 Visualized from the short-axis view of the left ventricle, a complete overview of myocardial areas perfused by the three major coronary arteries can be obtained (Figure W2-2). If the TTE examination is technically difficult and the endocardium is poorly visualized, harmonic imaging and possibly contrast, if needed, can dramatically improve endocardial border visualization and subsequent evaluation of global systolic function (as discussed further later in this chapter). For the remaining few technically challenging cases with suboptimal TTE, performance of TEE allows for a more precise evaluation of ventricular function in most critically ill patients because of the higher image quality that can be obtained with this echographic modality.
Left Ventricular Failure in the Intensive Care Unit
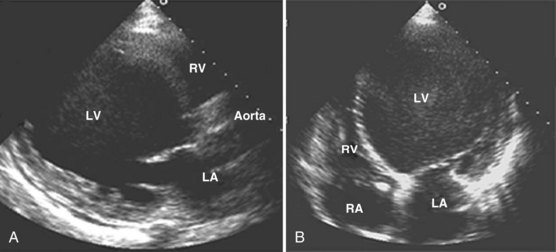
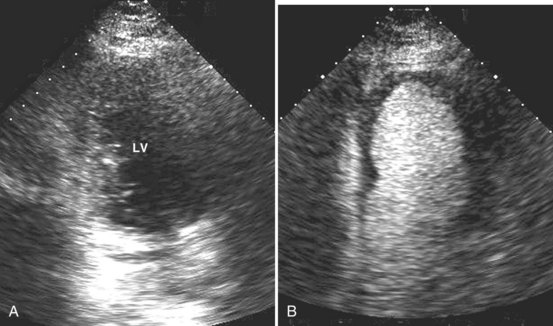
In a critically ill patient with unexplained hemodynamic instability, determination of cardiac function is an integral part of the medical management. Echocardiography is valuable in this setting because the clinical examination and invasive hemodynamic monitoring often fail to provide an adequate assessment of ventricular function. In a study by Fontes et al.19 that compared pulmonary artery (Swan-Ganz) catheterization and TEE, the overall predictive probability for conventional clinical and hemodynamic assessment of normal ventricular function was 98%, whereas for abnormal ventricular function (EF <40%), it was 0%. Several other studies have reported similar results.20–22 Assessment of biventricular function is one of the most important indications for performance of echocardiography in the ICU. In a study by Bruch et al.,23 115 critically ill patients were studied by TEE. The most common indication for TEE was hemodynamic instability (67% of patients). Of these hemodynamically unstable patients, 20 (26%) were found to have significant left ventricular dysfunction (EF <30%). In a study by McLean24 of the use of TEE in the ICU, the most common reason to request a TEE was assessment of left ventricular function. In most patients, left ventricular function was assessed adequately by TTE before TEE. In a study by Vignon et al.,17 TTE allowed adequate evaluation of global left ventricular function in 77% of mechanically ventilated ICU patients. Although TEE was needed for most other indications, TTE was shown to be an excellent diagnostic tool for assessment of left ventricular function in the ICU (Figure W2-3) even when positive end-expiratory pressure is present.
Sepsis-Related Cardiomyopathy
Classically, septic shock has been considered a “hyperdynamic” state characterized by normal or high cardiac output. Echocardiographic studies indicate that ventricular performance often is markedly impaired in patients with sepsis.25–27 Parker et al.28 were the first to describe left ventricular hypokinesis in septic shock. They reported that survivors manifested severely depressed left ventricular EF, but that adequate left ventricular stroke output was maintained as a result of acute left ventricular dilation.29 Jardin et al.25 studied 90 patients with septic shock and performed daily bedside assessments of left ventricular volume and left ventricular EF using TTE. They observed that left ventricular EF was significantly depressed in all patients, resulting in severe reductions in left ventricular stroke volume. Of these patients, 34 (38%) eventually were weaned from hemodynamic support and showed gradual improvement in left ventricular EF and ultimately recovered. The remaining 56 patients (62%) eventually died (of early circulatory failure or late multiple organ failure). In this subset, the degree of left ventricular dysfunction was less than in survivors but failed to improve over time. The severity of left ventricular dysfunction does not predict outcome. A paradoxical relationship between the degree of left ventricular dysfunction and the likelihood of recovery also has been described by others.25,28,30,31 Among patients who survive, left ventricular dilation and systolic dysfunction usually are reversible.
Left ventricular EF might not be a reliable index of left ventricular systolic function in patients with early septic shock because this is a state characterized by low systemic vascular resistance that unloads the left ventricle.25 Normal or supranormal EF in early sepsis might lead clinicians to make the wrong inference about cardiac reserve because left ventricular EF might decrease if afterload is increased by the administration of vasopressor agents.
Left Ventricular Diastolic Function
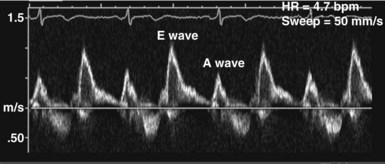
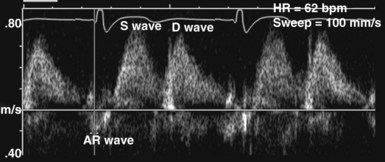
In the ICU, diastolic dysfunction should be suspected when ventricular filling pressure (pulmonary capillary wedge pressure) is elevated and EF is normal or supranormal.1 The diastolic properties of the ventricle often are assessed by evaluating Doppler echocardiographic mitral inflow and pulmonary venous flow patterns. Mitral inflow, as measured by pulsed wave Doppler at the tips of the mitral leaflets, is characterized by an early filling phase (E wave) followed by atrial systole, resulting in additional filling (A wave) (Figure W2-4). The transmitral Doppler pattern always should be interpreted in conjunction with pulsed wave Doppler of the pulmonary venous flow, which is characterized by a systolic phase (S), a diastolic phase (D), and an atrial phase (AR) from reversal of flow into the pulmonary veins during atrial contraction (Figure W2-5). These filling patterns are related to the intrinsic diastolic properties of the myocardium and are influenced by many different factors, particularly left atrial pressure, heart rate, ischemia, ventricular hypertrophy, and valvular pathologies. Only modest correlation has been found between Doppler indices of diastolic function and parameters measured using more invasive means.32,33 Integrated interpretation of mitral and pulmonary venous flow patterns may be useful for diagnosing abnormal myocardial relaxation (e.g., owing to hypertensive heart disease, hypertrophic cardiomyopathy, or coronary ischemia) or restrictive pathology (e.g., owing to cardiomyopathy, constrictive pericarditis, coronary artery disease, cardiac transplantation, or dilated cardiomyopathy). Nevertheless, these findings must be interpreted with caution when caring for critically ill patients, given the many different factors that can acutely influence flow patterns in this population of patients.
Right Ventricular Function and Ventricular Interaction
Abnormal right ventricular function often plays an important and sometimes underestimated role in the pathogenesis of critical illness.34–36 Based on an echocardiographic definition,37 massive pulmonary embolism and acute respiratory distress syndrome are the two main causes of acute cor pulmonale in adults.38 In the critical care setting, right ventricular function also can be altered by any other perturbations that increase right ventricular afterload, such as positive end-expiratory pressure or increased pulmonary vascular resistance (from vascular, cardiac, metabolic, or pulmonary causes). Depressed right ventricular systolic function is also often associated with right ventricular infarction, most commonly in the setting of inferior myocardial infarction. Acute sickle-cell crisis, air or fat embolism, myocardial contusion, and sepsis are other causes of acute right ventricular dysfunction.
Adequate assessment of right ventricular function is important when caring for hemodynamically unstable, critically ill patients, specifically patients with massive pulmonary embolism and acute respiratory distress syndrome, because the diagnosis of concomitant significant right ventricular dysfunction may alter therapy (e.g., fluid loading, use of vasopressors, use of thrombolytics) and provide information about prognosis.38,39 Echocardiographic examination of the right ventricle requires primarily an assessment of the size and kinetics of the cavity and septum.37,40 Normally the right ventricle appears relatively flat. As it dilates, the apical region of the right ventricle becomes more rounded (Figure W2-6). In the short-axis view, the right ventricle, which usually has a crescentic shape, becomes oval because of septal displacement and bulging of the right ventricular free wall (see Figure W2-6).1 Right ventricular size and function generally are evaluated by visual comparison with the left ventricle. Right ventricular diastolic dimensions can be obtained by measuring right ventricular end-diastolic area in the long axis, from an apical four-chamber view, using either TTE or TEE.
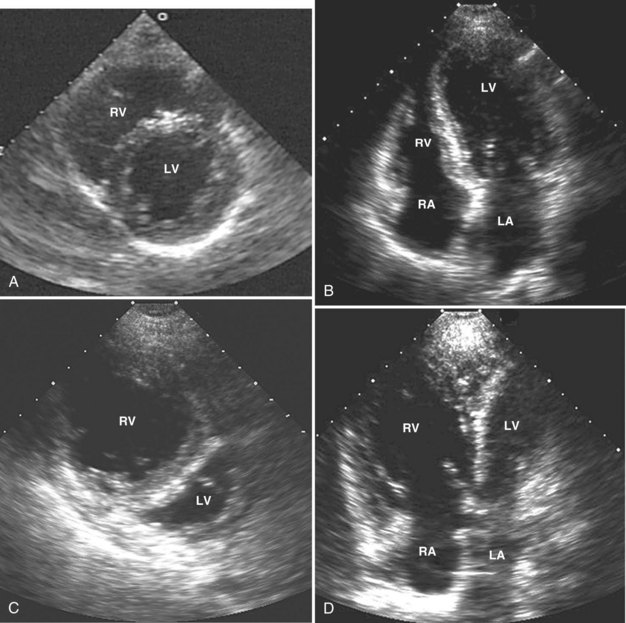
Because pericardial constraint necessarily results in left ventricular restriction when the right ventricle acutely dilates (i.e., there is ventricular interaction), one of the best ways to quantify right ventricular dilation is to measure the ratio between the right ventricular and left ventricular end-diastolic areas, an approach that cancels out individual variations in cardiac size.37,40 Moderate right ventricular dilation corresponds to a diastolic ventricular ratio greater than 0.6; severe right ventricular dilation corresponds to a ratio greater than or equal to 1.37,40 Right ventricular diastolic enlargement usually is associated with right atrial dilation, inferior vena caval dilation, and tricuspid regurgitation. When pressure in the right atrium exceeds pressure in the left atrium, the foramen ovale may open. Pressure and volume overload of the right ventricle can lead to distortion of left ventricular geometry and abnormal motion of the interventricular septum. With conditions of high strain imposed on the right ventricle (volume or pressure overload or both), the interventricular septum flattens, and the left ventricle appears to have a “D” shape (see Figure W2-6).4,37 This “paradoxical” septal motion also is seen at the interatrial level.
Because the two ventricles are enclosed within the relatively stiff pericardium, the sum of the diastolic ventricular dimensions has to remain constant.41 Acute right ventricular or left ventricular dilation can occur only if it is associated with an acute and proportional reduction in left ventricular or right ventricular diastolic dimension (i.e., ventricular interaction). With acute right ventricular dilation, septal displacement impairs left ventricular relaxation; the opposite occurs with acute left ventricular dilation. In these situations, the pressure-volume relationships of the left and right heart chambers are altered, and information obtained from a pulmonary artery catheter could be misleading (e.g., high filling pressures are recorded despite normal or even low circulating volume).
Pulmonary Embolism
Hemodynamic instability from acute cor pulmonale as a consequence of massive pulmonary embolism is a relatively common occurrence in critically ill patients. Until more recently, contrast pulmonary angiography generally was regarded as the gold standard for the diagnosis of pulmonary embolism. Angiography is an invasive procedure, however, and carries the risk of major complications in patients with circulatory failure.42 Contrast-enhanced helical computed tomography (CT) is an accurate and noninvasive test that has replaced angiography for the diagnosis of pulmonary embolism. Even CT requires transportation of patients to a location outside of the ICU, however, and transport alone is associated with significant risks. Echocardiography is well suited for diagnosis of pulmonary embolism because it can be done within minutes at the bedside. The diagnosis of acute cor pulmonale at the bedside with TTE has good positive predictive value for massive pulmonary embolism.43,44 This technique can detect acute right ventricular dilation and dysfunction resulting from a large pulmonary embolism. The finding of right ventricular dilation and dysfunction is not specific for pulmonary embolism, however, because these findings may be observed with a variety of other conditions associated with increased right ventricular strain. In a study by McConnell et al.,45 patients with acute pulmonary embolism were found to have a distinct regional pattern of right ventricular dysfunction with akinesia of the mid–free wall but normal motion at the apex by TTE. These findings contrasted with findings obtained in patients with primary pulmonary hypertension who had abnormal wall motion in all regions. Regional right ventricular dysfunction had a sensitivity of 77% and a specificity of 94% for the diagnosis of acute pulmonary embolism; positive predictive value was 71%, and negative predictive value was 96%. The presence of regional right ventricular dysfunction that spares the apex should raise the level of clinical suspicion for the diagnosis of acute pulmonary embolism.
Central pulmonary emboli are present in half of patients with symptoms of pulmonary embolism and acute cor pulmonale on TTE.5 Emboli lodged in the proximal pulmonary arteries usually cannot be visualized using TTE.5 Because other clinical conditions can produce acute cor pulmonale in the ICU, better visualization of the pulmonary arteries is needed to achieve high accuracy for the diagnosis of pulmonary embolism. This goal can be achieved by using TEE. TEE has good sensitivity for detecting emboli lodged in the main and right pulmonary arteries but is limited for the detection of more distal or left pulmonary emboli.5,46,47 If an embolus is visualized, the diagnosis is made. If the study is negative when the index of suspicion for pulmonary embolism is high, however, TEE must be followed up by a more definitive test such as angiography or helical CT. Also, when there is high clinical suspicion for pulmonary embolism but no emboli are visualized using TEE, the potential for nonthrombotic causes of pulmonary embolism (e.g., air or fat emboli) must be kept in mind.
The demonstration of acute cor pulmonale with echocardiography has important prognostic and therapeutic implications.48,49 The presence of cor pulmonale with massive pulmonary embolism is associated with increased mortality, whereas the absence of right ventricular dysfunction is associated with a better prognosis.39 There is no consensus on the precise indications for administration of thrombolytics in massive pulmonary embolism complicated by acute cor pulmonale.50,51 A safe and reasonable strategy for managing critically ill patients with suspected massive pulmonary embolism is as follows:
Assessment of Cardiac Output
Measurement of cardiac output remains a cornerstone in the hemodynamic assessment of critically ill patients. Thermodilution is considered the gold standard approach for determining cardiac output in most ICUs. Measurement of cardiac output using thermodilution requires placement of a pulmonary artery catheter (or at least central venous and arterial catheters); although a useful technique, it is invasive and potentially inaccurate. Unreliable values are particularly common in the presence of tricuspid regurgitation related to high pulmonary artery pressure. Several methods for determining cardiac output have been described using 2D and Doppler echocardiography. With this technique, stroke volume and cardiac output can be determined directly by combining Doppler-derived measurements of instantaneous blood flow velocity through a conduit with the cross-sectional area of the conduit. Blood flow can be calculated through various cardiac structures, including the pulmonary valve,52 mitral valve,53,54 and aortic valve.55–58 In the absence of intracardiac shunts, blood flow through these structures should be the same (continuity equation).59 Of these methods, the one using the left ventricular outflow tract and aortic valve as the conduit is probably the most reliable and most commonly used. There is excellent agreement with thermodilution in most situations.55–58 The left ventricular stroke volume is obtained by measuring the cross-sectional area of the left ventricular outflow tract (area [cm2] = (left ventricular outflow tract diameter [cm2]) × (π/4), assuming that just below the aortic annulus, the left ventricular outflow tract is circular) multiplied by the transaortic flow velocity time integral derived from a spectral Doppler tracing. The stroke volume obtained is multiplied by the heart rate to give the cardiac output: cardiac output = cross-sectional area × velocity time integral × heart rate (Figure W2-7).
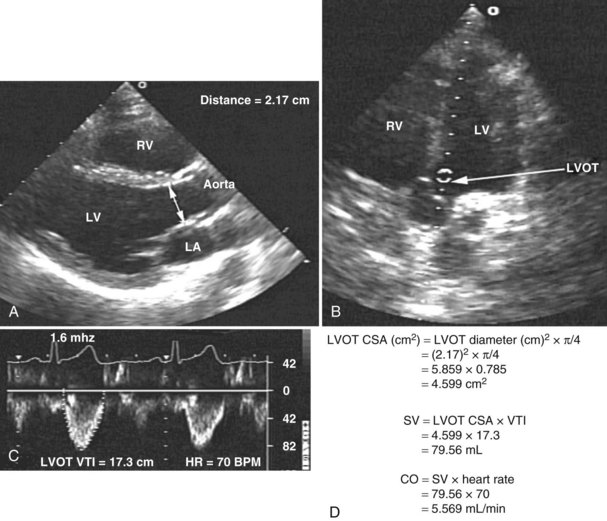
With TTE, the left ventricular outflow tract diameter usually is obtained from the parasternal long-axis view, just below the insertion of the aortic valve leaflets. The Doppler interrogation is performed through the aortic valve from the apical view (see Figure W2-7). With TEE, the left ventricular outflow tract diameter usually is obtained from the five-chamber view of the left ventricle. The transgastric view usually is used to obtain an apical long-axis view of the aortic valve through which Doppler interrogation is performed.60 With either TTE or TEE, obtaining an accurate left ventricular outflow tract diameter and Doppler signal is essential to have an accurate cardiac output calculation. Because the measure of the left ventricular outflow tract diameter has a second-order relationship with the cross-sectional area (see previous formula), it is crucial that this measure be determined precisely. For the Doppler signal to be reliable, the Doppler sample must be parallel to the transaortic flow with an angle of incidence not exceeding 20 degrees to avoid underestimation of transaortic velocity. Using TTE, McLean and coworkers61 showed an excellent correlation (r = 0.94) between cardiac output determined by the left ventricular outflow tract Doppler method and the thermodilution method in critically ill patients. Other studies have shown similar results.55 In a study by Feinberg et al.,58 cardiac output determined by TEE Doppler imaging was obtainable in 88% of 33 critically ill patients, and there was good correlation (r = 0.91) with the thermodilution method. Descorps-Declere et al.60 also showed transgastric pulsed Doppler measurement across the left ventricular outflow tract with TEE to be a clinically acceptable method for cardiac output measurement in critically ill patients (r = 0.975 compared with the thermodilution method).
Another promising ultrasound-based technology to estimate cardiac output noninvasively in adults uses a small transesophageal Doppler probe to measure blood flow velocity waveforms in the descending aorta combined with a nomogram (based on height, weight, and age) for estimation of aortic cross-sectional area. This minimally invasive esophageal probe can be inserted easily in sedated patients and left in place safely for several days to provide continuous monitoring of cardiac function.62,63 Several technical problems can limit the accuracy of cardiac output measurements by esophageal Doppler monitoring,62 however, and although initial results are promising,64–66 more studies are needed to make a decision regarding the accuracy of this technique in critically ill patients.
Assessment of Filling Pressures and Volume Status
Adequate determination of preload and volume status is important for proper management of critically ill patients. Invasive pressure measurements to assess left ventricular filling are commonly used at the bedside to make inferences regarding left ventricular preload. These pressure measurements correlate only weakly with left ventricular volume, however.67 Data from invasive monitoring using pulmonary artery catheterization may be misleading because ventricular compliance is altered secondary to numerous factors.68,69 Differences in diastolic compliance among patients may account for the weak correlation between pressure and volume and may limit the ability to use pressure measurements alone to derive information concerning left ventricular preload.14 Echocardiography can be helpful for adequately assessing preload. Parameters that can be measured using 2D imaging are left ventricular end-diastolic volume and left ventricular end-diastolic area. Using Doppler interrogation, additional information—mainly transmitral diastolic filling pattern and pulmonary venous flow—can be obtained.
Two-Dimensional Imaging
Echocardiography has been validated for left ventricular volume measurements.15 Subjective assessment of left ventricular volume by estimating the size of the left ventricular cavity in the short-axis and long-axis views is often adequate to guide fluid volume therapy at the extreme ends of cardiac filling and function. More precise quantitative values are desirable, however, and can be obtained by using endocardial border tracing (as described earlier). The normal left ventricular end-diastolic volume as determined by echocardiography is 80 to 130 mL,15 and the normal left ventricular end-diastolic volume index is 55 to 65 mL/m2.15 Left ventricular end-diastolic area measured in the left parasternal short-axis view at the level of the midpapillary muscle is commonly used to estimate volume status (Figure W2-8). The normal values for left ventricular end-diastolic area in the short-axis view are 9.5 to 22 cm2.15
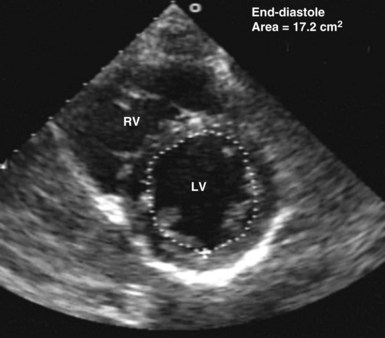
Figure W2-8 Calculation of left ventricular end-diastolic area in the transthoracic short-axis view at the level of the midpapillary muscle by endocardial contour tracing. Values of normal left ventricular end-diastolic area in the short axis range from 9.5 to 22 cm2.15 The level of the midpapillary muscle is used because of the reproducibility of the view and because changes in left ventricular volume affect the short axis of the ventricle to a greater degree than the long axis. LV, left ventricle; RV, right ventricle.
Two-dimensional TTE evaluation of ventricular dimensions has been found to be useful in assessing preload and optimizing therapy of ICU patients.25,70 Nevertheless, image quality may be suboptimal and preclude adequate visualization of the endocardial border by TTE. This potential limitation of TTE has been partly circumvented in recent years with the advent of harmonic imaging and contrast echocardiography (see later). In cases in which endocardial border visualization remains suboptimal, TEE is the modality of choice. With TEE, left ventricular volume can be estimated rapidly by subjective assessment of the left ventricular size. Quantitatively, it is estimated most often by determining left ventricular cross-sectional area at the end of diastole, most commonly using the transgastric short-axis view at the level of the midpapillary muscle. This section is used because of the reproducibility of the view and because changes in left ventricular volume affect the short axis of the ventricle to a greater degree than the long axis.14 The end-diastolic area must be measured consistently from the same reference section. End-diastolic area measured with TEE correlates with left ventricular volume determined by radionuclide studies.70
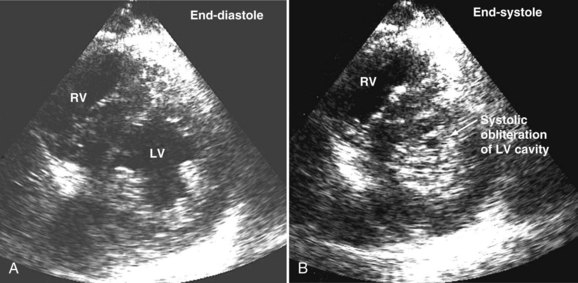
Systolic obliteration of left ventricular cross-sectional area accompanies decreased end-diastolic area and is considered to be a sign of severe hypovolemia (Figure W2-9). Although a small end-diastolic area generally indicates hypovolemia, a large end-diastolic area does not indicate adequate preload in patients with left ventricular dysfunction. Also, when systemic vascular resistance is low, as in early sepsis, left ventricular emptying is improved because of the lowered afterload. In these situations, it may be difficult to differentiate hypovolemia from low systemic vascular resistance by echocardiography alone, because both conditions are associated with decreased end-diastolic area.
Knowledge of left ventricular end-diastolic volume or absolute preload does not allow for accurate prediction of the hemodynamic response to alterations in preload.71 Tousignant et al.72 investigated the relationship between left ventricular stroke volume and left ventricular end-diastolic area in a cohort of ICU patients and found only a modest correlation (r = 0.60) between single-point estimates of left ventricular end-diastolic area and responses to fluid loading. Based on the assumption that changes in end-diastolic area occur because of changes in left ventricular volume, the determination of this area and its subsequent degree of variation after a fluid challenge could help better assess preload responsiveness. Studies have shown that changes in end-diastolic area measured by TEE using endocardial border tracing are closely related to changes in cardiac output and are superior to measurements of pulmonary artery occlusion pressure for predicting the ventricular preload associated with maximal cardiac output.73
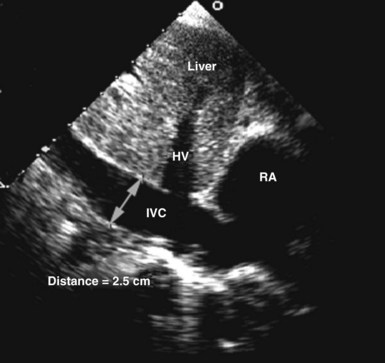
Circulating volume status also can be assessed by 2D echocardiography by indirectly estimating right atrial pressure; this is often done by assessing the diameter and change in caliber with inspiration of the inferior vena cava (Figure W2-10). This method has been shown to discriminate reliably between right atrial pressures less than 10 mm Hg or greater than 10 mm Hg.74 A dilated vena cava (diameter >20 mm) without a normal inspiratory decrease in caliber (>50% with gentle sniffing) usually indicates elevated right atrial pressure. In mechanically ventilated patients, this measure is less specific because of a high prevalence of inferior vena cava dilation.75,76 A small vena cava reliably excludes the presence of elevated right atrial pressure in these patients.75,76
Doppler Flow Patterns
Information obtained by analysis of the Doppler signal at the level of the mitral valve and pulmonary vein offers additional information about preload.77,78 These Doppler profiles can be obtained by either TTE or TEE. Transmitral parameters that have been studied include the relation of early to late transmitral diastolic filling (E/A ratio), isovolumetric relaxation time, and the rate of deceleration of early diastolic inflow (deceleration time).1
A decrease in preload causes a significant reduction in the E wave (early filling flow wave) velocity at the mitral level in conjunction with a decrease of the S wave (systolic flow wave) in the pulmonary vein. In clinical practice, the E/A ratio is easy to assess; the normal value of this ratio is approximately 1.1,3 In conjunction with normal left ventricular contractility, a low E/A ratio is usually a characteristic sign of inadequate preload.79
Pulmonary venous flow also can be used to assess left atrial pressure. A normal pulmonary venous flow pattern showing a predominance of flow during systole (S phase) compared with early diastole (D phase) usually indicates that left atrial pressure is less than 8 mm Hg, whereas the opposite predominance of flow (in the absence of significant mitral regurgitation) usually indicates elevation of left atrial pressure.1
Hypovolemia in the Intensive Care Unit
Precise and rapid assessment of volume status is crucial when caring for hemodynamically unstable ICU patients. Hypovolemia is one of the most common causes of hypotension in the ICU. As was discussed in detail earlier, bedside echocardiography offers a quick and reliable way of estimating volume status by evaluating cardiac dynamics and left ventricular dimensions and area. The finding of end-systolic cavity obliteration is usually a reliable sign of hypovolemia. Other changes in the volume status are usually associated with subtle changes in left ventricular cavity size, so only this extreme is reliable to make the diagnosis of hypovolemia by echocardiography. In general, TTE has good sensitivity for diagnosing the presence of a small hyperdynamic left ventricle, the most typical finding in hypovolemic patients with underlying normal cardiac function, although TEE is useful in the immediate postoperative setting (Video W2-1).
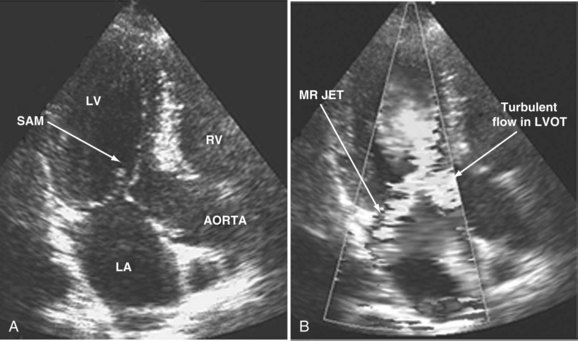
When dynamic left ventricular obstruction is present, cardiac output is low, and even in the presence of marked hypovolemia, pulmonary artery occlusion pressure is high. Paradoxical worsening of hypotension after intravascular volume loading may be the first clue to dynamic left ventricular obstruction in critically ill patients. It is important that this entity be recognized early and that the pathophysiologic process be well understood, because inadequate management of this condition can lead rapidly to worsening of hemodynamic status and death. Dynamic obstruction of the left ventricle can present in different forms. One of these forms is dynamic left ventricular outflow tract obstruction. Although dynamic left ventricular outflow tract obstruction is often seen in association with asymmetrical septal hypertrophy, it also can occur in other situations.80,81 Dynamic left ventricular outflow tract obstruction is thought to be caused by the Venturi effect. This effect results when excessive acceleration of blood through a conduit produces a decrease in pressure. In the left ventricular outflow tract, such a decrease in pressure leads to a suction phenomenon that draws the anterior mitral leaflet and chordae inward toward the interventricular septum.82 This systolic anterior motion of the mitral valve leads to contact between the mitral leaflet and the septum that creates an obstructive subaortic pressure gradient and distortion of the mitral valve leaflet coaptation (Figure W2-11).82 By 2D echocardiography, the left ventricle appears to be small and hyperdynamic, and there is motion of the anterior leaflet (or chordae or both) toward the septum in systole (see Figure W2-11). With color Doppler, a “mosaic” pattern of flow is seen in the left ventricular outflow tract, owing to the high velocity and turbulence. Variable degrees of asymmetrical mitral regurgitation also may be present (see Figure W2-11). Continuous-wave Doppler shows the presence of a significant gradient in the left ventricular outflow tract. Dynamic left ventricular obstruction also can be present without systolic anterior motion. In the presence of reduced afterload, dehydration, or significant catecholaminergic stimulation, patients with a small hypertrophied left ventricle (typically seen in elderly patients with chronic hypertension) can develop midventricular obstruction due to hyperdynamic systolic obliteration of the left ventricular cavity (see Figure W2-9).83 These physiologic factors may predict development or worsening of left ventricular dynamic obstruction. Interplay of these factors with preexisting ventricular hypertrophy predisposes the patient to develop cardiogenic shock from this combined loss of preload and presence of dynamic left ventricular obstruction. Dynamic left ventricular obstruction has also been described in patients with acute myocardial infarction, mostly in association with apical infarction.81,84,85
In a study by Chenzbraun et al.85 in ICU patients, four patients with hemodynamic instability were found to have a small hyperdynamic ventricle on TEE. Of these four patients, three had pulmonary artery occlusion pressure greater than 20 mm Hg. A study by Poelaert et al.20 that evaluated the diagnostic value of TEE compared with pulmonary artery catheterization showed that pulmonary artery catheterization failed to diagnose the presence of hypovolemia in 44% of patients when TEE showed systolic obliteration of the left ventricular cavity, supporting a diagnosis of hypovolemia. TTE and TEE have been shown to play a key role in making the diagnosis of hypovolemia and left ventricular dynamic obstruction, leading to a dramatic impact on therapy.19,21,22,82–85
Assessment of Pulmonary Artery Pressure
Pulmonary hypertension is common in critically ill patients and is a manifestation of various pulmonary, cardiac, and systemic processes. Pulmonary hypertension is said to be present when systolic pulmonary pressure is greater than 35 mm Hg, diastolic pulmonary pressure is greater than 15 mm Hg, and mean pulmonary pressure is greater than 25 mm Hg.59 Many echocardiographic methods have been validated for noninvasive estimation of pulmonary artery pressure.59,86 These methods can be helpful in the ICU. Systolic and diastolic pulmonary artery pressures are determined from the tricuspid and pulmonary regurgitation velocities (some degree of regurgitation is essential to be able to obtain a Doppler signal and subsequently determine pulmonary artery pressure). Tricuspid regurgitation is present in more than 75% of healthy adults59 and in approximately 90% of critically ill patients.87 Peak tricuspid regurgitation velocity, usually obtained by continuous wave Doppler from the right ventricular inflow or the apical four-chamber view position, reflects the pressure difference during systole between the right ventricle and the right atrium (Figure W2-12).88–90 Peak systolic pulmonary artery pressure is determined from the peak tricuspid regurgitation Doppler velocity using the modified Bernoulli equation91: ΔP = 4 × (peak tricuspid regurgitation velocity)2. To this peak systolic pressure gradient between right ventricle and right atrium is added the estimated right atrial pressure (see previous section) to obtain the peak right ventricular systolic pressure. In the absence of pulmonic stenosis or right ventricular outflow obstruction, peak right ventricular systolic pressure is equal to systolic pulmonary artery pressure (see Figure W2-12). Echocardiography also can determine diastolic pulmonary artery pressure by applying the modified Bernoulli equation using the regurgitant Doppler velocity of the pulmonary valve to obtain the gradient between the pulmonary artery and the right ventricle at end diastole. To this is added the estimated right atrial pressure (equivalent to right ventricular end-diastolic pressure in the absence of tricuspid stenosis) to obtain end-diastolic pulmonary artery pressure: end-diastolic pulmonary artery pressure = 4 × (peak pulmonary regurgitation velocity)2 + estimated right atrial pressure. Approximately 70% of critically ill patients have an adequate Doppler signal of pulmonic insufficiency for this calculation.92 Tricuspid and pulmonary regurgitation are present at the same time in more than 85% of subjects.93
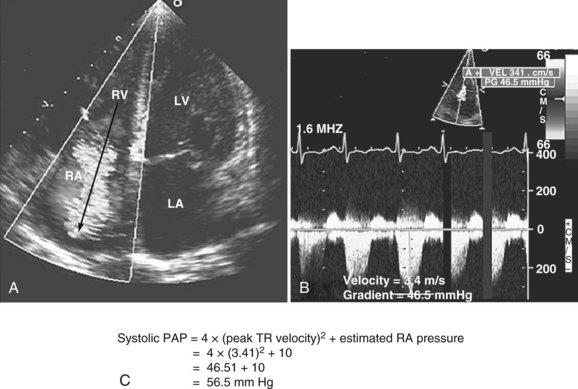
Figure W2-12 Calculation of systolic pulmonary artery pressure (PAP). A, Color Doppler transthoracic apical four-chamber view showing a significant tricuspid regurgitation (TR) jet from right ventricle (RV) to right atrium (RA). The peak tricuspid regurgitation velocity is measured by placing the continuous wave Doppler in the center of the tricuspid regurgitation jet (arrow). B, Spectral continuous wave Doppler profile of the tricuspid regurgitation jet. Peak tricuspid regurgitation velocity (3.41 m/s) and peak systolic pulmonary artery pressure gradient (46.5 mm Hg) can be obtained with this modality. C, Peak systolic pulmonary artery pressure also can be determined from the peak tricuspid regurgitation Doppler velocity using the modified Bernoulli equation: ΔP = 4 × (peak tricuspid regurgitation velocity)2. To this peak systolic pressure gradient between right ventricle and right atrium is added the estimated right atrial pressure (determined to be 10 in this example) to obtain the peak right ventricular systolic pressure. In the absence of pulmonic stenosis or right ventricular outflow obstruction, peak right ventricular systolic pressure is equal to systolic pulmonary artery pressure. LA, left atrium; LV, left ventricle. (See Color Section in this text.)
Assessment of Valvular Function and Integrity
Attention has been drawn to the limitations of the physical examination for the detection of cardiovascular abnormalities.94,95 This problem is enhanced in acutely ill patients in the ICU, and many cardiovascular abnormalities may be concurrent with noncardiac illness without being clinically suspected.96 Significant valvular abnormalities are a good example of such cardiovascular pathologies that can be present in a critically ill patient without being clinically recognized.96 Even in the presence of invasive monitoring, significant valvular pathologies may be missed. Precise evaluation of the valvular apparatus often may be warranted in the ICU. The most common indications for bedside echocardiography for evaluation of valvular apparatus in this patient population are for suspected endocarditis,8,24 acute aortic or mitral valve regurgitation,97,98 and prosthetic valve dysfunction.16 Echocardiography is uniquely suited to the evaluation of valvular heart disease because of its ability to provide information regarding the etiology and severity of valvular lesions. In the ICU, TTE can provide valuable information concerning valvular integrity and function,16 but it may be suboptimal and not sensitive enough to detect endocarditis, a dysfunctional mitral valve, or prosthetic valve dysfunction. TEE is often warranted. TEE is especially important for the fine detail of mitral valve pathology, such as a torn chordae tendinae and flail scallop (Video W2-2).
Valvular Regurgitation and Prosthetic Valve Dysfunction
In a patient with unexplained hemodynamic instability and a grossly normal TTE examination, performance of subsequent TEE is important to rule out the presence of significant undetected valvular pathology. Common valvular pathologies that can be missed are mitral regurgitation and prosthetic valve dysfunction. In some situations, TTE may provide better imaging than TEE for evaluation of anterior structures such as the aortic valve (native or prosthetic) and for Doppler measurements. TEE is clearly superior to TTE for evaluation of mitral valve pathologies (native and prosthetic). In a study of ICU patients by Alam,16 TTE compared with TEE was shown either to miss or to underestimate the severity of regurgitation of St. Jude and bioprosthetic valves in the mitral but not in the aortic position.
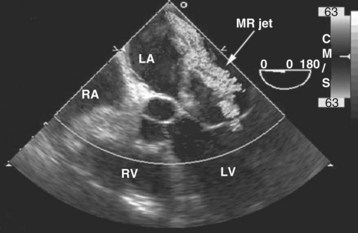
With acute severe mitral regurgitation, the diagnosis may be clinically difficult because the murmur is often of short duration and low intensity (because of rapid pressure equalization between the left ventricle and the relatively noncompliant left atrium). By TTE, the size of the regurgitant jet in acute mitral regurgitation may appear small and lead to underestimation of severity.99 Because of its close anatomic proximity, TEE provides a much more precise evaluation of the degree of mitral regurgitation (Figure W2-13) and provides crucial diagnostic information regarding the cause for mitral regurgitation. The diagnosis of acute mitral regurgitation represents a medical emergency that may necessitate urgent surgery, so the threshold to perform a TEE when this entity is suspected should be low.8,10,97 Also, several investigators have confirmed the superior accuracy, sensitivity, and reliability of TEE over TTE for dysfunction of mitral prostheses, in which ultrasonic shadowing of the left atrium often occurs with the standard transthoracic studies.100–103 TEE may be especially useful to detect obstruction of prosthetic valves from thrombus (Video W2-3).
Traumatic Valvular Injuries
Traumatic valvular injuries associated with myocardial injury may present as acute regurgitation. Bedside exclusion of major trauma to the aorta, valves, and myocardium is important in the posttrauma context.104,105 Valvular injuries may occur as a consequence of blunt or penetrating trauma. Most frequently the aortic valve is injured; less commonly the mitral and tricuspid valves are injured.106 Valvular dysfunction is usually due to a torn leaflet or rupture of a papillary muscle or chordae.106 In trauma patients, TEE is the bedside imaging modality of choice to detect these pathologies.104,105 In a study by Chirillo et al. assessing the usefulness of TTE and TEE in recognition and management of cardiovascular injuries after blunt chest trauma, TTE provided suboptimal imaging in 62% of patients, and the bad quality of images obtained was the main cause for the low sensitivity of TTE compared with TEE.
Evaluation of the Pericardial Space
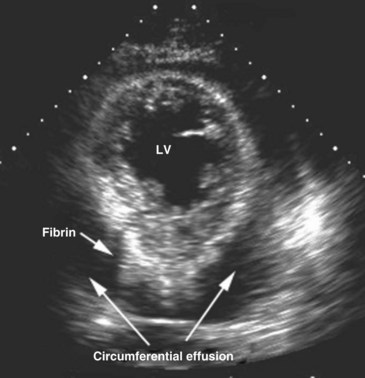
Echocardiography is an essential instrument for the diagnosis of pericardial disease. In the ICU, the most common clinical indication for assessment of the pericardial space is suspected tamponade. The pericardium is a potential space that can become filled with fluid, blood, pus, or uncommonly, air. Presence of fluid in this space is detected as an echo-free space. Pericardial fluid usually is detected easily with TTE. The parasternal long-axis and short-axis views and the apical views usually reveal the effusion (Figure W2-14). In many critically ill patients with suboptimal TTE image quality, the subcostal view is often the only adequate window available to detect the presence of a pericardial effusion. In these ICU patients with poor acoustic windows and in the post–cardiac surgical setting, TEE may be needed to assess the pericardial space adequately.
In addition to assisting in the diagnosis of pericardial effusion and tamponade, 2D echocardiography can assist in its drainage, as pericardiocentesis can be performed safely under 2D echocardiographic guidance.107,108 By determining the depth of the effusion and its distance from the site of puncture, it is possible to optimize the needle placement. Echocardiography also can be used for immediate monitoring of the results of the pericardiocentesis.
Cardiac Tamponade in the Intensive Care Unit
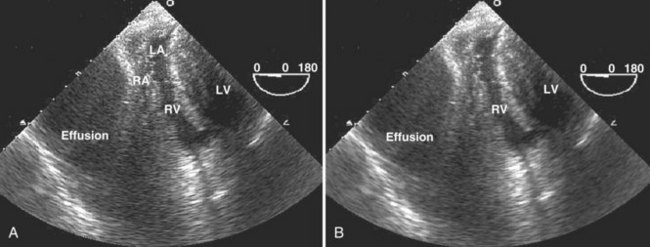
The most common causes of cardiac tamponade in the ICU are listed in Box W2-5. Echocardiographic 2D signs of tamponade are a direct consequence of increased pericardial pressure, leading to diastolic collapse of one or more cardiac chambers (usually on the right side first) (Figure W2-15). Usually, collapse of the right ventricular free wall is seen in early diastole, and right atrial wall collapse is seen in late diastole.14 This latter sign is sensitive but not specific for tamponade. It is, however, specific for a hemodynamically significant effusion if the right atrial collapse lasts longer than one-third of the R-R interval.14,109 In the presence of a massive effusion, the heart may have a “swinging” motion in the pericardial cavity. This finding is not always present in cardiac tamponade, because the amount of fluid in the pericardial space may be small but still cause a tamponade physiology, depending on the acuity with which the effusion accumulates and the compliance of the pericardium. In poststernotomy patients, tamponade may be missed by TTE (even in cases in which imaging quality seems adequate) because hematomas causing selective cardiac chamber compression are often in the form of loculated clots located in the far field of the ultrasound beam in the posterior heart region (even when the anterior pericardium is left open).110 The right atrium and right ventricle may be spared in such cases secondary to postoperative adhesions or tethering of the right ventricle to the chest wall anteriorly.110
Box W2-5
Most Common Causes of Cardiac Tamponade in the Intensive Care Unit
Another (indirect) sign of a hemodynamically significant pericardial effusion on 2D imaging is plethora of the inferior vena cava with blunted respiratory changes.1 The latter sign is less valuable in mechanically ventilated patients, because they often have a stiff, dilated inferior vena cava even in the absence of a pericardial effusion (Video W2-4).
Doppler findings of cardiac tamponade are based on characteristic changes in intrathoracic and intracardiac hemodynamics that occur with respiration. Because of the principle of ventricular interaction, mitral inflow velocity (E wave) decreases after inspiration and increases after expiration. Reciprocal changes occur with respect to tricuspid inflow velocity. With tamponade, the exaggerated inspiratory-expiratory variation of the inflow velocity (E wave) over one respiratory cycle should be greater than 40% on the left and greater than 80% on the right.111 In critically ill patients, however, mechanical ventilation, bronchospasm, significant pleural effusion, and respiratory distress can alter intrathoracic and intracardiac hemodynamics and make these Doppler findings less reliable. A significant pleural effusion sometimes causes significant respiratory Doppler variations of the inflow velocities that disappear when the effusion is drained.112 The presence of arrhythmia also makes the Doppler findings difficult to interpret. In some circumstances, echocardiographic signs of tamponade may be subtle or absent, so one must keep in mind that the diagnosis of tamponade remains a clinical one and that the echocardiographic signs must be analyzed in conjunction with the clinical findings.
Complications after Cardiac Surgery
Bedside echocardiography has proved to be of particular value in the critical care management of patients with hemodynamic instability after cardiothoracic operations.7,8,83,113–115 TTE is often severely limited in this group of patients.5,8 TEE is the modality of choice in this setting because it provides detailed information that can help determine the cause of refractory hypotension. The most frequent echocardiographic diagnoses encountered in these patients are left ventricular or right ventricular failure, tamponade, hypovolemia, and valvular dysfunction. Schmidlin et al.116 studied 136 patients after cardiac surgery and showed that a new diagnosis was established or an important pathology was excluded in 45% of patients undergoing TEE. A therapeutic impact was found in 73% of cases. The main indications for TEE in this study were control of left ventricular function (34%), unexplained hemodynamic deterioration (29%), suspicion of pericardial tamponade (14%), cardiac ischemia (9%), and “other” (14%). Reichert et al.113 performed TEE in hypotensive patients after cardiac surgery. Left ventricular failure was found in 27% of patients, hypovolemia in 23%, right ventricular failure in 18%, biventricular failure in 13%, and tamponade in 10%. Comparison with hemodynamic parameters showed agreement on diagnosis (hypovolemia versus tamponade versus cardiac failure) in only 50% of the cases. Echocardiography identified two cases of tamponade and six of hypovolemia that were not suspected based on standard hemodynamic data. In five patients with hemodynamic findings suggesting tamponade, unnecessary reoperation was prevented because TEE ruled out this diagnosis. Costachescu et al.22 also showed the superiority of TEE compared with conventional monitoring with pulmonary artery catheterization in diagnosing and excluding significant causes of hemodynamic instability in postoperative cardiac surgical patients.
Infective Endocarditis
Occurrence of infective endocarditis in patients hospitalized in an ICU is common. It is often in the differential diagnosis of febrile patients in the ICU. Infective endocarditis was the second most common indication for performance of an echocardiogram among centers reporting their experience, as summarized in a review article by Heidenreich.5 Nearly all critically ill patients are at risk for iatrogenic infection, bacteremia, and subsequent endocarditis because of the presence of multiple indwelling catheters, severe underlying diseases, malnutrition, and prolonged mechanical ventilation. Classic clinical findings suggesting endocarditis106 are uncommon in this patient population. Echocardiography is the test of choice for the noninvasive diagnosis of endocarditis. Fowler et al.117 studied patients with Staphylococcus aureus bacteremia referred for TEE and showed that endocarditis ultimately was diagnosed in 25%. Only 7% of these patients had physical findings suggesting endocarditis before TEE. Absence of clinical stigmata is especially likely if the infection presents acutely. Because the consequences of untreated endocarditis are devastating and often ultimately fatal, it is important that the infection and its complications be recognized promptly and treated appropriately.59
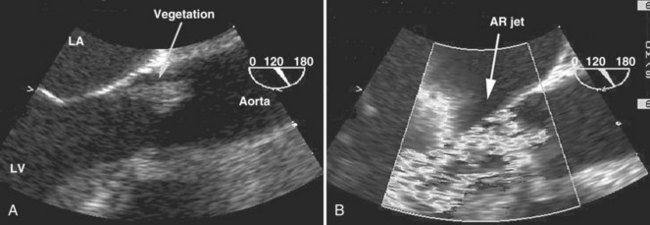
The echocardiographic features typical for infective endocarditis are59,118 (1) an oscillating intracardiac mass on a valve or supporting structure or in the path of a regurgitant jet or an iatrogenic device, (2) abscesses, (3) new partial dehiscence of a prosthetic valve, or (4) new valvular regurgitation. Sensitivity for the echographic diagnosis of endocarditis is 58% to 62% for TTE and 88% to 98% for TEE.119,120 TEE is particularly useful for detecting small vegetations121 and detecting vegetations on prosthetic valves. TEE also has been shown to be superior to TTE for diagnosing complications of endocarditis such as aortic root abscess, fistulas, and ruptured chordae tendineae of the mitral valve.16 Among ICU patients, sensitivity of TTE for the diagnosis of endocarditis is often poor because the quality of the transthoracic study is commonly suboptimal. The sensitivity of TEE for suspected infective endocarditis usually is excellent in the ICU (Figure W2-16). In a study by Font et al.,97 a search for vegetations was the indication for 51 (46%) of 112 TEE studies performed for critically ill patients. TEE increased the detection rate by 27% compared with TTE. Suspicion of endocarditis represented 29% of the indications for TEE in a study of ICU patients by Chenzbraun et al.85; 9 (27%) of 31 patients with suspected infective endocarditis had a positive study for endocarditis. All positive studies were in patients who had an increased likelihood for infective endocarditis before the examination, as indicated by the presence of fever, positive blood cultures, new-onset murmur, prosthetic valve, or new-onset heart failure (alone or in combination). None of the patients with native valves and no clinical features of endocarditis had a TEE study diagnostic of infective endocarditis, and in none of them was the diagnosis of infective endocarditis made later. The findings from this study indicate that TEE is not useful as a screening procedure for infective endocarditis in septic patients without high clinical likelihood for endocarditis. The clinical probability of endocarditis should guide the use of TEE. Clinical risk factors considered high risk included intracardiac prosthetic material, positive blood cultures (in particular S. aureus), evidence of peripheral emboli, and history of previous endocarditis8,16 (Video W2-5).
As concluded by Colreavy et al.,8 performance of TEE in the ICU for suspicion of infective endocarditis should be (1) for cases associated with a clinical likelihood of endocarditis and a negative TTE examination, (2) for suspected prosthetic valve endocarditis, (3) for assessment of complications in known cases of endocarditis, and (4) for cases of S. aureus bacteremia when the source is unknown or blood cultures remain positive despite antibiotic therapy. When assessing a patient for infective endocarditis by echocardiography, one must keep in mind the noninfectious causes of vegetations that may result from tumors, myxomatous degeneration, marantic endocarditis, Lambl’s excrescences, valve thrombus, and suture material in patients with repaired native or prosthetic valves.
Assessment of the Aorta
In the ICU, use of bedside echocardiography for assessment of suspected aortic pathologies provides many advantages over CT or aortography: There is no need for IV contrast administration, there may be less time delay, there is no need for transportation of a critically ill patient, and cardiac morphology and function can be evaluated at the same time.3 For many years, aortography has been the gold standard for the investigation of suspected injuries of the aorta.3 The advent of noninvasive modalities such as CT, magnetic resonance imaging (MRI), and TEE with their excellent sensitivity and specificity to diagnose aortic pathologies has decreased the need for aortograms.
Suspected aortic pathologies can be encountered in different ICU settings. The aorta may have to be imaged to rule out dissection, rupture, aneurysm, aortic debris, or aortic abscess. TTE is a good initial imaging modality for evaluation of the proximal aorta (ascending aorta and arch),59 but the descending thoracic aorta cannot be adequately assessed and visualized with this modality. Because of the close anatomic relationship between the thoracic aorta and the esophagus, TEE allows optimal visualization of the entire thoracic aorta (Figure W2-17). As described earlier, there exists a blind spot in the distal portion of the ascending aorta and the proximal portion of the transverse aorta where imaging can be suboptimal.122,123
Aortic Dissection and Rupture
Patients presenting with suspected aortic dissection need emergency diagnosis and treatment. Different noninvasive tests have been advocated for evaluation of suspected aortic dissection, including TEE, CT, and MRI.5,124 Nienaber et al.124 compared all three modalities and found that they had similar sensitivities (98%). MRI had higher specificity than TEE (98% versus 77%). A limitation of the study was that single-plane TEE was used. With multiplane TEE, specificity is improved to greater than 90% (see Figure W2-17).122 TTE was compared with CT and aortography in a multicenter European cooperative study,125 and it was shown that TEE was superior compared with both modalities for the diagnosis of aortic dissection (sensitivity 99%). Other studies have confirmed the high accuracy of TEE.125–128 A negative TEE examination for the diagnosis of aortic dissection, even in a high-risk population, has high negative predictive value.129 Most centers utilize contrast CT scanning as the first choice for suspected aortic dissection, but TEE is an option in patients who cannot receive contrast, such as those who have advanced renal disease or are too unstable to be transported to the CT scanner (Video W2-6).
Another common indication to perform emergency aortic imaging in the ICU is assessment of patients with blunt or penetrating chest trauma.3 These patients are at high risk of life-threatening aortic injuries such as traumatic dissection and rupture, and prompt diagnosis and treatment are critical. Exclusion of major trauma to the ascending and descending aorta at the bedside is important in this context.105 The value of TEE on admission for trauma patients with enlarged mediastinum and hemodynamic instability, with or without a combination of several other symptoms (e.g., pleural effusion, decreasing hematocrit, thoracic vertebral fracture), has been stressed by many authors.130–133 Patients usually have a contained hematoma around the aortic dissection.131 Transection of the thoracic aorta usually is seen at the level of the ligamentum arteriosum.
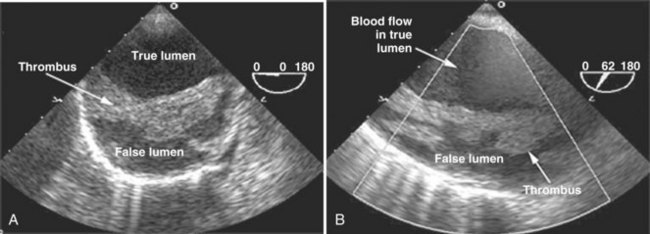
Additional helpful features of TEE in evaluating aortic pathologies are the ability to detect or assess extension of dissection into the proximal coronary arteries; the presence of pericardial or mediastinal hematoma or effusion; the presence, severity, and mechanism of associated aortic valve regurgitation; the point of entry and exit between the true and false lumens; the presence of thrombus in the false lumen; and ventricular function.16 When TEE findings are equivocal or negative in cases of suspected thoracic aortic disease, other imaging modalities such as aortography, CT, or MRI should still be performed.
Assessment for Intracardiac and Intrapulmonary Shunts
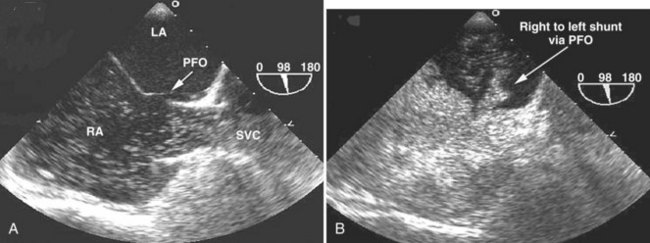
In critically ill patients, clinical suspicion for an intracardiac or intrapulmonary shunt most often is raised in the context of unexplained embolic stroke or refractory hypoxemia. In such cases, the presence of a right-to-left shunt must be excluded. Common origins of right-to-left shunt are atrial septal defect or patent foramen ovale at the cardiac level5 and arteriovenous fistula at the pulmonary level.5 To be able to detect the presence of such a shunt at the bedside, a contrast study often is needed, because the shunt is usually not well visualized with 2D echocardiography alone. Color-flow imaging increases the detection rate of intracardiac shunt to some extent, but usually only when the shunt is large. Accordingly, a contrast study should be performed routinely as part of a TEE or TTE examination when evaluating a patient with unexplained embolic stroke or refractory hypoxemia in the ICU. For this purpose, agitated saline contrast is usually used. Approximately 0.5 mL of air is mixed with 10 mL of normal saline and is vigorously agitated back and forth between two syringes connected to the patient by a three-way stopcock. After an adequate echocardiographic view of the right and left atrial cavities has been obtained, the agitated saline is forcefully injected IV. After injection, the contrast is seen in the vena cava, right atrium, right ventricle, and pulmonary artery. In the absence of a shunt, only a minimal amount of contrast should be seen in the left-sided cavities, because most of the microbubbles from the agitated saline are unable to pass through the pulmonary capillaries. If an intracardiac shunt is present, such as an atrial septal defect or patent foramen ovale, left-sided contrast is observed immediately after right-sided opacification, and the contrast is seen going through the interatrial septum (Figure W2-18). Performance of a Valsalva maneuver by the patient during contrast injection increases the sensitivity of the bubble study to detect right-to-left shunting. In mechanically ventilated patients, a maneuver equivalent to a Valsalva may be performed by inducing sudden release of sustained airway pressure previously achieved by inflating the lungs manually. This maneuver reverses the atrial transseptal gradient and may help uncover a patent foramen ovale that would not have been seen otherwise. Right-to-left shunting also can be caused by the presence of pulmonary arteriovenous fistulas. These often are associated with end-stage liver disease (hepatopulmonary syndrome). With this type of shunt, contrast is seen to appear in the left atrium from the pulmonary veins instead of through the atrial septum; this finding is best detected by TEE, which usually permits visualization of all four pulmonary veins. The characteristic of intrapulmonary versus intracardiac shunt is that there is a longer delay (three to five cardiac cycles) between the appearance of contrast from the right-sided to left-sided cavities in the presence of an intrapulmonary shunt.5 Agitated saline is a simple and easy way to use contrast at the bedside.
Other types of intracardiac shunts also can be encountered in the ICU. After myocardial infarction, patients can develop cardiogenic shock due to acute development of a ventricular septal defect and resultant left-to-right shunt. Physical examination and invasive hemodynamic monitoring (pulmonary artery catheterization) sometimes can miss this diagnosis. Echocardiography reveals a disrupted ventricular septum with a high-velocity left-to-right shunt. This kind of shunt usually is well visualized without use of contrast. The diagnosis can be established by 2D and Doppler TTE in approximately 90% of cases.134 Penetrating cardiac trauma is often associated with intracardiac and extracardiac shunts, and TEE is becoming the obvious tool for perioperative early identification of occult shunts.14 Identification of these shunts is paramount in these critically ill patients, because missing them may lead to cardiac tamponade and rapid death. TEE has been shown to be superior to angiography and TTE to visualize these lesions.135–137
Unexplained Hypoxemia
Patent foramen ovale is present in 25% to 30% of healthy individuals.59,106 Usually it allows only minimal and intermittent right-to-left shunting. When the right atrial pressure is increased and exceeds left atrial pressure, the patent foramen ovale can widen and significantly increase the importance of the right-to-left shunt with resultant significant hypoxemia. In a critically ill patient, this increase in right-sided pressure can occur from pulmonary hypertension secondary to acute respiratory distress syndrome or pulmonary embolism, right ventricular failure (from infarction or pulmonary hypertension), or severe tricuspid regurgitation, which is often seen in the ICU for a variety of reasons. In critically ill patients, TEE is in general more useful than TTE for evaluation of patent foramen ovale, atrial septal defect (see Figure W2-18), and pulmonary arteriovenous fistula138 because of the close proximity of the lesion to the ultrasound transducer.
Patients with patent foramen ovale and persistent refractory hypoxemia despite ventilator and hemodynamic manipulation sometimes may need to have catheter-based septal defect closure devices inserted. TEE is crucial to assist in the performance of this procedure.139
Source of Embolus
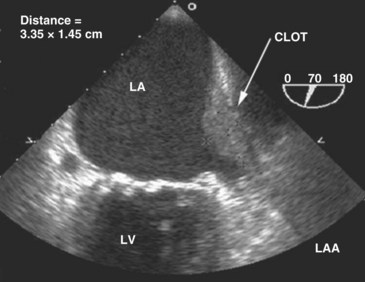
When cardioversion is considered for a critically ill patient with atrial fibrillation or flutter, performance of TEE is helpful in evaluating the left atrium and appendage for the presence of thrombus (Figure W2-19). If no intracardiac clots are documented, cardioversion can be performed with minimal embolic risks.
 Use of Contrast and Harmonic Technology to Enhance Transthoracic Examinations with Poor Image Quality in a Critically Ill Patient
Using standard echocardiographic methods, endocardial delineation is suboptimal in approximately 30% of cases.140 However, two developments in ultrasound have improved the quality of endocardial border definition: harmonic imaging and IV contrast echocardiography.141 Dramatic improvements in image quality have been achieved with the development of harmonic imaging. This technology exploits the formation of ultrasound signals that return to the transducer at a multiple of the transmitted (fundamental) frequency, referred to as the harmonic frequency.1 Signals are received by the ultrasound transducer at twice the transmitted frequency. This “second harmonic imaging” results in images with better contrast between the myocardium and cardiac chambers and improved endocardial definition compared with fundamental imaging.142–144 Nowadays, most ultrasound equipment includes harmonic imaging as a standard feature.
In critically ill patients with poor acoustic windows, endocardial visualization still may be inadequate despite the use of second harmonic imaging.140 In these patients, contrast agents capable of producing left ventricular cavity opacification with an IV injection can be helpful in delineating endocardial borders. Several contrast agents are currently available that contain albumin microspheres filled with perfluorocarbon gas, allowing for the passage of contrast through the lungs with appearance of contrast in the left venticle.1 The chamber is opacified by the contrast agent within 1 minute of administration and allows improved endocardial border detection. The presence of contrast also enhances Doppler signals.145 Studies have examined the impact of these newer modalities of harmonic imaging and contrast in the ICU. Reilly et al.146 assessed the benefits of contrast echocardiography for the evaluation of left ventricular function in 70 unselected ICU patients; 22 patients (31%) were receiving mechanical ventilation. Left ventricular EF could not be obtained at all in 23% of patients with standard imaging, but when harmonic imaging was employed, left ventricular EF was unobtainable in only 13% of patients. When contrast imaging was employed, left ventricular EF was measurable in all the patients. Ejection fraction was confidently determined in 56%, 62%, and 91% of patients with standard imaging, harmonic imaging, and contrast imaging. In this study, contrast imaging was safe and dramatically improved the capacity to evaluate left ventricular EF and regional wall motion reliably compared with fundamental and harmonic imaging. Yong et al.141 extended these observations by comparing the results of harmonic and contrast imaging with an independent standard (i.e., TEE) in 32 consecutive critically ill patients who were considered technically very difficult. Estimation of EF was possible in 31%, 50%, and 97% with fundamental imaging, harmonic imaging, and contrast imaging. Quantification of EF by contrast enhancement correlated best with TEE (r = 0.91).
In critically ill patients with suboptimal TTE image quality, contrast echocardiography combined with harmonic imaging provides a noninvasive and safe alternative to TEE for determination of regional and global left ventricular function (Figure W2-20).140 It is a rapid and simple technique that can be performed at the bedside in the ICU, with positive impact on interpretation of left ventricular function. Before using TEE, this technique should be considered in critically ill patients when TTE is inadequate for evaluation of left ventricular function.140
 Comparison Between Bedside Echocardiography and Pulmonary Artery Catheter in the Intensive Care Unit
Since its introduction into clinical practice in 1970, pulmonary artery catheterization has been the standard hemodynamic monitoring technique for critically ill patients in the ICU.147–149 Pulmonary artery catheterization provides clinicians with indices of cardiovascular function to assist in therapeutic decision making. Pulmonary artery catheterization can be a useful diagnostic tool, aiding in the management of critically ill patients. Nevertheless, poor interpretation of the data it provides can lead to excessive morbidity and mortality.63,147,150,151 Conventional monitoring using a pulmonary artery catheter has been shown to be limited in the evaluation of global ventricular function,19,21 and echocardiographic studies have established that pulmonary artery occlusion pressure often does not allow accurate assessment of left ventricular preload.26,152,153 The frequent changes in ventricular compliance and loading conditions occurring in critically ill patients can affect systolic and diastolic function. In such cases, conventional monitoring does not enable early detection of acute changes in function, and it does not allow the clinician to discern systolic from diastolic changes.19
In critically ill patients, echocardiography, particularly TEE, has the ability to clarify diagnosis and define pathophysiologic process more precisely than pulmonary artery catheterization. In a prospective study of limited scope, Benjamin et al.21 found that TEE-derived data disagreed with the pulmonary artery catheterization evaluation of intracardiac volume in 55% of cases and with the pulmonary artery catheterization assessment of myocardial function in 39% of cases. These authors also showed that the post–pulmonary artery catheterization therapeutic recommendations were different from the post-TEE therapeutic recommendations in 58% of patients. In a retrospective analysis of 108 critically ill patients who underwent a TEE, Poelaert et al.20 found that of 64% of patients with pulmonary artery catheterization, 44% underwent therapy changes after TEE (41% in the cardiac and 54% in the septic subgroup). Also, these investigators found that in 41% of patients without pulmonary artery catheterization, TEE led to a change in therapy. They concluded that TEE produced a change in therapy in at least a third of ICU patients, independent of the presence of pulmonary artery catheterization.20
Another significant advantage of echocardiography in the ICU is the speed with which it can be performed relative to pulmonary artery catheterization. In the study by Benjamin et al.,21 TEE was performed in 12 ± 7 minutes versus 30 minutes or more for pulmonary artery catheterization insertion. In a study by Kaul,154 the average time required to place a pulmonary artery catheter and record the data was 63 ± 45 minutes versus 19 ± 7 minutes to perform bedside TEE. Reported complications of pulmonary artery catheterization include pneumothorax, hemothorax, bacteremia, sepsis, cardiac arrhythmias, pulmonary artery rupture, cardiac perforation, and valvular damage.21 Compared with pulmonary artery catheterization, bedside echocardiography has a better safety profile, as reported previously in this chapter.
A major advantage of pulmonary artery catheterization versus TEE is that the catheter can more easily serve as a continuous monitoring technique to assess the response to a therapeutic intervention.21 This potential advantage may provide little benefit, however, in patients in whom the information is misinterpreted or inadequate. In some ICUs, TEE has completely replaced pulmonary artery catheterization for assessment of circulatory status of mechanically ventilated patients.38
Despite having multiple limitations, pulmonary artery catheterization still has a role in the ICU and remains a useful diagnostic tool when used by physicians who have extensive experience with it.20,155 A combination of invasive pressure monitoring and TEE probably offers the most complete bedside evaluation of morphology and intracardiac hemodynamics and provides a more precise pressure-volume evaluation of left ventricular and right ventricular function and filling.20,22
 Impact of Bedside Echocardiography on Diagnosis and Management in a Critically Ill Patient
Echocardiography often provides unexpected diagnoses in critically ill patients. Compared with TTE and invasive hemodynamic monitoring, TEE frequently provides different or additional information. This information often is important for adequate and optimal adjustment of therapy. Several studies have examined the impact of bedside echocardiography, particularly TEE, on the management of critically ill patients. Published studies have reported changes in management after TEE in 30% to 60% of patients,17,20,156,157 leading to surgical interventions in 7% to 30%.17,98,157,158 Impact varies depending on the type of ICU population being studied. Several studies have reported the clinical impact of urgent TEE in hemodynamically unstable patients.157,159,160 In a prospective study of surgical ICU patients by Bruch et al.,23 echocardiography altered management in 50 (43%) of 115 patients. Alterations in medical management induced by TEE included administration of fluids and initiation or discontinuation of inotropic agents, anticoagulants, or antibiotics. These findings are similar to findings reported in patients in medical or coronary care ICUs.10,158 In a retrospective study done by Colreavy et al.8 of a mixed medical and surgical ICU population, TEE findings led to a significant change in management in 32% of all studies performed. In a prospective study by Heidenreich et al.161 of 61 critically ill patients with unexplained hypotension, new diagnoses not made with TTE were made in 17 patients (28%), leading to surgical intervention in 12 (20%). Prospective randomized trials to study the ultimate impact of bedside echocardiography on mortality and morbidity in the ICU are needed. Such studies would be difficult to do, however, given the growing use and importance of this technology in the critical care setting.
 Other Applications of Bedside Ultrasonography in the Intensive Care Unit
Central Line Placement
Central venous catheterization is performed frequently in critically ill patients. Placement of a central venous catheter is not without risk and can be associated with adverse events that are hazardous to patients and expensive to treat.162–164 Complications can be seen in 15% to 20% of cases.165–167 As described in a review by McGee and Gould,168 complications related to central venous line placement are most often mechanical (arterial puncture, local hematoma, hemothorax, pneumothorax), infectious (catheter colonization and related bloodstream infection), and thrombotic. Complications are influenced by patient factors (obesity, coagulopathy, previous failed catheterization), site of attempted access, and operator experience.169 As previously reported, only approximately 38% to 65% of patients are cannulated on the first attempt using a blind method.170,171
The use of ultrasound guidance during central venous catheterization has been well shown to reduce the risk of complications, mostly so for the internal jugular route. Ultrasound guidance also speeds catheter placement, decreases the number of attempts before successful placement, and improves the overall rate of successful placement. Ultrasound can be used to help localize and define the anatomy of the vein, with subsequent placement of the central venous catheter by the standard use of anatomic landmarks at the site identified by ultrasound, with the knowledge that a vein is present, patent, and of adequate size. Ultrasound also can be used to provide real-time 2D ultrasound guidance to locate the vein and subsequently introduce the needle through the skin and into the vessel. Multiple studies have reported the superiority of ultrasound-assisted cannulation of the internal jugular vein in ICU patients, compared with the external landmark–guided technique.170–172 Trials looking at ultrasound guidance after failure by the landmark method reported success rates ranging from 33% to 100%.169,173–175 A meta-analysis175 of the literature comparing guidance using anatomic landmarks only versus guidance using ultrasound for the placement of central venous catheters indicates that ultrasound guidance significantly decreases placement failure by 64%, decreases related complications by 78%, and decreases the need for multiple placement attempts by 40%. Data showing superiority of the ultrasound guidance technique are consistent and strong for the internal jugular vein approach but less so for subclavian venous catheterization.175–177
Some patients can be identified in whom cannulation may be more difficult or in whom consequences of a complication could be more serious.169 In these patients (Box W2-6), central venous cannulation may be laborious and risky, and ultrasound guidance should be considered. Hatfield and Bodenham169 showed the benefit of portable ultrasound when central venous access was difficult. As suggested by this study and others,178 ultrasound guidance is particularly beneficial when used in difficult cases or when a competent operator fails after a few attempts using surface landmarks.
Box W2-6
Criteria for Difficult Central Venous Access
APTT, activated partial thromboplastin time; INR, international normalized ratio.
Ultrasound guidance is useful for operators with varying levels of experience.169,175 The technique is easy to learn and can be self-taught with some practical assistance from radiologists or other experienced sonographers.169,179,180 Familiarity with the anatomy and equipment is easy to obtain safely at the bedside.
Most large vessels that are catheterized usually can be imaged by ultrasound. Different types of ultrasound modalities can be used to help guide central vessel cannulation, including 2D ultrasound, Doppler transducer, Doppler with the probe in the needle, and fingertip pulse Doppler. With 2D imaging, fluid such as blood in vessels is black because there is nearly complete transmission of ultrasound.169 Color Doppler mode helps delineate the flow patterns in vessels. Doppler-only equipment that provides no images has shown equivocal results in studies of vascular access.176,181
With 2D imaging, arteries are characteristically small, pulsatile, and difficult to compress with the probe.169 Veins are usually larger, are nonpulsatile (except in the presence of severe tricuspid regurgitation), are easily compressible, and distend when the patient is placed with the head down or when a Valsalva maneuver is performed.169
Vessels can be examined in the transverse and longitudinal views. The transverse view permits identification of the vein and arteries based on the sonographic characteristics mentioned earlier and clarifies their positions relative to one another (Figure W2-21). The transverse and longitudinal views enable the sonographer to monitor in real time the passage of the needle through the skin and the anterior vessel wall. Ultrasound guidance also ensures detailed and accurate control of the needle (Figure W2-22).169
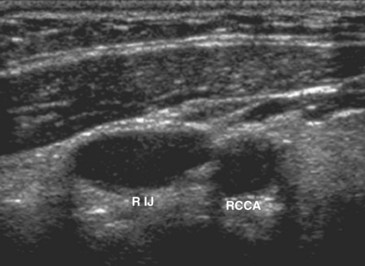
Figure W2-21 Transverse view of normal anatomy of the right internal jugular (RIJ) vein and right common carotid artery (RCCA). Ultrasound examination helps determine the anatomic relationship, size, and patency of the vessels. Knowledge of these important vessel characteristics helps determine if the anatomy is suitable for central vein catheterization at a low risk. If the vessel anatomy is normal and the operator is experienced, subsequent venous catheterization can be done by the surface landmark technique or under real-time ultrasound guidance. If high-risk characteristics are identified (see Box W2-6), however, real-time ultrasound guidance (or selection of a different access site) would be preferred.
(Courtesy Dr. Kurian Puthenpurayil.)
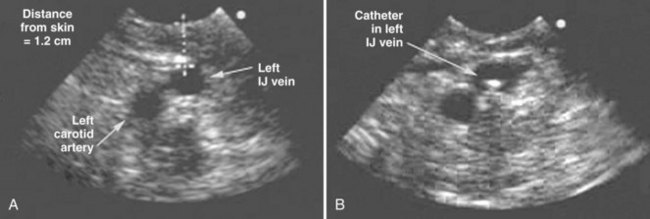
During vessel examination, the sonographer specifically should assess the presence and patency of the vein (Figure W2-23), the distensibility and compressibility of the vein, the position of the vein relative to the surrounding arteries (Figure W2-24), and the presence of a thrombus in the vein (Figure W2-25).169 Ultrasound identification of certain anatomic characteristics such as small vessel size (<5 mm), intraluminal thrombus, and anterior location of the artery relative to the vein helps the physician identify unfavorable vessel anatomy and choose another catheterization site. A study by Levin et al.182 showed that 2D ultrasound guidance for the insertion of radial artery catheters was easy to use and increased the rate of success of insertion at first attempt. It was determined to be a useful adjunct to arterial catheter insertion. More studies are needed in the use of ultrasound for cannulation of peripheral arterial conduits.
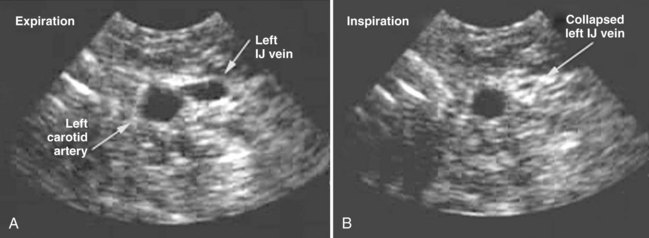
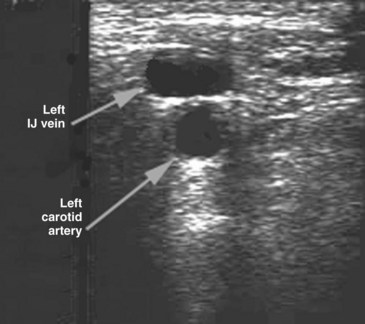
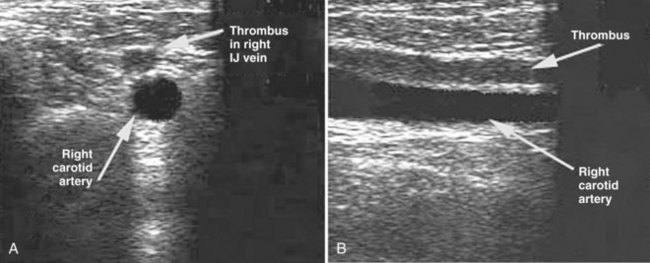
Assessment of Pleural Effusions and Intraabdominal Fluid Collections
In critically ill patients, atelectasis and pleural effusions are frequent and often are present at the same time. Patients in the ICU are most often supine, and chest x-rays performed in this position offer limited sensitivity for the diagnosis of pleural effusion.183 In many instances, neither atelectasis nor infiltration can be differentiated from pleural effusion. An alternative diagnostic method is needed to provide better results. Decubitus chest radiographs may show if fluid is free flowing, but this approach cannot localize or characterize the effusion precisely. CT of the chest shows the amount and distribution of fluid and is superior to plain lateral decubitus films. CT also can differentiate fluid from atelectasis and reveal information about the lung parenchyma. Chest CT requires transport to the radiology suite, however, which can be hazardous in unstable critically ill patients. Ultrasound examination of the pleural space has proved to be valuable for diagnosis of effusion.184–188 The value of ultrasound for localizing fluid before catheter drainage or simple thoracentesis is well recognized. Ultrasound is especially valuable for localizing loculated or small effusions before a drainage procedure. In mechanically ventilated patients, blind thoracentesis can be hazardous, especially if the effusion is small or if the patient is on a high level of positive end-expiratory pressure.189 Lichtenstein et al.189 evaluated the feasibility and safety of ultrasound-aided thoracentesis in 40 mechanically ventilated patients. No complications occurred in the 45 ultrasound-aided thoracenteses, all performed by ICU physicians.
Basic skill required to detect a pleural effusion may be acquired in minutes and improves with experience.190 In most instances, the pleural tap does not have to be done under real-time ultrasound guidance. A critically ill patient first must be positioned adequately on the back or on the side. Scanning of the pleural space is performed with the ultrasound probe. The probe must be oriented upward and downward, laterally and medially, and anteriorly and posteriorly so as to obtain a complete anatomic assessment of the area. The pleural fluid is usually hypoechogenic and appears black. The surrounding solid structures (soft tissue, diaphragm) and organs (lung, liver, heart, spleen) are visualized as structures with different degrees of echogenicity around the effusion (Figure W2-26). The presence of aerated lung causes airy artifacts. Ribs usually yield artifactual anechoic images. When the effusion has been well assessed, one must determine the feasibility of safely doing a thoracentesis. One must check for the absence of interposition of lung, heart, liver, or spleen during the respiratory cycle189 to avoid puncturing these organs, which potentially can cause catastrophic complications. When an optimal and safe position for thoracentesis has been determined, the skin should be marked and disinfected, and the patient should remain in the exact same position as was used during the ultrasound examination. Optimally, the puncture should be done within seconds to minutes of the marking.
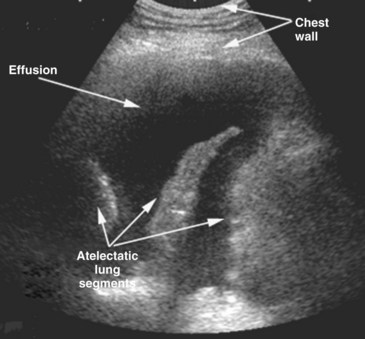
The same diagnostic and therapeutic procedures described earlier can be applied for intraabdominal fluid collections in a critically ill patient. Evaluation for intraabdominal fluid collection or abscess is restricted to areas that are not impeded by gas-filled structures191 and include the regions around the liver and gallbladder, spleen, kidneys and lateral retroperitoneal areas, and pelvis around the uterus and bladder.191 Fluid that does not change shape with probe pressure or patient positioning most likely represents a loculated collection.191 Echogenic material and diffuse echoes on ultrasound within a fluid collection suggest the presence of particulate matter (e.g., fibrin or clots) and may represent an exudate or blood collection. As with pleural effusions, intraabdominal fluid collections can be percutaneously sampled or drained safely at the bedside under real-time ultrasound guidance (Figure W2-27).
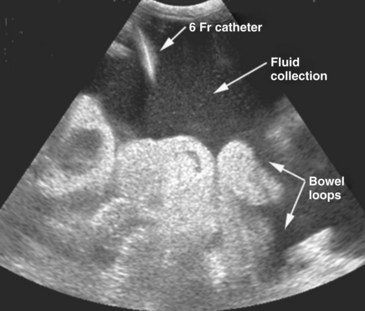
Urinary Bladder Scan
Bladder scanning devices are portable units that can provide a measurement of urine volume in the bladder (Figure W2-28) and avoid bladder overdistention and reduce the need for unnecessary catheterization.191,192 Studies have shown that frequent catheterization is a major risk factor for urinary tract infections that can be costly to medical centers.193–195 Use of a portable bladder scanning device to reduce the incidence of nosocomial urinary tract infections was described by Moore and Edwards.196 Bedside ultrasound assessment of volume in the urinary bladder also can be helpful to evaluate oliguria or anuria to rule out obstruction of the urinary catheter.
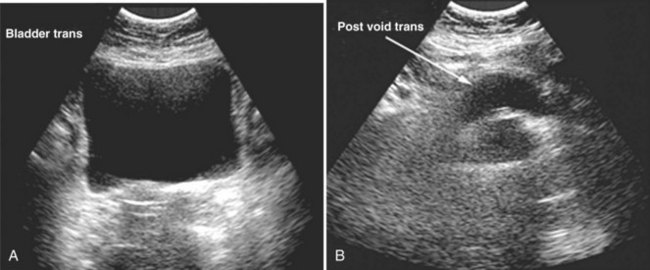
Focused Assessment of the Trauma Patient
Since the early 1990s, bedside ultrasound has been used in the United States as an additional diagnostic modality for use in determining the presence of intraabdominal injury after blunt trauma.197 It is performed in the trauma bay during the secondary survey (as described in Advanced Trauma Life Support) or as part of the primary survey in hemodynamically unstable patients.191,198–202 The focused assessment for sonographic examination of trauma (FAST) should be done with a specific purpose, usually identification of hemoperitoneum, hemothorax, or tamponade.191 FAST seeks to determine the presence of fluid in four areas: (1) the subxiphoid region in the pericardial sac, (2) the right upper quadrant in Morison’s pouch, (3) the left upper quadrant in the splenorenal recess, and (4) the pelvis in the pouch of Douglas or rectovesical space (Figure W2-29).19 Because the FAST examination is noninvasive and quickly performed at the bedside, it is ideal for detecting intraabdominal injury in the resuscitation area. It has now been incorporated into the trauma resuscitation algorithm of most level I trauma centers in the United States.191,203
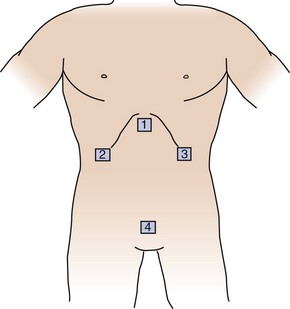
Use of the FAST examination has been shown to diminish the need for more invasive diagnostic measures such as diagnostic peritoneal lavage and subsequent exploratory laparotomy.204,205 The FAST examination has been shown to be most accurate when performed for evaluation of hemodynamically unstable patients.203,206–208 Studies have suggested that its use as a screening tool for blunt abdominal injury in hemodynamically stable trauma patients may result in under diagnosis of intraabdominal injuries.202,203,209
Ventricular Assist Devices
Different complications are likely to occur after ventricular assist device implantation, such as bleeding and hemodynamic instability. Maintenance of ventricular assist device flow is a key indicator of the overall status of the system. In the postoperative period, low ventricular assist device flow is usually due to hypovolemia and right ventricular dysfunction. TEE can be helpful for the diagnosis and monitoring of both of these conditions. Right ventricular failure has been shown to occur in approximately 20% to 25% of patients being supported with an isolated left ventricular assist device.210 With prosthetic circulatory support devices, there can be dramatic changes in ventricular volumes and hemodynamic conditions and substantial direct and indirect changes to the contralateral ventricle due to ventricular interactions. TEE can help the clinician monitor and understand these ventricular interactions.211 It also can help assess adequacy of flow and the patency of the inflow and outflow cannulas to eliminate the presence of a thrombus and collapse or displacement of the cannulas. It also can motivate an urgent return to the operating room if a cardiac tamponade is diagnosed. If hypoxemia supervenes in the ICU, the presence of a patent foramen ovale has to be ruled out. For patients placed on extracorporeal membranous oxygenation support, bedside TEE also can be used to monitor ventricular function during weaning of the circulatory assistance.
Performance of Bedside Ultrasonography by the Intensivist
In acute situations in the ICU, it may be difficult to have a cardiologist or sonographer available on immediate call on a 24-hour basis to perform a bedside ultrasound examination. The value of immediate bedside echocardiography for aiding in diagnosis and management of acute hemodynamic disturbances has been well shown in the literature in the ICU and the emergency department.212,213
Ultrasound technologies are not exclusive to the radiologist or cardiologist. Appropriately trained emergency department physicians, surgeons, anesthesiologists, and ICU specialists have been using ultrasound devices with great success. Anesthesiologists were instrumental in many of the pioneering studies of TEE in the operating room and ICU.4,22,214,215 Successful performance of bedside echocardiography by noncardiologist intensivists also has been well shown in the literature.8,21,216 A study by Benjamin et al.21 showed that a limited TEE examination performed and interpreted by intensivists (after training under the supervision of two cardiologists) is feasible and provides rapid, accurate diagnostic information that can have a dramatic impact on the treatment of critically ill patients.21 The safety and utility of performance of bedside ultrasound by the intensivist for various other purposes in the ICU (central venous cannulation, thoracentesis, paracentesis) also have been well shown.170–172189
With the increasing popularity of ultrasound devices—particularly lightweight, portable, hand-held devices—there is controversy regarding the advisability and use of noncomprehensive “goal-directed” examinations performed by clinicians without cardiology or radiology training.104 Studies with these portable devices that provide basic 2D and Doppler flow imaging showed they can provide important anatomic information216–220 but that even in highly skilled hands, they may provide suboptimal imaging or diagnostic capabilities in the ICU.218 Inappropriate interpretation or application of data gained by a poorly skilled user may result in adverse medical, ethical, and social consequences.104 To avoid misusing the technology, adequate training is essential.
The era of a technology-extended physical examination219 seems to have arrived, and there seems to be a role for a user-specific, focused ultrasound examination.104,221 An examination said to be “targeted,” “focused,” and “limited” may often equate with “incomplete,” “inadequate,” or “inaccurate.” Training must be individualized and tailored to specific needs, and appropriate user-specific application depends directly on the training and expertise of the user.104 Provided that adequate expert backup is available, the training of intensivists in performing focused or more comprehensive bedside ultrasound examinations is not only feasible but also can be done safely and rapidly and yield information pertinent to the management of critically ill patients. General guidelines in training for TTE and TEE have been developed by the American Society of Echocardiography in association with the American Heart Association and the American College of Cardiology.222 Since 1996, the American Society of Anesthesiologists and Society of Cardiovascular Anesthesiologists also have developed practice guidelines for perioperative TEE.223 The importance of adequate training and subsequent maintenance of competence cannot be overemphasized; inappropriate use or misapplication potentially could temper the acceptance and limit the value of performance of bedside ultrasonography by the intensivist.
Training of intensivists and emergency department physicians in performance of emergency bedside ultrasonography should provide rapid answers to clinical questions that may strongly affect medical and surgical management decisions. As has been mentioned by different authors,190,224 training in echocardiography and general ultrasonography should be incorporated into the critical care fellowship, with special emphasis on TEE as part of the training program. It is hoped that critical care and echocardiographic societies will credential such additional training in the near future.
Key Points
Benjamin E, Griffin K, Leibowitz AB, et al. Goal-directed transesophageal echocardiography performed by intensivists to assess left ventricular function: comparison with pulmonary artery catheterization. J Cardiothorac Vasc Anesth. 1998;12:10-15.
Colreavy FB, Donovan K, Lee KY, et al. Transesophageal echocardiography in critically ill patients. Crit Care Med. 2002;30:989-996.
Goldhaber SZ. Echocardiography in the management of pulmonary embolism. Ann Intern Med. 2002;136:691-700.
Lichtenstein D, Hulot JS, Rabiller A, et al. Feasibility and safety of ultrasound-aided thoracentesis in mechanically ventilated patients. Intensive Care Med. 1999;25:955-958.
Yong Y, Wu D, Fernandes V, et al. Diagnostic accuracy and cost-effectiveness of contrast echocardiography on evaluation of cardiac function in technically very difficult patients in the intensive care unit. Am J Cardiol. 2002;89:711-718.
1 Stamos TD, Soble JS. The use of echocardiography in the critical care setting. Crit Care Clin. 2001;17:253-270.
2 Slama MA, Novara A, Van de Putte P, et al. Diagnostic and therapeutic implications of transesophageal echocardiography in medical ICU patients with unexplained shock, hypoxemia, or suspected endocarditis. Intensive Care Med. 1996;22:916-922.
3 Poelaert J, Schmidt C, Colardyn F. Transesophageal echocardiography in the critically ill. Anaesthesia. 1998;53:55-68.
4 Liebson PR. Transesophageal echocardiography in critically ill patients: what is the intensivist’s role? Crit Care Med. 2002;30:1165-1166.
5 Heidenreich PA. Transesophageal echocardiography in the critical care patient. Cardiol Clin. 2000;18:789-805.
6 Braman SS, Dunn SM, Amico CA, et al. Complications during intra-hospital transport in critically ill patients. Ann Intern Med. 1987;107:469-473.
7 Al-Tabbaa A, Gonzalez RM, Lee D. The role of state-of-the-art echocardiography in the assessment of myocardial injury during and following cardiac surgery. Ann Thorac Surg. 2001;72:S2214-S2219.
8 Colreavy FB, Donovan K, Lee KY, et al. Transesophageal echocardiography in critically ill patients. Crit Care Med. 2002;30:989-996.
9 Daniel WG, Erbel R, Kasper W, et al. Safety of transesophageal echocardiography: a multicenter survey of 10,419 examinations. Circulation. 1991;83:817-821.
10 Hwang JJ, Shyu KG, Chen JJ, et al. Usefulness of transesophageal echocardiography in the treatment of critically ill patients. Chest. 1993;104:861-866.
11 Cook CH, Praba AC, Beery PR, et al. Transthoracic echocardiography is not cost-effective in critically ill surgical patients. J Trauma. 2002;52:280-284.
12 Foster E, Schiller NB. Introduction to transesophageal echocardiography (TEE) with a historical perspective. Cardiol Clin. 2000;18:675-679.
13 Townend JN, Hutton P. Transesophageal echocardiography in anaesthesia and intensive care. Br J Anaesth. 1996;77:137-139.
14 Troianos CA, Porembka DT. Assessment of left ventricular function and hemodynamics with transesophageal echocardiography. Crit Care Clin. 1996;12:253-272.
15 Schiller NB, Shah PM, Crawford M, et al. Recommendations for quantification of the left ventricle by two-dimensional echocardiography. J Am Soc Echocardiogr. 1989;2:358-367.
16 Alam M. Transesophageal echocardiography in critical care units: Henry Ford Hospital experience and review of the literature. Prog Cardiovasc Dis. 1996;38:315-328.
17 Vignon P, Mentec H, Terre S, et al. Diagnostic accuracy and therapeutic impact of transthoracic and transesophageal echocardiography in mechanically ventilated patients in the ICU. Chest. 1994;106:1829-1834.
18 Mueller X, Stauffer JC, Jaussi A, et al. Subjective visual echocardiographic estimate of left ventricular ejection fraction as an alternative to conventional echocardiographic methods: comparison with contrast angiography. Cardiol Clin. 1991;14:898-902.
19 Fontes ML, Bellows W, Ngo L, et al. Assessment of ventricular function in critically ill patients: limitations of pulmonary artery catheterization. J Cardiothorac Vasc Anesth. 1999;13:521-527.
20 Poelaert JI, Trouerbach J, De Buyzere M, et al. Evaluation of transesophageal echocardiography as a diagnostic and therapeutic aid in a critical care setting. Chest. 1995;107:774-779.
21 Benjamin E, Griffin K, Leibowitz AB, et al. Goal-directed transesophageal echocardiography performed by intensivists to assess left ventricular function: comparison with pulmonary artery catheterization. J Cardiothorac Vasc Anesth. 1998;12:10-15.
22 Costachescu T, Denault A, Guimond JG, et al. The hemodynamically unstable patient in the intensive care unit: hemodynamic vs. transesophageal echocardiographic monitoring. Crit Care Med. 2002;30:1214-1223.
23 Bruch C, Comber M, Schmermund A, et al. Diagnostic usefulness and impact on management of transesophageal echocardiography in surgical intensive care unit. Am J Cardiol. 2003;91:510-513.
24 McLean AS. Transesophageal echocardiography in the intensive care unit. Anaesth Intensive Care. 1998;26:22-25.
25 Jardin F, Fourme T, Page B, et al. Persistent preload defect in severe sepsis despite fluid loading: a longitudinal echocardiographic study in patients with septic shock. Chest. 1999;116:1354-1359.
26 Jardin F, Valtier B, Beauchet A, et al. Invasive monitoring combined with two-dimensional echocardiographic study in septic shock. Intensive Care Med. 1994;20:550-554.
27 Vieillard-Baron A, Prin S, Chergui A, et al. Hemodynamic instability in sepsis: bedside assessment by Doppler echocardiography. Am J Respir Crit Care Med. 2003;168:1270-1276.
28 Parker M, Shelhamer J, Barach S, et al. Profound but reversible myocardial depression in patients with septic shock. Ann Intern Med. 1984;100:483-490.
29 Parillo J. Pathogenic mechanism of septic shock. N Engl J Med. 1993;328:1471-1477.
30 Parker MM, Suffredini AF, Natanson C, et al. Responses of left ventricular function in survivors and non-survivors of septic shock. J Crit Care. 1989;4:19-25.
31 Vincent JL, Gris P, Coffernils P, et al. Myocardial depression characterizes the fatal course of septic shock. Surgery. 1992;111:660-667.
32 Shoa-Lin L, Tahir T, Kawanishi DT, et al. Comparison of Doppler echocardiographic and hemodynamic indexes of left ventricular diastolic properties in coronary artery disease. Am J Cardiol. 1988;62:882-886.
33 Stoddard MF, Pearson AC, Kern MJ, et al. Left ventricular diastolic function: comparison of pulsed Doppler echocardiographic and hemodynamic indexes in subjects with and without coronary artery disease. J Am Coll Cardiol. 1989;13:327-336.
34 Enger EL, O’Toole MF. Noncardiogenic mechanisms of right heart dysfunction. J Cardiovasc Nurs. 1991;6:54-69.
35 Bunnell E, Parillo JE. Cardiac dysfunction during septic shock. Clin Chest Med. 1996;17:237-248.
36 Jardin F, Gueret P, Dubourg O, et al. Two-dimensional echocardiographic evaluation of right ventricular size and contractility in acute respiratory failure. Crit Care Med. 1985;13:952-956.
37 Jardin F, Dubourg O, Bourdarias JP. Echocardiographic pattern of acute cor pulmonale. Chest. 1997;111:209-217.
38 Vieillard-Baron A, Schmitt JM, Augarde R, et al. Acute cor pulmonale in acute respiratory distress syndrome submitted to protective ventilation: incidence, clinical implications, and prognosis. Crit Care Med. 2001;29:1551-1555.
39 Vieillard-Baron A, Page B, Augarde R, et al. Acute cor pulmonale in massive pulmonary embolism: incidence, echocardiographic pattern, clinical implications and recovery rate. Intensive Care Med. 2001;27:1481-1486.
40 Vieillard-Baron A, Prin S, Chergui K, et al. Echo-Doppler demonstration of acute cor pulmonale at the bedside in the medical intensive care unit. Am J Respir Crit Care Med. 2002;166:1310-1319.
41 Bemis C, Serur J, Borkenhagen D, et al. Influence of right ventricular filling pressure on left ventricular filling pressure and dimensions. Circ Res. 1974;34:493-504.
42 Zuckerman DA, Sterling KM, Oser RF. Safety of pulmonary angiography in the 1990s. J Vasc Interv Radiol. 1996;7:199-205.
43 Kasper W, Meinertz T, Kersting F, et al. Echocardiography in assessing acute pulmonary hypertension due to pulmonary embolism. Am J Cardiol. 1980;45:567-572.
44 Jardin F, Dubourg O, Gueret P, et al. Quantitative two-dimensional echocardiography in massive pulmonary embolism: emphasis on ventricular interdependence and leftward septal displacement. J Am Coll Cardiol. 1987;10:1201-1206.
45 McConnell MV, Solomon SD, Rayan ME, et al. Regional right ventricular dysfunction detected by echocardiography in acute pulmonary embolism. Am J Cardiol. 1996;78:469-473.
46 Vieillard-Baron A, Qanadli SD, Antakly Y, et al. Transesophageal echocardiography for the diagnosis of pulmonary embolism with acute cor pulmonale: a comparison with radiological procedures. Intensive Care Med. 1998;24:429-433.
47 Wittlich N, Erbel R, Eichler A, et al. Detection of central pulmonary artery thromboemboli by transesophageal echocardiography in patients with severe pulmonary embolism. J Am Soc Echocardiogr. 1992;5:515-524.
48 Goldhaber SZ. Echocardiography in the management of pulmonary embolism. Ann Intern Med. 2002;136:691-700.
49 Grifoni S, Olivotto I, Cecchini P, et al. Short-term clinical outcome of patients with acute pulmonary embolism, normal blood pressure, and echocardiographic right ventricular dysfunction. Circulation. 2000;101:2817-2822.
50 Kasper W, Konstantinides S, Geibel A, et al. Management strategies and determinants of outcome in acute major pulmonary embolism: results of a multicenter registry. J Am Coll Cardiol. 1997;30:1165-1171.
51 Hamel E, Parcouret G, Vincentelli D, et al. Thrombolysis or heparin therapy in massive pulmonary embolism with right ventricular dilatation. Chest. 2001;120:120-125.
52 Savino JS, Troianos CA, Aukburg S, et al. Measurement of pulmonary blood flow with transesophageal two-dimensional and Doppler echocardiography. Anesthesiology. 1991;75:445-451.
53 Roewer N, Bednarz F, am Esch JS. Continuous measurement of intracardiac and pulmonary blood flow velocities with transesophageal pulsed Doppler echocardiography: technique and initial clinical experience. J Cardiothorac Anesth. 1987;1:418-428.
54 Estagnasie P, Djedaini K, Mier L, et al. Measurement of cardiac output by transesophageal echocardiography in mechanically ventilated patients: comparison with thermodilution. Intensive Care Med. 1997;23:753-759.
55 Ihlen H, Amlie JP, Dale J, et al. Determination of cardiac output by Doppler echocardiography. Br Heart J. 1984;51:54-60.
56 Katz WE, Gasior TA, Quinlan JJ, et al. Transgastric continuous-wave Doppler to determine cardiac output. Am J Cardiol. 1993;71:853-857.
57 Darmon PL, Hillel Z, Mogtader A, et al. Cardiac output by transesophageal echocardiography using continuous wave Doppler across the aortic valve. Anesthesiology. 1994;80:796-805.
58 Feinberg MS, Hopkins WE, Davila-Roman VG, et al. Multiplane transesophageal echocardiography Doppler imaging accurately determines cardiac output measurements in critically ill patients. Chest. 1995;107:769-773.
59 Oh JK. Hemodynamic assessment. In Oh JK, Seward JB, Tajik AJ, editors: The echo manual, 2nd ed, Philadelphia: Lippincott-Raven, 1999.
60 Descorps-Declere A, Smail N, Vigue B, et al. Transgastric, pulsed Doppler echocardiographic determination of cardiac output. Intensive Care Med. 1996;22:34-38.
61 McLean AS, Needham A, Stewart D, et al. Estimation of cardiac output by non-invasive echocardiographic techniques in the critically ill subject. Anaesth Intensive Care. 1997;25:250-254.
62 Chaney JC, Derdak S. Minimally invasive hemodynamic monitoring for the intensivist: current and emerging technology. Crit Care Med. 2002;30:2338-2345.
63 Marik PE. Pulmonary artery catheterization and esophageal Doppler monitoring in the ICU. Chest. 1999;116:1085-1091.
64 Cariou A, Monchi M, Joly LM, et al. Noninvasive cardiac output monitoring by aortic blood flow determination: evaluation of the Sometec Dynemo-3000 system. Crit Care Med. 1998;26:2066-2072.
65 Valtier B, Cholley BP, Belot JP, et al. Noninvasive monitoring of cardiac output in critically ill patients using transesophageal Doppler. Am J Respir Crit Care Med. 1998;158:77-83.
66 Sinclair S, James S, Singer M. Intraoperative intravascular volume optimization and length of hospital stay after repair of proximal femoral fracture: randomized controlled trial. BMJ. 1997;315:909-912.
67 Cheung AT, Savino JS, Weiss SJ, et al. Echocardiographic and hemodynamic indexes of left ventricular preload in patients with normal and abnormal ventricular function. Anesthesiology. 1994;81:376-387.
68 Douglas PS, Edmonds HL, Sutton MS, et al. Unreliability of hemodynamic indexes of left ventricular size during cardiac surgery. Ann Thorac Surg. 1987;44:31-34.
69 Hansen RM, Viquerat CE, Matthay MA, et al. Poor correlation between pulmonary arterial wedge pressure and left ventricular end-diastolic volume after coronary artery bypass graft surgery. Anesthesiology. 1986;64:764-770.
70 Clements FM, Harpole DH, Quill T, et al. Estimation of left ventricular volume and ejection fraction by two-dimensional transesophageal echocardiography: comparison of short axis imaging and simultaneous radionuclide angiography. Br J Anaesth. 1990;64:331-336.
71 Gunn SR, Pinsky MR. Implications of arterial pressure variation in patients in the intensive care unit. Curr Opin Crit Care. 2001;7:212-217.
72 Tousignant CP, Walsh F, Mazer CD. The use of transesophageal echocardiography for preload assessment in critically ill patients. Anesth Analg. 2000;90:351-355.
73 Swenson JD, Harkin C, Pace NL, et al. Transesophageal echocardiography: an objective tool in defining maximum ventricular response to intravenous fluid therapy. Anesth Analg. 1996;83:1149-1153.
74 Kircher BJ, Himelman RB, Schiller NB. Non-invasive estimation of right atrial pressure from the inspiratory collapse of inferior vena cava. Am J Cardiol. 1990;66:493-496.
75 Jue J, Chung W, Schiller NB. Does inferior vena cava size predict right atrial pressure in patients receiving mechanical ventilation? J Am Soc Echocardiogr. 1992;5:613-619.
76 Nagueh SF, Kopelen HA, Zoghbi WA. Relation of mean right atrial pressure to echocardiographic and Doppler parameters of right atrial and right ventricular function. Circulation. 1996;93:1160-1169.
77 Nishimura RA, Abel MD, Hatle LK, et al. Relation of pulmonary vein to mitral flow velocities by transesophageal Doppler echocardiography: effect of different loading conditions. Circulation. 1990;82:1488-1497.
78 Kuecherer HF, Muhiudeen IA, Kusumoto FM, et al. Estimation of mean left atrial pressure from transesophageal pulsed Doppler echocardiography of pulmonary venous flow. Circulation. 1990;82:1127-1139.
79 Nguyen TT, Dhond MR, Sabapathy R, et al. Contrast microbubbles improve diagnostic yield in ICU patients with poor echocardiographic windows. Chest. 2001;120:1287-1292.
80 Mintz GS, Kotler MN, Segal BL, et al. Systolic anterior motion of the mitral valve in the absence of asymmetric septal hypertrophy. Circulation. 1978;57:256-263.
81 Haley JH, Sinak LJ, Tajik AJ, et al. Dynamic left ventricular outflow tract obstruction in acute coronary syndromes: an important cause of new systolic murmur and cardiogenic shock. Mayo Clin Proc. 1999;74:901-906.
82 Madu EC, Brown R, Geraci SA. Dynamic left ventricular outflow tract obstruction in critically ill patients: role of transesophageal echocardiography in therapeutic decision making. Cardiology. 1997;88:292-295.
83 Joffe II, Jacobs LE, Lampert C, et al. Role of echocardiography in perioperative management of patients undergoing open heart surgery. Am Heart J. 1996;131:162-176.
84 Blazer D, Kotler MN, Parry WR, et al. Noninvasive evaluation of mid-left ventricular obstruction by two-dimensional and Doppler echocardiography and color flow Doppler echocardiography. Am Heart J. 1987;114:1162-1168.
85 Chenzbraun A, Pinto FJ, Schnittger I. Transesophageal echocardiography in the intensive care unit: impact on diagnosis and decision making. Clin Cardiol. 1994;17:438-444.
86 Stevenson JG. Comparison of several noninvasive methods for estimation of pulmonary artery pressure. J Am Soc Echocardiogr. 1989;2:157-171.
87 Balik M, Pachl J, Hendl J. Effect of the degree of tricuspid regurgitation on cardiac output measurements by thermodilution. Intensive Care Med. 2002;28:1117-1121.
88 Yock PG, Popp RL. Noninvasive estimation of right ventricular systolic pressure by Doppler ultrasound in patients with tricuspid regurgitation. Circulation. 1984;70:657-662.
89 Currie PJ, Seward BJ, Chan KL, et al. Continuous wave Doppler determination of right ventricular pressure: a simultaneous Doppler-catheterization study in 127 patients. J Am Coll Cardiol. 1985;6:750-756.
90 Hatle L, Angelsen BA, Tromsdal A. Noninvasive estimation of pulmonary artery systolic pressure with Doppler ultrasound. Br Heart J. 1981;45:157-165.
91 Berger M, Haimowitz A, Van Tosh A, et al. Quantitative assessment of pulmonary hypertension in patients with tricuspid regurgitation using continuous wave Doppler ultrasound. J Am Coll Cardiol. 1985;6:359-365.
92 Lee RT, Lord CP, Plappert T, et al. Prospective Doppler echocardiographic evaluation of pulmonary artery diastolic pressure in the medical intensive care unit. Am J Cardiol. 1989;64:1366-1370.
93 Borgeson DD, Seward JB, Miller FAJr, et al. Frequency of Doppler measurable pulmonary artery pressures. J Am Soc Echocardiogr. 1996;9:832-837.
94 Johnson JE, Carpenter JL. Medical house staff performance in physical examination. Arch Intern Med. 1986;146:937-941.
95 Mangione S, Nieman LZ. Cardiac auscultatory skills of internal medicine and family practice trainees: a comparison of diagnostic proficiency. JAMA. 1997;278:717-722.
96 Bossone E, DiGiovine B, Watts S, et al. Range and prevalence of cardiac abnormalities in patients hospitalized in a medical ICU. Chest. 2002;122:1121-1123.
97 Font VE, Obarski TP, Klein AL, et al. Transesophageal echocardiography in the critical care unit. Cleve Clin J Med. 1991;58:315-322.
98 Oh JK, Seward JB, Khandheria BK, et al. Transesophageal echocardiography in critically ill patients. Am J Cardiol. 1990;66:1492-1495.
99 Smith M, Cassidy M, Gurley J, et al. Echo Doppler evaluation of patients with acute mitral regurgitation: superiority of transesophageal echocardiography with color flow imaging. Am Heart J. 1995;129:967-974.
100 Nellesen U, Schnittger I, Appleton CP, et al. Transesophageal two-dimensional echocardiography and color Doppler flow velocity mapping in the evaluation of cardiac valve prostheses. Circulation. 1988;78:848-855.
101 Currie PJ, Calafiore P, Stewart WJ, et al. Transesophageal echo in mitral prosthetic dysfunction: echo-surgical correlation [abstract]. J Am Coll Cardiol. 1989;13(Suppl.):69a.
102 Khandheria B, Seward J, Oh J, et al. Mitral prosthesis malfunction: utility of transesophageal echocardiography [abstract]. J Am Coll Cardiol. 1989;13(Suppl.):69a.
103 Taams MA, Gussenhover EJ, Cahalan MK, et al. Transesophageal Doppler color flow imaging in the detection of native and Bjork-Shiley mitral valve regurgitation. J Am Coll Cardiol. 1989;13:95-99.
104 Seward JB, Douglas PS, Erbel R, et al. Hand-carried cardiac ultrasound (HCU) device: recommendations regarding new technology. A report from the Echocardiography Task Force on New Technology of the Nomenclature and Standards Committee of the American Society of Echocardiography. J Am Soc Echocardiogr. 2002;15:369-373.
105 Brooks SW, Young JC, Cmolik B, et al. The use of transesophageal echocardiography in the evaluation of chest trauma. J Trauma. 1992;32:761-766.
106 Braunwald E, Zipes DP, Libby P, editors. Heart disease: a textbook of cardiovascular medicine, 6th ed, Philadelphia: Saunders, 2001.
107 Callahan JA, Seward JB, Tajik AJ. Cardiac tamponade: pericardiocentesis directed by two-dimensional echocardiography. Mayo Clin Proc. 1985;60:344-347.
108 Callahan JA, Seward JB. Pericardiocentesis guided by two-dimensional echocardiography. Echocardiography. 1997;14:497-504.
109 Feigenbaum H. Pericardial disease. In: Feigenbaum H, editor. Echocardiography. Philadelphia: Lea & Febiger, 1994.
110 Russo AM, O’Connor WH, Waxman HL. Atypical presentations and echocardiographic findings in patients with cardiac tamponade occurring early and late after cardiac surgery. Chest. 1993;104:71-78.
111 Appleton CP, Hatle LK, Popp RL. Cardiac tamponade and pericardial effusion: respiratory variation in transvalvular flow velocities studied by Doppler echocardiography. J Am Coll Cardiol. 1988;11:1020-1030.
112 Kaplan LM, Epstein SK, Schwartz SL, et al. Clinical, echocardiographic, and hemodynamic evidence of cardiac tamponade caused by large pleural effusions. Am J Respir Crit Care Med. 1995;152(2 Pt 1):904-908.
113 Reichert CLA, Visser CA, Koolen JJ, et al. Transesophageal echocardiography in hypotensive patients after cardiac operations: comparison with hemodynamic parameters. J Thorac Cardiovasc Surg. 1992;104:321-326.
114 Wake PJ, Ali M, Carroll J, et al. Clinical and echocardiographic diagnoses disagree in patients with unexplained hemodynamic instability after cardiac surgery. Can J Anaesth. 2001;48:778-783.
115 Poeze M, Ramsay G, Greve JW, et al. Prediction of postoperative cardiac surgical morbidity and organ failure within 4 hours of intensive care unit admission using esophageal Doppler ultrasonography. Crit Care Med. 1999;27:1288-1294.
116 Schmidlin D, Schuepbach R, Bernard E, et al. Indications and impact of postoperative transesophageal echocardiography in cardiac surgical patients. Crit Care Med. 2001;29:2143-2148.
117 Fowler VGJr, Li J, Corey GR, et al. Role of echocardiography in evaluation of patients with Staphylococcus aureus bacteremia: experience in 103 patients. J Am Coll Cardiol. 1997;30:1072-1078.
118 Bonow RO, Carabello B, DoLeon AC, et al. ACC/AHA task force report: ACC/AHA guidelines for the management of patients with valvular heart disease. J Am Coll Cardiol. 1998;32:1486-1588.
119 Shively BK, Gurule FT, Roldan CA, et al. Diagnostic value of transesophageal compared with transthoracic echocardiography in infective endocarditis. J Am Coll Cardiol. 1991;18:391-397.
120 Karalis DG, Bansal RC, Hauck AJ. Transesophageal echocardiographic recognition of subaortic complications in aortic valve endocarditis: clinical and surgical implications. Circulation. 1992;86:353-362.
121 Erbel R, Rohmann S, Drexler M, et al. Improved diagnostic value of echocardiography in patients with infective endocarditis by transesophageal approach: a prospective study. Eur Heart J. 1988;9:43-53.
122 Keren A, Kim CB, Hu BS, et al. Accuracy of biplane and multiplane transesophageal echocardiography in diagnosis of typical acute aortic dissection and intramural hematoma. J Am Coll Cardiol. 1996;28:627-636.
123 Minard G, Shurr M, Croce M, et al. A prospective analysis of transesophageal echocardiography in the diagnosis of traumatic disruption of the aorta. J Trauma. 1996;40:225-230.
124 Nienaber CA, von Kodolitsch Y, Nicolas V, et al. The diagnosis of thoracic aortic dissection by noninvasive imaging procedures. N Engl J Med. 1993;328:1-9.
125 Erbel R, Engberding R, Daniel W, et al. European Cooperative Study Group for Echocardiography. Echocardiography in diagnosis of aortic dissection. Lancet. 1989;1:457-461.
126 Erbel R, Mohr-Kahaly S, Rennolet H, et al. Diagnosis of aortic dissection: the value of transesophageal echocardiography. Thorac Cardiovasc Surg. 1987;35:126-133.
127 Ballal RS, Nanda NC, Gatewood R, et al. Usefulness of transesophageal echocardiography in assessment of aortic dissection. Circulation. 1991;84:1903-1914.
128 Sommer T, Fehske W, Holzknecht N, et al. Aortic dissection: a comparative study of diagnosis with spiral CT, multiplanar transesophageal echocardiography, and MR imaging. Radiology. 1996;199:347-352.
129 Barbant SD, Eisenberg MJ, Schiller NB. The diagnostic value of imaging techniques for aortic dissection. Am Heart J. 1992;124:541-543.
130 Weiss R, Brier J, O’Connor W, et al. The usefulness of transesophageal echocardiography in diagnosing cardiac contusions. Chest. 1996;109:73-77.
131 Erbel R, Oelert H, Meyer J, et al. European Cooperative Study Group on Echocardiography. Effect of medical and surgical therapy on aortic dissection evaluated by transesophageal echocardiography: implications for prognosis and therapy. The European Cooperative Study Group on Echocardiography. Circulation. 1993;87:1604-1615.
132 Poelaert J, Defreyne L, Vermassen F, et al. Post-traumatic transverse dissection of the caudal thoracic aorta diagnosed by transesophageal echocardiography. Eur J Emerg Med. 1995;2:105-107.
133 Gammie J, Katz W, Swanson E, et al. Acute aortic dissection after blunt chest trauma. J Trauma. 1996;40:126-127.
134 Kishon Y, Iqbal A, Oh JK, et al. Evolution of echocardiographic modalities in detection of post myocardial infarction ventricular septal defect and papillary muscle rupture: study of 62 patients. Am Heart J. 1993;126:667-675.
135 Porembka DT, Johnson DJII, Hoit BD, et al. Penetrating cardiac trauma: a perioperative role for transesophageal echocardiography. Anesth Analg. 1993;77:1275-1277.
136 Skoularigis J, Essop MR, Sareli P. Usefulness of transesophageal echocardiography in the early diagnosis of penetrating stab wounds to the heart. Am J Cardiol. 1994;73:407-409.
137 Porembka DT, Hoit B, Davis K, et al. Transesophageal echocardiography and penetrating cardiothoracic trauma [abstract]. Anesthesiology. 1995;83:A257.
138 Aller R, Moya JL, Moreira V, et al. Diagnosis of hepatopulmonary syndrome with contrast transesophageal echocardiography: advantages over contrast transthoracic echocardiography. Dig Dis Sci. 1999;44:1243-1248.
139 Nguyen DQ, Das GS, Grubbs BC, et al. Transcatheter closure of patent foramen ovale for hypoxemia during left ventricular assist device support. J Heart Lung Transplant. 1999;18:1021-1023.
140 Lang RM, Mor-Avi V, Zoghbi WA, et al. The role of contrast enhancement in echocardiographic assessment of left ventricular function. Am J Cardiol. 2002;90(Suppl. 10A):28J-34J.
141 Yong Y, Wu D, Fernandes V, et al. Diagnostic accuracy and cost-effectiveness of contrast echocardiography on evaluation of cardiac function in technically very difficult patients in the intensive care unit. Am J Cardiol. 2002;89:711-718.
142 Senior R, Soman P, Khattar RS, et al. Improved endocardial visualization with second harmonic imaging compared with fundamental two-dimensional echocardiographic imaging. Am Heart J. 1999;138:163-168.
143 Becher H, Tiemann K, Schlosser T, et al. Improvement in endocardial border delineation using tissue harmonic imaging. Echocardiography. 1998;15:511-518.
144 Nixdorff U, Matschke C, Winklmaier M, et al. Native tissue second harmonic imaging improves endocardial and epicardial border definition in dobutamine stress echocardiography. Eur J Echocardiogr. 2001;2:52-61.
145 Kaul S. Clinical applications of myocardial contrast echocardiography. Am J Cardiol. 1992;69:46H-55H.
146 Reilly JP, Tunick PA, Timmermans RJ, et al. Contrast echocardiography clarifies uninterpretable wall motion in intensive care unit patients. J Am Coll Cardiol. 2000;35:491-492.
147 Iberti TJ, Fischer EP, Leibowitz AB, et al. A multicenter study of physicians’ knowledge of the pulmonary artery catheter. Pulmonary Artery Catheter Study Group. JAMA. 1990;264:2928-2932.
148 Swan HJ, Ganz W. Complications with flow-directed balloon-tipped catheters. Ann Intern Med. 1979;91:49-96.
149 Gore JM, Goldberg RJ, Spodick DH, et al. A community-wide assessment of the use of pulmonary artery catheters in patients with acute myocardial infarction. Chest. 1987;92:721-727.
150 Connors AF, Speroff T, Dawson NV, et al. The effectiveness of right heart catheterization in the initial care of critically ill patients. JAMA. 1996;276:889-897.
151 Trottier SJ, Taylor RW. Physicians’ attitudes toward and knowledge of the pulmonary artery catheter: Society of Critical Care Medicine membership survey. New Horiz. 1997;5:201-206.
152 Thys D, Hillel Z, Goldman M, et al. A comparison of hemodynamic indices derived by invasive monitoring and two-dimensional echocardiography. Anesthesiology. 1987;67:630-634.
153 Hansen R, Viquerat C, Matthay M, et al. Poor correlation between pulmonary arterial wedge pressure and left ventricular end-diastolic volume after coronary artery bypass graft surgery. Anesthesiology. 1986;64:764-770.
154 Kaul S. Value of two-dimensional echocardiography for determining the bases of hemodynamic compromise in critically ill patients: a prospective study. J Am Soc Echocardiogr. 1994;7:598-606.
155 Eisenberg PR, Schuster DP. Clinical evaluation compared with invasive hemodynamic assessment. In: Snyder JV, Pinsky MR, editors. Oxygen transport in the critically ill. Chicago: Year Book Medical Publishers; 1987:199-204.
156 Foster E, Schiller NB. Transesophageal echocardiography in the critical care patient. Cardiol Clin. 1993;11:489-503.
157 Khoury AF, Afridi I, Quinones MA, et al. Transesophageal echocardiography in critically ill patients: feasibility, safety, and impact on management. Am Heart J. 1994;127:1363-1371.
158 Pearson AC, Castello R, Labovitz AJ. Safety and utility of transesophageal echocardiography in the critically ill patient. Am Heart J. 1990;119:1083-1089.
159 Cicek S, Demirkilic U, Kuralay E, et al. Transesophageal echocardiography in cardiac surgical emergencies. J Card Surg. 1995;10:236-244.
160 Sohn D-W, Shin G-J, Oh JK, et al. Role of transesophageal echocardiography in hemodynamically unstable patients. Mayo Clin Proc. 1995;70:925-931.
161 Heidenreich PA, Stainback RF, Redberg RF, et al. Transesophageal echocardiography predicts mortality in critically ill patients with unexplained hypotension. J Am Coll Cardiol. 1995;26:152-158.
162 Pittet D, Tarara D, Wenzel RP. Nosocomial bloodstream infection in critically ill patients: excess length of stay, extra costs, and attributable mortality. JAMA. 1994;271:1598-1601.
163 Arnow PM, Quimosing EM, Beach M. Consequences of intravascular catheter sepsis. Clin Infect Dis. 1993;16:778-784.
164 Richards MJ, Edwards JR, Culver DH, et al. Nosocomial infections in medical intensive care units in the United States. Crit Care Med. 1999;27:887-892.
165 Merrer J, De Jonghe B, Golliot F, et al. Complications of femoral and subclavian venous catheterization in critically ill patients: a randomized controlled trial. JAMA. 2001;286:700-707.
166 Sznajder JI, Zveibil FR, Bitterman H, et al. Central vein catheterization: failure and complication rates by three percutaneous approaches. Arch Intern Med. 1986;146:259-261.
167 Veenstra DL, Saint S, Saha S, et al. Efficacy of antiseptic-impregnated central venous catheters in preventing catheter-related bloodstream infection: a meta-analysis. JAMA. 1999;281:261-267.
168 McGee DC, Gould MK. Preventing complications of central venous catheterization. N Engl J Med. 2003;348:1123-1133.
169 Hatfield A, Bodenham A. Portable ultrasound for difficult central venous access. Br J Anaesth. 1999;82:822-826.
170 Denys BG, Uretsky BF, Reddy PS. Ultrasound-assisted cannulation of the internal jugular vein: a prospective comparison to the external landmark-guided technique. Circulation. 1993;5:1557-1562.
171 Troianos CA, Jobes DR, Ellison N. Ultrasound-guided cannulation of the internal jugular vein: a prospective, randomized study. Anesth Analg. 1991;72:823-826.
172 Mallory DL, Shawker T, Evans G, et al. Effects of clinical maneuvers on sonographically determined internal jugular vein size during venous cannulation. Crit Care Med. 1990;11:1269-1273.
173 Mey U, Glasmacher A, Hahn C, et al. Evaluation of an ultrasound-guided technique for central venous access via the internal jugular vein in 493 patients. Support Care Cancer. 2003;11:148-155.
174 Slama M, Novara A, Safavian A, et al. Improvement of internal jugular vein cannulation using and ultrasound-guided technique. Intensive Care Med. 1997;23:916-919.
175 Randolph AG, Cook DJ, Gonzales CA, et al. Ultrasound guidance for placement of central venous catheters: a meta-analysis of the literature. Crit Care Med. 1996;24:2053-2058.
176 Lefrant JY, Cuvillon P, Benezet JF, et al. Pulsed Doppler ultrasonography guidance for catheterization of the subclavian vein: a randomized study. Anesthesiology. 1998;88:1195-1201.
177 Bold RJ, Winchester DJ, Madary AR, et al. Prospective, randomized trial of Doppler-assisted subclavian vein catheterization. Arch Surg. 1998;133:1089-1093.
178 Gallieni M, Cozzolino M. Uncomplicated central vein catheterization of high-risk patients with real time ultrasound guidance. Int J Artif Organs. 1995;18:117-121.
179 Gualtieri E, Deppe SA, Sipperly ME, et al. Subclavian venous catheterization: greater success rate for less experienced operators using ultrasound guidance. Crit Care Med. 1995;23:692-697.
180 Branger B, Zabadani B, Vecina F, et al. Continuous guidance for venous punctures using a new pulsed Doppler probe: efficiency, safety. Nephrologie. 1994;15:137-140.
181 Vucevic M, Tehan B, Gamlin F, et al. The SMART needle: a new Doppler ultrasound-guided vascular access needle. Anaesthesia. 1994;49:889-891.
182 Levin PD, Sheinin O, Gozal Y. Use of ultrasound guidance in the insertion of radial artery catheters. Crit Care Med. 2003;31:481-484.
183 Keske U. Ultrasound-aided thoracentesis in intensive care patients. Intensive Care Med. 1999;25:896-897.
184 Emamian SA, Kaasbol MA, Olsen JF, et al. Accuracy of the diagnosis of pleural effusion on supine chest x-ray. Eur Radiol. 1977;7:57-60.
185 Wunderink RG, Woldenberg LS, Zeiss J, et al. The radiologic diagnosis of autopsy-proven ventilator-associated pneumonia. Chest. 1992;101:458-463.
186 Eibenberger KL, Dock WI, Amman ME, et al. Quantification of pleural effusions: sonography versus radiography. Radiology. 1994;191:681-684.
187 Freimanis AS. Ultrasound and thoracentesis. JAMA. 1977;238:1631.
188 Gryminsky J, Krakowka P, Lypacewicz G. The diagnosis of pleural effusion by ultrasonic and radiologic techniques. Chest. 1976;70:33-37.
189 Lichtenstein D, Hulot JS, Rabiller A, et al. Feasibility and safety of ultrasound-aided thoracentesis in mechanically ventilated patients. Intensive Care Med. 1999;25:955-958.
190 Doelken P, Strange C. Chest ultrasound for “dummies” [Editorial]. Chest. 2003;123:332-333.
191 Lee SY, Frankel HL. Ultrasound and other imaging technologies in the intensive care unit. Surg Clin North Am. 2000;80:975-1003.
192 Anton HA, Chambers K, Clifton J, et al. Clinical utility of a portable ultrasound device in intermittent catheterization. Arch Phys Med Rehab. 1998;79:172-175.
193 Krieger JN. The cost of hospital acquired UTIs in surgical patients. Infect Urol. 1988;1:68-73.
194 Patton JP, Nash DB, Abrutyn E. Urinary tract infection: economic considerations [abstract]. Med Clin North Am. 1991;75:495.
195 Warren JW. The catheter and urinary tract infection [abstract]. Med Clin North Am. 1991;75:481.
196 Moore DA, Edwards K. Using a portable bladder scan to reduce the incidence of nosocomial urinary tract infections. Med Surg Nurs. 1997;6:39.
197 Tso P, Rodriguez A, Cooper C, et al. Sonography in blunt abdominal trauma: a preliminary progress report. J Trauma. 1992;33:39-43.
198 Porter RS, Nester BA, Dalsey WC, et al. Use of ultrasound to determine need for laparotomy in trauma patients. Ann Emerg Med. 1997;29:323.
199 Regel G, Lobenhoffer P, Grotz M, et al. Treatment results of patients with multiple trauma: an analysis of 3406 cases treated between 1972 and 1991 at a German level I trauma center. J Trauma. 1995;38:70.
200 Rozycki GS, Oschsner G, Schmidt JA, et al. A prospective study of surgeon-performed ultrasound as the primary adjuvant modality for injured patient assessment. J Trauma. 1995;39:492.
201 Rozycki GS, Feliciano DV, Davis TP. Ultrasound as used in thoracoabdominal trauma. Surg Clin North Am. 1998;78:295.
202 Yoshii H, Sato M, Yamamoto S, et al. Usefulness and limitations of ultrasonography in the initial evaluation of blunt abdominal trauma. J Trauma. 1998;45:45-51.
203 Miller MT, Pasquale MD, Bromberg WJ, et al. Not so fast. J Trauma. 2003;54:52-60.
204 Liu M, Lee CH, P’eng FK. Prospective comparison of diagnostic peritoneal lavage, computed tomographic scanning, and ultrasonography for the diagnosis of blunt abdominal injury. J Trauma. 1993;35:267-270.
205 Rozycki GS. Surgeon performed ultrasound: its use in clinical practice. Ann Surg. 1998;228:16-28.
206 Glaser K, Tschmelitsch J, Klinger P, et al. Ultrasonography in the management of blunt abdominal and thoracic trauma. Arch Surg. 1998;129:743.
207 Hoffmann R, Nerlich M, Muggia-Sullam M, et al. Blunt abdominal trauma in cases of multiple trauma evaluated by ultrasonography: a prospective analysis of 291 patients. J Trauma. 1992;32:452.
208 Huang MS, Liu M, Wu JK, et al. Ultrasonography for the evaluation of hemoperitoneum during resuscitation: a simple scoring system. J Trauma. 1994;36:173.
209 Chiu WC, Cushing BM, Rodriguez A, et al. Abdominal injuries without hemoperitoneum: a potential limitation of focused abdominal sonography for trauma (FAST). J Trauma. 1997;42:617-625.
210 Stevenson LW, Kormos RL. Consensus conference report: mechanical cardiac support 2000: current applications and future trial design. J Am Coll Cardiol. 2001;27:340-370.
211 Farrar DJ. Ventricular interactions during mechanical circulatory support. Semin Thorac Cardiovasc Surg. 1994;6:163-168.
212 Mandavia DP, Aragona J, Chan L, et al. Ultrasound training for emergency physicians: a prospective study. Acad Emerg Med. 2000;7:1008-1014.
213 Counselman FL, Sanders A, Slovis CM, et al. The status of bedside ultrasonography training in emergency medicine residency programs. Acad Emerg Med. 2003;10:37-42.
214 Mathew JP, Fontes ML, Garwood S, et al. Transesophageal echocardiography interpretation: a comparative analysis between cardiac anesthesiologists and primary echocardiographers. Anesth Analg. 2002;94:302-309.
215 Denault AY, Couture P, McKenty S, et al. Perioperative use of transesophageal echocardiography by anesthesiologists: impact in noncardiac surgery and in the intensive care unit. Can J Anesth. 2002;49:287-293.
216 Duval WL, Croft LB, Goldman ME. Can hand-carried ultrasound devices be extended for use by the non-cardiology medical community? Echocardiography. 2003;20:471-476.
217 Spencer KT, Anderson AS, Bhargava A, et al. Physician-performed point-of-care echocardiography using a laptop platform compared with physical examination in the cardiovascular patient. J Am Coll Cardiol. 2001;37:2013-2018.
218 Goodkin GM, Spevack DM, Tunick PA, et al. How useful is hand-held carried bedside echocardiography in critically ill patients? J Am Coll Cardiol. 2001;37:2019-2022.
219 DeCara JM, Lang RM, Spencer KT. The hand-carried echocardiographic device as an aid to the physical examination. Echocardiography. 2003;20:477-485.
220 Spevack DM, Tunick PA, Kronzon I. Hand-carried echocardiography in the critical care setting. Echocardiography. 2003;20:455-461.
221 Haar GT. Commentary: safety of diagnostic ultrasound. Br J Radiol. 1996;69:1083-1085.
222 Quinones MA, Douglas PS, Foster E, et al. ACC/AHA clinical competence statement on echocardiography: a report of the American College of Cardiology/American Heart Association/American College of Physicians–American Society of Internal Medicine Task Force on Clinical Competence (Committee on Echocardiography). J Am Coll Cardiol. 2003;41:687-708.
223 A report by the American Society of Anesthesiologists and the Society of Cardiovascular Anesthesiologists Task Force on Transesophageal Echocardiography. Practice guidelines for perioperative transesophageal echocardiography. Anesthesiology. 1996;84:986-1006.
224 Colreavy FB, Donovan K, Lee KY, et al. Transesophageal echocardiography in critically ill patients. Crit Care Med. 2002;30:989-996.
 Video
Video
[/level-membership-for-critical-care-medicine-category][not-level-membership-for-critical-care-medicine-category]
W2 Bedside Ultrasonography
Use of Bedside Ultrasonography in the Intensive Care Unit
General Indications
Ultrasonography has become an invaluable tool in the management of critically ill patients. Its safety and portability allow for use at the bedside to provide rapid, detailed information regarding the cardiovascular system1 and the function and anatomy of certain internal organs. It also can be used by the clinician to assess the pleural and intraabdominal spaces and to perform some invasive procedures safely. General indications for performance of echocardiography in the ICU are listed in Box W2-1. Box W2-2 lists major indications for performance of primary TEE in the ICU. Other indications for use of bedside ultrasonography by the intensivist in critically ill patients are listed in Box W2-3.
Box W2-1
General Indications for Performance of an Echocardiographic Examination in the Intensive Care Unit
Box W2-2
Major Indications for Performance of Primary Transesophageal Echocardiography Study in the Intensive Care Unit
PEEP, positive end-expiratory pressure; TTE, transthoracic echocardiography.
Technical Aspects
Acoustic Window in a Critically Ill Patient
The practical value of bedside ultrasonography in the management of critically ill patients is now widely accepted despite the inherent limitations of the technique.2 These limitations are related mostly to suboptimal imaging conditions that commonly are encountered when performing studies of critically ill patients. The constrained physical environment of the ICU also can compromise the quality of the images obtained. For an ultrasound study to be deemed adequate, a good acoustic “window” is required to allow accurate analysis. Ultrasonography uses the physical principle that sound is reflected from tissue interfaces, allowing a two-dimensional (2D) image of the anatomic structure studied to be constructed.3 Anything hindering the reflection of this acoustic signal—air, bone, calcium, a foreign body, or another interposed structure—interferes with ultrasound transmission and diminishes the overall quality of the examination. In the ICU, many patients are mechanically ventilated. In these patients, adequate imaging can be limited by pneumothorax, pneumomediastinum, or subcutaneous emphysema.2 Other important factors limiting data acquisition in critically ill patients are related to surgical wounds and dressings, tapes, tubing, obesity, and chronic obstructive pulmonary disease. In addition, lack of patient cooperation and the impossibility of moving some patients into the optimal position for the examination contribute to a high prevalence of technically inadequate studies.2
Although ultrasonography permits evaluation of the structure and function of the heart and other important organs and structures, acquisition of data and interpretation of results are fraught with potential traps.4 Performing an ultrasound examination requires a thorough knowledge of anatomy and instrumentation, including attention to gain control, grayscale settings, Doppler velocity settings, and transducer placement.
Preparation of the Patient
An awake patient should be informed about the importance of the ultrasound investigation and should be provided with an explanation of how the clinician will perform the examination.3 These steps are especially important when the examination uses the transesophageal route.
Sedation
To optimize the ultrasound examination, the patient must be cooperative and nonagitated. Noninvasive procedures such as TTE and abdominal ultrasound usually are well tolerated by patients, and additional sedation rarely is needed to perform these procedures. When performing TEE, however, certain precautions need to be taken. Patients should fast (or have their tube feeds stopped) for at least 4 hours before the procedure. Topical anesthesia of the oropharynx also is helpful before insertion of the TEE probe, especially in patients who are not endotracheally intubated.3 Even if adequate topical anesthesia is provided, insertion of the TEE probe still can cause significant discomfort and anxiety, so providing adequate sedation and analgesia is important. Frequently used sedative or analgesic agents include intravenous (IV) midazolam, fentanyl, and propofol. Dosing should be titrated according to clinical parameters including arterial blood pressure, minute ventilation, and arterial oxygen saturation.3 Sedative-induced hypotension is a frequent problem in patients with depressed ventricular function or decreased systemic vascular resistance, and occasionally patients may require transient support with IV volume infusion or rarely a vasopressor agent. If the patient is extremely uncooperative and biting, transient paralysis accompanied by increased sedation may have to be used to perform TEE safely.
Monitoring During the Procedure
Most ICU patients are monitored continuously, at least for certain respiratory, cardiac, or hemodynamic parameters. It is essential that patients undergoing an ultrasound examination in the ICU be monitored at least with noninvasive recording of blood pressure, pulse oximetry, and electrocardiogram. Even TTE or abdominal ultrasound examinations can be associated with inadvertent pulling of tubes or drains, and anxiety can be encountered during the procedure. Because of its more invasive nature, TEE may induce complications such as increased agitation, respiratory distress, and discomfort during insertion of the probe. These effects can be associated with substantial changes in blood pressure and ventilatory status. Administration of sedatives and sometimes paralytic agents can induce further changes in hemodynamic and respiratory status.3,5
Safety
Performance of ultrasound examinations in the ICU allows procedures that previously required transport to the radiology suite to be performed at the bedside. This is an important advantage to a critically ill patient, because transport out of and back to the ICU is known to be associated with increased risk of complications.6 Performance of bedside TTE and of other noninvasive ultrasound examinations is safe and not associated with significant risks to the patient. Performance of bedside TEE also is associated with a low incidence of serious complications (<0.5% in the general population and the elderly).5 The reported mortality rate associated with TEE is 0.01% to 0.03%.7 Most patients undergoing TEE examinations in the ICU usually are receiving mechanical ventilation and have continuous monitoring of arterial blood pressure, electrocardiogram, and oxygen saturation.8 Transient hypotension, typically attributable to administration of sedative medications, usually can be treated with vasopressors or IV fluids or both. The risk of injury to the pharynx or esophagus is greater in anesthetized and endotracheally intubated critically ill patients than in awake patients, because anesthetized patients cannot assist with probe insertion by swallowing and do not resist when insertion is difficult.8 Increased difficulty in directing the TEE probe also can be encountered owing to the presence of a nasogastric tube. Coagulopathy and thrombocytopenia, common problems in critically ill patients, can increase the risk of hemorrhage due to mucosal injury during blind insertion of the TEE probe. Daniel et al.9 reported significant complications related to TEE in 18 (0.18%) of 10,218 examinations. In 11 studies reporting on 943 patients undergoing TEE, the rate of complications was 1.7%.5 Serious complications occurred in only two patients (0.2%). Colreavy et al.8 studied the safety and utility of TEE performed by ICU physicians in 255 critically ill patients and showed that TEE was associated with a complication rate of only 1.6%. It is reasonable to conclude that TEE is associated with few complications, given the high severity of illness among ICU patients.5 Close monitoring of hemodynamic and oxygenation parameters is essential. Box W2-4 lists specific contraindications to the insertion of a TEE probe.
Bedside Echocardiography in a Critically Ill Patient
Echocardiography can provide diagnostic information noninvasively regarding cardiac structure and mechanical function. The supplementary information provided by this technique can help determine the cause of hypotension refractory to inotropic support or vasopressor infusions.3 It also can help in the diagnosis of a wide spectrum of other cardiovascular abnormalities and guide therapeutic management. An adequate understanding of the proper use of echocardiography is a prerequisite for the intensivist. General indications for performance of an echocardiographic examination in the ICU are listed in Box W2-1.
Transthoracic Versus Transesophageal Echocardiography in a Critically Ill Patient
Accurate and prompt diagnosis is crucial in the ICU. The easiest and least invasive way to image cardiac structures is TTE.3 This noninvasive imaging modality is of great value in the critical care setting because of its portability, widespread availability, and rapid diagnostic capability. In the ICU, TTE in certain cases may fail to provide adequate image quality because of different factors that potentially can hinder the quality of the ultrasound signal, as was described previously. The failure rate (partial or complete) of TTE in the ICU has been reported to be 30% to 40%.10,11 Improvements have been made in transthoracic imaging (e.g., harmonics and contrast and digital technologies), however, resulting in a lower failure rate of TTE in the ICU (10%-15% in our institution).
TEE is particularly useful for evaluation of suspected aortic dissection, prosthetic heart valves (especially in the mitral position), source of cardiac emboli, valvular vegetations, possible intracardiac shunts, and unexplained hypotension. TEE allows better visualization of the heart in general and especially the posterior structures, owing to the proximity of the probe and favorable acoustic transmission.1 TTE also has limitations, however. For several areas of the heart and great vessels, TEE may provide limited images. The view of the left ventricular apex often is foreshortened with TEE, and an apical left ventricular clot can be missed. TTE usually is superior for visualization of the apex. Because of interposition of the left mainstem bronchus, the superior portion of the ascending aorta is another important area that may not be well visualized with TEE. With TEE, transducer position and angulation are constrained by the relative positions of the esophagus and heart. The relatively fixed relationship between the position of the probe and the heart often makes it impossible to align the Doppler beam parallel to the flow of interest (e.g., to evaluate the jet of blood resulting from aortic stenosis). In addition, the 2D image planes of TEE often make standard anatomic measurements more difficult to obtain.
As a result of the significantly improved technical quality of TTE, most ICU patients can be studied satisfactorily with this modality. Immediate TEE is still preferable, however, in certain specific clinical situations in which TTE is likely to fail or be suboptimal.11 The major indications for primary TEE in the ICU12,13 are listed in Box W2-2. Even when TEE is necessary, data from the TTE examination are often essential for the final clinical interpretation.
Hemodynamic Evaluation
Ventricular Function
Left Ventricular Systolic Function
The simplest quantitative approach is to measure the mid-left ventricular short-axis dimension at end diastole and end systole for determination of the percent fractional shortening. Fractional shortening is related directly to EF; normal fractional shortening is 30% to 42%.1
In the setting of regional wall motion abnormalities, fractional shortening may underestimate or overestimate global ventricular function and must be interpreted in light of what is seen in all of the 2D imaging planes of the ventricle.14
Global systolic ventricular function also can be assessed quantitatively by fractional area change (normal value is 36% to 64%)15 and EF (normal value is 55% to 75%) (Figure W2-1):
Figure W2-1 Fractional area change and ejection fraction calculation. Endocardial contour of the left ventricular cavity is traced at end diastole (A) and at end systole (B) in the transthoracic apical four-chamber view. Machine-integrated software computes the data and gives corresponding end-diastolic and end-systolic areas. Fractional area change can be calculated with these data (C). Normal values are 36% to 64%.15 Corresponding end-diastolic (D) and end-systolic (E) volumes are computed using the modified Simpson’s method. The data are used to calculate the ejection fraction (F). Normal values are 55% to 75%. LA, left atrium; LV, left ventricle; RA, right atrium; RV, right ventricle.
These measurements require good image quality, because endocardial border contours must be traced (see Figure W2-1). Machine-integrated software computes the data and provides volumes, areas, and the resultant EF (see Figure W2-1). In patients with regional wall motion abnormalities, more precise measures of stroke volume can be made by approximating ventricular volumes as a stack of elliptical discs on biplane imaging (modified Simpson’s method).1,15
In the critical care setting, endocardial border definition may be suboptimal because of poor image quality.10,16,17 In these cases, global ventricular function often is assessed qualitatively by visual inspection alone. This method has been found to be reliable when used by experienced clinicians.18 By simple visualization of the kinetics and size of the cardiac cavities in real time, an experienced intensivist with a sufficient echocardiographic background can establish a functional diagnosis immediately.
Analysis of regional wall motion includes a numerical scoring system to describe the movement of the different regions of the left and right ventricle (1 = normokinesia; 2 = hypokinesia; 3 = akinesia; 4 = dyskinesia; 5 = aneurysmal change).15 Visualized from the short-axis view of the left ventricle, a complete overview of myocardial areas perfused by the three major coronary arteries can be obtained (Figure W2-2). If the TTE examination is technically difficult and the endocardium is poorly visualized, harmonic imaging and possibly contrast, if needed, can dramatically improve endocardial border visualization and subsequent evaluation of global systolic function (as discussed further later in this chapter). For the remaining few technically challenging cases with suboptimal TTE, performance of TEE allows for a more precise evaluation of ventricular function in most critically ill patients because of the higher image quality that can be obtained with this echographic modality.
Left Ventricular Failure in the Intensive Care Unit
In a critically ill patient with unexplained hemodynamic instability, determination of cardiac function is an integral part of the medical management. Echocardiography is valuable in this setting because the clinical examination and invasive hemodynamic monitoring often fail to provide an adequate assessment of ventricular function. In a study by Fontes et al.19 that compared pulmonary artery (Swan-Ganz) catheterization and TEE, the overall predictive probability for conventional clinical and hemodynamic assessment of normal ventricular function was 98%, whereas for abnormal ventricular function (EF <40%), it was 0%. Several other studies have reported similar results.20–22 Assessment of biventricular function is one of the most important indications for performance of echocardiography in the ICU. In a study by Bruch et al.,23 115 critically ill patients were studied by TEE. The most common indication for TEE was hemodynamic instability (67% of patients). Of these hemodynamically unstable patients, 20 (26%) were found to have significant left ventricular dysfunction (EF <30%). In a study by McLean24 of the use of TEE in the ICU, the most common reason to request a TEE was assessment of left ventricular function. In most patients, left ventricular function was assessed adequately by TTE before TEE. In a study by Vignon et al.,17 TTE allowed adequate evaluation of global left ventricular function in 77% of mechanically ventilated ICU patients. Although TEE was needed for most other indications, TTE was shown to be an excellent diagnostic tool for assessment of left ventricular function in the ICU (Figure W2-3) even when positive end-expiratory pressure is present.
Sepsis-Related Cardiomyopathy
Classically, septic shock has been considered a “hyperdynamic” state characterized by normal or high cardiac output. Echocardiographic studies indicate that ventricular performance often is markedly impaired in patients with sepsis.25–27 Parker et al.28 were the first to describe left ventricular hypokinesis in septic shock. They reported that survivors manifested severely depressed left ventricular EF, but that adequate left ventricular stroke output was maintained as a result of acute left ventricular dilation.29 Jardin et al.25 studied 90 patients with septic shock and performed daily bedside assessments of left ventricular volume and left ventricular EF using TTE. They observed that left ventricular EF was significantly depressed in all patients, resulting in severe reductions in left ventricular stroke volume. Of these patients, 34 (38%) eventually were weaned from hemodynamic support and showed gradual improvement in left ventricular EF and ultimately recovered. The remaining 56 patients (62%) eventually died (of early circulatory failure or late multiple organ failure). In this subset, the degree of left ventricular dysfunction was less than in survivors but failed to improve over time. The severity of left ventricular dysfunction does not predict outcome. A paradoxical relationship between the degree of left ventricular dysfunction and the likelihood of recovery also has been described by others.25,28,30,31 Among patients who survive, left ventricular dilation and systolic dysfunction usually are reversible.
Left ventricular EF might not be a reliable index of left ventricular systolic function in patients with early septic shock because this is a state characterized by low systemic vascular resistance that unloads the left ventricle.25 Normal or supranormal EF in early sepsis might lead clinicians to make the wrong inference about cardiac reserve because left ventricular EF might decrease if afterload is increased by the administration of vasopressor agents.
Left Ventricular Diastolic Function
In the ICU, diastolic dysfunction should be suspected when ventricular filling pressure (pulmonary capillary wedge pressure) is elevated and EF is normal or supranormal.1 The diastolic properties of the ventricle often are assessed by evaluating Doppler echocardiographic mitral inflow and pulmonary venous flow patterns. Mitral inflow, as measured by pulsed wave Doppler at the tips of the mitral leaflets, is characterized by an early filling phase (E wave) followed by atrial systole, resulting in additional filling (A wave) (Figure W2-4). The transmitral Doppler pattern always should be interpreted in conjunction with pulsed wave Doppler of the pulmonary venous flow, which is characterized by a systolic phase (S), a diastolic phase (D), and an atrial phase (AR) from reversal of flow into the pulmonary veins during atrial contraction (Figure W2-5). These filling patterns are related to the intrinsic diastolic properties of the myocardium and are influenced by many different factors, particularly left atrial pressure, heart rate, ischemia, ventricular hypertrophy, and valvular pathologies. Only modest correlation has been found between Doppler indices of diastolic function and parameters measured using more invasive means.32,33 Integrated interpretation of mitral and pulmonary venous flow patterns may be useful for diagnosing abnormal myocardial relaxation (e.g., owing to hypertensive heart disease, hypertrophic cardiomyopathy, or coronary ischemia) or restrictive pathology (e.g., owing to cardiomyopathy, constrictive pericarditis, coronary artery disease, cardiac transplantation, or dilated cardiomyopathy). Nevertheless, these findings must be interpreted with caution when caring for critically ill patients, given the many different factors that can acutely influence flow patterns in this population of patients.
Right Ventricular Function and Ventricular Interaction
Abnormal right ventricular function often plays an important and sometimes underestimated role in the pathogenesis of critical illness.34–36 Based on an echocardiographic definition,37 massive pulmonary embolism and acute respiratory distress syndrome are the two main causes of acute cor pulmonale in adults.38 In the critical care setting, right ventricular function also can be altered by any other perturbations that increase right ventricular afterload, such as positive end-expiratory pressure or increased pulmonary vascular resistance (from vascular, cardiac, metabolic, or pulmonary causes). Depressed right ventricular systolic function is also often associated with right ventricular infarction, most commonly in the setting of inferior myocardial infarction. Acute sickle-cell crisis, air or fat embolism, myocardial contusion, and sepsis are other causes of acute right ventricular dysfunction.
Adequate assessment of right ventricular function is important when caring for hemodynamically unstable, critically ill patients, specifically patients with massive pulmonary embolism and acute respiratory distress syndrome, because the diagnosis of concomitant significant right ventricular dysfunction may alter therapy (e.g., fluid loading, use of vasopressors, use of thrombolytics) and provide information about prognosis.38,39 Echocardiographic examination of the right ventricle requires primarily an assessment of the size and kinetics of the cavity and septum.37,40 Normally the right ventricle appears relatively flat. As it dilates, the apical region of the right ventricle becomes more rounded (Figure W2-6). In the short-axis view, the right ventricle, which usually has a crescentic shape, becomes oval because of septal displacement and bulging of the right ventricular free wall (see Figure W2-6).1 Right ventricular size and function generally are evaluated by visual comparison with the left ventricle. Right ventricular diastolic dimensions can be obtained by measuring right ventricular end-diastolic area in the long axis, from an apical four-chamber view, using either TTE or TEE.
Because pericardial constraint necessarily results in left ventricular restriction when the right ventricle acutely dilates (i.e., there is ventricular interaction), one of the best ways to quantify right ventricular dilation is to measure the ratio between the right ventricular and left ventricular end-diastolic areas, an approach that cancels out individual variations in cardiac size.37,40 Moderate right ventricular dilation corresponds to a diastolic ventricular ratio greater than 0.6; severe right ventricular dilation corresponds to a ratio greater than or equal to 1.37,40 Right ventricular diastolic enlargement usually is associated with right atrial dilation, inferior vena caval dilation, and tricuspid regurgitation. When pressure in the right atrium exceeds pressure in the left atrium, the foramen ovale may open. Pressure and volume overload of the right ventricle can lead to distortion of left ventricular geometry and abnormal motion of the interventricular septum. With conditions of high strain imposed on the right ventricle (volume or pressure overload or both), the interventricular septum flattens, and the left ventricle appears to have a “D” shape (see Figure W2-6).4,37 This “paradoxical” septal motion also is seen at the interatrial level.
Because the two ventricles are enclosed within the relatively stiff pericardium, the sum of the diastolic ventricular dimensions has to remain constant.41 Acute right ventricular or left ventricular dilation can occur only if it is associated with an acute and proportional reduction in left ventricular or right ventricular diastolic dimension (i.e., ventricular interaction). With acute right ventricular dilation, septal displacement impairs left ventricular relaxation; the opposite occurs with acute left ventricular dilation. In these situations, the pressure-volume relationships of the left and right heart chambers are altered, and information obtained from a pulmonary artery catheter could be misleading (e.g., high filling pressures are recorded despite normal or even low circulating volume).
Pulmonary Embolism
Hemodynamic instability from acute cor pulmonale as a consequence of massive pulmonary embolism is a relatively common occurrence in critically ill patients. Until more recently, contrast pulmonary angiography generally was regarded as the gold standard for the diagnosis of pulmonary embolism. Angiography is an invasive procedure, however, and carries the risk of major complications in patients with circulatory failure.42 Contrast-enhanced helical computed tomography (CT) is an accurate and noninvasive test that has replaced angiography for the diagnosis of pulmonary embolism. Even CT requires transportation of patients to a location outside of the ICU, however, and transport alone is associated with significant risks. Echocardiography is well suited for diagnosis of pulmonary embolism because it can be done within minutes at the bedside. The diagnosis of acute cor pulmonale at the bedside with TTE has good positive predictive value for massive pulmonary embolism.43,44 This technique can detect acute right ventricular dilation and dysfunction resulting from a large pulmonary embolism. The finding of right ventricular dilation and dysfunction is not specific for pulmonary embolism, however, because these findings may be observed with a variety of other conditions associated with increased right ventricular strain. In a study by McConnell et al.,45 patients with acute pulmonary embolism were found to have a distinct regional pattern of right ventricular dysfunction with akinesia of the mid–free wall but normal motion at the apex by TTE. These findings contrasted with findings obtained in patients with primary pulmonary hypertension who had abnormal wall motion in all regions. Regional right ventricular dysfunction had a sensitivity of 77% and a specificity of 94% for the diagnosis of acute pulmonary embolism; positive predictive value was 71%, and negative predictive value was 96%. The presence of regional right ventricular dysfunction that spares the apex should raise the level of clinical suspicion for the diagnosis of acute pulmonary embolism.
Central pulmonary emboli are present in half of patients with symptoms of pulmonary embolism and acute cor pulmonale on TTE.5 Emboli lodged in the proximal pulmonary arteries usually cannot be visualized using TTE.5 Because other clinical conditions can produce acute cor pulmonale in the ICU, better visualization of the pulmonary arteries is needed to achieve high accuracy for the diagnosis of pulmonary embolism. This goal can be achieved by using TEE. TEE has good sensitivity for detecting emboli lodged in the main and right pulmonary arteries but is limited for the detection of more distal or left pulmonary emboli.5,46,47 If an embolus is visualized, the diagnosis is made. If the study is negative when the index of suspicion for pulmonary embolism is high, however, TEE must be followed up by a more definitive test such as angiography or helical CT. Also, when there is high clinical suspicion for pulmonary embolism but no emboli are visualized using TEE, the potential for nonthrombotic causes of pulmonary embolism (e.g., air or fat emboli) must be kept in mind.
The demonstration of acute cor pulmonale with echocardiography has important prognostic and therapeutic implications.48,49 The presence of cor pulmonale with massive pulmonary embolism is associated with increased mortality, whereas the absence of right ventricular dysfunction is associated with a better prognosis.39 There is no consensus on the precise indications for administration of thrombolytics in massive pulmonary embolism complicated by acute cor pulmonale.50,51 A safe and reasonable strategy for managing critically ill patients with suspected massive pulmonary embolism is as follows:
Assessment of Cardiac Output
Measurement of cardiac output remains a cornerstone in the hemodynamic assessment of critically ill patients. Thermodilution is considered the gold standard approach for determining cardiac output in most ICUs. Measurement of cardiac output using thermodilution requires placement of a pulmonary artery catheter (or at least central venous and arterial catheters); although a useful technique, it is invasive and potentially inaccurate. Unreliable values are particularly common in the presence of tricuspid regurgitation related to high pulmonary artery pressure. Several methods for determining cardiac output have been described using 2D and Doppler echocardiography. With this technique, stroke volume and cardiac output can be determined directly by combining Doppler-derived measurements of instantaneous blood flow velocity through a conduit with the cross-sectional area of the conduit. Blood flow can be calculated through various cardiac structures, including the pulmonary valve,52 mitral valve,53,54 and aortic valve.55–58 In the absence of intracardiac shunts, blood flow through these structures should be the same (continuity equation).59 Of these methods, the one using the left ventricular outflow tract and aortic valve as the conduit is probably the most reliable and most commonly used. There is excellent agreement with thermodilution in most situations.55–58 The left ventricular stroke volume is obtained by measuring the cross-sectional area of the left ventricular outflow tract (area [cm2] = (left ventricular outflow tract diameter [cm2]) × (π/4), assuming that just below the aortic annulus, the left ventricular outflow tract is circular) multiplied by the transaortic flow velocity time integral derived from a spectral Doppler tracing. The stroke volume obtained is multiplied by the heart rate to give the cardiac output: cardiac output = cross-sectional area × velocity time integral × heart rate (Figure W2-7).
With TTE, the left ventricular outflow tract diameter usually is obtained from the parasternal long-axis view, just below the insertion of the aortic valve leaflets. The Doppler interrogation is performed through the aortic valve from the apical view (see Figure W2-7). With TEE, the left ventricular outflow tract diameter usually is obtained from the five-chamber view of the left ventricle. The transgastric view usually is used to obtain an apical long-axis view of the aortic valve through which Doppler interrogation is performed.60 With either TTE or TEE, obtaining an accurate left ventricular outflow tract diameter and Doppler signal is essential to have an accurate cardiac output calculation. Because the measure of the left ventricular outflow tract diameter has a second-order relationship with the cross-sectional area (see previous formula), it is crucial that this measure be determined precisely. For the Doppler signal to be reliable, the Doppler sample must be parallel to the transaortic flow with an angle of incidence not exceeding 20 degrees to avoid underestimation of transaortic velocity. Using TTE, McLean and coworkers61 showed an excellent correlation (r = 0.94) between cardiac output determined by the left ventricular outflow tract Doppler method and the thermodilution method in critically ill patients. Other studies have shown similar results.55 In a study by Feinberg et al.,58 cardiac output determined by TEE Doppler imaging was obtainable in 88% of 33 critically ill patients, and there was good correlation (r = 0.91) with the thermodilution method. Descorps-Declere et al.60 also showed transgastric pulsed Doppler measurement across the left ventricular outflow tract with TEE to be a clinically acceptable method for cardiac output measurement in critically ill patients (r = 0.975 compared with the thermodilution method).
Another promising ultrasound-based technology to estimate cardiac output noninvasively in adults uses a small transesophageal Doppler probe to measure blood flow velocity waveforms in the descending aorta combined with a nomogram (based on height, weight, and age) for estimation of aortic cross-sectional area. This minimally invasive esophageal probe can be inserted easily in sedated patients and left in place safely for several days to provide continuous monitoring of cardiac function.62,63 Several technical problems can limit the accuracy of cardiac output measurements by esophageal Doppler monitoring,62 however, and although initial results are promising,64–66 more studies are needed to make a decision regarding the accuracy of this technique in critically ill patients.
Assessment of Filling Pressures and Volume Status
Adequate determination of preload and volume status is important for proper management of critically ill patients. Invasive pressure measurements to assess left ventricular filling are commonly used at the bedside to make inferences regarding left ventricular preload. These pressure measurements correlate only weakly with left ventricular volume, however.67 Data from invasive monitoring using pulmonary artery catheterization may be misleading because ventricular compliance is altered secondary to numerous factors.68,69 Differences in diastolic compliance among patients may account for the weak correlation between pressure and volume and may limit the ability to use pressure measurements alone to derive information concerning left ventricular preload.14 Echocardiography can be helpful for adequately assessing preload. Parameters that can be measured using 2D imaging are left ventricular end-diastolic volume and left ventricular end-diastolic area. Using Doppler interrogation, additional information—mainly transmitral diastolic filling pattern and pulmonary venous flow—can be obtained.
Two-Dimensional Imaging
Echocardiography has been validated for left ventricular volume measurements.15 Subjective assessment of left ventricular volume by estimating the size of the left ventricular cavity in the short-axis and long-axis views is often adequate to guide fluid volume therapy at the extreme ends of cardiac filling and function. More precise quantitative values are desirable, however, and can be obtained by using endocardial border tracing (as described earlier). The normal left ventricular end-diastolic volume as determined by echocardiography is 80 to 130 mL,15 and the normal left ventricular end-diastolic volume index is 55 to 65 mL/m2.15 Left ventricular end-diastolic area measured in the left parasternal short-axis view at the level of the midpapillary muscle is commonly used to estimate volume status (Figure W2-8). The normal values for left ventricular end-diastolic area in the short-axis view are 9.5 to 22 cm2.15
Figure W2-8 Calculation of left ventricular end-diastolic area in the transthoracic short-axis view at the level of the midpapillary muscle by endocardial contour tracing. Values of normal left ventricular end-diastolic area in the short axis range from 9.5 to 22 cm2.15 The level of the midpapillary muscle is used because of the reproducibility of the view and because changes in left ventricular volume affect the short axis of the ventricle to a greater degree than the long axis. LV, left ventricle; RV, right ventricle.
Two-dimensional TTE evaluation of ventricular dimensions has been found to be useful in assessing preload and optimizing therapy of ICU patients.25,70 Nevertheless, image quality may be suboptimal and preclude adequate visualization of the endocardial border by TTE. This potential limitation of TTE has been partly circumvented in recent years with the advent of harmonic imaging and contrast echocardiography (see later). In cases in which endocardial border visualization remains suboptimal, TEE is the modality of choice. With TEE, left ventricular volume can be estimated rapidly by subjective assessment of the left ventricular size. Quantitatively, it is estimated most often by determining left ventricular cross-sectional area at the end of diastole, most commonly using the transgastric short-axis view at the level of the midpapillary muscle. This section is used because of the reproducibility of the view and because changes in left ventricular volume affect the short axis of the ventricle to a greater degree than the long axis.14 The end-diastolic area must be measured consistently from the same reference section. End-diastolic area measured with TEE correlates with left ventricular volume determined by radionuclide studies.70
Systolic obliteration of left ventricular cross-sectional area accompanies decreased end-diastolic area and is considered to be a sign of severe hypovolemia (Figure W2-9). Although a small end-diastolic area generally indicates hypovolemia, a large end-diastolic area does not indicate adequate preload in patients with left ventricular dysfunction. Also, when systemic vascular resistance is low, as in early sepsis, left ventricular emptying is improved because of the lowered afterload. In these situations, it may be difficult to differentiate hypovolemia from low systemic vascular resistance by echocardiography alone, because both conditions are associated with decreased end-diastolic area.
Knowledge of left ventricular end-diastolic volume or absolute preload does not allow for accurate prediction of the hemodynamic response to alterations in preload.71 Tousignant et al.72 investigated the relationship between left ventricular stroke volume and left ventricular end-diastolic area in a cohort of ICU patients and found only a modest correlation (r = 0.60) between single-point estimates of left ventricular end-diastolic area and responses to fluid loading. Based on the assumption that changes in end-diastolic area occur because of changes in left ventricular volume, the determination of this area and its subsequent degree of variation after a fluid challenge could help better assess preload responsiveness. Studies have shown that changes in end-diastolic area measured by TEE using endocardial border tracing are closely related to changes in cardiac output and are superior to measurements of pulmonary artery occlusion pressure for predicting the ventricular preload associated with maximal cardiac output.73
Circulating volume status also can be assessed by 2D echocardiography by indirectly estimating right atrial pressure; this is often done by assessing the diameter and change in caliber with inspiration of the inferior vena cava (Figure W2-10). This method has been shown to discriminate reliably between right atrial pressures less than 10 mm Hg or greater than 10 mm Hg.74 A dilated vena cava (diameter >20 mm) without a normal inspiratory decrease in caliber (>50% with gentle sniffing) usually indicates elevated right atrial pressure. In mechanically ventilated patients, this measure is less specific because of a high prevalence of inferior vena cava dilation.75,76 A small vena cava reliably excludes the presence of elevated right atrial pressure in these patients.75,76
Doppler Flow Patterns
Information obtained by analysis of the Doppler signal at the level of the mitral valve and pulmonary vein offers additional information about preload.77,78 These Doppler profiles can be obtained by either TTE or TEE. Transmitral parameters that have been studied include the relation of early to late transmitral diastolic filling (E/A ratio), isovolumetric relaxation time, and the rate of deceleration of early diastolic inflow (deceleration time).1
A decrease in preload causes a significant reduction in the E wave (early filling flow wave) velocity at the mitral level in conjunction with a decrease of the S wave (systolic flow wave) in the pulmonary vein. In clinical practice, the E/A ratio is easy to assess; the normal value of this ratio is approximately 1.1,3 In conjunction with normal left ventricular contractility, a low E/A ratio is usually a characteristic sign of inadequate preload.79
Pulmonary venous flow also can be used to assess left atrial pressure. A normal pulmonary venous flow pattern showing a predominance of flow during systole (S phase) compared with early diastole (D phase) usually indicates that left atrial pressure is less than 8 mm Hg, whereas the opposite predominance of flow (in the absence of significant mitral regurgitation) usually indicates elevation of left atrial pressure.1
Hypovolemia in the Intensive Care Unit
Precise and rapid assessment of volume status is crucial when caring for hemodynamically unstable ICU patients. Hypovolemia is one of the most common causes of hypotension in the ICU. As was discussed in detail earlier, bedside echocardiography offers a quick and reliable way of estimating volume status by evaluating cardiac dynamics and left ventricular dimensions and area. The finding of end-systolic cavity obliteration is usually a reliable sign of hypovolemia. Other changes in the volume status are usually associated with subtle changes in left ventricular cavity size, so only this extreme is reliable to make the diagnosis of hypovolemia by echocardiography. In general, TTE has good sensitivity for diagnosing the presence of a small hyperdynamic left ventricle, the most typical finding in hypovolemic patients with underlying normal cardiac function, although TEE is useful in the immediate postoperative setting (Video W2-1).
When dynamic left ventricular obstruction is present, cardiac output is low, and even in the presence of marked hypovolemia, pulmonary artery occlusion pressure is high. Paradoxical worsening of hypotension after intravascular volume loading may be the first clue to dynamic left ventricular obstruction in critically ill patients. It is important that this entity be recognized early and that the pathophysiologic process be well understood, because inadequate management of this condition can lead rapidly to worsening of hemodynamic status and death. Dynamic obstruction of the left ventricle can present in different forms. One of these forms is dynamic left ventricular outflow tract obstruction. Although dynamic left ventricular outflow tract obstruction is often seen in association with asymmetrical septal hypertrophy, it also can occur in other situations.80,81 Dynamic left ventricular outflow tract obstruction is thought to be caused by the Venturi effect. This effect results when excessive acceleration of blood through a conduit produces a decrease in pressure. In the left ventricular outflow tract, such a decrease in pressure leads to a suction phenomenon that draws the anterior mitral leaflet and chordae inward toward the interventricular septum.82 This systolic anterior motion of the mitral valve leads to contact between the mitral leaflet and the septum that creates an obstructive subaortic pressure gradient and distortion of the mitral valve leaflet coaptation (Figure W2-11).82 By 2D echocardiography, the left ventricle appears to be small and hyperdynamic, and there is motion of the anterior leaflet (or chordae or both) toward the septum in systole (see Figure W2-11). With color Doppler, a “mosaic” pattern of flow is seen in the left ventricular outflow tract, owing to the high velocity and turbulence. Variable degrees of asymmetrical mitral regurgitation also may be present (see Figure W2-11). Continuous-wave Doppler shows the presence of a significant gradient in the left ventricular outflow tract. Dynamic left ventricular obstruction also can be present without systolic anterior motion. In the presence of reduced afterload, dehydration, or significant catecholaminergic stimulation, patients with a small hypertrophied left ventricle (typically seen in elderly patients with chronic hypertension) can develop midventricular obstruction due to hyperdynamic systolic obliteration of the left ventricular cavity (see Figure W2-9).83 These physiologic factors may predict development or worsening of left ventricular dynamic obstruction. Interplay of these factors with preexisting ventricular hypertrophy predisposes the patient to develop cardiogenic shock from this combined loss of preload and presence of dynamic left ventricular obstruction. Dynamic left ventricular obstruction has also been described in patients with acute myocardial infarction, mostly in association with apical infarction.81,84,85
In a study by Chenzbraun et al.85 in ICU patients, four patients with hemodynamic instability were found to have a small hyperdynamic ventricle on TEE. Of these four patients, three had pulmonary artery occlusion pressure greater than 20 mm Hg. A study by Poelaert et al.20 that evaluated the diagnostic value of TEE compared with pulmonary artery catheterization showed that pulmonary artery catheterization failed to diagnose the presence of hypovolemia in 44% of patients when TEE showed systolic obliteration of the left ventricular cavity, supporting a diagnosis of hypovolemia. TTE and TEE have been shown to play a key role in making the diagnosis of hypovolemia and left ventricular dynamic obstruction, leading to a dramatic impact on therapy.19,21,22,82–85
