Basic Scan Patterns and OCT Output
Each commercially available OCT device has unique scan patterns that are programmed into the machine. There is considerable overlap between devices, however, with several general scan patterns available across all devices. The scan patterns for the major commercially available machines are summarized in Table 1.2.1. The two most commonly used scans in evaluating retinal disease are:
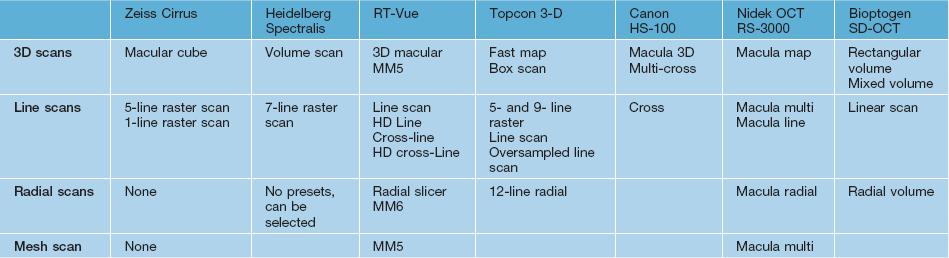
Depending on the particular machine, scan patterns may be programmable with respect to functions such as pixel density, B-scan density, speed, ability to oversample, and length of scanned image.
Macular Cube Scan
▶ Raster Scans: raster scanning is one method used to obtain cube scans of the macula. This involves a systematic pattern of image capture over a rectangular area using closely spaced parallel lines. It leads to a uniform sampling density over the entire area being scanned with the OCT.
▶ Radial Scans: these consist of six to 12 high resolution line scans taken at radial orientations, all passing through the fovea. The RT-Vue’s MM6 is a radial line scanning pattern with 12 lines radially oriented to the fovea, each 6 mm long. The macular radial scanning pattern of the Spectralis and the 6-line radial scan of the Topcon 3D OCT 100 are similar. A disadvantage of the radial line scans is that the machine interpolates between the scans when generating macular thickness maps. This is reasonable for the fovea where the lines are close to each other, but can miss lesions further out in the macula where the lines are spaced further apart.
▶ Mesh Scans: Some machines include a mesh scanning pattern that acquire vertical and horizontal B-scans over the area of interest. The MM5 protocol of the RT-Vue uses a less dense outer and a more dense inner grid. The outer grid has horizontal and vertical B-scans 0.5 mm apart and the inner grid has horizontal and vertical B-scans each 0.1 mm apart.
Line, Cross-Line and Raster Scans
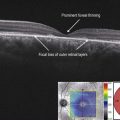
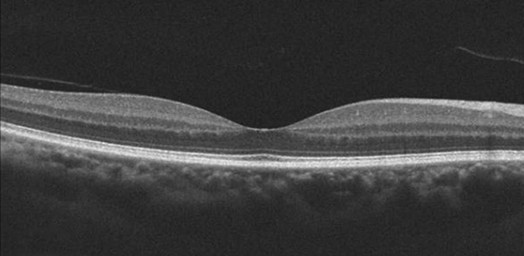
SD-OCT line scans are a single B-scan composed of generally a higher number of A-scans than the cube scans. This higher sampling density allows higher resolution scans of the retinal tissue to be acquired. In addition, oversampling can be performed to increase signal-noise ratio (Fig. 1.2.1). The Cirrus 5-line raster consists of five horizontal 6 mm lines each scanned four times and averaged. The five lines in the raster can be collapsed to obtain a single line scan that consists of 20 averaged B-scans. The ‘cross-line’ scan of the RT-Vue consists of a horizontal and vertical line scan while the 7-line raster of the Heidelberg also spans a 6 mm × 6 mm area of the macula. Heidelberg can be programmed to oversample a line scan up to 100 times at each point.
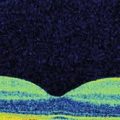
C-Scans (En Face Images), OCT Fundus Image (Rendered Fundus Image, Summed Voxel Projection [SVP])
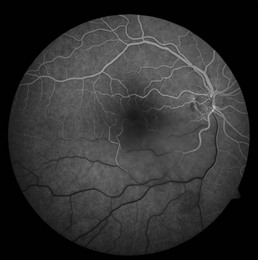
This image looks like a red-free image of the retina and is obtained by summation of data from all the B-scans. It is currently available in all SD-OCT machines except Heidelberg (Fig. 1.2.3).
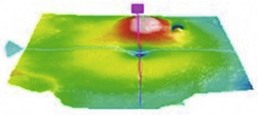
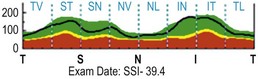
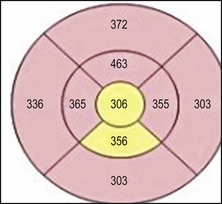
Topographical maps
Retinal thickness data obtained from segmented 3D datasets are used to form a 2D topographical data set that can be displayed in false color (color-coded) displays, or as an overlay on the OCT rendered fundus image to obtain a quick topographic picture of the macula, internal limiting membrane or retinal pigment epithelium layer (Fig. 1.2.4).