9 Basic Physiology and Hemodynamics of Cardiac Pacing
 Physiology of Electrical and Mechanical Activation
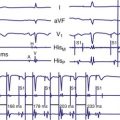
Electrical Activation During Sinus Rhythm
The cardiac action potential originates from the sinus node, located high in the right atrium (Fig. 9-1). Its cells depolarize spontaneously and initiate the spontaneous depolarization of action potentials at a regular rate from the sinus node. This rate depends on various conditions, such as atrial stretch and sympathetic activation, but is usually between 60 and 100 beats per minute (bpm) at rest. Myocytes are electrically coupled to each other through gap junctions. These structures consist of connexin molecules and allow direct intercellular communication.1 Gap junctions do not have a preferential direction of conduction, but because the action potential starts in the sinus node, it spreads from there through the atria. Evidence suggests specialized conduction pathways in the atrium, but their (patho) physiologic relevance is still disputed.
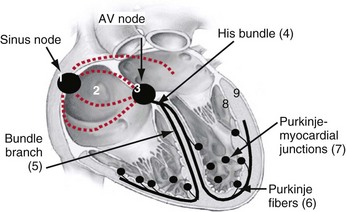
In the human heart, spreading of the action potential through the atria takes approximately 100 msec, after which the impulse reaches the AV node (see Fig. 9-1). In the normal heart the AV node is the only electrical connection between the atria and ventricles, because a fibrous ring (anulus fibrosus) is present between the remaining parts of the atria and ventricles. The AV nodal tissue conducts the electrical impulses very slowly; indeed, it takes approximately 80 msec for these impulses to travel from the atrial side to the ventricular side of the AV node. This delay between atrial activation and ventricular activation has functional importance because it allows optimal ventricular filling. Its slow conduction renders the AV node sensitive to impaired conduction and even complete conduction block, an important indication for ventricular pacing. As with other locations in the heart, conduction in the AV node has no preferential direction. Consequently, impulses can also be conducted retrogradely through the AV node, a condition that can occur when the ventricles are electrically stimulated.
From the AV node, the electrical impulse reaches the His bundle, the first part of the specialized conduction system of the ventricles called the Purkinje system. Within this system the electrical impulse is conducted approximately four times faster (3-4 m/sec) than in the working myocardium (0.3-1 m/sec). This difference results because Purkinje cells are longer and have a higher content of gap junctions.1–5
It seems that the bifascicular vision of structure of the LBB is oversimplified.6 The general picture that now emerges is that the left ventricular Purkinje network is composed of three main, widely interconnected parts, depending on the anterior subdivision, the posterior subdivision, and a centroseptal subdivision of the left main bundle. This third medial or centroseptal division supplies the midseptal area of the left ventricle and arises from the LBB, from its anterior or posterior subdivision, or both. The fascicles continue in a network of subendocardially located Purkinje fibers. In the left ventricle, Purkinje fibers form a network in the lower third of the septum and free wall, which also covers the papillary muscles.4,7 In humans the bundles are present only underneath the endocardium, whereas other species (e.g., ox, sheep, goat) have networks of Purkinje fibers across the entire ventricular wall.8,9
It is important to note that the His bundle as well as the right and left bundle branches and their major tributaries are electrically isolated from the adjacent myocardium. The only sites where the Purkinje system and the normal working myocardium are electrically coupled are the Purkinje-myocardial junctions. The exits of the Purkinje system are located in the subendocardium of the anterolateral wall of the right ventricular (RV) and the inferolateral left ventricular (LV) wall4,10 (see Fig. 9-1). This area of exit corresponds with the area of the ventricular muscle that is activated earliest.2–5,11,12 The distribution of the Purkinje-myocardial junctions is spatially inhomogeneous, and the junctions themselves have varying degrees of electrical coupling.13
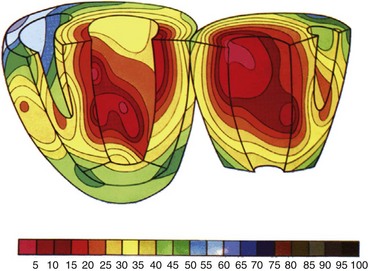
Endocardial activation of the right ventricle starts near the insertion of the anterior papillary muscle 10 msec after onset of LV activation11 (Fig. 9-2). After activation of the more apical regions, the activation of the ventricular working myocardium occurs predominantly from apex to base, both in the septum and in the LV and RV free wall. Further depolarization occurs centrifugally from endocardium to epicardium as well as tangentially.11,12 The earliest epicardial breakthrough occurs in the pretrabecular area in the right ventricle, from which there is an overall radial spread toward the apex and base. The last part of the right ventricle that becomes activated is the AV sulcus and pulmonary conus. Overall, the posterobasal area of the left ventricle (or an area more lateral) is the last part of the heart to be depolarized (see Fig. 9-2).
The time between arrival of the impulse in the His bundle and the first ventricular muscle activation is approximately 20 msec,4 whereas total ventricular activation lasts 60 to 80 msec, corresponding to a QRS duration of 70 to 80 msec.11 These numbers illustrate the important role of the Purkinje fiber system in the synchronization of myocardial activity. This role results from the system’s unique propagation properties and its geometrically widespread distribution. During normal orthodromic excitation, fast propagation over long fibers, together with wide distribution of Purkinje-myocardial junctions, induces a high degree of coordination between distant regions of the myocardium.
Mechanical Activation During Sinus Rhythm
As in many other muscle cells, electrical activation leads to contraction in cardiac myocytes, a process referred to as excitation-contraction (E-C) coupling. In cardiac E-C coupling, the calcium ion (Ca2+) plays a central role14 (Fig. 9-3). The contraction-relaxation cycle starts when depolarization leads to entry of Ca2+ into the cell through voltage-dependent L-type Ca2+ channels. This Ca2+ entry triggers a much larger amount of Ca2+ to be released from the sarcoplasmic reticulum (Ca2+-induced Ca2+ release). These processes increase intracellular Ca2+ from approximately 10−7 M to 2 × 10⁻⁶ M. This high calcium concentration catalyzes the interaction between myosin and actin filaments, leading to contraction. After repolarization, relaxation occurs as Ca2+ dissociates from the contractile apparatus and is taken up again by the sarcoplasmic reticulum through the action of sarcoplasmic reticular Ca2+–adenosine triphosphatase (SERCA). Intracellular Ca2+ homeostasis is also maintained through action of the sodium-calcium (Na+/Ca2+) exchanger (NCX). Normally, this exchanger removes Ca2+ from the cell (forward mode). Figure 9-3 also shows that the intracellular Ca2+ concentration rises rapidly after the upstroke of the action potential, but that there is some delay between the Ca2+ increase and the development of force. This delay is the main determinant of the delay between electrical and mechanical activation.
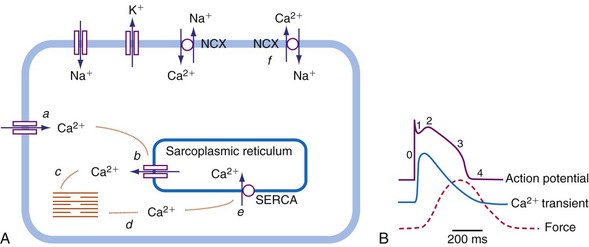
The electromechanical delay, that is, the delay between the depolarization and the onset of force development, amounts to approximately 30 msec.15,16 On a global basis, this delay can be observed as the delay between the R wave of the electrocardiogram (ECG) and the rise in LV pressure (Fig. 9-4). Electromechanical coupling in failing hearts is different from that in normal hearts. A prominent feature of heart failure is that the relation between SERCA and the NCX changes. Often, SERCA is downregulated17 and NCX upregulated in the heart failure state.18 On the one hand, the reduced SERCA activity leads to less Ca2+ loading of the sarcoplasmic reticulum, resulting in less Ca2+ release during the subsequent activation, and thus a weaker contraction (systolic dysfunction). On the other hand, during diastole, Ca2+ removal from the cytosol is slower and incomplete, leading to a slower relaxation and greater diastolic stiffness (diastolic dysfunction). The upregulation of the NCX and the elevated intracellular Na+ concentrations in failing myocardium19 may compensate for the SERCA downregulation.20,21 The high Na+ concentration facilitates the NCX to work in the “reverse mode,” that is, to remove intracellular Na+ and exchange it for extracellular Ca2+. This additional Ca2+ enhances systolic function at least to some extent. Because the SERCA pump is much faster in pumping calcium than the NCX, insufficiency in contraction and relaxation in failing hearts is most pronounced at higher heart rates. These changes result in decreasing contractile force with increasing heart rate, a negative force-frequency relation.17 The changes in the failing myocardium lead to the altered expression of other proteins involved in E-C coupling, as well as shifts in isoforms of various contractile proteins.22
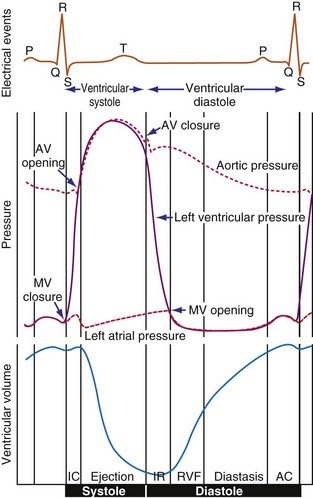
Because of the tight coupling between excitation and contraction, atrial activation is followed by atrial contraction, and ventricular activation by ventricular contraction. Consequently, atrial contraction precedes ventricular contraction, as illustrated in Figure 9-4. Because of this timing, the atrial contraction adds about 20% to the volume of the ventricles. This “atrial kick” increases the length of ventricular muscle cells and their sarcomeres. The sarcomere length is an important determinant of myocardial contractile force. Over the entire physiologic range of sarcomere lengths (1.6-2.4 µm), the longer the sarcomeres, the greater is the contractile force. This effect, known as the Frank-Starling relation (Starling curve; Starling law of the heart), is only partly related to the overlap of actin and myosin, as generally mentioned in textbooks. More important to the Frank-Starling relation is the growing affinity of troponin C for calcium at increasing sarcomere length,23 although the cause of this greater sensitivity is not completely understood.
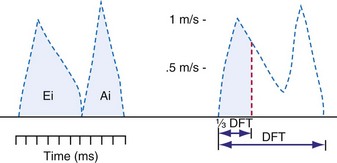
Ventricular contraction starts after ventricular depolarization. After a short isovolumic contraction phase, the aortic valve opens, starting the ejection phase. The velocity of emptying of the ventricle is highest in the first half of the ejection phase because of a higher pressure gradient between the left ventricle and the aorta. In the second half of the ejection phase, LV pressure actually falls below aortic pressure, but the aortic valve stays open because of the inertia of the flowing blood. With increasingly negative LV-aortic pressure gradients, the aortic valve closes and the isovolumic relaxation phase starts, ending with the opening of the mitral valve. Because of the filling of the atrium during ventricular systole, atrial pressure is relatively high. This event, in combination with the rapid fall in LV pressure, causes a positive AV pressure gradient during the early filling phase. Thus, rapid acceleration of blood occurs, contributing to most of the LV filling in the early diastolic phase. This event is also reflected by the large Ei wave on mitral valve Doppler recordings in healthy hearts (Fig. 9-5).
 DFT [diastolic filling time]).
Abnormal Activation Sequence During Left Bundle Branch Block and Right Ventricular Pacing
The normal, physiologic, and almost synchronous sequence of electrical activation is lost in diseases affecting the ventricular conduction system, such as block of the left or right bundle branch24 and the presence of an accessory pathway bypassing the AV node, as in the Wolff-Parkinson-White syndrome.25 Additionally, ectopic impulse generation, occurring during ventricular pacing and extrasystoles,26,27 leads to abnormal impulse conduction. Under all these circumstances, the impulse is conducted primarily through the slowly conducting working myocardium rather than rapidly through the specialized conduction system. As a consequence, under conditions of abnormal activation, the time required for activation of the entire ventricular muscle, expressed as QRS duration, is at least twice as long as that during normal sinus rhythm.
Detailed studies on the three-dimensional spread of activation during ventricular pacing in canine hearts have been conducted since the 1960s.12,26 The sequence of electrical activation in LBB block (LBBB) is similar to that during RV apex pacing. This sequence can be derived from the QRS configuration of the surface ECG27,34,35 and from endocardial activation maps in experimental LBBB and RV pacing.36 The similarity has lead to the use of AV sequential RV apex pacing as a model for “experimental LBBB.”34,37,38
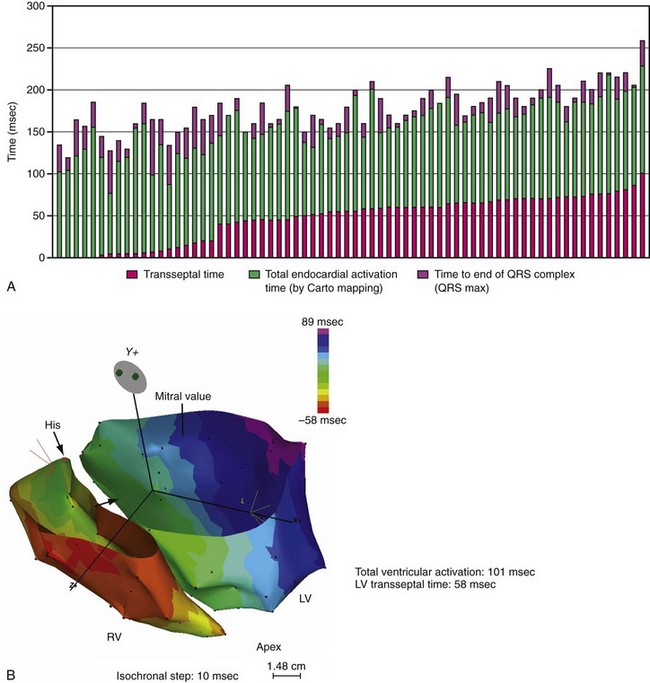
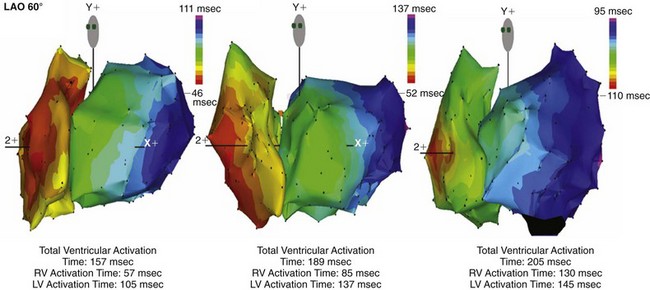
Until recently, information on impulse conduction in patients with LBBB was limited to the data reported by Vassallo et al.24,27 These investigators mapped LV endocardial activation during RV apex pacing and in LBBB at a limited number of endocardial sites, showing that activation starts at the RV endocardium in both conditions. The first noticeable activation at the LV endocardium after right-to-left conduction of the impulse occurs at a single breakthrough site, which in almost all patients is the LV breakthrough time, 50 to 70 msec after the earliest RV activation. The impulse is conducted from the septum toward the distal free wall in a gradual manner, the site of latest activation generally being the inferoposterior wall.11 More recently, this finding has been confirmed using high-resolution mapping system39–42 (Fig. 9-6). These studies also showed that activation patterns differ among patients largely because of differences in the origin of LBBB: either a proximal conduction block43,44 or a uniform but slow conduction through the LBB.45 In approximately one third of patients with heart failure and typical LBBB QRS morphology, transseptal activation time (i.e., time between earliest RV and LV septal breakthrough point) is bimodally distributed and has a large range in both groups of patients, with transseptal conduction time of 40 msec or less and longer than 40 msec.46 This indicates great heterogeneity in the RV-to-LV activation time. Furthermore, in patients with LBBB, the total LV endocardial activation time ranges from 60 to 160 msec. Etiology does not seem to have a major impact on the total endocardial activation time. Of note, the sum of transseptal and total endocardial activation times does not account for the maximum QRS duration, which is 20 to 60 msec longer, probably because of LV endocardial-to-epicardial conduction time (Fig. 9-7). These data also show that QRS duration provides a reasonable although imperfect estimate of total electrical asynchrony.
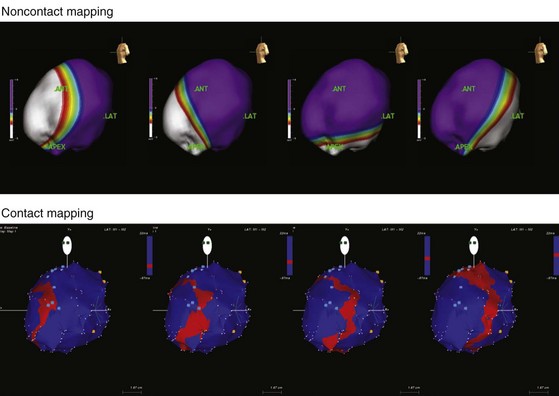
Patients with LBBB show a peculiar spread of ventricular activation.40,42 Indeed, in two thirds of patients with LBBB, a functional line of block is present, resulting in a U-shaped electrical activation wavefront. The presence and location of the line of block have been also recently observed in canine model of LBBB using the same noncontact mapping system.46a The activation front propagates first around the inferior wall and then spreads onto the lateral and basal walls. The location and length of the line of block vary greatly and are related to the site and time of LV breakthrough. In patients with significant prolongation of the QRS duration (>150 msec), the line of block is consistently located in an anterior position. In contrast, in patients with QRS duration of 120 to 150 msec, the line of block is usually shorter and is located anteriorly, laterally, or posteriorly40 (Movie 9-1).
Abnormal Contraction Patterns During Left Bundle Branch Block and Right Ventricular Pacing
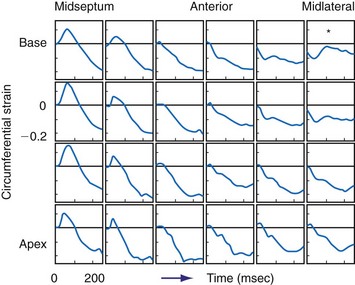
Given the tight relationship between excitation and contraction in the myocardium, it is not surprising that asynchronous electrical activation also leads to asynchronous contraction. Regions where the impulse arrives first also start to contract first.47 During LBBB or ventricular pacing, local contraction patterns differ not only in the onset of contraction, but also, and more importantly, in the pattern of contraction. These contraction patterns imply that opposing regions of the ventricular wall are out of phase and that energy generated by one region is dissipated in opposite regions. In patients with LBBB or RV pacing, the early-contracting region is most often the septum. The earliest-contracting fibers can shorten rapidly by up to 10% just during the isovolumic contraction phase, because the remaining muscle fibers are still in a relaxed state (Movie 9-2). This rapid, early shortening is followed by an additional but modest systolic shortening, eventually followed by systolic stretch (from delayed mechanical contraction of other regions, in lateral wall), and premature relaxation (Fig. 9-8). In late-activated regions, in contrast, the fibers are stretched in the early systolic phase (up to 15%) from contraction of the early-activated region. Doubling of net systolic shortening and delayed relaxation occur in late-activated regions.31,48 The discoordination between early- and late-activated regions leads to lower output and reduced efficiency of the heart as a pump.
The regional differences in contraction pattern most likely results from the local differences in myocardial fiber length during the early systolic phase. This is supported by studies using two isolated papillary muscles in series in which asynchronous stimulation caused a downward shift in the force-velocity relation in the earlier-activated muscle and an upward shift in the later-activated one.49 Furthermore, during ventricular pacing, regional systolic fiber shortening increases with greater isovolumic stretch.50 Similarly, a close correlation exists between the time of local electrical activation and the extent of systolic fiber shortening.51 Therefore, the regional differences in contraction pattern during ventricular pacing are most likely caused by regional differences in effective preload and local differences in the contraction force triggered by the Frank-Starling relation.
On M-mode echocardiography, abnormal contraction patterns during RV pacing and LBBB appear as paradoxical septal motion.52 However, this motion is not actually paradoxical, because it is really the net result of different forces. The motion is caused by the asynchrony between RV and LV, which produces dynamic alterations in transseptal pressure differences,52,53 and by presystolic shortening of septal muscle fibers.54 Abnormal septal motion results in a diminished contribution of the interventricular septum to LV ejection. This has been measured in experimental LBBB using MRI tagging54 and in patients with LBBB QRS morphology using speckle tracking.55,56 The septal regions, even in absence of detectable scar, showed the lowest amount of systolic strain within LV; in contrast, the lateral wall shows the highest regional strain.55 This finding demonstrates that LBBB determines a unique and unequal LV strain distribution that may be corrected by CRT.55–57
Effect of Left Bundle Branch Block and Right Ventricular Pacing on Local Energetic Efficiency
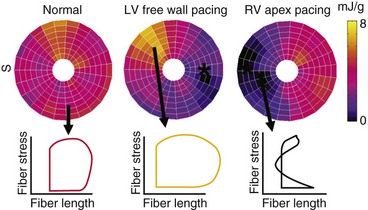
The local differences in wall motion and deformation mentioned previously reflect regional differences in myocardial work.48,58 This relationship was demonstrated by construction of local fiber stress–fiber strain diagrams and calculation of local external and total mechanical work. In regions close to the pacing site (or septum in patients with LBBB), shortening occurs at low pressure, whereas these areas are transiently being stretched at higher ventricular pressures. As a consequence, the stress-strain loops have a figure-8-like shape with a low net area, indicating the absence of external work. In regions remote from the pacing site (or lateral wall in patients with LBBB), the loops are wide, and external work can be up to twice that during synchronous ventricular activation (Fig. 9-9). Total myocardial work (sum of external work and potential energy) in LBBB and with RV pacing is reduced by 50% in early-activated regions and is increased by 50% in late-activated regions in comparison with atrial pacing.48,54,59
Several studies reported that ventricular pacing and LBBB are associated with regional differences in myocardial blood flow,31,35,38,54,58–60 glucose uptake,38,61 and oxygen consumption.58,62 During RV apex pacing and LBBB, low values are found in the septum, the early-activated part of the left ventricle. Compared with sinus rhythm, myocardial blood flow and oxygen consumption are 30% lower in early-activated regions and 30% higher in late-activated regions.31,58,59 Controversy surrounds the cause of the reduced septal blood flow and glucose uptake in LBBB and RV apex pacing. Various observations, such as close correlations among local myocardial oxygen consumption, work, and blood flow, suggest that the lower blood flow is a physiologic adaptation to the lower demand. However, at higher heart rates, the asynchronous contraction pattern may also impede myocardial perfusion.38,63 In patients with RV pacemakers, false-positive findings of perfusion defects may result from this redistribution.64
The nonuniform contraction patterns translate into a lower efficiency of conversion of metabolic energy into mechanical pump function. This was observed in isolated, isovolumically beating hearts,65 as well as in anesthetized open-chest,66,67 closed-chest,59 and conscious dogs.68 Mills et al.59 also showed that efficiency remained low after 4 months of RV pacing. In all these preparations, RV apex pacing reduced mechanical output, whereas myocardial oxygen consumption was unchanged or even increased compared with atrial pacing; thus efficiency decreased by 20% to 30% in these studies. The opposite change was found when ventricular activation in patients with preexisting dyssynchrony caused by LBBB-like activation was improved by biventricular (BiV) or LV pacing alone. In these patients, BiV pacing improved the maximal rate of rise of LV pressure (LV dP/dtmax) without increasing myocardial oxygen consumption, indicating improved efficiency.69 Efficient conversion of metabolic energy to pumping energy is of particular interest in patients with compromised coronary circulation, because higher oxygen consumption over longer periods (as in β-agonist therapy) leads to higher mortality.
Effect of Asynchronous Activation on Systolic and Diastolic Pump Function
Both RV pacing and LBBB reduce systolic and diastolic function. These effects are independent of changes in preload and afterload. This conclusion is based on results from studies using preparations in which preload and afterload were controlled,65 as well as those in which preload- and afterload-independent indices of ventricular function were determined68,70–72 (Figs. 9-10 and 9-11). The negative mechanical effect of dyssynchronous activation has been observed under various loading conditions73 and during exercise.74 Ventricular pacing also causes a deterioration in pump function in patients with coronary artery disease,75 as well as those with already-impaired LV function76 (Fig. 9-12). Impaired regional and global cardiac pump function has been observed in patients and animals with LBBB, even if LBBB was not accompanied by other cardiovascular diseases.53,54 Therefore, it appears that under all circumstances, dyssynchrony is an important, independent determinant of cardiac pump function.
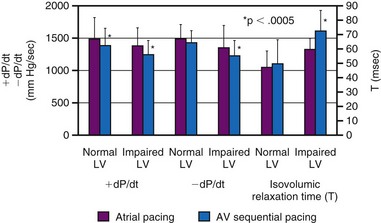
Although LV dP/dtmax is a preload-dependent parameter, it is also sensitive to changes in ventricular activation sequence, as shown both in animal models and in humans34,76–78 (see Fig. 9-12). Thus, LV dP/dtmax appears to be an appropriate marker of dyssynchrony-induced changes in LV global contractile function and its correction by any pacing technique. Additionally, the rate of ventricular relaxation is slower during ventricular pacing, with more pronounced detrimental effect on relaxation, in patients with impaired ventricular function76 (see Fig. 9-12). Isovolumic relaxation parameters, such as LV dP/dtmin and Tau, are strongly influenced by pacing.78–80 Parameters of auxotonic relaxation (rate of segment lengthening or LV volume increase) are also lower during ventricular pacing than during sinus rhythm, but the difference is less pronounced than for the isovolumic relaxation parameters.73,78
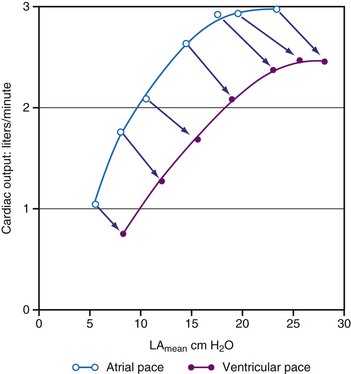
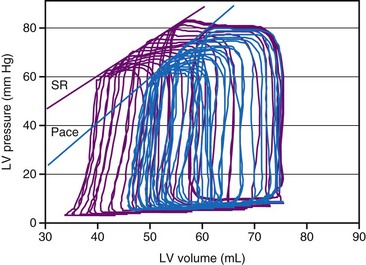
As a consequence of the slower contraction and relaxation, isovolumic contraction and relaxation phases last longer, thus leaving less time for ventricular filling and ejection.53,65,81 Therefore, it is not surprising that cardiac output and systolic arterial and LV pressures are also affected by a dyssynchronous activation. In general, stroke volume is affected more than systolic LV pressure,72,77 presumably because baroreflex regulatory mechanisms partly compensate the decrease in blood pressure. This idea is supported by the finding of higher catecholamine levels82 and greater systemic vascular resistance74 during ventricular pacing. With regard to the changes in stroke volume, it is important to note that ventricular pacing, especially RV apex pacing, can induce mitral regurgitation, as has been demonstrated in animals83,84 and patients.85,86 In addition to reduced stroke volume at unchanged preload, ejection fraction is usually found to be depressed during ventricular pacing74,87 as well as in LBBB.88 Similarly, ventricular pacing can increase pulmonary wedge pressure.74 The negative inotropic effect of ventricular pacing under various loading conditions is clearly illustrated by a rightward shift of the LV function curve, that is, the relationship between cardiac output and mean atrial pressure71 (see Fig. 9-10). Later studies showed a rightward shift of the end-systolic pressure-volume (P-V) relation (see Fig. 9-11), thus suggesting that for each end-systolic pressure, the LV must operate at a larger LV volume.70,72,89
Cause of Reduced Pump Function
An obvious cause of reduced pump function during abnormal electrical activation is the asynchronous contraction of the different parts of the ventricular muscle. Using a mathematical simulation, Suga et al.90 divided the LV wall into two elements with similar contractile properties. Contractility of the whole left ventricle decreased considerably when the asynchrony exceeded 100 msec. This concept is supported by experimental observations in dogs with LBBB. In studies using combinations of pacing sites, minimal intra-LV asynchrony, assessed by endocardial electrical activation mapping, consistently led to the highest LV dP/dtmax.36 In addition to intraventricular asynchrony, interventricular asynchrony may affect ventricular pump function. An extensive overview of studies on RV and LV pacing showed that RV pacing consistently reduces LV function more than LV pacing.91 Even at similar levels of intraventricular asynchrony, LV dP/dtmax is lower during RV pacing than during LV pacing.36 This suggests important roles for interventricular asynchrony and associated interventricular mechanical interaction. This ventricular interaction is also expressed by abnormal septal motion in asynchronous ventricles.52
Also, the pathway of activation may be a determinant of ventricular function. The sequence of activation from apex to base appears to be important. As already mentioned, the ventricular myocardium is activated from apex to base during normal sinus rhythm. Among all LV pacing sites, the LV apex appears to keep LV pump function closest to that seen during atrial pacing.26,59,92–94 The observation that the addition of pacing sites during LV apex pacing does not improve and sometimes even reduces LV function emphasizes the importance of a ventricular activation directed from apex to base.94
An additional cause of the reduction in pump function during asynchronous activation is mitral valve insufficiency.83,85 This diminishes LV pump function directly by reducing the volume ejected into the aorta and indirectly by reducing LV cavity volume. The immediate cause of mitral valve regurgitation during RV apex pacing is papillary muscle desynchronization.95 In addition, papillary muscle tethering forces may be increased,96 and the transmitral pressure gradient may be decreased.97
Electrical and Structural Remodeling
Asynchronous electrical activation not only has acute mechanical consequences, but also influences cardiac structure and function over time. A particular adaptation of the heart to ventricular pacing occurs when the abnormal activation created by pacing is stopped but repolarization remains abnormal, a phenomenon called cardiac memory.98 Several investigators found evidence that, as in the nervous system, short-term cardiac memory (<1 hour) involves changes in ion channels and phosphorylation of target proteins,99 and that long-term cardiac memory (≈3 weeks of pacing) involves altered gene programming and protein expression.98,100 Interestingly, in humans, cardiac memory appears to reach a steady state within 1 week,101 which appears to be quicker than in dogs.98 Costard-Jäckle and Franz102 have demonstrated opposite changes in repolarization in regions remote from and close to a pacing site starting within 1 hour of ventricular pacing.
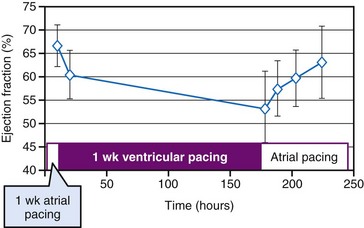
The repolarization abnormalities related to cardiac memory also have a mechanical counterpart. During sinus rhythm immediately after a period of ventricular pacing, relaxation is disturbed.103 Moreover, systolic function deteriorates between 2 hours and 1 week after ventricular pacing has been stopped (Fig. 9-13). After ventricular pacing is stopped for 1 week, it takes  days for ejection fraction to return to its prepacing value.104 It seems likely that changes in the function of an ion channel, such as the L-type calcium channel,99 underlie the reduction in ejection fraction during the first week of ventricular pacing. Therefore, electrical and contractile remodeling appears to occur soon after the onset of asynchronous activation.
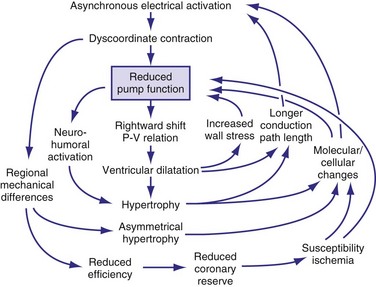
In addition to the long-term effect on cardiac memory, longer-lasting (>1 month) ventricular pacing and LBBB lead to major structural changes, such as ventricular dilatation and asymmetrical hypertrophy.54,70,105 The ventricular dilatation appears related to the LV operating at a larger volume. Global hypertrophy may be induced by this global dilatation, as well as by the greater sympathetic stimulation82 (Fig. 9-14). The asymmetry of hypertrophy appears to be more prominent during LV pacing than during RV pacing and LBBB.54,70,106 However, regardless of pacing site and underlying conduction disturbance, the asymmetry of hypertrophy is characterized by a more pronounced growth of the late-activated myocardium, that is, the same region that shows enhanced contractile performance because of early systolic prestretch. It has been observed in juvenile canine hearts that ventricular pacing leads to fiber disarray,107 which may also be the result of the regionally different and abnormal distribution of mechanical work.31,48,58,59,108
In ventricles undergoing long-term pacing,70 myocyte diameter is increased in late-activated regions, but the number of capillaries per myocyte is unchanged (van Oosterhout and Prinzen, unpublished data). Therefore, the diffusion distance for oxygen increases, potentially leading to compromised oxygenation, which is known to render hypertrophic myocardium susceptible to ischemia. Resynchronization has been shown to result in improved coronary reserve, suggesting that the structural remodeling at the microvascular level may also be reversible.109 An alternative explanation is that CRT could be simply decreasing the oxygen demand in the late-activated regions.
In conditions such as infarction and hypertension, ventricular remodeling appears, at least initially, to be meant to compensate for the loss of function and the increased load, respectively. However, dilatation and hypertrophy do not reduce the asynchronous activation induced by pacing or LBBB; if any, they increase it.54,70 The reasons are the longer path length of impulse conduction (dilatation) and the larger muscle mass to be activated (hypertrophy). Moreover, chronic asynchronous activation also reduces expression of gap-junction channels110 and induces lateralization of these channels.111 Akar et al.112 have related the reduced expression in nonfailing and failing asynchronous hearts to slower impulse conduction, especially in the late-activated regions. Moreover, they showed that action potential duration increases in the late-activated myocardium. These molecular changes may render the myocardium not only more asynchronous, but also more susceptible to arrhythmias.
Even more complicated molecular changes occur in animal models with combined asynchronous activation and heart failure, such as that caused by rapid ventricular pacing. Under these conditions, beta-adrenergic receptors are downregulated,113 as are many ion channels, such as most potassium and calcium channels, whereas other channels display a regional difference in expression, such as the L-type calcium channel.114 Moreover, in both patients with LBBB115 and animal models of dyssynchrony,113 several proteins related to or facilitating the apoptotic process show unique regional distribution, further confirming the hypothesis that abnormal electrical activitation sequence may contribute to remodeling in heart failure patients.
All these processes may lead to a vicious circle in which dilatation and hypertrophy further reduce LV pump function, either directly or by increasing asynchrony of activation (see Fig. 9-14). As is the case after myocardial infarction, initial compensatory hypertrophy may result in heart failure many years later. Clinical evidence for such an important role of asynchronous activation in the development of heart failure is discussed later.
 Physiologic Effects of Heart Rate and Atrioventricular Synchrony
Correction of Bradycardia by Pacing
Cardiac pacing is the only effective treatment for symptomatic bradycardia. Permanent pacemakers have been implanted since the early 1960s to prevent death or syncope caused by ventricular asystole. Although asystole is clearly to be prevented, bradycardia does not always immediately lead to pump failure. This fact can be derived from studies on young patients with congenital AV block. As a compensation for the bradycardia, these patients have enlarged hearts and an increased ejection fraction.116,117 In a 10-year follow-up study, 9 of 149 patients demonstrated dilated cardiomyopathy.117
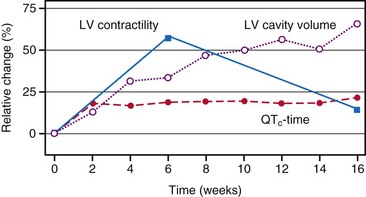
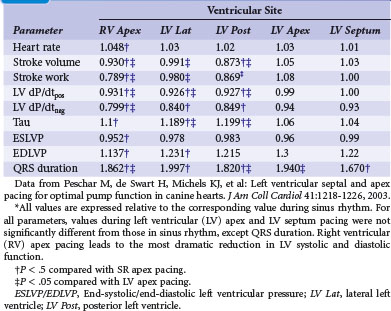
At the onset of acquired complete heart block, cardiac output is smaller than with normal heart rate.118 As a result, compensatory increases in sympathetic tone and end-diastolic ventricular volume occur, leading to higher atrial rates, enhanced ventricular contractility, and augmented stroke volume. Over the short term, the canine heart adapts to bradycardia by increasing diastolic volume and neurohumoral activation, which results in BiV hypertrophy118–120 (Table 9-1). Although these adaptations initially manage to return cardiac output to the level before the onset of AV block, this compensatory effect usually fades after 2 months of heart block. After 4 months, contractility is back to baseline, but LV cavity volume and corrected QT interval (QTc) continue to increase118 (Fig. 9-15); the latter increase is associated with an enhanced susceptibility to arrhythmias.119 If complete AV block persists for more than 4 months, congestive heart failure (CHF) ensues.120 Development of CHF may originate from the ventricular dilatation and hypertrophy initiated early after the start of heart block.
TABLE 9-1 Hemodynamic Effects of Ventricular Pacing in Complete Heart Block (CHB)
| Hemodynamic Parameter | CHB with Slow Ventricular Response | Ventricular Pacing in CHB |
|---|---|---|
| Ventricular rate | ↓ | ↑ |
| Cardiac index | ↓ | ↑ |
| Stroke volume | ↑ | ↓ |
| Sympathetic tone | ↑ | ↓ |
| Ventricular contractility | ↑ | ↓ |
| Systemic vascular resistance | ↑ | ↓ |
| Atrial rate | ↑ | ↓ |
The importance of the duration of overload is confirmed by the observation that the frequency of CHF symptoms in patients with complete heart block correlates with the duration of heart block. CHF has been described during chronic complete heart block even in patients with normal ventricular function. Brockman and Stoney121 reported that in two thirds of their patients with complete heart block and CHF, symptoms were relieved by ventricular pacing alone, and no additional medical therapy was required. Breur et al.122 showed that, in patients with congenital heart block, implantation of a pacemaker resulted in less LV dilatation than in the untreated control group, in which the LV cavity gradually dilated. Similarly, in dogs with AV block, LV dilatation gradually progresses over time (see Fig. 9-15), whereas ventricular pacing readily reverses the LV dilatation and hypertrophy caused by AV block.93 However, longer-lasting ventricular pacing in hearts with AV block may lead to LV dilatation and hypertrophy secondary to the effect of asynchronous activation. Two studies on young adults who received pacing for approximately 10 years showed a high preponderance of CHF and LV dilatation.123,124 These data strongly suggest that in the patient with AV block, the short-term and long-term effects of RV pacing are different. Therefore, the decision whether or not to start pacemaker treatment using RV pacing or the choice of the pacing site should be made carefully (see later).
Early studies suggested that the maximal increase in cardiac output during ventricular pacing at rest occurs at rates between 70 and 90 bpm125–127 (Fig. 9-16). Further rises in rates result in either no additional increase or a decrease in cardiac output accompanied by greater peripheral vascular resistance. In contrast, there is growing evidence that lower heart rates may be particularly beneficial. Indeed, in animal models it appears that bradycardia promotes angiogenesis.128,129 Moreover, Lei et al.130 demonstrated that reducing normal heart rates by 20% to 30% through the continuous infusion of alinidine in a post–myocardial infarction (post-MI) rat model increased basic fibroblast growth factor, its receptor, and expression of related proteins. Bradycardia in this model also increased capillary length density in the border zone of the infarct by 40% and in the remote zone by 14%. Bradycardia also increased arteriolar density in the septum by 62%. These changes translated to a 23% greater coronary reserve, a smaller increase in post-MI left LV volume, and a greater preservation of ejection fraction in the bradycardic animals.
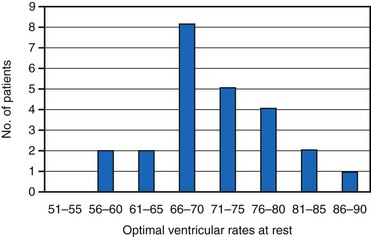
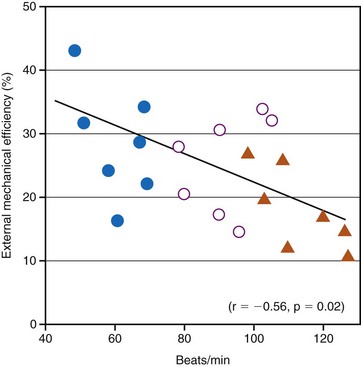
Although the relationship between optimal resting ventricular pacing rate and ventricular dysfunction has not been systematically evaluated, it is likely that different resting ventricular rates are required in patients with systolic and diastolic dysfunction. For example, Ishibashi et al.131 reported that in elderly hypertrophic patients, even 25% increases in heart rate, as induced by atrial pacing, significantly reduced cardiac mechanical efficiency. The investigators went as far as to suggest that coronary perfusion itself in elderly hypertensive hypertrophic patients is negatively affected by an increase in heart rate (Fig. 9-17). They recommended that in the treatment of elderly hypertensive patients, the control of the heart rate in addition to the control of blood pressure might be helpful in minimizing the occurrence of myocardial ischemia and might slow down the subsequent progression to heart failure. Since then, their recommended treatment has become common practice with the use of β-blocker therapy to prevent MI and heart failure.
The importance of increasing heart rate to augment cardiac output with exercise has been clearly documented in several studies.132–134 Because the improvement in exercise performance is caused predominantly by an increase in heart rate, it is expected that favorable hemodynamic results will be obtained by rate-adaptive systems. Consequently, the modern approach to the management of complete symptomatic heart block involves the use of pacemaker units that provide not only basic ventricular pacing support, but also adaptation of the pacing rate to physiologic needs.
A major concern, especially in compromised hearts, is that heart rate should not increase too much, because shortened diastolic filling time, reduced LV compliance at higher rates of ventricular pacing, and increased systemic vascular resistance may limit cardiac output.116,126 Rowe et al.135 found other reasons not to increase pacing rate too greatly. They examined cardiac output and coronary blood flow at low (47 bpm), intermediate (77 bpm), and high (117 bpm) ventricular pacing rates in patients with complete heart block. Cardiac output rose with an increase from low to intermediate pacing but diminished at the high rate. However, coronary blood flow and cardiac oxygen consumption rose progressively with increasing heart rates, thus indicating lower pumping efficiency at the high rate.
Optimal Atrioventricular Interval
Importance of Atrioventricular Synchronization
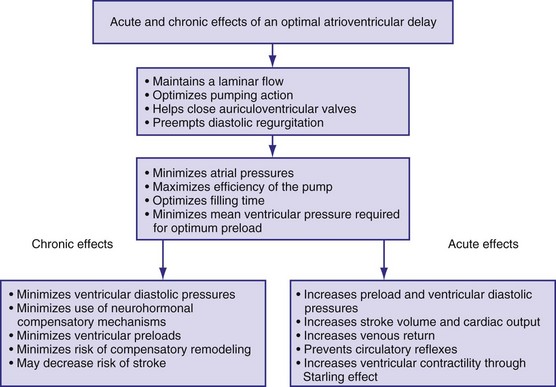
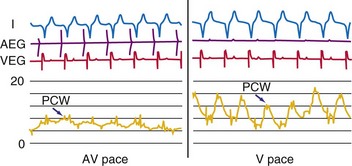
Basically, the role of the atrial contraction is to help maintain a laminar flow of blood from the venous system to the ventricles; this role is tightly integrated with the movement of the ventricles to create a smooth motion of blood across the system. To perform its role, the atrium changes its function from that of a conduit during early filling to that of a booster pump during atrial systole, to that of a reservoir during ventricular systole. These changes are closely related to longitudinal displacement of the anulus of the mitral and tricuspid valves along the long axis of the heart. Indeed, the anulus is displaced toward the apex of the ventricles during systole and toward the atria during diastole, thus significantly contributing to the smooth movement of blood from the atria to the ventricles. This displacement keeps the overall volume of the heart almost constant during systole and diastole.136
In the early years of pacing, the electrical stimulus was selectively applied to the ventricle (ventricular single-chamber pacing, or V pacing). With V pacing, the contraction of atria and ventricles is uncoupled, leading to an atrial contribution to LV filling that varies from beat to beat. This also results in large beat-to-beat variations in stroke volume, systolic pressure, and other hemodynamic variables.137 The introduction of sequential AV pacing resulted in more regular heart beats and improved hemodynamics in both animals78,138,139 and patients.140 With advances in pacemaker technology, appreciation of the importance of maintaining AV synchrony has improved, and programming of optimal AV intervals in patients with dual-chamber pacemakers is of great importance.141
Figure 9-18 summarizes the main consequences of an optimal AV timing. Because filling time is limited, especially at high heart rates, the atrial contribution to stroke volume is more prominent at high than at low heart rates.142
Patients with Normal Left Ventricular Function
The AV interval that maximizes resting cardiac output during dual-chamber pacing varies widely among patients, usually reported as 125 to 200 msec. In patients with pacemakers, cardiac output increased by 4% to 20% when the AV interval was lengthened from 0 to between 100 and 130 msec.140,143–145
Optimal AV interval can be determined in most patients during dual-chamber pacing by means of various invasive and noninvasive measurements. Most often, optimal AV interval is assessed by LV outflow recording with Doppler echocardiography (Fig. 9-19). Doppler-derived cardiac outputs at varying AV intervals can be used to fine-tune the AV interval. In patients with preserved ventricular function, this method is highly reliable, is sensitive to small output changes, and has a low interobserver variability. The optimal AV interval determined with Doppler echocardiography correlates well with the optimal AV interval determined with radionuclide ventriculography. Factors that may influence the optimal AV interval in different patients are summarized in Table 9-2. In addition to interpatient variability, other factors may influence determination of optimal AV interval in the same patient, such as heart rate, paced or sensed atrial event, posture, and drugs.146–150 Moreover, in a specific patient’s lifetime, there may be situations in which the optimal AV interval is different from the AV interval considered to be physiologic. For example, AV sequential pacing for complete heart block complicating an acute MI or after cardiac surgery yields optimal hemodynamics at AV intervals in the range of 80 to 120 msec. This may be related to a surge of intrinsic catecholamine levels or to administered inotropic drugs and reduced LV compliance in these acutely stressful situations.
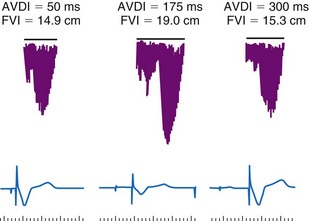
TABLE 9-2 Possible Factors Influencing Optimal Atrioventricular Intervals
| Type | Variables |
|---|---|
| Interpatient |
The programmed AV interval regulates the timing of right atrial (RA) and RV conduction, which in a normal heart without significant atrial electrical disease usually coincides with that of left atrial (LA) and LV conduction. From a hemodynamic point of view, LA and LV conduction is most important, followed by the left-sided AV interval. The physiologic left-sided AV interval depends on several parameters, including the programmed AV interval, latency in atrial capture and sensing, interatrial conduction time, latency in ventricular capture, and interventricular conduction time.151 Because of the complex relationship among these intervals (see Fig. 9-19), significantly different right-sided and left-sided AV intervals in the same patient and in different patients can be recorded. Among these times, the one that most influences the optimal left-sided AV interval is the interatrial conduction time, measured as the time from the atrial pacing spike to the atrial depolarization on the esophageal electrogram or to the A wave on Doppler echocardiography. Patients with near-normal interatrial conduction time (≤90 msec) derive the greatest hemodynamic benefit from programmable AV intervals of about 150 msec; in contrast, in those patients presenting with prolonged interatrial conduction time, the AV interval should be set at 200 msec or longer to maximize cardiac output. Of particular note, programming a short AV interval in patients with prolonged interatrial conduction delay may result in depolarization of the LA after LV mechanical activation. This may produce hemodynamic values equivalent to or worse than those seen in patients with VVI pacing alone. Pacemaker syndrome may also occur under these circumstances.
Latency in atrial capture and sensing may lead to different optimal AV intervals for sensed P waves and paced P waves (Fig. 9-20). The magnitude of atrial capture and sensing latencies varies among patients and may be affected by the lead and pacemaker circuitry characteristics, electrode position, tissue interface, amplitude and rate of stimulation, P-wave morphology, myocardial disease, electrolytes and other metabolic factors, and drugs. The optimal AV interval for a sensed P wave is about 30 to 40 msec shorter than the optimal AV interval for a paced P wave followed by a paced QRS at a similar heart rate (Fig. 9-21). However, differences between optimal AV intervals for a paced P wave and a sensed P wave may be as great as 100 msec in some individuals. New dual-chamber pacemakers incorporate programmable features designed to adjust the AV interval automatically in response to paced versus sensed P waves and in response to the atrial rate. It is important to recognize that the physiologic AV interval is never equivalent to the programmed AV interval for either a paced or a sensed atrial event. The physiologic PQ interval begins with the onset of the P wave; however, with a sensed P wave, the programmed AV interval begins when the native P wave is sensed (so with a delay compared with onset of atrial activation), and with a paced P wave, the programmed AV interval begins with the atrial pacing spike, which is followed by further atrial depolarization.
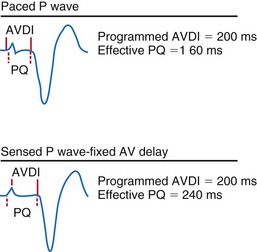
Figure 9-20 Programmed atrioventricular delay interval (AVDI) and effect of PQ interval.
(From Janosik DL, Pearson AC, Buckingham TA, et al: The hemodynamic benefit of differential atrioventricular delay intervals for sensed and paced atrial events during physiologic pacing. J Am Coll Cardiol 14:499, 1989. Reprinted with permission of the American College of Cardiology.)
The importance of variation in AV interval during exercise in patients given physiologic pacing who have normal ventricular function is still controversial. Because the major determinant of augmentation of cardiac output during exercise is heart rate, the contribution of atrial systole and relative timing of the atrial and ventricular contraction may diminish in significance. Studies analyzing the effects of variation in AV interval during exercise have yielded conflicting results.152–156 There are two major limitations to these studies: the relatively small sample size of most and the use of a fixed AV interval during each exercise test, but a different AV interval between exercise efforts. There is evidence that a rate-adaptive AV interval, which is automatically decremented in response to an increased atrial rate, is beneficial to cardiopulmonary performance during exercise.157 In patients with chronotropic incompetence and high-level AV block, Sulke et al.158 performed randomized double-blind crossover assessments of rate-adaptive and different fixed AV interval settings during 2 weeks of normal activity and performance on an exercise treadmill in patients undergoing DDDR pacing. There was a subjective improvement in quality of life with rate-adaptive AV intervals compared with fixed AV intervals, and patients preferred the rate-adaptive settings (Fig. 9-22). Notably, the longest AV interval (250 msec) was least preferred and was associated with the highest symptom prevalence. Moreover, exercise duration was not significantly different in any setting in DDDR mode but was significantly reduced in DDD mode.158
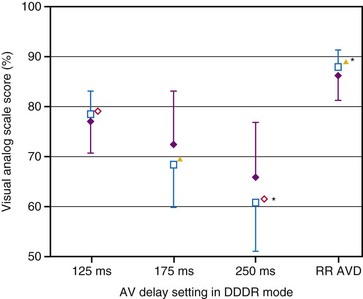
 ) and patient’s perception of general well-being (
 ) during everyday activity at fixed AV delay settings of 125, 175, and 250 msec and rate-responsive AV delay (RR AVD) settings in DDDR mode.
  , P < .05;
  m, P < .03; *, P < .01.
Patients with Depressed Left Ventricular Function
In general, relaxation is slower in failing hearts than in normal hearts. Consequently, less blood enters the ventricles during the rapid filling phase, as can be observed from lower E waves on Doppler echocardiograms. Therefore, failing hearts are more dependent on properly timed atrial contraction than normal hearts. This has been demonstrated in comparisons of patients with decompensated heart failure and compensated nonvalvular heart disease.125 This knowledge clarifies why optimal timing of atrial and ventricular stimulation in patients with pacemakers is of special interest in patients with heart failure. Some investigators have shown that pacemakers can actually improve the coupling between atria and ventricles over that without pacing. This issue applies to patients with excessively long PQ times. In two studies of subjects with these findings, hemodynamic benefit was achieved with AV sequential pacing at a physiologic AV interval159,160 (Fig. 9-23). Reducing the prolonged AV interval increased diastolic filling time and reduced diastolic mitral regurgitation (Fig. 9-24). These beneficial effects are striking, because these studies were performed before the era of resynchronization, and the RV apex was used as a ventricular pacing site, presumably the least preferable site from a hemodynamic point of view (see later).
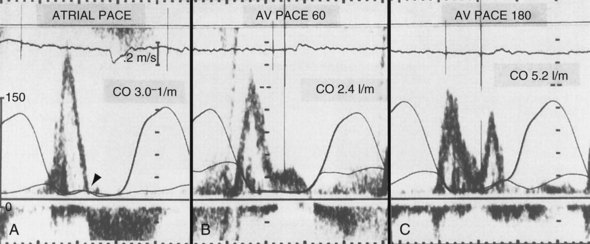
The actual role of the atrial contraction in patients with dilated ventricles and low ejection fraction varies among individuals. The booster pump action of the LA is noticeable as a “shoulder” in the LV pressure tracing, and the LV does not start contracting immediately after atrial contraction (Fig. 9-25). If this plateau lasts too long, diastolic mitral regurgitation could occur. About 20% of the patients in heart failure studies for whom complete hemodynamic data are available show this type of diastolic LV pressure waveform.161–163 Figure 9-25 shows that using an optimized AV interval, in this case with BiV pacing, results in coincidence of the peak of the booster action of the atrial contraction and LV pressure development. Auricchio et al.164 demonstrated that the maximum improvement in aortic pulse pressure, independent of the site being paced, occurs when this coincidence is achieved.
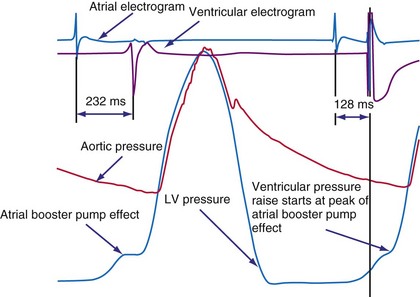
Figure 9-25 The atrial electrogram, right ventricular electrogram, left ventricular (LV) pressure, and aortic pressure tracings of a patient with New York Heart Association (NYHA) Class III heart failure from the Pacing Therapies for Congestive Heart Failure (PATH-CHF-II) trial.149 Note the effect of programming an AV interval of 128 msec in the biventricular device. With this AV interval, the ventricular pressure starts right at the peak of the pressure increase created by the booster action of the left atrium. This AV interval provides the maximum preload at the minimal mean LV diastolic pressure while maximizing the time available for diastole, thus enabling higher heart rate increases without compromising filling time.
Examination and calculation of cardiac output with Doppler echocardiography, as frequently performed in patients with dual-chamber pacemakers, is more problematic in patients with depressed ejection fraction in whom the value of the effect of pacing may be near the rate of uncertainty in the method.165 Thus, the number of repetitions required to obtain a clinically meaningful and reproducible approximation of the optimal AV interval makes this method, as single assessment, almost impractical for patients with depressed ejection fraction. The most utilized echocardiographic parameters for optimizing AV interval in patients with heart failure include echocardiography-based inflow or preload evaluations (e.g., velocity-time integral of transmitral flow or EA duration)166 and measures of systolic function using time-velocity integral at the LV outflow tract.167,168 Comparison of these different methods with invasive LV dP/dtmax to optimize AV interval in patients with CRT showed that mitral inflow velocity-time integral proved most accurate. The formerly used Ritter method, based on calculating the optimal AV timing by analyzing filling patterns obtained during only two AV intervals, has been found to be accurate to optimize AV interval in CRT patients.169 Indeed, this method was created for patients with high-degree block, and some caution is advised in patients with intact AV conduction.170 In these patients the electromechanical delay is not constant and varies as a function of the extent of collision between the intrinsically conducted depolarization wavefront and the wavefront generated by the artificial pacing spike. Therefore, in patients with an intact conduction system, the extent of collision between these two wavefronts will be different at the long and short AV delay intervals tested in the Ritter method, making the assumption required by the method completely invalid—that is, the electromechanical delay is unchanged at any tested AV delay.
Role of Ventricular Synchrony
Abnormal asynchronous activation causes abnormal contraction patterns, inefficient and depressed pump function, and ventricular remodeling. Wiggers30 recognized the importance of normal electrical activation of the ventricle for optimal pump function in 1925 (Fig. 9-26). However, it took about 70 years for the concept to gain broad interest. Two teams of investigators regarded the abnormal activation as being of little importance, because AV sequential pacing allowed for significantly better cardiac pump function than V pacing.137,138 Nevertheless, one group showed better pump function during LV apex pacing than during pacing at RV sites.138 In the 1960s, Kosowsky et al.139 compared RV apex pacing with His bundle pacing, the latter maintaining the normal activation but allowing variation of the AV interval. They concluded that AV synchrony and proper sequence of activation are equally important, as confirmed by later animal and human studies.76,77,144
Clinical Consequences of Asynchronous Activation
The combination of acute adverse hemodynamic effects and long-term ventricular remodeling (see Fig. 9-14) may explain why abnormal electrical activation and asynchronous electrical activation have major implications for a patient’s clinical status. Studies have shown that morbidity and mortality are higher in patients with long-term RV apex pacing than with atrial pacing.145,171–173 In patients with sinus node disease and good ventricular function, the risk of heart failure was significantly high after more than 7 years in a comparison of atrial pacing and RV pacing.173 In a similar population the risk of hospitalization for heart failure within 3 years increased with percentage of time patients underwent pacing at the RV apex.174 Interestingly, development of heart failure and atrial fibrillation was more sensitive to percentage of pacing than to pacing mode (single- or dual-chamber pacing). In patients who received an ICD, the incidence of heart failure was higher within a year in those with pacing at VVI 70 bpm rather than in the backup mode.175
Although pacing and, even more, heart failure started at a later age in the previous studies, RV pacing in children can also induce impaired pump function. Tantengco et al.123 observed such adverse effects after approximately 10 years of pacing. The dramatic effects of ventricular pacing in otherwise healthy myocardium may be explained by the pronounced structural changes in juvenile hearts.107,176 The deleterious effect of ventricular pacing is relatively easy to discover when start of pacing is exactly known, although spontaneous evolution in a dilated cardiomyopathy cannot be excluded. Whether adverse effects of asynchronous activation are also applicable to LBBB has been less clear, because LBBB is a silent event that is often accompanied by considerable comorbidity.177–179
Longitudinal studies determining cardiovascular mortality and morbidity show that the presence of LBBB always carries a poor prognosis. In a 29-year follow-up study of 3983 pilots, the morbidity and cardiovascular mortality rate among those showing signs of LBBB was 17.2%, and the most common clinical event observed was sudden death without any previous symptoms (17%). These percentages are 10 times higher than those in subjects without LBBB.180 In the Framingham Study, cumulative cardiovascular mortality over 10 years was approximately five times higher in patients with LBBB than in those without LBBB.181 In a population of 110,000, the risk for development of cardiovascular diseases was 21% in the 112 patients with LBBB, compared with 11% in age- and gender-matched controls. Moreover, cardiac mortality was strongly increased in the patients with LBBB.
The first direct evidence for an effect of LBBB on pump function came from studies in patients with intermittent LBBB.182,183 Further proof of the negative effect of LBBB on hemodynamics has come from later studies in an animal model of LBBB, created by ablation of the proximal part of the LBB.54,184,185 After ablation, duration of the QRS complex, asynchrony of RV-LV contraction, and asynchrony of electrical activation within the LV all increase significantly; also, relative to normal conduction values in the same species, these increases are similar in degree to the increases seen in patients with LBBB.24,186 This finding suggests that, although the LBBB in patients may not be caused exclusively by proximal lesions, this model closely resembles the LBBB in patients. All studies on this animal model of LBBB show that LBBB reduces systolic and diastolic LV function and induces paradoxical septal wall motion.54,184,185
Strategies to Maintain Ventricular Synchrony
Atrial Pacing
Atrial pacing maintains normal ventricular activation, although limited to patients with intact AV nodal conduction. In a comparison of atrial pacing with RV apex pacing in patients with sinus node disease (e.g., VVI vs. AAI), Andersen et al.173 reported less development of all-cause mortality and cardiovascular death, better maintenance of ventricular function and perfusion,187 absence of atrial dilatation,188 and a lower incidence of atrial fibrillation.173,189 Although earlier studies compared atrial pacing with single-chamber pacing, later studies in patients with sick sinus syndrome showed a similar disadvantage of ventricular pacing in the dual-chamber mode compared with atrial pacing. Because the risk of AV block in this patient category (0.6%-1.7%/yr)190,191 is considerably lower than that for development of heart failure (as high as 12%),174 atrial pacing is an immediately applicable, easy, and effective way to avoid abnormal ventricular activation.
Alternative-Site Ventricular Pacing
Patients with disturbed AV conduction are pacemaker dependent and require ventricular pacing. His bundle pacing is the way to maintain physiologic ventricular impulse conduction. Animal studies showed that QRS duration was shorter with pacing in the high ventricular septum than with RV apex pacing.77,176,192 In the 1960s, Scherlag’s group showed that His bundle pacing results in the same QRS duration and pressure development as sinus rhythm and atrial pacing and in better hemodynamics than RV apex pacing.139,193 In 2000, Deshmukh et al.194 first reported successful His bundle pacing in patients on a permanent basis. Using improved implant tools, Zanon et al.195 showed that His bundle pacing preserves normal distribution of myocardial blood flow and mechanics.
Nevertheless, because of the relatively difficult positioning of the pacing lead into the His bundle, pacing in the vicinity of His bundle is more often used. The literature refers to this position as “high RV septal” or “RV outflow tract” (RVOT), but in some studies, “RVOT” appears to imply pacing at the high RV free wall. Pacing in this region leads to abnormal QRS configuration compared with atrial pacing. Comparative studies of the acute hemodynamic effects of high septal pacing and RV apex pacing showed a moderate beneficial effect of septal pacing on LV pump function, although several studies found no significant difference between high septal and RV apex pacing.196 Combined RV apex and RVOT pacing in patients resulted in shorter QRS duration than RVOT pacing alone but did not lead to further improvement of cardiac output.197
Longer-term studies appear to show a more consistent beneficial effect of high septal pacing. Tse et al.198 randomly assigned 24 patients to either RV apex or high septal pacing. After 18 months of pacing, perfusion defects and regional wall motion abnormalities were less common and ejection fractions were higher in the high septal pacing group. The reports explicitly mentioned that the “RVOT” lead was positioned in the interventricular septum. Unfortunately, however, the exact best site at the RV septum is not well known. One animal study showed that the RV site for best hemodynamic function differs for individual hearts.94 Also, RV midseptal pacing performed similar to RV apical pacing.59
In contrast, single-site LV pacing often results in better cardiac pump function than RV pacing.91,199 Turner et al.200 showed that LV pacing may also lead to more synchronous activation if pacing is performed at longer AV intervals during maintained AV conduction in patients with a relatively narrow QRS complex. Because electrical asynchrony and mechanical asynchrony within the LV wall are similar in RV pacing and LV pacing201 (Fig. 9-27), the less detrimental hemodynamic effect of LV pacing may be explained by better interventricular coupling. This mechanism may also partially account for the beneficial hemodynamic effects of LV pacing in patients with heart failure and AV node ablation.202 In these patients, no fusion can occur between the impulse wavefronts from endogenous conduction and LV stimulation. However, long-term comparative data in some subgroups of patients are still missing, so no definitive conclusions can be drawn.
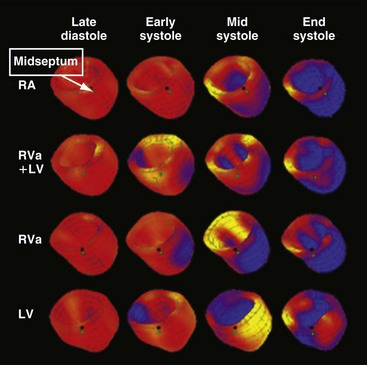
Figure 9-27 Three-dimensional reconstruction of left ventricular wall with myocardial strain represented in color.
(Modified from Wyman BT, Hunter WC, Prinzen FW, et al: Effects of single- and biventricular pacing on temporal and spatial dynamics of ventricular contraction. Am J Physiol 282:H372-H379, 2002.)
Animal studies have shown that within the left ventricle, the septum and apex may be ideal pacing sites; pacing in these sites was associated with LV pump function close to that during normal sinus rhythm, even with pacing at short AV intervals94,203 (Table 9-3). Studies in children now support the superior performance of LV apex pacing over RV pacing with respect to hemodynamic function93 and echocardiographic indices of dyssynchrony204 and reverse remodeling.205 LV septal pacing is not yet clinically feasible, because positioning a lead in the LV cavity carries a risk of embolization and stroke.206 In an animal study, Mills et al.59 advanced a lead from the right ventricle through the interventricular septum to reach the LV septal endocardium. Even after 4 months of pacing, LV septal pacing provided cardiac pump function and efficiency similar to that during natural conduction.
The degree of asynchrony induced by single-site ventricular pacing can be reduced by pacing at two or more sites simultaneously, preferably opposite to each other. This “multisite” pacing, however, reduces QRS duration by no more than 20% compared with single-site pacing.50 Animal studies showed that BiV pacing does lead to better LV pump function than RV pacing.50,94,207 Also, in patients with atrial fibrillation and AV node ablation, hemodynamic performance was better during BiV pacing than during single-site LV or RV pacing.208
It is important to note that in patients with normal ventricular conduction, such novel pacing sites (LV apex, RVOT, His bundle, multisite) at best prevented a reduction of pump function compared with atrial pacing or sinus rhythm, but never improved pump function. Also, left intraventricular mechanical asynchrony is only partially normalized, even with BiV pacing.209 Multisite pacing cannot outmatch the quick impulse conduction and its extensive spread through the network of Purkinje fibers. Therefore, avoiding any ventricular pacing would be preferable in hearts with normal ventricular conduction.
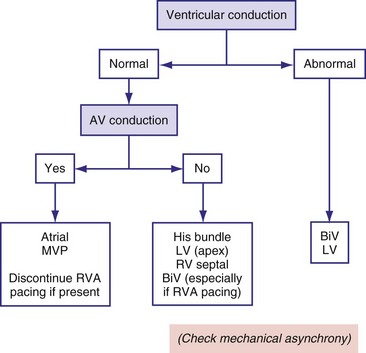
Minimizing Ventricular Pacing
One approach to avoiding any type of ventricular pacing has been to program fixed, long AV intervals; however, this approach resulted in occasional retrograde AV conduction and higher risk of arrhythmias in one third of a select population.210 For many years, some pacemakers have incorporated an algorithm based on the programming of two AV delays: a short, physiologic AV delay and a longer AV delay. These devices start pacing with the longer AV delay and continue at this setting if they find intrinsically conducted ventricular beats. If the intrinsic conduction is not present or fails to occur, the devices automatically switch to the shorter and more physiologic AV delay. When functioning at the shorter AV delay, these devices periodically extend the AV delay to test for intrinsic conduction at programmable intervals. This type of algorithm is called AV search hysteresis.211
Rather than prolonging the AV delay, an algorithm called managed ventricular pacing (MVP) has been implemented in two studies.212,213 With this algorithm, when intrinsic activity is present, only the atrium is paced; the ventricle is monitored on a beat-to-beat basis to verify intact AV conduction. Only in cases of transient and persistent loss of AV conduction does the MVP algorithm pacemaker switch to the DDDR mode. The mode intermittently tests for return of normal AV conduction. During atrial fibrillation, the device operates in the DDIR mode. With this approach, the cumulative percentage of ventricular pacing was reduced from a mean of 74% to 4%, with 80% of the patients being paced on the ventricle for less than 1% of the time. In a study with 1065 patients, MVP reduced the risk of developing persistent atrial fibrillation from 12.7% to 7.9% over a mean follow-up of 1.7 years.214
Because many patients undergo pacing for sinus node disease, algorithms such as AV search hysteresis and MVP are promising for maintenance of ventricular synchrony in patients with predominantly intact AV and intraventricular conduction (Fig. 9-28). However, a recent study indicates that conservative programming of lower rate and rate response is advisable to minimize risk of AV decoupling and uncoupling as well as ventriculoatrial (VA) coupling.215
 Strategies to Restore Synchrony: Cardiac Resynchronization Therapy
Biventricular pacing devices, first implanted in March 1993,216 were approved by the U.S. Food and Drug Administration (FDA) in 2001. The beneficial hemodynamic effects of BiV pacing during that small-scale study have been reproduced many times.161,217–220 The consistency of the results of small but prospective randomized trials, such as Pacing Therapies for Congestive Heart Failure (PATH-CHF),161,162 Multisite Stimulation in Cardiomyopathy (MUSTIC),221 Cardiac Resynchronisation in Heart Failure (CARE-HF),222 and Multicenter InSync Randomized Chronic Evaluation (MIRACLE),223 have removed any doubt about the feasibility and clinical efficacy of CRT in highly symptomatic patients with heart failure. Large, multicenter, randomized controlled clinical trials (RCTs) have consistently demonstrated significant reductions in mortality and hospitalization rates with CRT in patients who had moderate to advanced heart failure despite optimal pharmacologic therapy and who presented with ventricular conduction delay, sinus rhythm, and depressed LV ejection fraction.222
Physiology of Cardiac Resynchronization Therapy
With the introduction of CRT, the use of cardiac pacemakers has been transformed from “just” artificial maintenance of the heart rhythm to restoration of pump function. Although the primary objective of BiV pacing may be to reduce intra-LV asynchrony, it can also be used to establish optimal interventricular coupling as well as AV coupling. The latter especially applies to left-sided AV coupling, because in LBBB the atrio-LV delay is usually prolonged. Parsai et al.224 showed that patients respond to CRT if at least one of the mechanisms of CRT is active.224
The predominant intraventricular conduction abnormality in about one third of patients with heart failure is LBBB, where activation spreads from the RBB to the RV wall and, after transseptal conduction, within the LV from the septum to the LV lateral wall (Fig. 9-29). Thus, pacing at the LV lateral wall is used to create an activation wavefront, which moves in the opposite direction from a spontaneously occurring activation wavefront.16,26,201 Consequently, during BiV pacing, two activation wavefronts are generated and merge approximately in the middle.36,209 A similar effect is obtained by single-site LV pacing using an AV interval that allows merging of the intrinsic activation originating from the RBB with the wavefront derived from the LV pacing lead. This merging wavefront leads to less electrical asynchrony in comparison with LBBB.36 Because of the tight E-C coupling in the heart, CRT also improves coordination of contractions between the cardiac chambers and within the LV wall, as shown with different imaging techniques55,225 (see Fig. 9-27). More specifically, CRT uniformly prolongs the time to maximum contraction55 and thus restores a more coordinated contraction pattern, resulting in a more homogeneous distribution of regional loading conditions.56
The improved synchrony leads to improvement of cardiac pump function, as determined by LV dP/dtmax, pulse pressure, cardiac output, and ejection fraction.* Such improved systolic pump function is achieved at unchanged or even lower filling pressures, denoting a true improvement of ventricular contractility through better coordination of contraction. Moreover, Nelson et al.69 showed that better coordination of contraction improves mechanical pump function while slightly decreasing myocardial energy consumption, suggesting that CRT improves the efficiency of the cardiac pump. Further improvement in pump function may be mediated by a reduction in mitral regurgitation225 and prolongation of diastolic filling time. These beneficial effects occur almost immediately after the start of resynchronization.36,161
Another possible mechanism for the improvement in LV pump function by BiV and LV pacing is that it improves ventricular interaction and relieves external constraint,228,229 a mechanism that could work even in patients with a narrow QRS complex.229 The idea is that early LV contraction also allows early LV filling. In hearts with high central venous pressures, where presumably the RV occupies much of the pericardial space, the early LV activation may allow the LV to fill first, and thereby better, thus recruiting more of its Frank-Starling mechanism.228
A variety of cardiac and extracardiac processes triggered by CRT are responsible for its long-term beneficial effect. First, the improved pump function reduces neurohumoral activation, an effect evidenced by an increase in heart rate variability and a reduction in plasma brain natriuretic peptide (BNP) levels.230 Furthermore, the improved contractility and pump efficiency at a smaller end-diastolic volume reduce mechanical ventricular stretch. This latter reduction and the probably associated reduction in neurohumoral activation may well explain the beneficial reverse-remodeling effect of CRT.225,231 As elegantly demonstrated by Yu et al.,225 such reverse remodeling points to structural improvement in the myocardium. These investigators showed the increasing reverse-remodeling effect of resynchronization over time by measuring the time course of LV cavity volume and LV dP/dtmax during the first 3 months after the start of CRT and 1 month after CRT was temporarily stopped, when some beneficial effect of CRT was still noticeable, indicating tissue adaptation (Fig. 9-30).
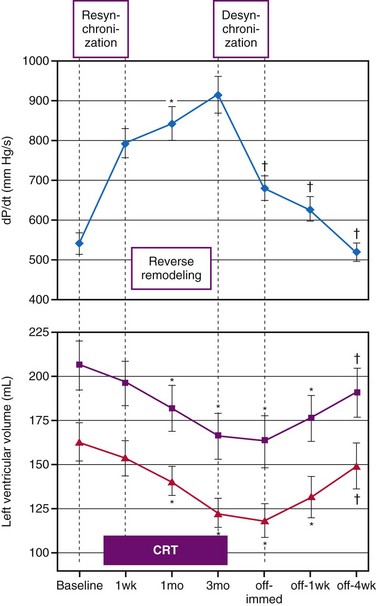
Figure 9-30 Acute hemodynamic and long-term reverse-remodeling effects of cardiac resynchronization therapy (CRT).
(Modified from Yu CM, Chau E, Sanderson JE, et al: Tissue Doppler echocardiographic evidence of reverse remodeling and improved synchronicity by simultaneously delaying regional contraction after biventricular pacing therapy in heart failure. Circulation 105:438-445, 2002.)
Study in canine LBBB hearts showed that isolated LBBB induces LV dilatation as well as hypertrophy and that these derangements are almost completely reversed by BiV pacing.54,57 Interestingly, BiV pacing reversed the hypertrophy in the LV wall, especially in the late-activated LV lateral wall.57 This reduction in hypertrophy is important because hypertrophy gives rise to various molecular changes,232 resulting in greater risk for contractile failure and arrhythmias. Indeed, in dogs with LBBB, where heart failure was induced by 6 weeks of rapid atrial pacing, calcium homeostasis was affected most in the LV lateral wall.114 Notably, both hemodynamic improvement36,185 and reverse remodeling57 have been observed to a similar extent in dogs with LBBB (with and without heart failure) and in patients with primary and secondary dilated cardiomyopathies. Although CRT was originally indicated for patients with severe heart failure (NYHA Class III and IV), several studies demonstrated that CRT can also induce reverse remodeling in patients with only mild heart failure or impairment of LV function.233,234 These data indicate that resynchronization cures “dyssynchronopathy” independent of the severity of heart failure.
Most CRT studies focus on the left ventricle, but a few indicate that RV function may also be improved by better synchronization of the electrical activation. This would especially apply to right bundle branch block (RBBB). Three-dimensional electroanatomic mapping data have provided the rationale for implementing CRT in these patients.235 However, rather than focusing on LV-based pacing, resynchronization of RBBB requires RV pacing. This also applies to children with repaired congenital defects such as tetralogy of Fallot, who present with right-sided heart failure.236,237
Determination of Mechanical Asynchrony
The primary goal of CRT is to restore atrioventricular, interventricular, and intraventricular synchrony. Because QRS duration is a poor predictor of the response to CRT,225,238,239 mechanical asynchrony was thought to be a better index for selection of CRT patients. Although studies have reported that measurement of mechanical asynchrony is a better predictor of the response to CRT than duration of the QRS complex, most were small and observational.
Interventricular asynchrony can be determined from the time difference between pulmonary and aortic valve openings with conventional echocardiography186 or from the time to peak velocity in the RV and LV walls on tissue Doppler imaging (TDI). Other approaches are determination of the phase difference of RV and LV wall motion using nuclear imaging53 and use of the time or phase difference with increased RV and LV pressures.184,240 For practical reasons, the echocardiographic approach is most often used.
Intraventricular asynchrony usually requires more sophisticated equipment. The most detailed mechanical activation maps have been obtained through mapping of myocardial shortening (strain) patterns with magnetic resonance imaging (MRI) tagging48,201,209,241 (see Fig. 9-8). These studies have shown that the pattern of deformation gradually changes with increasing distance from the site of earliest activation (asterisk in Fig. 9-8). With the less expensive noninvasive method of M-mode echocardiography, the timing difference of maximal inward motion at the septum and posterior wall, or the septal-posterior wall motion delay (SPWMD),238 can be calculated. The disadvantages of this simple technique are that peaks of septal wall motion may not be precisely defined, and M-mode sections perpendicular to the septum may be difficult to acquire.
With color TDI and with pulsed-wave TDI, the time to peak systolic velocity can be measured in different regions of the myocardium.225,242,243 Local contraction can be derived only through subtraction of velocities in nearby regions. Such analysis on digitally stored color-coded tissue Doppler images yields myocardial strain and strain rate.97 Such information is equivalent to that obtained with MRI tagging, but with the great advantage that TDI can also be employed in the presence of a pacemaker. Strain measurements differentiate better than TDI between active systolic contraction and passive displacement. Likewise, Breithardt et al.97 demonstrated more consistent behavior of strain than of velocity signals. However, image acquisition and analysis are time-consuming and operator dependent, and subtraction of two strain rate signals can create inaccuracies. Therefore, the clinical applicability of strain-rate imaging is limited.
Nevertheless, speckle-tracking measurements have provided promising results. Mechanical dyssynchrony determined by this technique appeared to predict the response to CRT better than TDI,244 at least partly because strain measurement by speckle tracking is independent of the angle between ultrasound beam and the ventricular wall. TDI measures the velocity of displacement of the myocardial segments relative to the ultrasound transducer and in the direction of the ultrasound beam. Likewise, the longitudinal velocity, as usually determined in basal regions, is the sum of all velocities developed in all regions between the transducer and a particular area. Analysis of strain signals may also be less difficult to interpret than the frequently multiphasic velocity signals.245 TDI mechanical asynchrony is also observed in a considerable number of healthy volunteers.
Mechanical Asynchrony or Discoordination?
With mechanical asynchrony the focus over the last decade, the results of two randomized multicenter studies were unexpected. The PROSPECT and RethinQ studies showed poor predictive value for mechanical asynchrony as an index of CRT response in patients with wide and narrow QRS complex.246,247 These disappointing results can be explained only partly by technical limitations of the TDI technique. Even when using the “gold standard” technique in cardiac deformation measurements, MRI tagging, determination of mechanical asynchrony (i.e., timing difference in onset or peak shortening) did not predict CRT response.248,249
A better approach for achieving a mechanical predictor of CRT response may be to analyze discoordination of contraction. Whereas measurement of asynchrony requires determining the onset or peak of shortening in a certain region, discoordination is assessed by analyzing the strain curves over a large period of the cardiac cycle (e.g., systole or diastole). Reported indices include the CURE index,245 internal stretch fraction (ISF),249 and septal rebound stretch (SRS)55 (Fig. 9-31). All three parameters provided a good prediction of CRT response, and better than using mechanical asynchrony measures in two studies.55,249
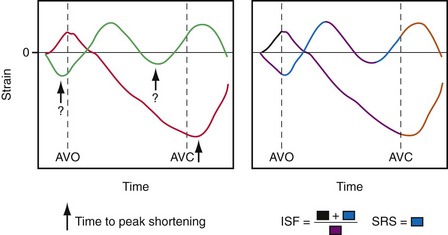
The Site of Pacing
From a theoretical point of view, the “optimal” sites of pacing are those that establish the greatest reduction in total activation time. This requires that the slowly propagating electrical wavefront originating from the RBB is replaced by or fused with one or more activation wavefronts originating elsewhere. In current practice, CRT is most often achieved by pacing the RV and the LV simultaneously or sequentially. The RV pacing site used is usually the RV apex, and recent trials failed to show improved CRT efficacy during RV septal versus RV apical pacing.250,251
The preferred LV pacing site is often the latest-activated region, which in LBBB is usually the basal part of the posterolateral wall.39,40 By using extensive epicardial mapping and MRI strain analysis, Helm et al.252 demonstrated that in dyssynchronous canine hearts, the area of late electrical and mechanical activation indeed closely matched the area that caused maximal LV dP/dtmax increase during pacing. This region spans about 40% of the LV free wall, especially the lateral wall. In similar studies, Rademakers et al.253 showed that in the presence of an infarction, the optimal site of LV pacing depends on the scar location. Gasparini et al.254 showed that placing the LV lead close to the ventricle’s basal portion conferred greater improvements in LV ejection fraction, quality of life, and distance walked in 6 minutes, similar to those reported for lateral lead placement. Their findings confirm previous observations by Butter et al.,218 who showed that both anterior and lateral wall pacing sites improve LV contractility and pump function. However, pacing from the lateral wall resulted in a significantly larger increase in LV contractility; moreover, in about one third of patients, pacing from the anterior wall significantly depressed LV function. It is important to note that Butter paced the LV from a “middle-apical” position. High-resolution mapping data help explain these apparently discrepant findings (see Fig. 9-29). In patients with LBBB, the basal region of the heart is always the last region to be activated, with minor differences between the superior part of the left ventricle (around aortic root) and posterior and posterobasal regions;40 the latter regions were the pacing sites selected by Gasparini.254 In contrast, the anterior middle-apical part of the left ventricle is usually early-activated, representing the LV breakthrough site, and activation of the middle-apical part of the lateral wall, one of the pacing sites tested by Butter et al.,218 is significantly delayed.
Accounting for the differences in activation time in individual patients and using TDI to locate the region with the latest mechanical activation, Ansalone et al.255 investigated whether concordance of LV lead position and latest-activated region influences the outcome of CRT. Indeed, the greatest effect on functional parameters was seen when the LV lead was in the latest-activated region. Although optimization of the pacing site is often difficult when the transcoronary venous access is used, positioning the LV lead through limited thoracotomy may be helpful. During this procedure, LV pressure-volume analysis showed the importance of choosing the best position of the LV lead.226
During a coronary sinus approach, the left ventricle is paced at the epicardial surface, whereas under physiologic conditions, excitation of the LV initiates at the endocardium.11 In a canine LBBB model, endocardial LV pacing during CRT consistently reduced electrical asynchrony compared with conventional epicardial CRT (Fig. 9-32). In parallel with these electrophysiologic improvements, endocardial CRT also improved systolic LV pump function and decreased dispersion of repolarization compared with epicardial LV pacing at the same site.33 Additionally, the hemodynamic effects for endocardial sites were less dependent on location and AV delay than epicardial sites. LV endocardial pacing in patients can be established through a transatrial septal approach, shown to be technically feasible and effective during acute and midterm follow-up.206,256–259 However, its long-term effects compared to epicardial pacing and the development of systemic thromboembolic complications need to be investigated further.
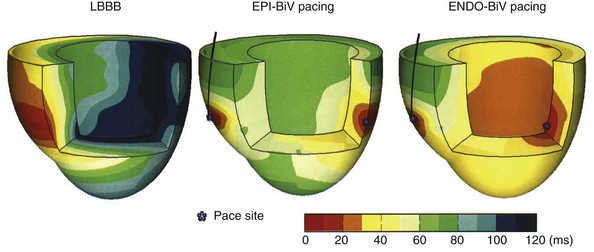
Figure 9-32 Three-dimensional reconstruction of electrical activation times of the left and right ventricles during baseline LBBB (left) and biventricular (BiV) pacing with conventional epicardial (EPI) and novel endocardial (ENDO) left ventricular electrode position. Data from epicardial contact mapping and endocardial non-contact mapping in a canine heart with LBBB induced by radiofrequency ablation.59
Given individual variations in etiology, severity, patterns of delayed ventricular activation, location of scar regions, and extent of mitral regurgitation in heart failure, it seems unlikely that one pacing site will “fit all.” This is further exemplified by studies in canine hearts with LBBB and with chronic myocardial infavetion, where the optimal site of LV pacing depended on the infarction site.253 Not surprisingly, pacing inside scar tissue, as in patients with a posterolateral scar, provides little benefit.260
Although stimulating the latest-activated regions makes sense, increasing evidence supports that pacing other areas may be at least as effective. In dogs, acute and chronic LV apical and LV septal pacing maintained regional cardiac mechanics, contractility, relaxation, and efficiency near native levels.59 Derval et al.259 investigated 11 LV pacing sites (10 endocardial, 1 CS) in 35 nonischemic, dilated cardiomyopathy patients but failed to reveal a single optimal pacing site. However, selecting the best location individually doubled LV dP/dtmax compared with conventional coronary sinus pacing.
Given the electrical similarity of the spontaneously occurring LBBB and the LBBB induced by RV pacing, several centers have explored the feasibility of “upgrading” already-implanted RV pacemakers to BiV units or, in the case of a new implant, to use BiV pacing from the beginning. The results appear to depend on the clinical setting. In patients with already-implanted RV pacing leads, the upgrade leads to improvement in cardiac function and clinical outcome.261,262 However, the situation is less clear when RV and BiV pacing are compared in patients with atrial fibrillation immediately after AV nodal ablation.263,264 In these crossover studies, parameters such as quality of life, New York Heart Association (NYHA) diagnostic class, and 6-minute walking distance showed modest differences between RV pacing and BiV pacing. However, echocardiographic measures demonstrated moderate improvements with BiV over RV pacing.263 These findings are supported by experimental data showing that both RV pacing and BiV DDD pacing are able to completely reverse LV hypertrophy and dilatation induced by chronic AV nodal ablation in dogs.265 Together, these data suggest that the effects of ventricular pacing should be considered in light of the disease being treated.
Another important, yet unresolved issue is whether LV pacing alone is sufficient for adequate CRT. In dogs and patients with LBBB, LV pacing improves LV pump function at least as much as BiV pacing.36,161,219,220 LV pacing also leads to clinical improvement at up to 1 year of follow-up.266,267 The promising effect of pacing at this single site can be explained by the fusion between the LV pacing–triggered wavefront and the wavefront created by intrinsic conduction through the RBB.36 The Device Evaluation of CONTAK RENEWAL 2 and EASYTRAK 2: Assessment of Safety and Effectiveness in Heart Failure (DECREASE HF) study was a large, prospective randomized trial comparing single-site LV pacing to simultaneous and sequential BiV pacing.268 The three groups (each >100 patients) showed similar echocardiographic reverse remodeling after 3 and 6 months. Compared to LV pacing, simultaneous BiV pacing trended toward greater improvement in LV size. Importantly, however, the same AV delays were programmed for all groups, at approximately half the intrinsic PQ time. Therefore, during single-site LV pacing, the heart was predominantly depolarized by the activation wavefront originating from the LV electrode. Without electrical fusion with an activation wavefront from the RBB, the optimal effect of single-site LV pacing may be missed.36
Atrial Pacing and Sensing
A minimum heart rate is required to maintain adequate heart function without triggering heart failure. A minimum heart rate is also required to enable the heart to generate enough cardiac output to sustain the body’s metabolic needs. Nevertheless, we now know that cardiac efficiency is higher at lower heart rate (see Fig. 9-17) and that lower heart rates favor angiogenesis. A first attempt to define an adequate heart rate could be taken by stating that given these two opposing driving forces, the optimal heart rate for a given patient would be the lowest rate that creates sufficient cardiac output to satisfy basic metabolic needs in that patient at a given point. For a patient with normal ventricular function and no heart failure, a more aggressive stance could be taken with respect to programming higher parameters for lower rate limit (LRL) and rate response in the presence of sinus bradycardia or chronotropic incompetence. In the Dual Chamber and VVI Implantable Defibrillator (DAVID) trial, dual-chamber ICD pacing was programmed to an LRL of 70 bpm and short AV intervals; its results strongly suggest that these settings were worse than a simple setting of the ICD to VVI with an LRL of 40 bpm. Many now believe that most of the detrimental effects observed in the DDD arm of this trial resulted from RV pacing creating an asynchronous contraction.175 In the DAVID-II study, VVI backup pacing at 40 bpm was compared with atrial pacing at 70 bpm. The data showed no significant difference between these two settings with respect to clinical outcome and survival as backup pacing.269 Therefore, a heart rate of 70 bpm does not seem to have a detrimental effect in the failing heart, as long as the sequence of conduction is normal.
To summarize, the data available strongly suggest caution in programming the pacemaker’s LRL to be higher than the sinus rate in patients with heart failure, whether or not they have sick sinus syndrome. This is especially important because RA pacing may cause interatrial conduction delays, leading to LA contraction against a closed mitral valve and thus lower cardiac output and elevated pulmonary pressure (Fig. 9-33). Moreover, higher-than-necessary heart rates worsen mechanical efficiency, decrease angiogenesis, exacerbate heart failure, and may even increase mortality (Fig. 9-34). In patients who receive an implant (CRT or CRT-D device) primarily for heart failure indications, a general rule is to program the LRL below the sinus rate, unless a clear clinical need to pace the atrium can be documented.
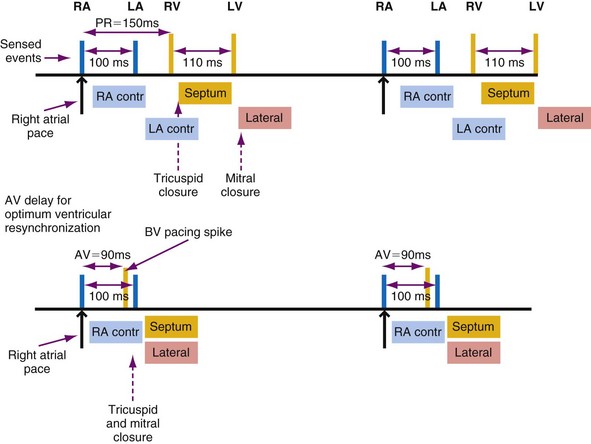
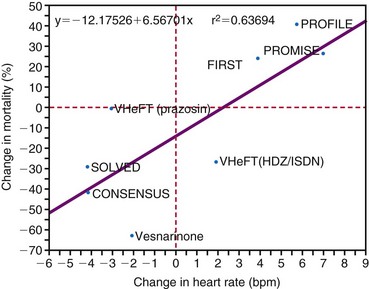
Atrioventricular Optimization
As discussed earlier, the AV interval strongly influences ventricular preload and thereby stroke volume in patients with reduced ejection fraction. During CRT, however, the AV interval also affects ventricular pump function by modifying ventricular asynchrony. At long AV intervals, the impulse conducted through the AV node and RBB is allowed to spread into the right ventricle and from there toward the left ventricle, maintaining (part of) the LBBB activation sequence. At shorter AV intervals, however, complete capture occurs from the pacing site(s), allowing resynchronization. The largest improvements in dP/dtmax occur at this point of transition from noncapture to complete capture. The best LV pump function is obtained with a relatively short AV interval, which allows complete activation of the ventricles from the two pacing sites.161 This AV interval may be different from the one resulting in optimized preload164 (Fig. 9-35). In one half of patients, the AV interval for optimal preload is usually longer than that for optimal synchrony; thus it is no surprise that the mean difference between the two AV intervals is close to zero.161
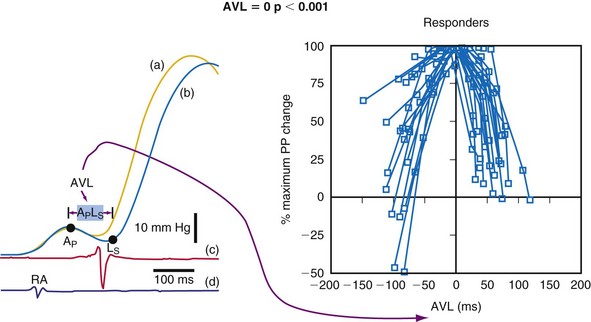
To date, prospective controlled data are still scanty to help determine the relative importance of optimizing synchrony and optimizing preload. Considering that asynchrony is a major cause of depressed pump function in patients with intraventricular conduction abnormalities, and that resynchronization has both short-term and long-term beneficial effects, we postulate that the primary target should be resynchronizing the ventricles, and that optimizing the ventricular inflow is of secondary importance in the majority of patients. The importance of restoration of ventricular asynchrony is supported by studies on the beneficial effect of CRT in patients with permanent atrial fibrillation (AF). In these patients, no preload optimization can be performed, and any possible beneficial effect on preload through CRT is excluded. Nevertheless, CRT has been shown to be effective in patients with AF and wide QRS complexes, especially once the AV node is ablated, abolishing any interference of underlying irregular, higher-rate AF spontaneous rhythm. The extent of improvement appears to be comparable to that seen in patients in sinus rhythm, in functional terms as well as long-term prognosis.270–272
To optimize AV delay, invasive and noninvasive determinations of cardiac contractility and stroke volume may be performed. Invasive determination (e.g., using LV dP/dtmax)273 is probably more accurate but is cumbersome and expensive and may carry significant risk for the patient. Noninvasive measurements comprise diastolic inflow measurements (mitral valve E and A wave) and systolic outflow measurements (aortic velocity time integrals, finger arterial pulse pressure). The advantage of outflow measurements is accounting for possible influences of CRT on mitral regurgitation, but mitral inflow is usually easier to measure and more accurate.169 Although validated to optimize AV interval in these patients, these echocardiographic methods remain time-consuming, with unproven clinical effect on large patient cohorts in prospective RCTs. Recent data suggest that the finger plethysmography for assessing arterial pressure and stroke volume is accurate274 and correlates well with echocardiographic methods for AV optimization in these patients.275
Integrated device–based algorithms to optimize AV interval have distinct clinical advantages, and different algorithms have been developed. One algorithm is based on measuring peak endocardial acceleration (PEA), a surrogate of LV dP/dtmax, using a lead with a microaccelerometer at the tip. The tip sensor detects vibration amplitude of the first heart sound, and this value should correlate with LV dP/dt.276 Other AV optimization algorithms are based on a combination of automatic measurements by intracardiac electrograms (EGMs) and surface ECGs268 or through indirect measurement of mechanical timing using surface ECGs or intracardiac signals.277,278 Some studies have found excellent correlation between EGM-based algorithm and invasively derived dP/dtmax268,279 or conventional echocardiography,277 whereas a more recent report demonstrated the reduced accuracy of a device-based interval algorithm optimization compared to conventional echocardiographic methods.278 Particularly relevant in this regard are the results of the large multicenter randomized trial SMART-AV that prospectively compared different modalities of AV interval optimization in CRT recipients, namely empirical AV delay of 120 msec, device electrogram-based algorithm, and echocardiographically guided AV optimization. Neither device electrogram nor echocardiographically based AV optimization conferred greater reduction of left ventricular end-systolic volume during follow-up compared to the empiric approach.279a Other preliminary data were presented about the CLEAR and FREEDOM trials. The CLEAR trial investigated the effect of periodic AV and interventricular (VV) optimization using the PEA sensor. The clinical composite score had increased in 86% of periodically optimized patients versus 62% in the control group (P < .0007).280 Moreover, the proportion of patients who died from any cause or were hospitalized with heart failure was significantly lower (9%) in the sensor-based optimization group than the control group (25%; P < .001). In contrast, the FREEDOM study, using regular optimization with the Quickopt algorithm, did not improve CRT response.281 Until now the evidence suggests that device-based algorithms for AV optimization may not be equivalent because each may lead to a different outcome.
Effect of Interventricular Delay
Most CRT devices now offer independent programming of AV and VV intervals. Studies on the effect of changing VV intervals during BiV pacing have reported conflicting results.208,227,282 Because of variability in the conduction disturbances, as well as ischemic or scarred regions, different timing of stimulation of the two ventricles may be optimal.283,284 In fact, more recent data from larger patient populations indicate the need for optimizing VV interval, with most patients requiring early LV offset. The largest prospective multicenter study evaluating the effectiveness of sequential pacing showed that sequential BiV pacing increased stroke volume and exercise capacity during follow-up to a greater extent than simultaneous BiV pacing for CRT.282 Also, as with Vanderheyden et al.,285 this study confirms that about 60% of patients require early LV offset to optimize CRT. In the Rhythm-II ICD trial, patients with optimal programming of AV and VV interval showed better acute hemodynamic improvements; however, this did not translate into a difference in echocardiographic response after 6 months.286
An optimal setting of the VV interval may have a positive influence. According to the current model of how CRT works, the best resynchronization would be achieved by maximizing the synchrony of the activation through manipulation of the three activation wavefronts originating from the RBB, RV, and LV pacing leads. However, this same reasoning also indicates that an optimal VV interval may depend on the AV interval. The previously cited studies have not tested all the possible variations. Therefore, differences in optimal VV intervals may be caused, for example, by the use of different AV intervals. In clinical practice, performing such elaborate optimization protocol may be impractical and time-consuming, unless a simple technique such as finger blood pressure measurement is used,275,284 with integrated optimization software that simultaneously elaborates and computes the noninvasive hemodynamic data. Optimal use of the extensive possibilities to vary timing of stimulation may be fully applicable only if medical equipment manufacturers provide adequate tools specifically designed and validated for the fine-tuning of AV and VV intervals to provide optimized CRT. It should be emphasized, however, that several prospectively designed studies evaluating the effect of VV timing optimization on symptoms and clinical outcome have failed to show a real clinical benefit. This might indicate that in the CRT population, VV timing plays a secondary role in modulating response to CRT. It is also possible, however, that a visible individual benefit may be diluted in the general population, or that the biologic variability offsets the minor (yet relevant in the individual patient) effect.
 Pacemaker Syndrome
When first described, pacemaker syndrome was attributed to ventricular pacing and recognized primarily as a problem of single-chamber ventricular pacemakers. However, with the greater use of dual-chamber pacing modes, it has become apparent that pacemaker syndrome is not unique to single-chamber pacing and may occur in different pacing modalities.287–290
Pacemaker syndrome is an array of cardiovascular and neurologic signs and symptoms resulting from disruption of appropriate AV synchrony (AV dyssynchrony) caused by suboptimal pacing, inappropriate programming of pacing parameters, or upper-limit behavior of AV synchronous pacing systems. The pathogenesis of pacemaker syndrome is complex, involving atrial and vascular reflexes and the neurohumoral system as well as the direct hemodynamic consequences of the loss of atrial systole. Patients most prone to the development of pacemaker syndrome are those with 1 : 1 retrograde ventriculoatrial (VA) conduction (Figs. 9-36 and 9-37) and those with lower stroke volume during ventricular pacing than with sinus rhythm or dual-chamber pacing. This syndrome may occur, however, with any mode of pacing that results in permanent or temporary disruption of atrial and ventricular synchronous contraction.
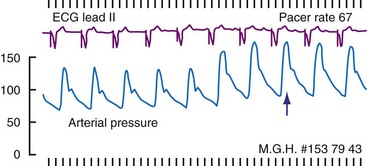
Patients treated with CRT devices may also theoretically demonstrate a pacemaker syndrome caused by inappropriate LA and LV timing. Indeed, interatrial conduction time can be significantly prolonged in patients with dilated cardiomyopathy. During CRT, the contraction of the late-activated region (most often located in LV lateral wall) is advanced to coincide with the start of the contraction of the early-activated region (most often in interventricular septum and RV free wall) to maximize mechanical synchrony and thus efficiency.55,69 In a heart where the LA mechanical contraction has been delayed(e.g., because of combined interatrial block and atrial pacing), LA contraction might occur against a closed mitral valve, especially during BiV pacing, in which LV contraction has been advanced with respect to atrial activation (Fig. 9-38). This phenomenon has been described for patients with pacemakers, in whom the issue is less likely, because RV pacing normally delays the mechanical contraction of the left ventricle, increasing the time available for the left atrium to contract before the mitral valve is finally closed by LV contraction and subsequent pressure increase.151 In NYHA functional classes III and IV heart failure, occurrence of the LA contraction after closure of the mitral valve may trigger sudden increases in pulmonary pressures, similar to cannon A waves seen in pacemaker syndrome (usually observable in jugular veins). These increases could lead to acute decompensation and pulmonary edema in a patient with heart failure. It is also important to realize that this situation could be triggered by atrial pacing because of the increased AV delay that this mode of pacing creates.
Pacemaker syndrome can be treated with an upgrade of the implanted device or with reprogramming of the parameters to achieve the optimal synchrony of atrial and ventricular contraction. Symptoms associated with pacemaker syndrome are variable in severity and onset (Table 9-4). Although the exact incidence is unknown, moderate to severe symptoms of pacemaker syndrome occur in an estimated 5% to 7% of patients in whom the ventricle is mostly paced (Fig. 9-38). Up to 10% of patients undergoing VVI pacing present with mild symptoms.
| Degree | Symptoms |
|---|---|
| Mild | Pulsations in neck, abdomen |
| Palpitations | |
| Fatigue, malaise, weakness | |
| Cough | |
| Apprehension | |
| Chest fullness or pain | |
| Headache, jaw pain | |
| Moderate | Shortness of breath on exertion |
| Dizziness, tiredness, vertigo | |
| Orthopnea, paroxysmal nocturnal dyspnea | |
| Choking sensation | |
| Confusion or alteration of mental state | |
| Severe | Presyncope |
| Syncope | |
| Shortness of breath at rest, pulmonary edema |
The pathophysiology of pacemaker syndrome is rather complex, involving hemodynamic, neurohumoral, and baroreceptor changes. In addition to direct hemodynamic effect of loss of AV synchrony or 1 : 1 retrograde VA conduction, atrial and vascular reflexes initiated by atrial distention or elevated atrial pressures may also play a role. Atrial receptors and cardiopulmonary reflexes have been the subject of several in-depth reviews.291,292 Ellenbogen et al.293,294 extensively investigated the role of baroreflex activity during pacemaker syndrome provoked by VA pacing, providing evidence that inadequate systemic sympathetic response plays a key role in the onset of pacemaker syndrome (Fig. 9-39). Indeed, when patients assume an upright position, blood is pooled in the lower extremities, and the arterial baroreceptors are activated to compensate for the decrease in cardiac output and systolic blood pressure. In some patients, pacemaker syndrome results from the inability to compensate further for the upright posture and augmentation of autonomic tone. In other patients, pacemaker syndrome may result from modification of these vascular responses through the effects of drugs, such as vasodilators and diuretics. In still other patients, pacemaker syndrome may result from activation of inhibitory atrial and cardiopulmonary reflexes that counteract the protective vasoconstrictor reflex (see Fig. 9-39). These responses may be further modified by the production of catecholamines and ANF. Circulating levels of ANF are frequently elevated in patients with complete AV block and bradycardia, being reduced within minutes of programming.295,296
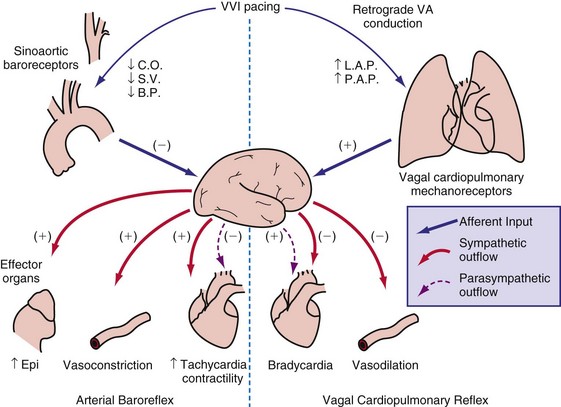
Pacemaker syndrome during AAI or AAIR pacing has been described and emphasizes the role of AV dyssynchrony in the pathogenesis. Patients originally undergoing pacing for sick sinus syndrome may later demonstrate AV conduction abnormalities, or AV nodal conduction may be impaired by drugs with AV node–blocking properties (e.g., digoxin, β-blockers, calcium channel blockers, antiarrhythmics), leading to prolonged and hemodynamically unfavorable atrial R-wave (AR) intervals. AV dyssynchrony may also occur in patients with dual–AV nodal pathway physiology during a shift in conduction from the fast pathway to the slow pathway with prolonged AV conduction time. Unfavorable sequencing of atrial and ventricular contractions may occur during AAIR pacing at high sensor-driven rates.288 This situation most often results when the slope determining the sensor-driven rate is programmed too aggressively and out of proportion to the exercise-induced increase in catecholamine levels. As the paced atrial rate progressively increases, the appropriate corresponding decrement in PR interval does not occur, and the interval may even lengthen, eventually resulting in a paced P wave occurring immediately after the preceding R wave (Fig. 9-40). This event most frequently occurs in the earlier stages of exercise and, in some patients, is corrected as the patient continues to exercise.
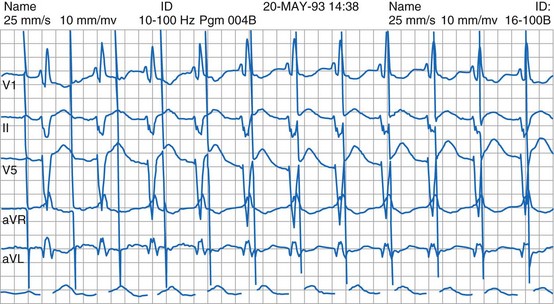
The VDD pacing mode is similar to DDD mode but without the capability of atrial pacing. The VDD mode, previously out of favor, has been revived by the development of CRT.222,297
Atrioventricular dyssynchrony and pacemaker syndrome may also occur during dual-chamber pacing as a result of inappropriate programming, prolonged atrial conduction time, or normal upper rate limit behavior.289,290,298 In AV sequential pacing modes, selection of an inappropriate AV interval may result in an adverse AV sequencing and hemodynamics. Differential AV intervals for paced and sensed atrial events and rate-adaptive AV intervals are useful in some patients for maintaining AV synchrony over a wide range of heart rates at rest and during exercise.
 Pacing in Hypertrophic Obstructive Cardiomyopathy
In patients with hypertrophic obstructive cardiomyopathy (HOCM), systolic anterior motion of the mitral valve toward the intraventricular septum is associated with LV outflow tract obstruction, often with significant mitral regurgitation. Such patients are extremely sensitive to changes in preload and to conditions that diminish LV filling and result in decreased LV cavity size and increased intraventricular gradient. Thus, these patients may respond quite differently to ventricular pacing than patients with a normal heart. It has long been known that patients with HOCM who require pacing because of bradycardia experience significantly more benefit from pacing modes that preserve AV synchrony than from ventricular pacing.299,300
Moreover, the abnormal sequence of electrical activation following RV pacing may generate a beneficial effect on the septal wall motion in patients with HOCM.160,301,302 RV pacing causes the septum to move away from the free wall during systole, increasing the LV outflow tract diameter and reducing the intraventricular outflow gradient (Fig. 9-41). In addition to widening of the LV outflow gradient, apex pacing may also reduce the Venturi effect and diminish systolic anterior motion of the mitral valve.160 Because of the proposed mechanism of benefit resulting from the altered sequence of a paced ventricular contraction, AV sequential or atrial synchronous pacing must be performed with a short AV interval to ensure ventricular preexcitation (see Fig. 9-41).
Figure 9-41 Schematic representation of a monoplane ventriculography.
(From Jeanrenaud X, Goy JJ, Kappenberger LK: Effects of dual-chamber pacing in hypertrophic obstructive cardiomyopathy. Lancet 339:1318, 1992.)
Pacing may be especially indicated in patients with HOCM who have significant intraventricular gradients and symptoms despite medical therapy. In these patients, implantation of a sequential AV pacemaker significantly reduces ventricular outflow gradient, improves NYHA functional class and quality of life, and reduces symptoms, including syncope and presyncope. After initial enthusiasm about the role of pacemaker therapy in patients with HOCM, controversy arose later regarding its efficacy and long-term safety.303 Most randomized studies showed flaws in their design.304 Also, at the same time pacemaker therapy was introduced, transcatheter ablation was introduced for reduction of the outflow tract obstruction. The efficacy of the two therapies has not yet been compared. A recent study found promising effects of pacemaker therapy in patients with heart failure and HOCM, including progressive reduction of the outflow tract obstruction and in heart failure class.305 The few existing data suggest that pacing therapy is not beneficial in patients with nonobstructive hypertrophic cardiomyopathy or in those with minimal intraventricular gradients.306 This topic is discussed in more detail in Chapter 15.
1 Saffitz JE, Davis LM, Darrow BJ, et al. The molecular basis of anisotropy: role of gap junctions. J Cardiovasc Electrophysiol. 1995;6:498-510.
2 Scher AM, Young AC, Malmgreen AL, Paton RR. Spread of electrical activity through the wall of the ventricle. Circ Res. 1953;1:539-547.
3 Scher AM, Young AC, Malmgren AL, Erickson RV. Activation of the interventricular septum. Circ Res. 1955;3:56-64.
4 Myerburg RJ, Nilsson K, Gelband H. Physiology of canine intraventricular conduction and endocardial excitation. Circ Res. 1972;30:217-243.
5 Hoffman BF, Cranefield PF, Stuckley JH, et al. Direct measurement of conduction velocity in in situ specialized conduction system of mammalian heart. Proc Soc Exp Biol Med. 1959;102:55-57.
6 Kulbertus HE, Demoulin JC. The left hemiblocks: significance, prognosis and treatment. Schweiz Med Wochenschr. 1982;112:1579-1584.
7 Uhley HN, Rivkin L. Peripheral distribution of the canine A-V conduction system. Am J Cardiol. 1960;5:688-691.
8 Abramson DI, Margolin S. A Purkinje conduction network in the myocardium of the mammalian ventricles. J Anat. 1936;70:251-259.
9 Truex RC, Copenhaver WM. Histology of the moderator band in man and other mammals with special reference to the conduction system. Am J Anat. 1947;80:173-200.
10 Berenfeld O, Jalife J. Purkinje-muscle reentry as a mechanism of polymorphic ventricular arrhythmias in 3-dimensional model of ventricles. Circ Res. 1998;82:1063-1077.
11 Durrer D, Dam v RT, Freud GE, et al. Total excitation of the isolated human heart. Circulation. 1970;41:899-912.
12 Spach MS, Barr RC. Ventricular intramural and epicardial potential distributions during ventricular activation and repolarization in the intact dog. Circ Res. 1975;37:243-257.
13 Rawling DA, Joyner RW, Overholt ED. Variations in the functional electrical coupling between the subendocardial Purkinje and ventricular layers of the canine left ventricle. Circ Res. 1985;57:252-261.
14 Bers DM. Cardiac excitation-contraction coupling. Nature. 2002;415:198-205.
15 Van Heuningen R, Rijnsburger WH, Ter Keurs HEDJ. Sarcomere length control in striated muscle. Am J Physiol. 1982;242:H411-H420.
16 Prinzen FW, Augustijn CH, Allessie MA, et al. The time sequence of electrical and mechanical activation during spontaneous beating and ectopic stimulation. Eur Heart J. 1992;13:535-543.
17 Hasenfuss G, Reinecke H, Studer R. Relation between myocardial function and expression of sarcoplasmic reticulum Ca2+-ATPase in failing and nonfailing human myocardium. Circ Res. 1994;75:434-442.
18 Studer R, Reinecke H, Bilger J, et al. Gene expression of the cardiac Na+-Ca2+ exchanger in end-stage human heart failure. Circ Res. 1994;75:443-453.
19 Verdonck F, Volders PG, Vos MA, Sipido KR. Increased Na+ concentration and altered Na/K pump activity in hypertrophied canine ventricular cells. Cardiovasc Res. 2003;57:1035-1043.
20 O’Rourke B, Kass DA, Tomaselli GF, et al. Mechanisms of altered excitation-contraction coupling in canine tachycardia-induced heart failure. Circ Res. 1999;84:562-570.
21 Pogwizd SM, Qi M, Yuan W, et al. Upregulation of Na+/Ca2+ exchanger expression and function in an arrhythmogenic rabbit model of heart failure. Circ Res. 1999;85:1009-1019.
22 Swynghedauw B. Molecular mechanisms of myocardial remodeling: review. Physiol Rev. 1999;79:215-262.
23 Cooper GI. Load and length regulation of cardiac energetics. Annu Rev Physiol. 1990;52:505-522.
24 Vassallo JA, Cassidy DM, Marchlinski FE, et al. Endocardial activation of left bundle branch block. Circulation. 1984;69:914-923.
25 Durrer D, Roos JP. Epicardial excitation of the ventricles in a patient with a Wolff-Parkinson-White syndrome (type B). Circulation. 1967;35:15.
26 Lister JW, Klotz DH, Jomain SL, et al. Effect of pacemaker site on cardiac output and ventricular activation in dogs with complete heart block. Am J Cardiol. 1964;14:494-503.
27 Vassallo JA, Cassidy DM, Miller JM, et al. Left ventricular endocardial activation during right ventricular pacing: effect of underlying heart disease. J Am Coll Cardiol. 1986;7:1228-1233.
28 Spach MS, Miller WT, Geselowitz DB, et al. The discontinuous nature of propagation in normal canine cardiac muscle: evidence for recurrent discontinuities of intracellular resistance that affect the membrane currents. Circ Res. 1981;48:39-54.
29 Frazier DW, Krassowska W, Chen PS, et al. Transmural activations and stimulus potentials in three-dimensional anisotropic canine myocardium. Circ Res. 1988;63:135-146.
30 Wiggers CJ. The muscular reactions of the mammalian ventricles to artificial surface stimuli. Am J Physiol. 1925;73:346-378.
31 Prinzen FW, Augustijn CH, Arts T, et al. Redistribution of myocardial fiber strain and blood flow by asynchronous activation. Am J Physiol. 1990;259:H300-H308.
32 Myerburg RJ, Gelband H, Nilsson K, et al. The role of canine superficial ventricular fibers in endocardial impulse conduction. Circ Res. 1978;42:27-35.
33 Van Deursen C, Van Geldorp IE, Rademakers LM, et al. Left ventricular endocardial pacing improves resynchronization therapy in canine left bundle-branch hearts. Circulation Arrhythm Electrophysiol. 2009;2:580-587.
34 Askenazi J, Alexander JH, Koenigsberg DI, et al. Alteration of left ventricular performance by left bundle branch block simulated with atrioventricular sequential pacing. Am J Cardiol. 1984;53:99-104.
35 Hirzel HO, Senn M, Nuesch K, et al. Thallium-201 scintigraphy in complete left bundle branch block. Am J Cardiol. 1984;53:764-769.
36 Verbeek X, Vernooy K, Peschar M, et al. Intra-ventricular resynchronization for optimal left ventricular function during pacing in experimental left bundle branch block. J Am Coll Cardiol. 2003;42:558-567.
37 Ono S, Nohara R, Kambara H, et al. Regional myocardial perfusion and glucose metabolism in experimental left bundle branch block. Circulation. 1992;85:1125-1131.
38 Rosenbush SW, Ruggie N, Turner DA, et al. Sequence and timing of ventricular wall motion in patients with bundle branch block. Circulation. 1982;66:113-119.
39 Rodriguez LM, Timmermans C, Nabar A, et al. Variable patterns of septal activation in patients with left bundle branch block and heart failure. J Cardiovasc Electrophysiol. 2003;14:135-141.
40 Auricchio A, Abraham WT. Cardiac resynchronization therapy: current state of the art, cost versus benefit. Circulation. 2004;109:300-307.
41 Lambiase PD, Rinaldi A, Hauck J, et al. Non-contact left ventricular endocardial mapping in cardiac resynchronisation therapy. Heart. 2004;90:44-51.
42 Fung JW, Yu CM, Yip G, et al. Variable left ventricular activation pattern in patients with heart failure and left bundle branch block. Heart. 2004;90:17-19.
43 Sohi GS, Flowers NC, Horan LG, et al. Comparison of total body surface map depolarization patterns of left bundle branch block and normal axis with left bundle branch block and left-axis deviation. Circulation. 1983;67:660-664.
44 Narula OS. Longitudinal dissociation in the His bundle: bundle branch block due to asynchronous conduction within the His bundle in man. Circulation. 1977;56:996-1006.
45 Becker RA, Erickson RV, Scher AM. Ventricular excitation in experimental bundle-branch block. Circ Res. 1957;5:5-10.
46 Prinzen FW, Auricchio A. Is echocardiographic assessment of dyssynchrony useful to select candidates for cardiac resynchronization therapy? Echocardiography is not useful before cardiac resynchronization therapy if QRS duration is available. Circ Imaging. 2008;1:70-78.
46a Strik M, Ploux S, Vernooy K, Prinzen FW. Cardiac resynchronization therapy: Refocus on electrical substrate. Circ J. 2011;75:1297-1304.
47 Badke FR, Boinay P, Covell JW. Effect of ventricular pacing on regional left ventricular performance in the dog. Am J Physiol. 1980;238:H858-H867.
48 Prinzen FW, Hunter WC, Wyman BT, McVeigh ER. Mapping of regional myocardial strain and work during ventricular pacing: experimental study using magnetic resonance imaging tagging. J Am Coll Cardiol. 1999;33:1735-1742.
49 Tyberg JV, Parmley WW, Sonnenblick EH. In vitro studies of myocardial asynchrony and regional hypoxia. Circ Res. 1969;25:569-579.
50 Prinzen FW, van Oosterhout MFM, Vanagt WYR, et al. Optimization of ventricular function by improving the activation sequence during ventricular pacing. PACE. 1998;21:2256-2260.
51 Delhaas T, Arts T, Bovendeerd PHM, et al. Subepicardial fiber strain and stress as related to left ventricular pressure and volume. Am J Physiol. 1993;264:H1548-H1559.
52 Little WC, Reeves RC, Arciniegas J, et al. Mechanism of abnormal interventricular septal motion during delayed left ventricular activation. Circ Res. 1982;65:1486-1490.
53 Grines CL, Bashore TM, Boudoulas H, et al. Functional abnormalities in isolated left bundle branch block. Circulation. 1989;79:845-853.
54 Vernooy K, Verbeek XA, Peschar M, et al. Left bundle branch block induces ventricular remodelling and functional septal hypoperfusion. Eur Heart J. 2005;26:91-98.
55 De Boeck BW, Teske AJ, Meine M, et al. Septal rebound stretch reflects the functional substrate to cardiac resynchronization therapy and predicts volumetric and neurohormonal response. Eur J Heart Fail. 2009;11:863-871.
56 Klimusina J, De Boeck BW, Faletra FF, et al. Redistribution and homogenization of left ventricular strain by cardiac resynchronization therapy in heart failure patients. Eur J Heart Fail. 2001;13:186-194.
57 Vernooy K, Cornelussen RN, Verbeek XA, et al. Cardiac resynchronization therapy cures dyssynchronopathy in canine left bundle-branch block hearts. Eur Heart J. 2007;28:2148-2155.
58 Delhaas T, Arts T, Prinzen FW, Reneman RS. Regional fibre stress–fibre strain area as estimate of regional oxygen demand in the canine heart. J Physiol (Lond). 1994;477:481-496.
59 Mills RW, Cornelussen RN, Mulligan LJ, et al. Left ventricular septal and left ventricular apical pacing chronically maintain cardiac contractile coordination, pump function and efficiency. Circulation Arrhythm Electrophysiol. 2009;2:571-579.
60 Nielsen JC, Boetcher M, Toftegaard Nielsen T, et al. Regional myocardial blood flow in patients with sick sinus syndrome randomized to long-term single chamber atrial or dual chamber pacing: effect of pacing mode and rate. J Am Coll Cardiol. 2000;35:1453-1461.
61 Nowak B, Sinha AM, Schaefer WM, et al. Cardiac resynchronization therapy homogenizes myocardial glucose metabolism and perfusion in dilated cardiomyopathy and left bundle branch block. J Am Coll Cardiol. 2003;41:1523-1528.
62 Lindner O, Vogt J, Kammeier A, et al. Effect of cardiac resynchronization therapy on global and regional oxygen consumption and myocardial blood flow in patients with non-ischaemic and ischaemic cardiomyopathy. Eur Heart J. 2005;26:70-76.
63 Beppu S, Matsuda H, Shishido T, Miyatake K. Functional myocardial perfusion abnormality induced by left ventricular asynchronous contraction: experimental study using myocardial contrast echocardiography. J Am Coll Cardiol. 1997;29:1632-1638.
64 Ten Cate TJ, Visser FC, Panhuyzen-Goedkoop NM, et al. Pacemaker-related myocardial perfusion defects worsen during higher pacing rate and coronary flow augmentation. Heart Rhythm. 2005;2:1058-1063.
65 Boerth RC, Covell JW. Mechanical performance and efficiency of the left ventricle during ventricular stimulation. Am J Physiol. 1971;221:1686-1691.
66 Baller D, Wolpers HG, Zipfel J, et al. Unfavorable effects of ventricular pacing on myocardial energetics. Basic Res Cardiol. 1981;76:115-123.
67 Baller D, Wolpers H-G, Zipfel J, et al. Comparison of the effects of right atrial, right ventricular apex and atrioventricular sequential pacing on myocardial oxygen consumption and cardiac efficiency: a laboratory investigation. PACE. 1988;11:394-403.
68 Owen CH, Esposito DJ, Davis JW, Glower DD. The effects of ventricular pacing on left ventricular geometry, function, myocardial oxygen consumption and efficiency of contraction in conscious dogs. PACE. 1998;21:1417-1429.
69 Nelson GS, Berger RD, Fetics BJ, et al. Left ventricular or biventricular pacing improves cardiac function at diminished energy cost in patients with dilated cardiomyopathy and left bundle-branch block. Circulation. 2000;102:3053-3059.
70 Van Oosterhout MF, Prinzen FW, Arts T, et al. Asynchronous electrical activation induces asymmetrical hypertrophy of the left ventricular wall. Circulation. 1998;98:588-595.
71 Gilmore JP, Sarnoff SJ, Mitchell JH, Linden RJ. Synchronicity of ventricular contraction: observations comparing hæmodynamic effects of atrial and ventricular pacing. Br Heart J. 1963;25:299-307.
72 Park RC, Little WC, O’Rourke RA. Effect of alteration of left ventricular activation sequence on the left ventricular end-systolic pressure-volume relation in closed-chest dogs. Circ Res. 1985;57:706-717.
73 Bahler RC, Martin P. Effects of loading conditions and inotropic state on rapid filling phase of left ventricle. Am J Physiol. 1985;248:H523-H533.
74 Leclercq C, Gras D, Le Helloco A, et al. Hemodynamic importance of preserving the normal sequence of ventricular activation in permanent cardiac pacing. Am Heart J. 1995;129:1133-1141.
75 Betocchi S, Piscione F, Villari B, et al. Effects of induced asynchrony on left ventricular diastolic function in patients with coronary artery disease. J Am Coll Cardiol. 1993;21:1124-1131.
76 Bedotto JB, Grayburn PA, Black WH, et al. Alterations in left ventricular relaxation during atrioventricular pacing in humans. J Am Coll Cardiol. 1990;15:658-664.
77 Rosenqvist M, Bergfeldt L, Haga Y, et al. The effect of ventricular activation sequence on cardiac performance during pacing. PACE. 1996;19:1279-1287.
78 Zile MR, Blaustein AS, Shimizu G, Gaasch WH. Right ventricular pacing reduces the rate of left ventricular relaxation and filling. J Am Coll Cardiol. 1987;10:702-709.
79 Blaustein AS, Gaasch WH. Myocardial relaxation. VI. Effects of beta-adrenergic tone and asynchrony on LV relaxation rate. Am J Physiol. 1983:244.
80 Heyndrickx GR, Vantrimpont PJ, Rousseau MF, Pouleur H. Effects of asynchrony on myocardial relaxation at rest and during exercise in conscious dogs. Am J Physiol. 1988;254:H817-H822.
81 Zhou Q, Henein M, Coats A, Gibson D. Different effects of abnormal activation and myocardial disease on left ventricular ejection and filling times. Heart. 2000;84:272-276.
82 Lee MA, Dae MW, Langberg JJ, et al. Effects of long-term right ventricular apical pacing on left ventricular perfusion, innervation, function and histology. J Am Coll Cardiol. 1994;24:225-232.
83 Maurer G, Torres MA, Corday E, et al. Two-dimensional echocardiographic contrast assessment of pacing-induced mitral regurgitation: relation to altered regional left ventricular function. J Am Coll Cardiol. 1984;3:986-991.
84 Miyazawa K, Shirato K, Haneda T, et al. Effects of varying pacemaker sites on left ventricular performance. Tohoku J Exp Med. 1976;120:301-308.
85 Mark JB, Chetham PM. Ventricular pacing can induce hemodynamically significant mitral valve regurgitation. Anesthesiology. 1991;74:375-377.
86 Twidale N, Manda V, Holliday R, et al. Mitral regurgitation after atrioventricular node catheter ablation for atrial fibrillation and heart failure: acute hemodynamic features. Am Heart J. 1999;138:1166-1175.
87 Rosenqvist M, Isaaz K, Botvinick EH, et al. Relative importance of activation sequence compared to atrioventricular synchrony in left ventricular function. Am J Cardiol. 1991;67:148-156.
88 Bramlet DA, Morris KG, Coleman RE, et al. Effect of AA-adrenoceptor antagonists (phentolamine, nicergoline and prazosin) on reperfusion arrhythmias and noradrenaline release in perfused rat heart. Circulation. 1983;67:1059-1065.
89 Little WC, Park RC, Freeman GL. Effects of regional ischemia and ventricular pacing on LV dP/dTmax-end-diastolic volume relation. Am J Physiol. 1987;252:H933-H940.
90 Suga H, Goto Y, Yaku H, et al. Simulation of mechanoenergetics of asynchronously contracting ventricle. Am J Physiol. 1990;259:R1075-R1082.
91 Prinzen FW, Peschar M. Relation between the pacing induced sequence of activation and left ventricular pump function in animals. PACE. 2002;25:484-498.
92 Klotz DH, Lister JW, Jomain SL, et al. Implantation sites of pacemakers after right ventriculotomy and complete heart block. JAMA. 1963;186:929-931.
93 Vanagt WY, Verbeek XA, Delhaas T, et al. The left ventricular apex is the optimal site for pediatric pacing: correlation with animal experience. Pacing Clin Electrophysiol. 2004;27:837-843.
94 Peschar M, de Swart H, Michels KJ, et al. Left ventricular septal and apex pacing for optimal pump function in canine hearts. J Am Coll Cardiol. 2003;41:1218-1226.
95 Ypenburg C, Lancellotti P, Tops LF, et al. Acute effects of initiation and withdrawal of cardiac resynchronization therapy on papillary muscle dyssynchrony and mitral regurgitation. J Am Coll Cardiol. 2007;50:2071-2077.
96 Otsuji Y, Gilon D, Jiang L, et al. Restricted diastolic opening of the mitral leaflets in patients with left ventricular dysfunction: evidence for increased valve tethering. J Am Coll Cardiol. 1998;32:398-404.
97 Breithardt OA, Stellbrink C, Herbots L, et al. Cardiac resynchronization therapy can reverse abnormal myocardial strain distribution in patients with heart failure and left bundle branch block. J Am Coll Cardiol. 2003;42:486-494.
98 Rosen MR. The heart remembers: clinical implications. Lancet. 2001;357:468-471.
99 Plotnikov AN, Yu H, Geller JC, et al. Role of L-type calcium channels in pacing-induced short-term and long-term cardiac memory in canine heart. Circulation. 2003;107:2844-2849.
100 Patberg KW, Plotnikov AN, Quamina A, et al. Cardiac memory is associated with decreased levels of the transcriptional factor CREB modulated by angiotensin II and calcium. Circ Res. 2003;93:472-478.
101 Wecke L, Rubulis A, Lundahl G, et al. Right ventricular pacing–induced electrophysiological remodeling in the human heart and its relationship to cardiac memory. Heart Rhythm. 2007;4:1477-1486.
102 Costard-Jäckle A, Franz MR. Slow and long-lasting modulation of myocardial repolarization produced by ectopic activation in isolated rabbit hearts: evidence for cardiac “memory”. Circulation. 1989;80:1412-1420.
103 Alessandrini RS, McPherson DD, Kadish AH, et al. Cardiac memory: a mechanical and electrical phenomenon. Am J Physiol. 1997;272:H1952-H1959.
104 Nahlawi M, Waligora M, Spies SM, et al. Left ventricular function during and after right ventricular pacing. J Am Coll Cardiol. 2004;44:1883-1888.
105 Prinzen FW, Cheriex EM, Delhaas T, et al. Asymmetric thickness of the left ventricular wall resulting from asynchronous electrical activation: a study in patients with left bundle branch block and in dogs with ventricular pacing. Am Heart J. 1995;130:1045-1053.
106 Van Oosterhout MFM, Arts T, Muijtjens AMM, et al. Remodeling by ventricular pacing in hypertrophying dog hearts. Cardiovasc Res. 2001;49:771-778.
107 Karpawich PP, Justice CD, Cavitt DL, Chang CH. Developmental sequelae of fixed-rate ventricular pacing in the immature canine heart: an electrophysiologic, hemodynamic and histopathologic evaluation. Am Heart J. 1990;119:1077-1083.
108 Waldman LK, Covell JW. Effects of ventricular pacing on finite deformation in canine left ventricles. Am J Physiol. 1987;252:H1023-H1030.
109 Knaapen P, van Campen LM, de Cock CC, et al. Effects of cardiac resynchronization therapy on myocardial perfusion reserve. Circulation. 2004;110:646-651.
110 Patel PM, Plotnikov A, Kanagaratnam P, et al. Altering ventricular activation remodels gap junction distribution in canine heart. J Cardiovasc Electrophysiol. 2001;12:570-577.
111 Spragg DD, Akar FG, Helm RH, et al. Abnormal conduction and repolarization in late-activated myocardium of dyssynchronously contracting hearts. Cardiovasc Res. 2005;67:77-86.
112 Akar FG, Spragg DD, Tunin RS, et al. Mechanisms underlying conduction slowing and arrhythmogenesis in nonischemic dilated cardiomyopathy. Circ Res. 2004;95:717-725.
113 Chakir K, Daya SK, Aiba T, et al. Mechanisms of enhanced beta-adrenergic reserve from cardiac resynchronization therapy. Circulation. 2009;119:1231-1240.
114 Aiba T, Hesketh GG, Barth AS, et al. Electrophysiological consequences of dyssynchronous heart failure and its restoration by resynchronization therapy. Circulation. 2009;119:1220-1230.
115 Vanderheyden M, Mullens W, Delrue L, et al. Myocardial gene expression in heart failure patients treated with cardiac resynchronization therapy responders versus nonresponders. J Am Coll Cardiol. 2008;51:129-136.
116 Kertesz NJ, Friedman RA, Colan SD, et al. Left ventricular mechanics and geometry in patients with congenital complete atrioventricular block. Circulation. 1997;96:3430-3435.
117 Udink ten Cate FE, Breur JM, Cohen MI, et al. Dilated cardiomyopathy in isolated congenital complete atrioventricular block: early and long-term risk in children. J Am Coll Cardiol. 2001;37:1129-1134.
118 Peschar M, Vernooy K, Cornelussen RN, et al. Structural, electrical and mechanical remodeling of the canine heart in AV-block and LBBB. Eur Heart J. 2004;6(Suppl D):61-65.
119 Vos MA, De Groot SHM, Verduyn SC, et al. Enhanced susceptibility for aquired torsade de pointes arrrhythmias in the dog with chronic, complete AV block is related to cardiac hypertrophy and electrical remodeling. Circulation. 1998;98:1125-1135.
120 Brockman SK. Cardiodynamics of complete heart block. Am J Cardiol. 1965;16:72-83.
121 Brockman SK, Stoney WS. Congestive heart failure and cardiac output in heart block and during pacing. Ann NY Acad Sci. 1969;167:534-545.
122 Breur JM, Udink Ten Cate FE, Kapusta L, et al. Pacemaker therapy in isolated congenital complete atrioventricular block. Pacing Clin Electrophysiol. 2002;25:1685-1691.
123 Tantengco MV, Thomas RL, Karpawich PP. Left ventricular dysfunction after long-term tight ventricular apical pacing in the young. J Am Coll Cardiol. 2001;37:2093-2100.
124 Thambo JB, Bordachar P, Garrigue S, et al. Detrimental ventricular remodeling in patients with congenital complete heart block and chronic right ventricular apical pacing. Circulation. 2004;110:3766-3772.
125 Benchimol A, Ellis JC, Dimond EG. Hemodynamic consequences of atrial and ventricular pacing in patietins with normal and abnormal hearts. Am J Med. 1965;39:911-922.
126 Sowton E. Haemodynamic studies in patients with artificial pacemakers. Br Heart J. 1964;26:737-746.
127 Karlof I, Bevegard S, Ovenfors CO. Adaptation of the left ventricle to sudden changes in heart rate in patients with artificial pacemakers. Cardiovasc Res. 1973;7:322-330.
128 Wright AJ, Hudlicka O. Capillary growth and changes in heart performance induced by chronic bradycardial pacing in the rabbit. Circ Res. 1981;49:469-478.
129 Brown MD, Davies MK, Hudlicka O. The effect of long-term bradycardia on heart microvascular supply and performance. Cell Mol Biol Res. 1994;40:137-142.
130 Lei L, Zhou R, Zheng W, et al. Bradycardia induces angiogenesis increases coronary reserve, and preserves function of the post-infarcted heart. Circulation. 2004;110:796-802.
131 Ishibashi Y, Shimada T, Nosaka S, et al. Effects of heart rate on coronary circulation and external mechanical efficiency in elderly hypertensive patients with left ventricular hypertrophy. Clin Cardiol. 1996;19:620-630.
132 Kristensson B, Arnman K, Ryden L, et al. The haemodynamic importance of atrioventricular synchrony and rate increase at rest and during exercise. Eur Heart J. 1985;6:773-778.
133 Perhsson SK. Influence of heart rate and atrioventricular synchrony on maximal work tolerance in patients treated with artificial pacemakers. Acta Med Scand. 1983;214:311-315.
134 Fananapazir L, Bennett DH, Monks P. Atrial synchronized ventricular pacing: contribution of the chronotropic response to improved exercise performance. PACE. 1983;6:601-608.
135 Rowe GG, Stenlund RR, Thomsen JH, et al. Coronary and systemic hemodynamic effects of cardiac pacing in man with complete heart block. Circulation. 1969;40:839-845.
136 Bowman AW, Kovacs SJ. Left atrial conduit volume is generated by deviation from the constant-volume state of the left heart: a combined MRI-echocardiographic study. Am J Physiol Heart Circ Physiol. 2004;286:H2416-H2424.
137 Samet P, Castillo P, Bernstein WH. Hemodynamic consequences of sequential atrioventricular pacing. Am J Cardiol. 1968;21:207-212.
138 Daggett WM, Bianco JA, Powel WJ, Austen WG. Relative contribution of the atrial systole-ventricular systole interval and of patterns of ventricular activation to ventricular function during electrical pacing of the dog heart. Circ Res. 1970;27:69-79.
139 Kosowsky BD, Scherlag BJ, Damato AN. Re-evaluation of the atrial contribution to ventricular function. Am J Cardiol. 1968;21:518-524.
140 Faerestrand S, Ohm OJ. A time-related study of the hemodynamic benefit of atrioventricular synchronous pacing evaluated by Doppler echocardiography. PACE. 1985;8:838-848.
141 Masuyama T, Kodama S, Nakatani S, Kitakabe A. Effects of atrioventricular interval on left ventricular diastolic filling assessed with pulsed Doppler echocardiography. Cardiovasc Res. 1989;23:1034-1042.
142 Mitchell JH, Gupta RC, Payne RM. Influence of atrial systole on effective ventricular stroke volume. Circ Res. 1965;17:11-18.
143 Mehta D, Gilmour S, Ward DE, Camm AJ. Optimal atrioventricular delay at rest and during exercise in patients with dual chamber pacemakers: a non-invasive assessment by continuous wave Doppler. Br Heart J. 1989;61:161-166.
144 Tanabe A, Mohri T, Ohga M, et al. The effects of pacing-induced left bundle branch block on left ventricular systolic and diastolic performances. Jpn Heart J. 1990;31:309-317.
145 Nielsen JC, Andersen HR, Thomsen PEB, et al. Heart failure and echocardiographic changes during long-term follow-up of patients with sick sinus syndrome randomized to single-chamber atrial or ventricular pacing. Circulation. 1998;97:987-995.
146 Wish M, Fletcher RD, Gottdiener JS, et al. Importance of left atrial timing in the programming of dual-chamber pacemakers. Am J Cardiol. 1987;60:566-571.
147 Janosik DL, Pearson AC, Buckingham TA, et al. The hemodynamic benefit of differential atrioventricular delay intervals for sensed and paced atrial events during physiologic pacing. J Am Coll Cardiol. 1989;14:499-507.
148 Catania SL, Maue-Dickson W. AV delay latency compensation. J Electrophysiol. 1987;3:242.
149 Sutton R. The atrioventricular interval: what considerations influence its programming? Eur J Cardiac Pacing Electrophysiol. 1992;3:192.
150 Alt EU, VonBirbra H, Blömer H. Different beneficial AV intervals with DDD pacing after sensed or paced atrial events. J Electrophysiol. 1987;1:250.
151 Chirife R, Ortega DF, Salazar AI. Nonphysiological left heart AV intervals as a result of DDD and AAI “physiological” pacing. Pacing Clin Electrophysiol. 1991;14:1752-1756.
152 Capucci A, Boriani G, Specchia S, et al. Evaluation by cardiopulmonary exercise test of DDDR versus DDD pacing. Pacing Clin Electrophysiol. 1992;15:1908-1913.
153 Daubert C, Richter P, Mabo P, et al. Physiological relationship between AV interval and heart rate in healthy subjects: applications to dual-chamber pacing. Pacing Clin Electrophysiol. 1986;9:1032-1039.
154 Luceri RM, Brownstein SL, Vardeman L, et al. PR interval behaviour during exercise: implications for physiological pacemakers. Pacing Clin Electrophysiol. 1990;13:1719-1723.
155 Barbieri D, Percoco GF, Toselli T, et al. AV delay and exercise stress test: behaviour in normal subjects. Pacing Clin Electrophysiol. 1990;13:1724-1727.
156 Haskell RJ, French WJ. Physiological importance of different atrioventricular intervals to improved exercise performance in patients with dual-chamber pacemakers. Br Heart J. 1989;61:46-51.
157 Ritter PH, Vai F, Bonnet JL, et al. Rate-adaptive atrioventricular delay improves cardiopulmonary performance in patients implanted with a dual-chamber pacemaker for complete heart block. Eur J Cardiac Pacing Electrophysiol. 1991;1:31.
158 Sulke AN, Chambers JB, Sowton E. The effect of atrio-ventricular delay programming in patients with DDDR pacemakers. Eur Heart J. 1992;13:464-472.
159 Brecker SJ, Xiao HB, Sparrow J, Gibson DG. Effects of dual-chamber pacing with short atrioventricular delay in dilated cardiomyopathy. Lancet. 1992;340:1308-1312.
160 Nishimura RA, Hayes DL, Holmes DRJ, Tajik AJ. Mechanism of hemodynamic improvement by dual-chamber pacing for severe left ventricular dysfunction: an acute Doppler and catheterization hemodynamic study. J Am Coll Cardiol. 1995;25:281-288.
161 Auricchio A, Stellbrink C, Block M, et al. Effect of pacing chamber and atrioventricular delay on acute systolic function of paced patients with congestive heart failure. The Pacing Therapies for Congestive Heart Failure Study Group. The Guidant Congestive Heart Failure Research Group. Circulation. 1999;99:2993-3001.
162 Auricchio A, Stellbrink C, Sack S, et al. Long-term clinical effect of hemodynamically optimized cardiac resynchronization therapy in patients with heart failure and ventricular conduction delay. J Am Coll Cardiol. 2002;39:2026-2033.
163 Auricchio A, Kloss M, Trautmann SI, et al. Exercise performance following cardiac resynchronization therapy in patients with heart failure and ventricular conduction delay. Am J Cardiol. 2002;89:198-203.
164 Auricchio A, Ding J, Spinelli JC, et al. Cardiac resynchronization therapy restores optimal atrioventricular mechanical timing in heart failure patients with ventricular conduction delay. J Am Coll Cardiol. 2002;39:1163-1169.
165 Dupont WD, Plummer WDJ. Power and sample size calculations for studies involving linear regression. Control Clin Trials. 1998;19:589-601.
166 Morales MA, Startari U, Panchetti L, et al. Atrioventricular delay optimization by Doppler-derived left ventricular dP/dt improves 6-month outcome of resynchronized patients. Pacing Clin Electrophysiol. 2006;29:564-568.
167 Sawhney NS, Waggoner AD, Garhwal S, et al. Randomized prospective trial of atrioventricular delay programming for cardiac resynchronization therapy. Heart Rhythm. 2004;1:562-567.
168 Hardt SE, Yazdi SH, Bauer A, et al. Immediate and chronic effects of AV-delay optimization in patients with cardiac resynchronization therapy. Int J Cardiol. 2007;115:318-325.
169 Jansen AH, Bracke FA, van Dantzig JM, et al. Correlation of echo-Doppler optimization of atrioventricular delay in cardiac resynchronization therapy with invasive hemodynamics in patients with heart failure secondary to ischemic or idiopathic dilated cardiomyopathy. Am J Cardiol. 2006;97:552-557.
170 Kindermann M, Froehlig G, Doerr T, Schieffer H. Optimizing the AV delay in DDD pacemaker patients with high degree AV block: mitral valve Doppler versus impedance cardiography. PACE. 1997;20:2453-2462.
171 Santini M, Alexidou G, Ansalone G, et al. Relation of prognosis in sick sinus syndrome to age, conduction defects and modes of permanent cardiac pacing. Am J Cardiol. 1990;65:729-735.
172 Rosenqvist M, Brandt J, Schueller H. Atrial versus ventricular pacing in sinus node disease: a treatment comparison study. Am Heart J. 1986;111:292-297.
173 Andersen HR, Nielsen JC, Thomsen PEB, et al. Long-term follow-up of patients from a randomised trial of atrial versus ventricular pacing for sick sinus syndrome. Lancet. 1997;350:1210-1216.
174 Sweeney MO, Hellkamp AS, Ellenbogen KA, et al. Adverse effect of ventricular pacing on heart failure and atrial fibrillation among patients with normal baseline QRS duration in a clinical trial of pacemaker therapy for sinus node dysfunction. Circulation. 2003;107:2932-2937.
175 Wilkoff BL, Cook JR, Epstein AE, et al. Dual-chamber pacing or ventricular back-up pacing in patients with an implantable defibrillator. JAMA. 2002;288:3115-3123.
176 Karpawich PP, Justice CD, Chang CH, et al. Septal ventricular pacing in the immature canine heart: a new perspective. Am Heart J. 1991;121:827-833.
177 Schneider JF, Thomas HEJr, Sorlie P, et al. Comparative features of newly acquired left and right bundle branch block in the general population: the Framingham Study. Am J Cardiol. 1981;47:931-940.
178 Freedman RA, Alderman EL, Sheffield LT, et al. Bundle branch block in patients with chronic coronary artery disease: angiographic correlates and prognostic significance. J Am Coll Cardiol. 1987;10:73-80.
179 Eriksson P, Hansson PO, Eriksson H, Dellborg M. Bundle-branch block in a general male population: the study of men born 1913. Circulation. 1998;98:2494-2500.
180 Rabkin SW, Mathewson FAL, Tate RB. Natural history of left bundle-branch block. Br Heart J. 1980;43:164-169.
181 Schneider JF, Thomas HEJr, Kreger BE, et al. Newly acquired left bundle branch block: the Framingham Study. Ann Intern Med. 1979;90:303-310.
182 Takeshita A, Basta LL, Kioschos JM. Effect of intermittent left bundle branch block on left ventricular performance. Am J Med. 1974;56:251-255.
183 De Nardo D, Antolini M, Pitucco G, et al. Effects of left bundle branch block on left ventricular function in apparently normal subjects: study by equilibrium radionuclide angiocardiography at rest. Cardiology. 1988;75:365-371.
184 Verbeek X, Vernooy K, Peschar M, et al. Quantification of interventricular asynchrony during LBBB and ventricular pacing. Am J Physiol. 2002;283:H1370-H1378.
185 Liu L, Tockman B, Girouard S, et al. Left ventricular resynchronization therapy in a canine model of left bundle branch block. Am J Physiol. 2002;282:H2238-H2244.
186 Rouleau F, Merheb M, Geffroy S, et al. Echocardiographic assessment of the interventricular delay of activation and correlation to the QRS width in dilated cardiomyopathy. Pacing Clin Electrophysiol. 2001;24:1500-1506.
187 Nielsen JC, Boetcher M, Toftegaard Nielsen TT, Pedersen AK, Andersen HR. Regional myocardial blood flow in patients with sick sinus syndrome randomized to long-term single chamber atrial or dual chamber pacing—effect of pacing mode and rate. JACC. 2000;35:1453-1461.
188 Nielsen JC, Kristensen L, Andersen HR, et al. A randomized comparison of atrial and dual-chamber pacing in 177 consecutive patients with sick sinus syndrome: echocardiographic and clinical outcome. J Am Coll Cardiol. 2003;42:614-623.
189 Kristensen L, Nielsen JC, Mortensen PT, et al. Incidence of atrial fibrillation and thromboembolism in a randomised trial of atrial versus dual-chamber pacing in 177 patients with sick sinus syndrome. Heart. 2004;90:661-666.
190 Andersen HR, Nielsen JC, Thomsen PE, et al. Atrioventricular conduction during long-term follow-up of patients with sick sinus syndrome. Circulation. 1998;98:1315-1321.
191 Kristensen L, Nielsen JC, Pedersen AK, et al. AV block and changes in pacing mode during long-term follow-up of 399 consecutive patients with sick sinus syndrome treated with an AAI/AAIR pacemaker. Pacing Clin Electrophysiol. 2001;24:358-365.
192 Karpawich PP, Gates J, Stokes KB. Septal His-Purkinje ventricular pacing in canines: a new endocardial electrode approach. PACE. 1992;15:2011-2015.
193 Scherlag BJ, Kosowsky BD, Damato AN. A technique for ventricular pacing from the His bundle of the intact heart. Am J Physiol. 1967;22:584-587.
194 Deshmukh P, Casavant DA, Romanyshyn M, Anderson K. Permanent, direct His-bundle pacing: a novel approach to cardiac pacing in patients with normal His-Purkinje activation. Circulation. 2000;101:869-877.
195 Zanon F, Bacchiega E, Rampin L, et al. Direct His bundle pacing preserves coronary perfusion compared with right ventricular apical pacing: a prospective, cross-over mid-term study. Europace. 2008;10:580-587.
196 De Cock CC, Giudici MC, Twisk JW. Comparison of the haemodynamic effects of right ventricular outflow-tract pacing with right ventricular apex pacing: a quantitative review. Europace. 2003;5:275-278.
197 Buckingham TA, Candinas R, Schlapfer J, et al. Acute hemodynamic effects of atrioventricular pacing at different sites in the right ventricle individually and simultaneously. PACE. 1997;20:909-915.
198 Tse HF, Yu C, Wong KK, et al. Functional abnormalities in patients with permanent right ventricular pacing: the effect of sites of electrical stimulation. J Am Coll Cardiol. 2002;40:1451-1458.
199 Puggioni E, Brignole M, Gammage M, et al. Acute comparative effect of right and left ventricular pacing in patients with permanent atrial fibrillation. J Am Coll Cardiol. 2004;21:234-238.
200 Turner MS, Bleasdale RA, Vinereanu D, et al. Electrical and mechanical components of dyssynchrony in heart failure patients with normal QRS duration and left bundle branch block: impact of left and biventricular pacing. Circulation. 2004;109:2544-2549.
201 Wyman BT, Hunter WC, Prinzen FW, McVeigh ER. Mapping propagation of mechanical activation in the paced heart with MRI tagging. Am J Physiol. 1999;276:H881-H891.
202 Etienne Y, Mansourati J, Gilard M, et al. Evaluation of left ventricular based pacing in patients with congestive heart failure and atrial fibrillation. Am J Cardiol. 1999;83:1138-1140.
203 Tyers GFO. Comparison of the effect on cardiac function of single-site and simultaneous multiple site ventricular stimulation after A-V block. J Thorac Cardiovasc Surg. 1970;59:211-217.
204 Gebauer RA, Tomek V, Kubus P, et al. Differential effects of the site of permanent epicardial pacing on left ventricular synchrony and function in the young: implications for lead placement. Europace. 2009;11:1654-1659.
205 Vanagt WY, Prinzen FW, Delhaas T. Reversal of pacing-induced heart failure by left ventricular apical pacing. N Engl J Med. 2007;357:2637-2638.
206 Jais P, Takahashi A, Garrigue S, et al. Mid-term follow-up of endocardial biventricular pacing. Pacing Clin Electrophysiol. 2000;23:1744-1747.
207 Fei L, Wrobleski D, Groh W, et al. Effects of multisite ventricular pacing on cardiac function in normal dogs and dogs with heart failure. J Cardiovasc Electrophysiol. 1999;10:935-946.
208 Hay I, Melenovsky V, Fetics BJ, et al. Short-term effects of right-left heart sequential cardiac resynchronization in patients with heart failure, chronic atrial fibrillation, and atrioventricular nodal block. Circulation. 2004;110:3404-3410.
209 Wyman BT, Hunter WC, Prinzen FW, et al. Effects of single- and biventricular pacing on temporal and spatial dynamics of ventricular contraction. Am J Physiol Heart Circ Physiol. 2002;282:H372-H379.
210 Nielsen JC, Pedersen AK, Mortensen PT, Andersen HR. Programming a fixed long atrioventricular delay is not effective in preventing ventricular pacing in patients with sick sinus syndrome. Europace. 1999;1:113-120.
211 Olshansky B, Day J, McGuire M, et al. Inhibition of unnecessary RV pacing with AV search hysteresis in ICDs (INTRINSIC RV): design and clinical protocol. Pacing Clin Electrophysiol. 2005;28:62-66.
212 Sweeney MO, Shea JB, Fox V, et al. Randomized pilot study of a new atrial-based minimal ventricular pacing mode (MVP) in dual-chamber implantable cardioverter-defibrillators. Heart Rhythm. 2004;1:160-167.
213 Sweeney MO, Ellenbogen KA, Casavant D, et al. Multicenter, prospective, randomized safety and efficacy study of a new atrial-based managed ventricular pacing mode (MVP) in dual chamber ICDs. J Cardiovasc Electrophysiol. 2005;16:811-817.
214 Sweeney MO, Bank AJ, Nsah E, et al. Minimizing ventricular pacing to reduce atrial fibrillation in sinus-node disease. N Engl J Med. 2007;357:1000-1008.
215 Sweeney MO, Ellenbogen KA, Tang AS, et al. Severe atrioventricular decoupling, uncoupling, and ventriculoatrial coupling during enhanced atrial pacing: incidence, mechanisms, and implications for minimizing right ventricular pacing in ICD patients. J Cardiovasc Electrophysiol. 2008;19:1175-1180.
216 Bakker PF, Meijburg HW, de Vries JW, et al. Biventricular pacing in end-stage heart failure improves functional capacity and left ventricular function. J Interv Card Electrophysiol. 2000;4:395-404.
217 Cazeau S, Ritter P, Lazarus A, et al. Multisite pacing for end-stage heart failure: early experience. Pacing Clin Electrocardiol. 1996;19:1748-1757.
218 Butter C, Auricchio A, Stellbrink C, et al. Effect of resynchronization therapy stimulation site on the systolic function of heart failure patients. Circulation. 2001;104:3026-3029.
219 Blanc JJ, Etienne Y, Gilard M, et al. Evaluation of different ventricular pacing sites in patients with severe heart failure: results of an acute hemodynamic study. Circulation. 1997;96:3273-3277.
220 Kass DA, Chen C-H, Curry C, et al. Improved left ventricular mechanics from acute VDD pacing in patients with dilated cardiomyopathy and ventricular conduction delay. Circulation. 1999;99:1567-1573.
221 Cazeau S, Leclercq C, Lavergne T, et al. Effects of multisite biventricular pacing in patients with heart failure and intraventricular conduction delay. N Engl J Med. 2001;344:873-880.
222 Cleland JG, Daubert JC, Erdmann E, et al. The effect of cardiac resynchronization on morbidity and mortality in heart failure. N Engl J Med. 2005;352:1539-1549.
223 Abraham WT, Fisher WG, Smith AL, et al. Cardiac resynchronization in chronic heart failure. N Engl J Med. 2002;346:1845-1853.
224 Parsai C, Bijnens B, Sutherland GR, et al. Toward understanding response to cardiac resynchronization therapy: left ventricular dyssynchrony is only one of multiple mechanisms. Eur Heart J. 2009;30:940-949.
225 Yu CM, Chau E, Sanderson JE, et al. Tissue Doppler echocardiographic evidence of reverse remodeling and improved synchronicity by simultaneously delaying regional contraction after biventricular pacing therapy in heart failure. Circulation. 2002;105:438-445.
226 Dekker AL, Phelps B, Dijkman B, et al. Epicardial left ventricular lead placement for cardiac resynchronization therapy: optimal pace site selection with pressure-volume loops. J Thorac Cardiovasc Surg. 2004;127:1641-1647.
227 Van Gelder BM, Bracke FA, Meijer A, et al. Effect of optimizing the VV interval on left ventricular contractility in cardiac resynchronization therapy. Am J Cardiol. 2004;93:1500-1503.
228 Bleasdale RA, Turner MS, Mumford CE, et al. Left ventricular pacing minimizes diastolic ventricular interaction, allowing improved preload-dependent systolic performance. Circulation. 2004;110:2395-2400.
229 Williams LK, Ellery S, Patel K, et al. Short-term hemodynamic effects of cardiac resynchronization therapy in patients with heart failure, a narrow QRS duration, and no dyssynchrony. Circulation. 2009;120:1687-1694.
230 Adamson PB, Kleckner K, Van Hout WL, et al. Cardiac resynchronization therapy improves heart rate variability in patients with symptomatic heart failure. J Am Coll Cardiol. 2003;108:266-269.
231 St John Sutton MG, Plappert T, Abraham WT, et al. Effect of cardiac resynchronization therapy on left ventricular size and function in chronic heart failure. Circulation. 2003;107:1985-1990.
232 Spragg DD, Leclercq C, Loghmani M, et al. Regional alterations in protein expression in the dyssynchronous failing heart. Circulation. 2003;108:929-932.
233 St John Sutton M, Ghio S, Plappert T, et al. Cardiac resynchronization induces major structural and functional reverse remodeling in patients with New York Heart Association Class I/II heart failure. Circulation. 2009;120:1858-1865.
234 Van Geldorp IE, Vernooy K, Delhaas T, et al. Beneficial effects of biventricular pacing in chronically right ventricular–paced patients without severe heart failure. Europace. 2010;12:223-229.
235 Dubin AM, Feinstein JA, Reddy VM, et al. Electrical resynchronization: a novel therapy for the failing right ventricle. Circulation.. 2003;107:2287-2289.
236 Thambo JB, Dos Santos P, De Guillebon M, et al. Biventricular stimulation improves right and left ventricular functions after tetralogy of Fallot repair: acute animal and clinical studies. Heart Rhythm. 2010;7:344-350.
237 Delhaas T, Prinzen FW. Right ventricular or biventricular pacing in repaired tetralogy of Fallot? Heart Rhythm. 2010;7:351-352.
238 Pitzalis MV, Iacoviello M, Romito R, et al. Cardiac resynchronization therapy tailored by echocardiographic evaluation of ventricular asynchrony. J Am Coll Cardiol. 2002;40:1615-1622.
239 Penicka M, Bartunek J, De Bruyne B, et al. Improvement of left ventricular function after cardiac resynchronization therapy is predicted by tissue Doppler imaging echocardiography. Circulation. 2004;109:978-983.
240 Yu Y, Kramer A, Spinelli J, et al. Biventricular mechanical asynchrony predicts hemodynamic effect of uni- and biventricular pacing. Am J Physiol. 2003;285:H2788-H2796.
241 Zwanenburg JJ, Götte MJ, Marcus JT, et al. Propagation of onset and peak time of myocardial shortening in time of myocardial shortening in ischemic versus nonischemic cardiomyopathy: assessment by magnetic resonance imaging myocardial tagging. J Am Coll Cardiol. 2005;46:2215-2222.
242 Bax JJ, Molhoek SG, van Erven L, et al. Usefulness of myocardial tissue Doppler echocardiography to evaluate left ventricular dyssynchrony before and after biventricular pacing in patients with idiopathic dilated cardiomyopathy. Am J Cardiol. 2003;91:94-97.
243 Garrigue S, Jais P, Espil G, et al. Comparison of chronic biventricular pacing between epicardial and endocardial left ventricular stimulation using Doppler tissue imaging in patients with heart failure. Am J Cardiol. 2001;88:858-862.
244 De Boeck BWL, Meine M, Leenders GE, et al. Practical and conceptual limitations of tissue Doppler imaging to predict reverse remodelling in cardiac resynchronisation therapy. Eur J Heart Failure. 2008;10:281-290.
245 Bilchick KC, Dimaano V, Wu KC, et al. Cardiac magnetic resonance assessment of dyssynchrony and myocardial scar predicts function class improvement following cardiac resynchronization therapy. JACC Cardiovasc Imaging. 2008;1:561-568.
246 Chung ES, Leon AR, Tavazzi L, et al. Results of the predictors of response to CRT (PROSPECT) trial. Circulation. 2008;117:2608-2616.
247 Beshai JF, Grimm RA, Nagueh SF, et al. Cardiac resynchronization therapy in heart failure with narrow QRS complexes. N Engl J Med. 2007;357:2461-2471.
248 Rüssel IK, Zwanenburg JJ, Germans T, et al. Mechanical dyssynchrony or myocardial shortening as MRI predictor of response to biventricular pacing? J Magn Reson Imaging. 2007;26:1452-1460.
249 Kirn B, Jansen A, Bracke F, et al. Mechanical discoordination rather than dyssynchrony predicts reverse remodeling upon cardiac resynchronization. Am J Physiol. 2008;295:H640-H646.
250 Haghjoo M, Bonakdar HR, Jorat MV, et al. Effect of right ventricular lead location on response to cardiac resynchronization therapy in patients with end-stage heart failure. Europace. 2009;11:356-363.
251 Bulava A, Lukl J. Similar long-term benefits conferred by apical versus mid-septal implantation of the right ventricular lead in recipients of cardiac resynchronization therapy systems. Pacing Clin Electrophysiol. 2009;32(Suppl 1):32-37.
252 Helm RH, Byrne M, Helm PA, et al. Three-dimensional mapping of optimal left ventricular pacing site for cardiac resynchronization. Circulation. 2007;115:953-961.
253 Rademakers L, van Kerckhoven R, van Deursen CJM, et al. Myocardial infarction does not preclude electrical and hemodynamic benefits of CRT in dyssynchronous canine hearts. Circulation Arrhythm Electrophysiol. 2010;3:361-368.
254 Gasparini M, Mantica M, Galimberti P, et al. Is the left ventricular lateral wall the best lead implantation site for cardiac resynchronization therapy? Pacing Clin Electrophysiol. 2003;26:162-168.
255 Ansalone G, Giannantoni P, Ricci R, et al. Doppler myocardial imaging to evaluate the effectiveness of pacing sites in patients receiving biventricular pacing. J Am Coll Cardiol. 2002;39:489-499.
256 Jaïs P, Douard H, Shah DC, et al. Endocardial biventricular pacing. Pacing Clin Electrophysiol. 1998;21:2128-2131.
257 Van Gelder BM, Scheffer MG, Meijer A, Bracke FA. Transseptal endocardial left ventricular pacing: an alternative technique for coronary sinus lead placement in cardiac resynchronization therapy. Heart Rhythm. 2007;4:454-460.
258 Pasquié JL, Massin F, Macia JC, et al. Long-term follow-up of biventricular pacing using a totally endocardial approach in patients with end-stage cardiac failure. Pacing Clin Electrophysiol. 2007;30(Suppl 1):31-33.
259 Derval N, Steendijk P, Gula LJ, et al. Optimizing hemodynamics in heart failure patients by systematic screening of left ventricular pacing sites: the lateral left ventricular wall and the coronary sinus are rarely the best sites. J Am Coll Cardiol. 2010;55:566-575.
260 Bleeker GB, Kaandorp TA, Lamb HJ, et al. Effect of posterolateral scar tissue on clinical and echocardiographic improvement after cardiac resynchronization therapy. Circulation. 2006;113:969-976.
261 Leon AR, Greenberg JM, Kanuru N, et al. Cardiac resynchronization in patients with congestive heart failure and chronic atrial fibrillation: effect of upgrading to biventricular pacing after chronic right ventricular pacing. J Am Coll Cardiol. 2002;39:1258-1263.
262 Valls-Bertault V, Fatemi M, Gilard M, et al. Assessment of upgrading to biventricular pacing in patients with right ventricular pacing and congestive heart failure after atrioventricular junctional ablation for chronic atrial fibrillation. Europace. 2004;6:438-443.
263 Brignole M, Gammage M, Puggioni E, et al. Comparative assessment of right, left, and biventricular pacing in patients with permanent atrial fibrillation. Eur Heart J. 2005;26:712-722.
264 Leclercq C, Walker S, Linde C, et al. Comparative effects of permanent biventricular and right-univentricular pacing in heart failure patients with chronic atrial fibrillation. Eur Heart J. 2002;23:1780-1787.
265 Peschar M, Vernooy K, Vanagt WYR, et al. Absence of reverse electrical remodeling during regression of volume overload hypertrophy in canine ventricles. Cardiovasc Res. 2003;58:510-517.
266 Touiza A, Etienne Y, Gilard M, et al. Long-term left ventricular pacing: assessment and comparison with biventricular pacing in patients with severe congestive heart failure. J Am Coll Cardiol. 2001;38:1966-1970.
267 Blanc JJ, Bertault-Valls V, Fatemi M, et al. Midterm benefits of left univentricular pacing in patients with congestive heart failure. Circulation. 2003;109:1741-1744.
268 Rao RK, Kumar UN, Schafer J, et al. Reduced ventricular volumes and improved systolic function with cardiac resynchronization therapy: a randomized trial comparing simultaneous biventricular pacing, sequential biventricular pacing, and left ventricular pacing. Circulation. 2007;115:2136-2144.
269 Wilkoff BL, Kudenchuk PJ, Buxton AE, et al. The DAVID (Dual Chamber and VVI Implantable Defibrillator) II trial. J Am Coll Cardiol. 2009;53:872-880.
270 Delnoy PP, Ottervanger JP, Luttikhuis HO, et al. Comparison of usefulness of cardiac resynchronization therapy in patients with atrial fibrillation and heart failure versus patients with sinus rhythm and heart failure. Am J Cardiol. 2007;99:1252-1257.
271 Molhoek SG, Bax JJ, Bleeker GB, et al. Comparison of response to cardiac resynchronization therapy in patients with sinus rhythm versus chronic atrial fibrillation. Am J Cardiol. 2004;94:1506-1509.
272 Gasparini M, Auricchio A, Metra M, et al. Long-term survival in patients undergoing cardiac resynchronization therapy: the importance of performing atrioventricular junction ablation in patients with permanent atrial fibrillation. Eur Heart J. 2008;29:1644-1652.
273 Van Gelder BM, Meijer A, Bracke FA. The optimized V-V interval determined by interventricular conduction times versus invasive measurement by LVdP/dtmax. J Cardiovasc Electrophysiol. 2008;19:939-944.
274 Whinnett ZI, Davies JE, Willson K, et al. Determination of optimal atrioventricular delay for cardiac resynchronization therapy using acute non-invasive blood pressure. Europace. 2006;8:358-366.
275 Van Geldorp I, Delhaas T, Hermans B, et al. Comparison of a non-invasive arterial pulse contour technique and echo Doppler aorta velocity-time integral on stroke volume changes in optimization of cardiac resynchronization therapy. Europace. 2011;13:87-95.
276 Tassin A, Kobeissi A, Vitali L, et al. Relationship between amplitude and timing of heart sounds and endocardial acceleration. Pacing Clin Electrophysiol. 2009;32(Suppl 1):101-104.
277 Baker JH, Jr McKenzie, Beau S, et al. Acute evaluation of programmer-guided AV/PV and VV delay optimization comparing an IEGM method and echocardiogram for cardiac resynchronization therapy in heart failure patients and dual-chamber ICD implants. J Cardiovasc Electrophysiol. 2007;18:185-191.
278 Kamdar R, Frain E, Warburton F, et al. A prospective comparison of echocardiography and device algorithms for atrioventricular and interventricular interval optimization in cardiac resynchronization therapy. Europace. 2010;12:84-91.
279 Gold MR, Niazi I, Giudici M, et al. A prospective comparison of AV delay programming methods for hemodynamic optimization during cardiac resynchronization therapy. J Cardiovasc Electrophysiol. 2007;18:490-496.
279a Ellenbogen KA, Gold MR, Meyer TE, et al. Primary results from the SmartDelay Determined AV Optimization: A Comparison to Other AV Delay Methods Used in Cardiac Resynchronization Therapy (SMART-AV) Trial. Circulation. 2010;122:2660-2668.
280 Delnoy PP, Lunati M, Nagele H, et al. Periodic VV and AV delays optimization in cardiac resynchronization therapy improves patients’ clinical outcome: results from the CLEAR study. Heart Rhythm. 2010;5:S55.
281 Abraham WT, Gras D, Yu CM, et al. Results from the FREDOM trial: assess the safety and efficacy of frequent optimization of cardiac resynchronization therapy. Am Heart J. 2010;159:944-948.
282 León AR, Abraham WT, Brozena S, et al. Cardiac resynchronization with sequential biventricular pacing for the treatment of moderate-to-severe heart failure. J Am Coll Cardiol. 2005;46:2298-2304.
283 Sogaard P, Egeblad H, Kim WY, et al. Tissue Doppler imaging predicts improved systolic performance and reversed left ventricular remodeling during long-term cardiac resynchronization therapy. J Am Coll Cardiol. 2002;40:723-730.
284 Whinnett ZI, Davies JE, Willson K, et al. Haemodynamic effects of changes in atrioventricular and interventricular delay in cardiac resynchronisation therapy show a consistent pattern: analysis of shape, magnitude and relative importance of atrioventricular and interventricular delay. Heart. 2006;92:1628-1634.
285 Vanderheyden M, De Backer T, Rivero-Ayerza M, et al. Tailored echocardiographic interventricular delay programming further optimizes left ventricular performance after cardiac resynchronization therapy. Heart Rhythm. 2005;2:1066-1072.
286 Boriani G, Biffi M, Müller CP, et al. A prospective randomized evaluation of VV delay optimization in CRT-D recipients: echocardiographic observations from the RHYTHM II ICD study. Pacing Clin Electrophysiol. 2009;32(Suppl 1):120-125.
287 Levine PA, Seltzer JP, Pirzada FA. The “pacemaker syndrome” in a properly functioning physiologic pacing system. Pacing Clin Electrophysiol. 1983;6:279-282.
288 Den Dulk K, Lindemans FW, Brugada P, et al. Pacemaker syndrome with AAI rate variable pacing: importance of atrioventricular conduction properties, medication and pacemaker programmability. Pacing Clin Electrophysiol. 1988;11:1226-1233.
289 Torresani J, Ebagost A, Alland-Latour G. Pacemaker syndrome with DDD pacing. Pacing Clin Electrophysiol. 1984;7:1148-1151.
290 Pierantozzi A, Bocconcelli P. DDD pacemaker syndrome and atrial conduction time. Pacing Clin Electrophysiol. 1994;17:374-376.
291 Mary DASG. Electrophysiology of atrial receptors. In: Hainsworth RMK, Mary DASG, editors. Cardiogenic reflexes. Oxford: Oxford Scientific; 1987:3.
292 Hainsworth R. Reflexes from the heart. Physiol Rev. 1991;71:617-658.
293 Ellenbogen KA, Thames MD, Mohanty PK. Importance of regurgitant fraction for left ventricular end-systolic wall stress to end-systolic volume ratio in patients with chronic mitral regurgitation. Am J Cardiol. 1990;65:53-59.
294 Ellenbogen KA, Wood MA, Stambler B. Clinical, hemodynamic and neurohumoral features. In: Barold SS, Mujica J, editors. New perspectives in cardiac pacing. NY, Futura: Mt Kisco, 1992.
295 Vardas PE, Travill CM, Williams TDM, et al. Effect of dual-chamber pacing on raised plasma atrial natriuretic peptide concentrations in complete atrioventricular block. Br Med J. 1988;296:94.
296 Ellenbogen KA, Kapadia K, Walsh M, et al. Increase in plasma atrial natriuretic factor during ventriculoatrial pacing. Am J Cardiol. 1989;64:236-237.
297 Bristow MR, Saxon LA, Boehmer J, et al. Cardiac-resynchronization therapy with or without an implantable defibrillator in advanced chronic heart failure. N Engl J Med. 2004;350:2140-2150.
298 Pieterse MG, den Dulk K, van Gelder BM, et al. Programming a long pace atrioventricular interval may be risky in DDDR pacing. Pacing Clin Electrophysiol. 1994;17:252-257.
299 Shemin RJ, Scott WC, Kastl DG, et al. Hemodynamic effects of various modes of cardiac pacing after operation for idiopathic hypertrophic subaortic stenosis. Ann Thorac Surg. 1979;27:137.
300 Gross JN, Keltz TN, Cooper JA, et al. Profound “pacemaker syndrome” in hypertrophic cardiomyopathy. Am J Cardiol. 1992;70:1507-1511.
301 Jeanrenaud X, Goy JJ, Kappenberger L. Effects of dual-chamber pacing in hypertrophic obstructive cardiomyopathy. Lancet. 1992;339:1318-1823.
302 Nishimura RA, Trusty JM, Hayes DL, et al. Dual-chamber pacing for hypertrophic cardiomyopathy. J Am Coll Cardiol. 1997;29:435-441.
303 Maron BJ. Hypertrophic cardiomyopathy: a systematic review. JAMA. 2002;287:1308-1320.
304 Mohiddin SA, Page SP. Long-term benefits of pacing in obstructive hypertrophic cardiomyopathy. Heart. 2010;96:328-330.
305 Galve E, Sambola A, Saldaña G, et al. Late benefits of dual-chamber pacing in obstructive hypertrophic cardiomyopathy: a 10-year follow-up study. Heart. 2010;96:352-356.
306 Cannon RO, Tripodi D, Dilsizian V, et al. Results of permanent dual-chamber pacing in symptomatic nonobstructive hypertrophic cardiomyopathy. Am J Cardiol. 1994;73:571-575.