Chapter 3 Basic haematological techniques
All the tests discussed in this chapter can be performed on venous or free-flowing capillary blood that has been anticoagulated with ethylenediaminetetra-acetic acid (EDTA) (see p. 6). Thorough mixing of the blood specimen before sampling is essential for accurate test results. Ideally, tests should be performed within 6 h of obtaining the blood specimen because some test results are altered by longer periods of storage. However, results that are sufficiently reliable for clinical purposes can usually be obtained on blood stored for up to 24 h at 4°C (see p. 7).
Haemoglobinometry
The haemoglobin concentration (Hb) of a solution may be estimated by measurement of its colour, by its power of combining with oxygen or carbon monoxide or by its iron content. The methods to be described are all colour or light-intensity matching techniques, which also measure, to a varying extent, any methaemoglobin (Hi) or sulphaemoglobin (SHb) that may be present. The oxygen-combining capacity of blood is 1.34 ml O2 per g haemoglobin. Ideally, for assessing clinical anaemia, a functional estimation of Hb should be carried out by measurement of oxygen capacity, but this is hardly practical in the routine haematology laboratory. It gives results that are at least 2% lower than those given by the other methods, probably because a small proportion of inert pigment is always present. The iron content of haemoglobin can be estimated accurately,1 but again the method is impractical for routine purposes. Estimations based on iron content are generally taken as authentic, but iron bound to inactive pigment is included. Iron content is converted into haemoglobin by assuming the following relationship: 0.347 g iron = 100 g haemoglobin.2
Measurement of haemoglobin concentration using a spectrometer (spectrophotometer) or photoelectric colorimeter
Although the HiCN reagent contains cyanide, there is only 50 mg of potassium cyanide per litre and 600–1000 ml would have to be swallowed to produce serious effects. However, the use of potassium cyanide has been viewed as a potential hazard; alternative nonhazardous reagents that have been proposed are sodium azide3 and sodium lauryl sulphate,4,5 which convert haemoglobin to haemiglobinazide and haemiglobinsulphate, respectively. They are used in some automated systems, but no stable standards are available and they, too, are toxic substances that must be handled with care.
Other methods that have been used include Sahli’s acid-haematin method, which is less accurate because the colour develops slowly, is unstable and begins to fade almost immediately after it reaches its peak. The alkaline-haematin method gives a true estimate of total Hb even if carboxyhaemoglobin (HbCO), Hi or SHb is present; plasma proteins and lipids have little effect on the development of colour, although they cause turbidity. The original method was more cumbersome and less accurate than the HiCN or HbO2 methods, but a modified method has been developed in which blood is diluted in an alkaline solution with non-ionic detergent and read in a spectrometer at an absorbance of 575 nm against a standard solution of chlorohaemin.6,7 One evaluation has given encouraging results,8 although another study has shown a bias of 2.6% when compared with the reference method, with non-linearity in the relationship between haemoglobin concentration and absorbance at high and low haemoglobins.9
Haemiglobincyanide (cyanmethaemoglobin) method
The haemiglobincyanide (cyanmethaemoglobin) method is the internationally recommended method2 for determining the haemoglobin concentration of blood. In some countries cyanide reagents are no longer available. The basis of the method is dilution of blood in a solution containing potassium cyanide and potassium ferricyanide. Haemoglobin, Hi and HbCO, but not SHb, are converted to HiCN. The absorbance of the solution is then measured in a spectrometer at a wavelength of 540 nm or a photoelectric colorimeter with a yellow-green filter (e.g. Ilford 625, Wratten 74, Chance 0 Gr1).
Diluent
The original (Drabkin’s) reagent had a pH of 8.6. The following modified solution listed in Table 3.1, Drabkin-type reagent, as recommended by the International Committee for Standardization in Haematology (ICSH),2 has a pH of 7.0–7.4. It is less likely to cause turbidity from precipitation of plasma proteins and requires a shorter conversion time (3–5 min) than the original Drabkin’s solution, but it has the disadvantage that the detergent causes some frothing.
| Potassium ferricyanide (0.607 mmol/l) | 200 mg |
| Potassium cyanide (0.768 mmol/l) | 50 mg |
| Potassium dihydrogen phosphate (1.029 mmol/l) | 140 mg |
| Non-ionic detergenta | 1 ml |
| Distilled or deionized water | To 1 litre |
a Suitable non-ionic detergents include Nonidet P40 (VWR International, Merck, Eurolab) and Triton X-100 (Aldrich).
Haemiglobincyanide Reference Standard
With the advent of HiCN solution, which is stable for many years, other standards have become outmoded.10 The International Committee for Standardization in Haematology2 has defined specifications on the basis of a relative molecular mass (molecular weight) of human haemoglobin of 64 458 (i.e. 16 114 as the monomer) and a millimolar area absorbance (coefficient extinction) of 11.0 (that is, the absorbance at 540 nm of a solution containing 55.8 mg of haemoglobin iron per litre).
Some standards are prepared from ox blood, which has the same coefficient extinction but a molecular weight of 64 532 (16 133 as the monomer). These specifications have been widely adopted; a World Health Organization (WHO) International Standard has been established and a comparable reference material is available from the ICSH. A new lot of the haemoglobincyanide or haemoglobin standard was released in 2008.11 This newly released standard replaces the previous lot and was produced using the same methodology previously specified by ICSH.2 The current standard has an assigned concentration value of 574.2 (± 5.1) mg/l or 35.63 (± 0.32) μmol/l; the exact concentration is indicated on the label. The stability expectation of this standard is 15 years11 but it will continue to be monitored on a twice-yearly basis over the lifetime of this lot of reference material. The haemoglobin standard provides a reference material from which both laboratory-based cell counters and point-of-care instruments calibrate their haemoglobin methods.2
Calculation of Haemoglobin Concentration
Preparation of Standard Graph and Standard Table
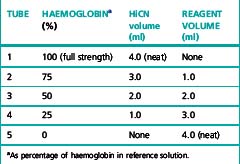
Prepare five dilutions of the HiCN reference standard (or equivalent preparation) (brought to room temperature) with the cyanide-ferricyanide reagent according to Table 3.2. Because the graph will be used to determine the haemoglobin measurements, it is essential that the dilutions are performed accurately.
Table 3.2 Dilutions of haemiglobincyanide (HiCN) reference solution for preparation of standard graph
The rate of conversion of blood containing HbCO is markedly slow. This difficulty can be overcome by prolonging the reaction time to 30 min before reading.12 The difference between the 5 and 30 min readings can be used as a semiquantitative method for estimating the percentage of HbCO in the blood.
As referred to earlier, lauryl sulphate5 or sodium azide3 can be used as non-hazardous substitutes for potassium cyanide. However, no stable standards are available for these methods so a sample of blood that has first had a haemoglobin value assigned by the HiCN method needs to be used as a secondary standard.
Abnormal plasma proteins or a high leucocyte count may result in turbidity when the blood is diluted in the Drabkin-type reagent. The turbidity can be avoided by centrifuging the diluted sample or by increasing the concentration of potassium dihydrogen phosphate to 33 mmol/l (4.0 g/l).13
Oxyhaemoglobin method
The HbO2 method is the simplest and quickest method for general use with a photometer. Its disadvantage is that it is not possible to prepare a stable HbO2 standard, so the calibration of these instruments should be checked regularly using HiCN reference solutions or a secondary standard of preserved blood or lysate (see p. 25). The reliability of the method is not affected by a moderate increase in plasma bilirubin, but it is not satisfactory in the presence of HbCO, Hi or SHb.
Standard
A standard should be prepared from a specimen of normal anticoagulated whole blood. Its haemoglobin concentration is first determined by the HiCN method (see p. 25). The blood is then diluted 1:201 by pipetting 20 ml of the well-mixed blood into 4 ml of ammonia; sequential dilutions are made in ammonia and absorbance is read in a spectrometer at 540 nm or photometer using a yellow-green filter (Ilford 625, Wratten 74 or Chance 0 Gr 1). The readings are plotted on arithmetic graph paper. Linearity of response is checked and absorbance is related to haemoglobin from the measurement obtained in the original sample by the HiCN method.
Colorimeters and light filters unfortunately, differ sufficiently to make it essential to check the chosen standard at frequent intervals against a HiCN reference preparation in the photometer in which it is going to be used. It is probably preferable to use a new fresh whole-blood sample each day as a secondary standard after measuring its haemoglobin concentration by the HiCN method. Preserved blood (see p. 599) or lysate (see p. 599) can be used instead.
Direct calculation from a standard:
Direct spectrometry
The haemoglobin concentration of a diluted blood sample can be determined by spectrometry without the need for a standard, provided that the spectrometer has been correctly calibrated. The blood is diluted 1:201 (or 1:251) with cyanide-ferricyanide reagent (see p. 25) and the absorbance is measured at 540 nm. Haemoglobin concentration is calculated as follows:
When assigning a value to a haemoglobin solution that may be used as a reference preparation, it is necessary first to calibrate the spectrometer. This requires checking wavelength with a holmium oxide filter, absorbance with a set of calibrated neutral density filters and stray light with a neutral density filter at 220 nm (National Physical Laboratory, Teddington, UK). Matched optical or quartz glass cuvettes with a transmission difference of <1% at 200 nm should be used. Subsequently, the calibration of the spectrophotometer can be checked by verifying that it gives an accurate reading of the HiCN standard. Slight deviations from the expected A540 HiCN value for the standard may be used to correct the results of test samples for a bias in measurement.2
Direct reading portable haemoglobinometers
Colour Comparators
These are simple clinical devices that compare the colour of blood against a range of colours representing haemoglobin concentrations. They are intended for anaemia screening in the absence of laboratory facilities and are described in Chapter 26.
Portable Haemoglobinometers
The HemoCue system (HemoCue AB, Ängelsholm, Sweden) is a well-established method for haemoglobinometry. It consists of a precalibrated, portable, battery-operated spectrometer; no dilution is necessary because blood is run by capillary action directly into a cuvette containing sodium nitrite and sodium azide, which convert the haemoglobin to azidemethaemoglobin. The absorbance is measured at wavelengths of 565 and 880 nm. Measurements are not affected by high levels of bilirubin, lipids or white cells and it is sufficiently reliable for use as a laboratory instrument; it is easy for non-technical personnel to operate and is thus also suitable for use at point-of-care. The cuvettes must be stored in a container with a drying agent and kept within the temperature range of 15–30°C. Some devices are now available that use reagent-free cuvettes that will not deteriorate in adverse climatic conditions.14 HemoCue have recently released a portable system that measures both haemoglobin and the white blood cell count (WBC), the HemoCue WBC.15
The DiaSpect Haemoglobinometry system is a newly developed technology for measuring haemoglobin concentration in unaltered whole blood in a special plastic cuvette that also serves as the sampling device.16 The instrument is a portable spectrophotometer powered by 3.6 V integrated lithium-ion rechargeable batteries or 100–240 V adaptor. As the cuvettes do not contain any reagents, they are not affected by temperature or humidity and no special storage conditions are required. They have a shelf life of at least 2 years. Haemoglobin fractions are measured from absorbance wavelengths between 400 and 800 nm. A patented method eliminates the impact of scattering from the blood cells while possible background turbidity from interfering substances is measured and compensated for at high wavelength. The results are displayed in <5 seconds. Preliminary studies have shown an accuracy within ± 3 g/l for measurements between 10 and 200 g/l.
Non-invasive Screening Tests
Methods are being developed for using near infrared spectroscopy at body sites, mainly a finger, to identify the spectral pattern of haemoglobin in an underlying blood vessel and derive a measurement of haemoglobin concentration. Early studies have shown an approximate correlation with blood haemoglobinometry.17,18
Range of Haemoglobin Concentration in Health
See Chapter 2, Tables 2.1, 2.2 and 2.3. It should be noted that there are sex differences, diurnal variations and environmental and physiological factors that must also be taken into account.
Packed cell volume or haematocrit
Microhaematocrit Method
The microhaematocrit method19 is carried out on blood contained in capillary tubes 75 mm in length and having an internal diameter of about 1 mm. The tubes may be plain for use with anticoagulated blood samples or coated inside with 1 iu of heparin for the direct collection of capillary blood. The centrifuge used for the capillary tubes provides a centrifugal force of c12 000 g and 5 min centrifugation results in a constant PCV. When the PCV is >0.5, it may be necessary to centrifuge for a further 5 min.
Accuracy of Microhaematocrit
The microhaematocrit method has an adequate level of accuracy and precision for clinical utility.20 However, attention must be paid to a number of factors that may produce an inaccurate result.
Blood Sample
Failure to mix the blood sample adequately will produce an inaccurate result. The degree of oxygenation of the blood also affects the result because the PCV of venous blood is ≈2% higher than that of fully aerated blood (which has lost CO2 and taken up O2).21 To ensure adequate oxygenation and sample mixing, the free air space above the sample should be >20% of the container volume.
Capillary Tubes
Variation of the bore of the tubes may cause serious errors if they are not within the narrow limits of defined specifications that should be met by manufacturers: length 75 ± 0.5 mm; internal diameter 1.07–1.25 mm; wall thickness 0.18–0.23 mm; and bore taper not exceeding 2% of the internal diameter over the entire length of the tube.20
Plasma Trapping
The amount of plasma trapped between red cells, especially in the lower end of the red cell column, and red cell dehydration during centrifugation generally counterbalance each other and the error caused by trapped plasma is usually not more than 0.01 PCV units. Thus, in routine practice, it is unnecessary to correct for trapped plasma, but if the PCV is required for calibrating a blood cell analyser or for calculating blood volume, the observed PCV should be reduced by a 2% correction factor after it has been centrifuged for 5 min or for 10 min with polycythaemic blood.22 It is, however, preferable to use the surrogate reference method.23 Plasma trapping is increased in macrocytic anaemias,24 spherocytosis, thalassaemia, hypochromic anaemias and sickle cell anaemia;25 it may be as high as 20% in sickle cell anaemia if all the cells are sickled.24
International Council for Standardization in Haematology Reference Method
Haemoglobin concentration is measured by the routine method on blood specimens with a range of haemoglobin concentrations. Samples of the same specimens are then taken into special borosilicate glass capillary tubes, which are centrifuged for 5 min or longer to achieve full red cell packing. The tubes are then broken at the midpoint of the packed red cells, blood is extracted with a micropipette and its haemoglobin concentration is measured. PCV is calculated as the ratio of the Hb of whole blood to that of the packed cells. This method26 is appropriate for instrument and reagent manufacturers, but it is time-consuming and requires significant expertise, which makes it impractical for occasional use in routine laboratories. Accordingly, the International Council for Standardization in Haematology (ICSH) has developed a ‘surrogate reference method’.23
Surrogate Reference Method
Equipment
Method
This formula applies only to the specified capillary tubes; other tubes require specific validation by the ICSH reference method22 so that an appropriate formula can be derived. If the surrogate reference measurements are to be used to validate equipment or methods, a minimum of six different blood samples are required, at least two in each of the ranges of PCV 0.20–0.25, 0.40–0.45 and 0.60–0.65. If necessary, the PCV of normal samples may be adjusted by the appropriate addition or removal of autologous plasma.
Manual cell counts and red cell indices
The principles of manual cell counts, the use of the haemocytometer counting chamber for manually counting white cells and platelets and the limitations of these measurements are described in Chapter 26.
An accurate RBC enables the MCV and MCH to be calculated. In well-equipped laboratories, where these indices are provided by an automated system (see p. 41), they are of considerable clinical importance and are widely used in the classification of anaemia. Where automated analysers are not used, manual RBCs (and consequently, calculations of these red cell indices) are so inaccurate and time-consuming that they have become obsolete.

Manual differential leucocyte count
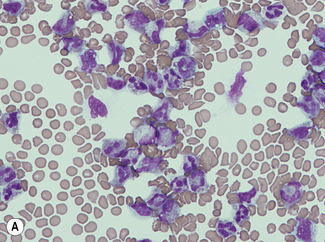
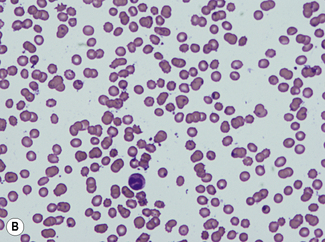
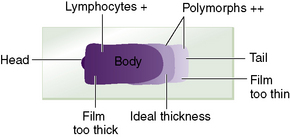
For a reliable differential count on films spread on slides, the film must not be too thin and the tail of the film should be smooth. To achieve this, the film should be made with a rapid movement using a smooth glass spreader. This should result in a film in which there is some overlap of the red cells, diminishing to separation near the tail, and in which the white cells in the body of the film are not too badly shrunken. If the film is too thin or if a rough-edged spreader is used, many of the white cells, perhaps even 50% of them, accumulate at the edges and in the tail (Fig. 3.1). Moreover, a gross qualitative irregularity in distribution is the rule: polymorphonuclear neutrophils and monocytes predominate at the margins and the tail; lymphocytes predominate in the middle of the film (Fig. 3.2). This separation probably depends on differences in stickiness, size and specific gravity of the different types of cells.
Method
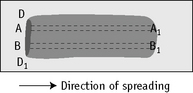
Count the cells using a ×40 objective in a strip running the whole length of the film. Avoid the lateral edges of the film. Inspect the film from the head to the tail and if fewer than 100 cells are encountered in a single narrow strip, examine one or more additional strips until at least 100 cells have been counted. Each longitudinal strip represents the blood drawn out from a small part of the original drop of blood when it has spread out between the slide and spreader (Fig. 3.3). If all the cells are counted in such a strip, the differential totals will closely approximate the true differential count. This technique is liable to error if cells in the thick part of the film cannot be identified; also, it does not allow for any excess of neutrophils and monocytes at the edges of the film, but this preponderance is slight in a well-made film and in practice makes little difference to the result.
Basophil and eosinophil counts
A manual basophil or eosinophil count may be necessary to validate an automated count or when abnormal characteristics of the cells render an automated count unreliable, e.g. with degranulated eosinophils. Count the percentage of eosinophils or basophils in a differential count of all the leucocytes on a stained blood film. If the cells of interest are infrequent, a 500-cell differential count should be performed. If fewer than 500 cells are seen in the film, continue the count on a second film. However, if the eosinophil count is markedly elevated a conventional 100-cell count will suffice for most purposes. Calculate the eosinophil or basophil count per litre from the total leucocyte count. It is essential to have thin, preferably short, films with the leucocytes evenly distributed throughout the film and readily identified (see p. 31).
Range of Eosinophil Count in Health
See Chapter 2, Tables 2.1, 2.2 and 2.3.
There is normally considerable diurnal variation in the eosinophil count and differences amounting to as much as 100% have been recorded. The lowest counts are found in the morning (10 a.m. to noon) and the highest at night (midnight to 4 a.m.).27,28 For a review of the causes of eosinophilia, see Brito-Babapulle.29
Reporting the Differential Leucocyte Count
The differential count, expressed as the percentage of each type of cell, should be related to the total leucocyte count and the results should be reported in absolute numbers (× 109/l). Myelocytes and metamyelocytes, if present, are recorded separately from neutrophils. Band (stab) cells are generally counted as neutrophils, but it may be useful to record them separately. They normally constitute <6% of the neutrophils; an increase may point to an inflammatory process even in the absence of an absolute leucocytosis.32 However, the band cell count is imprecise and, although it is sometimes recommended in infants, it has been found to be unhelpful in predicting occult bacteraemia in this group.33

Reference Differential White Cell Count
A reference method is required to validate the accuracy of automated systems34 (described later). The method that has been used widely for this purpose is essentially similar to the routine manual procedure on stained blood films, but to ensure adequate precision a 200-cell count is carried out by two independent observers, each on two films prepared from the same sample. However, this is still too imprecise for cells with a low frequency; attempts have been made to establish a reference method using flow cytometry with specific monoclonal-antibody labelling of the specific cell types including immature leucocytes.35,36 More recent flow cytometric protocols also include blast cells, reactive lymphocytes, differentiation between B and T lymphocytes and nucleated red cells.37,38
Platelet count
The method for manual counting of platelets using a counting chamber is described on p. 610. If an RBC by a semiautomated counter is available, it is possible to obtain an approximation of the platelet count by counting the proportion of platelets to red cells in a thin part of a film made from an EDTA-anticoagulated blood sample, using the ×100 oil-immersion objective and, if possible, eyepieces provided with an adjustable diaphragm, as for a reticulocyte count.
Reticulocyte count
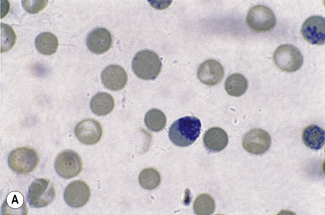
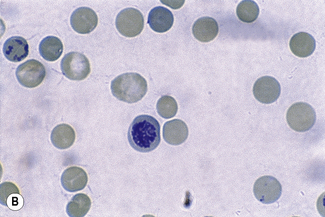
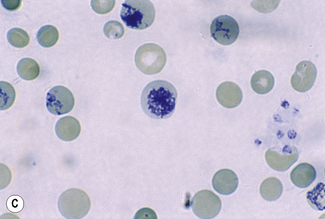
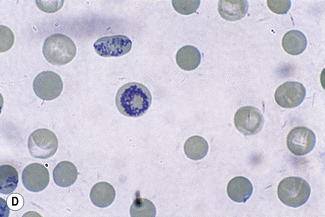
This reaction takes place only in vitally stained unfixed preparations. Stages of maturation can be identified by their morphological features. The most immature reticulocytes are those with the largest amount of precipitable material; in the least immature, only a few dots or short strands are seen. Reticulocytes can be classified into four groups, ranging from the most immature reticulocytes, with a large clump of reticulin (group I), to the most mature, with a few granules of reticulin (group IV) (Fig. 3.4).
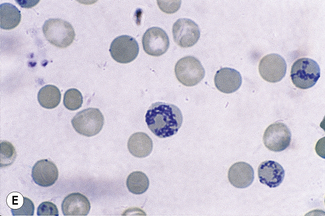
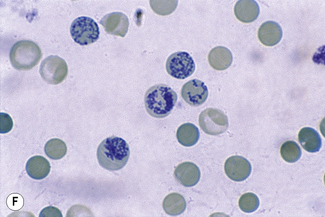
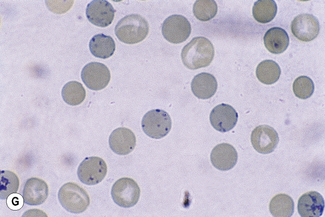
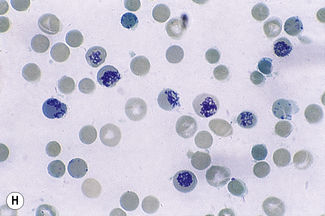
Complete loss of basophilic material probably occurs in the bloodstream and, particularly, in the spleen after the cells have left the bone marrow.39 This maturation is thought to take 2–3 days, of which about 24 h are spent in the circulation.
The number of reticulocytes in the peripheral blood is a fairly accurate reflection of erythropoietic activity, assuming that the reticulocytes are released normally from the bone marrow and that they remain in circulation for the normal time period. These assumptions are not always valid because an increased erythropoietic stimulus leads to premature release into the circulation. The average maturation time of these so-called ‘stress’ or stimulated reticulocytes may be as long as 3 days. In such cases, a higher than normal proportion of immature reticulocytes will be found in circulation. A more precise assessment of reticulocyte maturation is possible by quantitative flow cytometry of their RNA content. Nevertheless, adequate information is usually obtained from a simple reticulocyte count recorded either as a percentage of the red cells or, preferably, when the RBC is known, as an absolute number per litre. When there is severe anaemia, the reticulocyte count should be corrected for the anaemia and expressed as a reticulocyte index.40
Reticulocyte Stains and Count
Better and more reliable results are obtained with New methylene blue than with brilliant cresyl blue. New methylene blue is chemically different from methylene blue, which is a poor reticulocyte stain. New methylene blue stains the reticulofilamentous material in reticulocytes more deeply and more uniformly than does brilliant cresyl blue, which varies from sample to sample in its staining ability. Azure B is a satisfactory substitute for New methylene blue; it has the advantage that the dye does not precipitate and it is available in pure form.41 It is used in the same concentration and the staining procedure is the same as with New methylene blue.
Calculation
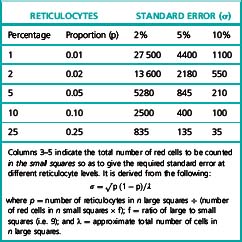
An alternative method is based on the principle of balanced sampling, using a Miller ocular (Graticules Ltd, Morley Road, Tonbridge, UK). This is an eyepiece giving a square field, in the corner of which is a smaller ruled square, one-ninth the area of the total square (Fig. 3.5). Reticulocytes are counted in the large square and the total number of red cells is counted in the small square.
The number of fields that should be surveyed to obtain a desired degree of precision depends on the proportion of reticulocytes (Table 3.3).
Differentiating between Reticulocytes and Other Red Cell Inclusions
Haemoglobin H undergoes denaturation in the presence of brilliant cresyl blue or New methylene blue, resulting in round inclusion bodies that stain greenish-blue (see Chapter 15, Figs 15.6, 15.7). These can be easily differentiated from reticulofilamentous material (Fig. 15.8).
Heinz bodies are also stained by New methylene blue, but they stain a lighter shade of blue than the reticulofilamentous material of reticulocytes and stain well with methyl violet (Figs 15.5, 15.6).
Fluorescence Methods for Performing a Reticulocyte Count
Reticulocytes can be counted manually by fluorescence microscopy on appropriately stained films.42 Add 1 volume of acridine orange solution (50 mg/100 ml of 9 g/l NaCl) to 1 volume of blood. Mix gently for 2 min; make films on glass slides, dry rapidly and examine with a fluorescent microscope. RNA gives an orange–red fluorescence, whereas nuclear material (DNA) fluoresces yellow. Although the amount of fluorescence is proportional to the amount of RNA, the brightness and colour of the fluorescence fluctuates and the preparation quickly fades when exposed to light; also, it requires a special fluorescence microscope. It is thus not suitable for routine use for reticulocyte counting.
Fluorescent staining combined with flow cytometry has been developed as a method for automated reticulocyte counting (see p. 48).
Manual Reference Method
The manual reference method43,44 is essentially the same procedure as for the routine method, the supravitally stained films being examined by bright field or phase contrast-microscopy. Reticulocytes are identified as non-nucleated red cells that contain at least two blue staining particles or one particle linked to a filamentous thread; every non-nucleated cell in each field must be classified as a red cell or a reticulocyte. Three suitable blood films must be selected for each sample and counting is performed by moving from field to field in a battlement pattern until sufficient red cells have been counted to satisfy precision requirement (Table 3.3). An objective is a variance of 2%, but this is impractical when the reticulocyte proportion is in the range 0.01–0.02.
Automated blood count techniques
Choice of an instrument for an individual laboratory, as well as for point-of-care sites outside the laboratory (see p. 574), should take account of capital expenditure and running costs, including maintenance and reagents; size of instrument; requirements of services such as water, compressed air, drainage and an electricity supply with stable voltage; environmental disturbance by generation of heat, vibration and noise; any influence on performance by the ambient temperature and humidity; storage requirements for the often bulky reagents; ease of operation; and the likely level of support that can be expected from the manufacturer.
A practical guide on the principles of the various systems has been published,45 and there are guidelines to help in the choice of an instrument suitable for the needs of an individual laboratory and also to assess its performance, as compared with the claims of the manufacturer, when it has been installed and is being used in routine practice.46 Choice of instrument may be aided by reference to published reports of instrument evaluations and related monographs.45,47–49 Some semiautomated instruments aspirate a sample of accurately determined volume and so can perform absolute cell counts and accurate estimations of Hb. Most automated instruments, however, count for a specified period of time rather than measure an exact volume of blood; they therefore require calibration by means of the direct counts derived from instruments counting cells in a defined volume of diluted blood. For some variables, instruments are calibrated by the manufacturer, but others require calibration in the laboratory. Performance characteristics of an instrument vary over time, so periodic recalibration is needed: both when quality control procedures indicate the necessity and when certain components are replaced.
Counting systems
Impedance Counting
Impedance counting, first described by Wallace Coulter in 1956,50 depends on the fact that red cells are poor conductors of electricity, whereas certain diluents are good conductors; this difference forms the basis of the counting systems used in Beckman Coulter, Sysmex, Abbott, Horiba Medical and a number of other instruments.
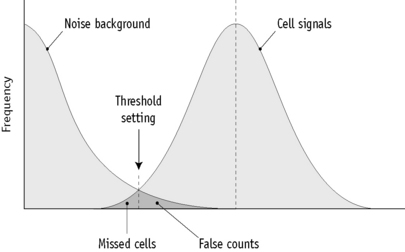
For a cell count, blood is highly diluted in a buffered electrolyte solution. The flow rate of this diluted sample is controlled by a mercury siphon (as in the original Coulter system) or by displacement of a tightly fitting piston. This results in a measured volume of the sample passing through an aperture tube of specific dimensions (e.g. 100 mm in diameter and 70 mm in length). By means of a constant source of electricity, a direct current is maintained between two electrodes, one in the sample beaker or the chamber surrounding the aperture tube and another inside the aperture tube. As a blood cell is carried through the aperture, it displaces some of the conducting fluid and increases the electrical resistance. This produces a corresponding change in potential between the electrodes, which lasts as long as the red cell takes to pass though the aperture; the height of the pulses produced indicates the volume of the cells passing through. The pulses can be displayed on an oscillograph screen. The pulses are led to a threshold circuit provided with an amplitude discriminator for selecting the minimal pulse height, which will be counted (Fig. 3.6). The height of the pulses is used to determine the volume of the red cells.
Light Scattering
Red cells and other blood cells may be counted by means of electro-optical detectors.51 A diluted cell suspension flows through an aperture so that the cells pass, in single file, in front of a light source; light is scattered by the cells passing through the light beam. The scattered light is detected by a photomultiplier or photodiode, which converts it into electrical impulses that are accumulated and counted. The amount of light scattered is proportional to the surface area and therefore the volume of the cell so that the height of the electrical pulses can be used to estimate the cell volume. The high-intensity coherent laser beams used in current instruments have superior optical qualities to the non-coherent tungsten light of earlier instruments. Sheathed flow allows cells to flow in an axial stream with a diameter not much greater than that of a red cell; light can be precisely focused on this stream of cells. Electro-optical detectors are used for red cell sizing and counting in Siemens (previously Bayer-Technicon) systems and for white cell differential counting in a number of other instruments.
Reliability of electronic counters
A statistical correction may be applied for coincidence (coincidence correction); in some instruments, this is done automatically by electronic editing. Errors of coincidence can be detected by carrying out a series of measurements at various dilutions of the same specimen, plotting the data on graph paper and then extrapolating the graph to the baseline for the true value. Alternatively, the need for coincidence correction can be avoided by having the dimensions and flow characteristics of the aperture through which the cells pass such that cells can only pass in single file; this may be achieved by sheathed flow or hydrodynamic focusing in which diluted blood is injected into a sheath of fluid as it flows into the sensing zone. This induces the cells to pass through the centre of the sensing zone in single file and free of distortion. Coincidence can be more effectively reduced with sheathed flow and precisely focused light in an electro-optical detector than in an impedance counter so that less dilution of the blood sample is needed.46 Electrical impulses generated by recirculation of cells can be eliminated by electronic editing; alternatively, recirculation of cells in the region of the aperture can be prevented by ‘sweep flow’ in which a directed stream of diluent sweeps cells and debris away from the aperture, thus preventing cells from being recounted and debris from being counted as cells.
Setting Discrimination Thresholds
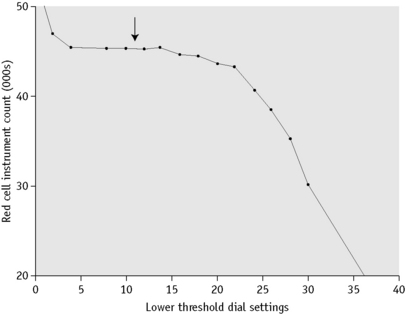
Current multichannel instruments, both impedance counters and counters using light-scattering technology, have thresholds that are either precalibrated by the manufacturer or are automatically adjusted, depending on the characteristics of individual blood samples. Single-channel impedance instruments capable of performing a direct RBC require setting of thresholds so as to separate pulses generated by red cells from background noise and from pulses generated by platelets. This is done by adjusting the aperture current and the pulse amplification. A simple method is to dilute a fresh blood sample and carry out successive counts on the suspension, while the lower threshold control is moved incrementally from its maximum to its minimum position. At the maximum position, the count should be zero or close to zero and the counts will increase as the amplitude is reduced. The counts at each setting are plotted on arithmetic graph paper (Fig. 3.7). The correct threshold setting is at the left of the horizontal part of the graph before the line begins to slope. It is important to check that the setting selected is valid for microcytic cells. The threshold can be defined more precisely for an individual sample by means of a pulse height analyser linked to the counting system. The lower threshold is correctly set if beyond this point there are <0.5% of the counts at the peak (mode) of the pulse size distribution curve (Fig. 3.6).
Packed cell volume and mean cell volume
Automated instruments require calibration before the Hct or MCV can be determined. Calibration of the Hct can be based on manual Hct determinations. Alternatively, the MCV can be calibrated by means of the pulse heights generated by latex beads, stabilized cells or some other calibrant containing particles of known size; however, unfixed human red cells that are biconcave and flexible will not necessarily show the same characteristics in a cell counter as latex particles or some other artificial calibrant. BCR Certified preparations are available from the Institute for Reference Materials and Measurements (IRMM) (see p. 588). Aperture-impedance systems measure an apparent volume that is greater than the true volume, being influenced by a ‘shape factor’;52 this factor is less than 1.1 for young, flexible red cells; between 1.1 and 1.2 for fixed biconcave cells; and about 1.5 for spheres, whether they be fixed cells or latex spheres.51,52
The MCV, and therefore the Hct, as determined by an automated counter, will vary with certain cell characteristics other than volume. As indicated earlier, such characteristics include shape, which in turn is partly determined by flexibility. With impedance counters, the normal disc-shaped red cell becomes elongated into a cigar shape as it passes through the aperture; this is caused by deformation in response to shear force, which occurs in cells of normal flexibility. Cells with a reduced haemoglobin concentration undergo more elongation than normal cells; this leads to a reduced ‘shape factor’, a reduced pulse height in relation to the true size of the cell and underestimation of the MCV. Conversely, cells with abnormally rigid membranes and cells such as spherocytes with a high haemoglobin concentration will undergo less deformation than normal and the MCV will be overestimated. Earlier light-scattering instruments also underestimated the volume of red cells with a reduced haemoglobin concentration because light scattering was affected by the haemoglobin concentration.53 These artefacts are seen even with normal red cells of varying haemoglobin concentration but are more apparent with red cells from patients with defects in haemoglobin synthesis such as those from patients with iron deficiency. Light-scattering instruments have been developed to avoid artefacts of this type. Cells are isovolumetrically sphered; light-scattering characteristics of sphered red cells are predictable and permit the computation of both individual cell volume and intracellular haemoglobin concentration using a calibrated Mie map that describes the scatter and refraction characteristics of spherical particles in a monochromatic light source.54 Light scattering by each individual cell is measured at two angles: low angle at 2–3° and high angle scatter at 5–15°, which permits computation of both cell volume and haemoglobin concentration.53 The measure of cellular haemoglobin is designated as the cellular haemoglobin concentration mean (CHCM) to distinguish it from the traditional MCHC derived from the Hb and the PCV. If all measurements are accurate, the CHCM and the MCHC should give the same results, thus providing an internal quality control mechanism.
The automated MCV and Hct are prone to certain errors that do not occur or are less of a problem with manual methods. These include those resulting from microclots or partial clotting of the specimen, extreme microcytosis and the presence of cryoglobulins or cold agglutinins; the last is a relatively common cause of factitious elevation of the MCV because clumps of cells are sized as if they were single cells. Because the RBC is underestimated, the Hct is less affected, although it is also inaccurate. It is rare for warm agglutinins to cause a similar problem. Sickling may cause a factitious increase in MCV and Hct, whereas alterations in plasma osmolarity occurring, for example, in severe hyperglycaemia, also cause factitious elevation of the MCV and Hct.49,55,56
Red cell indices
Red cell indices traditionally have been the derived parameters of MCV, MCH and MCHC; more recently, red cell distribution width (RDW) has also been included and, for some instruments, haemoglobin distribution width (HDW). These indices can provide a basis for classifying anaemias and in various combinations they have been used to aid in the distinction between iron deficiency and thalassaemias.57–59 It is important to note, however, that these formulae may not be consistent between different instruments and their use provides only a guide to the most likely diagnosis. When diagnosis is important, as in preconceptual or antenatal screening for thalassaemia, definitive tests are required, even in patients whose red cell indices are more suggestive of iron deficiency.
Mean Cell Haemoglobin and Mean Cell Haemoglobin Concentration
MCH is derived from the Hb divided by RBC.
Thus, for example, if there are 150 g of Hb and 5 × 10¹² red cells per litre,
The MCHC is derived in the traditional manner (see p. 30) from the Hb and the Hct with instruments that measure the Hct and calculate the MCV, whereas when the MCV is measured directly and the Hct is calculated, the MCHC is derived from the Hb, MCV and RBC according to the following formula:
For example, if Hb is 150 g/l, MCV is 90 fl and RBC is 5 × 10¹²/l,
As automated counters were developed and introduced, it was noted that the reduced MCHC, which with manual methods had been a useful indicator of hypochromia in early iron deficiency, was a less sensitive indicator of developing iron deficiency. The explanation of this is complex. In iron deficiency, there is not only true hypochromia but also increased plasma trapping within the column of red cells in a microhaematocrit tube that increases the PCV and exaggerates the decrease in the MCHC. The lowered MCHC is thus partly a true reflection of hypochromia and partly an artefact. When the MCHC is derived by automated counters, the artefact of increased plasma trapping is no longer present, but the instruments are also less sensitive to a true reduction of the MCHC because of the underestimation of the size of hypochromic red cells described earlier. Because the MCHC is calculated from the formula given earlier, the underestimation of the MCV leads to an overestimation of the MCHC. The MCHC thus shows little alteration as cells become hypochromic. Where CHCM is available, it is a more directly measured equivalent of the MCHC. This provides improved sensitivity to iron deficiency because true MCHC and the CHCM decrease as hypochromia develops.60
Percentage hypochromic red cells and variation in red cell haemoglobinization: haemoglobin distribution width
Instruments that determine the haemoglobin concentration of individual red cells provide the percentage of hypochromic red cells, with distribution curves of the haemoglobin concentration, and are able to ‘flag’ the presence of increased numbers of hypochromic or hyperchromic cells. The percentage of hypochromic red cells depends on the concentration of haemoglobin in individual cells rather than being a mean, such as MCH or MCHC. It is a more sensitive marker of the availability of iron for erythropoiesis because small changes in the number of red cells with inadequate haemoglobin can be measured before there is any change in the MCHC. Hypochromic red cells are defined as cells with a haemoglobin concentration of less than 28 g/dl (280 g/l).61 In the healthy population the percentage of hypochromic red cells does not exceed 2.5% and values greater than this are indicative of iron deficient erythropoiesis.62 It has been reported to be a useful indicator of functional iron deficiency (where reticuloendothelial iron stores are normal or even high, but the iron is not delivered to erythroblasts and is therefore unavailable for erythropoiesis) in haemodialysis patients. Other manufacturers’ instruments have other parameters reported to be equivalent to percentage hypochromic red cells, such as low haemoglobin density (LHD%) on some Beckman Coulter instruments.63 LHD% is derived from a sigmoid transformation of the MCHC and has been proposed as a parameter to assess the available iron stores for erythropoiesis.
The degree of variation in red cell haemoglobinization is quantified as the haemoglobin distribution width or HDW; this is the CV of the measurements of haemoglobin concentration of individual cells. The normal 95% range is 1.82–2.64. Because the volume of individual red cells is determined, it is possible to distinguish between hypochromic microcytes, which are indicative of a defect in haemoglobin synthesis and hypochromic macrocytes, which often represent reticulocytes.64 The identification of an increased percentage of hyperchromic cells may be caused by the presence of spherocytes, irregularly contracted cells or sickled cells.
Total white blood cell count
Relatively simple instruments are also available that determine the Hb and the WBC by consecutive measurements on a single blood sample. The diluent contains a reagent to lyse the red cells and another to convert haemoglobin to haemiglobincyanide. Hb is measured by a modified HiCN method and white cells are counted by impedance technology. Apart from the reagents specified by the manufacturers, a diluent containing potassium cyanide and potassium ferricyanide together with ethylhexadecyldimethyl-ammonium bromide can be used.65,66
Automated differential count
Most automated differential counters that are now available use flow cytometry incorporated into a full blood counter rather than being stand-alone differential counters. Increasingly, automated blood cell counters have a differential counting capacity, providing either a three-part or a five- to seven-part differential count. Counts are performed on diluted whole blood in which red cells are either lysed or are rendered transparent. A three-part differential count assigns cells to categories usually designated: (1) ‘granulocytes’ or ‘large cells’; (2) ‘lymphocytes’ or ‘small cells’; and (3) ‘monocytes’, ‘mononuclear cells’, or ‘middle cells’. In theory, the granulocyte category includes eosinophils and basophils, but in practice it is common for an appreciable proportion of cells of these types to be excluded from the granulocyte category and to be counted instead in the monocyte category.67 Some other three-part differentials categorize leucocytes as WBC-small cell ratio (equivalent to lymphocytes), WBC-middle cell ratio (equivalent to monocytes, eosinophils and basophils) and WBC-large cell ratio (equivalent to neutrophils).68
Both impedance counters and light-scattering instruments are capable of producing three-part differential counts from a single channel; the categorization is based on the different volume of various types of cell following partial lysis and cytoplasmic shrinkage. Most five- to seven-part differential counts require two or more channels in which cell volume and other characteristics are analysed by various modalities (Table 3.4). Analysis may be dependent only on volume and other physical characteristics of the cell or also on binding of certain dyes to granules or activity of cellular enzymes such as peroxidase. Technologies used to study cell characteristics include light scattering and absorbance and impedance measurements with low- and high-frequency electromagnetic current or radiofrequency current. Cells may have been exposed to lytic agents or a cytochemical reaction may have occurred before cell characteristics are studied. Two-parameter analysis or more complex discriminant functions divide cells into clusters that can be matched with the position of the various white cell clusters in normal blood. Thresholds, some fixed and some variable, divide clusters from one another, permitting cells in each cluster to be counted.
Table 3.4 Automated full blood counters with a five-part or more differential counting capacitya
| Instrument and manufacturer | Technology used for differential count |
|---|---|
| Beckman Coulter GEN-S, LH series, DxH | Impedance with low-frequency electromagnetic current |
| Impedance with high-frequency electromagnetic current | |
| Laser light scattering | |
| Sysmex SE, X-series | Impedance with low-frequency direct current |
| Impedance with radiofrequency current Fluorescence flow cytometry |
|
| Siemens Technicon H series, Advia series | Light scattering and absorbance following peroxidase reaction |
| Two-angle light scatter following differential cytoplasmic stripping | |
| Abbott Cell-Dyn 3500, 4000, Sapphire | Four light-scattering parameters: forward light scatter, orthogonal light scatter, narrow-angle light scatter and depolarized orthogonal light scatter |
| Horiba Medical Pentra series | Electrical impedance with intact cells and following differential cytoplasmic stripping |
| Light absorbance |
a In addition to the blood counters listed here, there are an increasing number of instruments, some designed for point-of-care testing, on the market that are capable of providing full differential or partial differential counts using various technologies.
The automated immature granulocyte count
Most fully automated analysers now report an immature granulocyte count. Promyelocytes, myelocytes and metamyelocytes are all included in the automated immature granulocyte count and are not identified as separate classes of cells. The presence of low numbers of immature granulocytes is more reliably detected on automated haematology analysers than by manual microscopy, due to the higher number of cells counted. Often low numbers of immature granulocytes, particularly in leucopenic samples or when small percentages are present, are missed in a 100-cell differential count or film review. Immature granulocytes may be identified either by a combination of light absorbance (after staining of the cells) and impedance or by flow cytometry to detect side-scattered light and fluorescence of cells stained with a fluorescent dye. Measurement of immature granulocytes may be clinically relevant. The percentage of immature granulocytes as measured by the Sysmex XE-2100 has, for example, been found to be predictive of infection, although it should be noted that it is no more predictive than the absolute neutrophil count.69
Automated digital imaging analysis of blood cells
Over the last 20 years automated imaging processes have started to be introduced where stained blood films are scanned by a computer-driven microscope and leucocytes classified; early methods were slow and had difficulty in classifying abnormal cells and, as only a small number of cells were counted in a reasonable time, the precision of the automated count was no better than that of a manual count.70 However, with improved computing technology and with the use of artificial neural networks, such instruments, e.g. CellaVision DM96 AB, Lund, Sweden and HemoFAXS, Tissuegnostics GmbH, Tabarstasse 10/12/8, A-1020, Wein, Austria, are now capable of providing a useful differential count on blood samples, even those containing abnormal cells.71 The DM96 is composed of a slide scanning unit and a computer. The scanning unit consists of a motorized microscope and a digital charge-coupled device (CCD) camera. The instrument scans the stained blood film, identifies potential white cells, takes digital images of them and uses artificial neural network-based software to analyse the cells. Up to 30 films an hour can be processed. Digital images of pre-classified cells are presented to the operator on a computer screen for conformation or re-classification. The operator of the instrument needs to be skilled in blood cell morphology in order to accept or re-classify accurately the cells presented.72
New White Cell Parameters
Many instruments are able to ‘flag’ the presence of abnormal leucocytes by features such as an alteration in cell size, nuclear size or cell granularity which causes changes in impedance or light-scattering characteristics. Automated white cell counters can also analyse cell characteristics by novel technologies and identify cell types by features that differ greatly from those used when a blood film is examined visually. It is possible, for example, to identify eosinophils by the ability of their granules to polarize light73 or to detect a left shift or the presence of blasts by the reduced light scattering of the nuclei of more immature granulocytes. There is also the potential to produce information that is not directly analogous with that available from a manual differential count. Recently white blood cell differential parameters have been reported to demonstrate clinical utility in the diagnosis of some diseases. Abnormal cell populations that have previously only triggered an abnormal flag, on some instruments, can now be quantitated.
Numerical data (coordinates) generated by analysers that use volume, conductivity and scatter (VCS) are now available. These coordinates indicating the position and size of the cell cluster in the VCS differential plot are available for neutrophils, lymphocytes, monocytes and eosinophils and cells of each cell type have normal values. Any deviations away from normal are thought to reflect differences in cell size and complexity and may be indicative of a potential disease process or specific to a morphological characteristic. These parameters are still for laboratory use only but it may be possible to use them as advanced flags for specific diseases or conditions in certain clinical circumstances. Lymphocyte positional parameters can be used to distinguish between different lymphoproliferative disorders and viral infections.74 Neutrophil conductivity and neutrophil scatter can be used in the detection of dysplastic neutrophils,75 with low values for these parameters correlating with neutrophil hypogranulation.
Sepsis-associated neutrophil left shift can be identified by a change from normal values of neutrophil volume and may be used as an indicator of acute bacterial infections.76
It has been suggested that VCS and other instrument parameters used for defining leucocyte types might also allow detection of the presence of malaria pigment in white blood cells or larger than normal monocytes and may be used as a screening test for malaria.77,78
In a similar way, using forward scattered light and fluorescence, new parameters have been developed on the basis of abnormal leucocyte positions in the differential scattergram. Plasma cells appear in a high fluorescence area of the lymphocyte cluster in the differential channel of the XE-2100 and are flagged as atypical lymphocytes; they can now be quantitated.79 On the same instrument, NEUT-X is the mean value for side scatter diffraction of the neutrophil population; it represents the internal structure of the neutrophils. It correlates with hypogranularity of neutrophils and when taken into consideration with anaemia is suggestive of a myelodysplastic syndrome.80 Instruments such as Siemens Advia analysers that incorporate a cytochemical reaction give information on enzyme activity expressed as the mean peroxidase activity index (MPXI). An increased MPXI has been observed in infections, in some myelodysplastic syndromes and leukaemias, in the acquired immune deficiency syndrome (AIDS) and in megaloblastic anaemia, whereas a reduced MPXI occurs in inherited and acquired neutrophil peroxidase deficiency.60,81,82 These new parameters provide numerical values for the changes that can be seen in the instruments’ scatter plots by an experienced operator. Such measurements have the potential for clinical usefulness and may allow the development of specific disease flags and new indicators of abnormality.
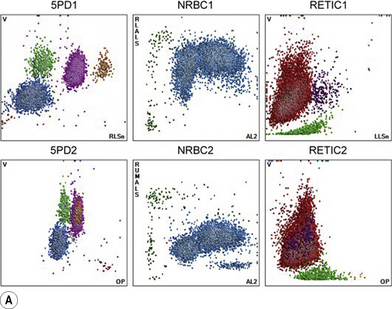
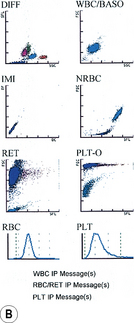
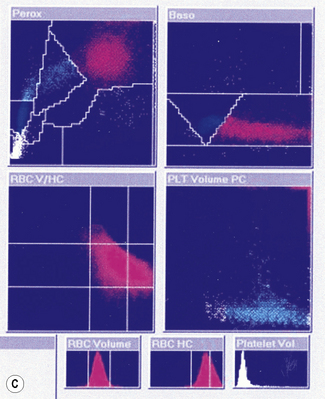
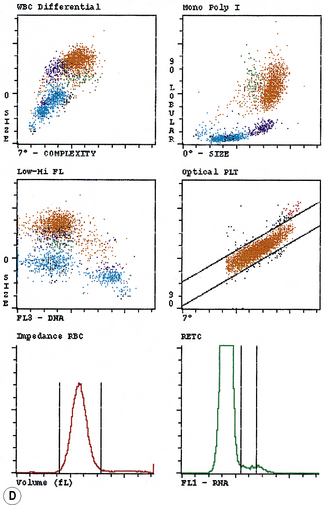
Automated instrument graphics
Typical printouts of histograms or scatter plots of current automated instruments are shown in Figure 3.8.
Platelet count
Platelets can be counted in whole blood using the same techniques of electrical or electro-optical detection as are used for counting red cells. An upper threshold is needed to separate platelets from red cells and a lower threshold is needed to separate platelets from debris and electronic noise. Recirculation of red cells near the aperture should be prevented, as pulses produced may simulate those generated by platelets. Three techniques for setting thresholds have been used: (1) platelets can be counted between two fixed thresholds (e.g. between 2 and 20 fl); (2) pulses between fixed thresholds can be counted with subsequent fitting of a curve and extrapolation so that platelets falling outside the fixed thresholds are included in the computed count; and (3) thresholds can vary automatically, depending on the characteristics of individual blood samples, to make allowance for microcytic or fragmented red cells or for giant platelets. Factitiously low impedance platelet counts may be the result of giant platelets being identified as red cells or of EDTA-induced platelet clumping or satellitism (see p. 98). Misleadingly, high platelet counts may be due to markedly microcytic or fragmented red cells, to white cell fragments in leukaemia83 or to bacteria or fungi.
An optical fluorescence platelet count has been introduced on some Sysmex analysers, in addition to the traditional impedance count.84 A dye is used to stain the RNA/DNA of reticulocytes and platelet membranes and granules. The fluorescent staining of the platelets allows the exclusion of non-platelet particles from the count and also allows the inclusion of large or giant platelets. However, for samples from patients undergoing cytotoxic chemotherapy, the impedance count is sometimes more accurate. This is probably due to the erroneous staining of white cell fragments following apoptosis.83 A switching algorithm has been designed on the instrument to report the most accurate platelet count, either optical or impedance.
An immunofluorescent method for platelet counting by flow cytometry has also been developed.85 Platelets in a blood sample are labelled fluorescently with a specific monoclonal antibody or combination of antibodies and by measuring the RBC:platelet ratio the platelet count can be calculated. Suitable antibodies to platelet antigens are CD41, CD42 and CD61. This method using CD41 and CD61 has been adopted by the International Council for Standardization in Haematology as the reference method.86 The Abbott Cell-Dyn and Sapphire instruments provide an automated immunological platelet count for diagnostic use. Although instruments can count platelets down to levels of 10 × 109/l or less, it should be noted that precision at these levels is often poor with CVs of 22–66% being observed87 and with counts below 10 × 109/l differing appreciably between instruments and from the International Council for Standardization in Haematology reference method.88
Platelet Count in Health
In health, there are approximately 150–400 × 109 platelets per litre of blood. The counts are somewhat higher in women than in men,89 and there is a cycling, with slightly lower count at about the time of menstruation.90 Lower platelet counts have been observed in apparently healthy West Indians and Africans than in Caucasians.91
Mean Platelet Volume
The same techniques that are used to size red cells can be applied to platelets. The mean platelet volume (MPV) is derived from the impedance platelet size distribution curve. The MPV is very dependent on the technique of measurement and on length and conditions of storage prior to testing the blood. When MPV is measured by impedance technology, it has been found to vary inversely with the platelet count in normal subjects. If this curve is extrapolated, it has been found that data fit the extrapolated curve when thrombocytopenia is caused by peripheral platelet destruction; however, the MPV is lower than predicted when thrombocytopenia is caused by megaloblastic anaemia or bone marrow failure.92,93 Large platelets are haemostatically more active than smaller platelets and may be more important functionally than smaller platelets. An increase in MPV has been observed in patients at risk of and following myocardial infarction94 and cerebral infarction.95 A high MPV can provide important evidence of an inherited macrothrombocytopenia. The MPV is generally greater than predicted in myeloproliferative neoplasms, but differentiating essential thrombocythaemia from reactive thrombocytosis on this basis has not been very successful.
Other platelet parameters that can be computed by automated counters include the platelet distribution width (PDW), which is a measure of platelet anisocytosis and the ‘plateletcrit’, which is the product of the MPV and platelet count and, by analogy with the haematocrit, may be seen as indicative of the volume of circulating platelets in a unit volume of blood. The platelet large cell ratio (P-LCR), reported by some instruments is the number of platelets falling above the 12 fl threshold on the platelet size histogram divided by the total number of platelets. A high P-LCR or PDW may indicate peripheral immune destruction of platelets.96 The PDW has been found to be of some use in distinguishing essential thrombocythaemia (PDW increased) from reactive thrombocytosis (PDW normal). The plateletcrit does not appear to provide any information of clinical value. All derived platelet parameters are highly specific to the individual technologies, with different analysers having different normal ranges.
Reticulated Platelets and Immature Platelet Fraction
After labelling with specific immunological markers and a fluorescent dye that binds RNA, it is possible to identify young platelets with a higher RNA content by flow cytometry.86,97–99 By analogy with the reticulocyte count, these have been called ‘reticulated platelets’, and it has been suggested that an increased number in the circulation is a sensitive and early indication of recovery of thrombopoiesis in aplastic anaemia. However, because there is a constant exchange of platelets between the circulation and the spleen, it is not clear whether their presence in the blood has the same significance as reticulocytes
A new automated method to quantitate reticulated platelets, expressed as the immature platelet fraction (IPF), has been developed on some Sysmex instruments. The measurement of the IPF uses a fluorescent dye containing polymethine and oxazine. These two dyes penetrate the cell membrane, staining any RNA in red cells and platelets, and the stained cells are then passed through a semiconductor diode laser beam. The resulting forward scatter light (cell volume) and fluorescence intensity (RNA content) are measured and reticulocytes and reticulated platelets are identified. The IPF is raised in patients with peripheral consumption/destruction of platelets (idiopathic thrombocytopenic purpura and thrombotic thrombocytopenia purpura) and is normal or low in patients with marrow failure.100 Following a peripheral blood stem cell transplant the IPF has been reported to increase 1–2 days prior to the platelet count increasing.101,102
Reticulocyte count
Automated reticulocyte counts have been developed by using the fact that various dyes and fluorochromes combine with the RNA of reticulocytes.40,103 Following binding of the dye, fluorescent cells can be enumerated using a flow cytometer. Most fully automated blood counters now incorporate a reticulocyte counting capacity so that use of a stand-alone reticulocyte counter is no longer necessary and use of a general purpose flow cytometer is no longer appropriate. An international standard for this method has been published by the Clinical and Laboratory Standards Institute (CLSI) in collaboration with ICSH.44 The dyes used in the different systems include auramine O or polymethine with oxazine (Sysmex), thiazole orange (ABX), CD4K 530 (Abbott), as well as non-fluorescent dyes such as oxazine 750 (Siemens) and the traditional New methylene blue (Beckman Coulter, Abbott).
After staining, it is necessary to separate the reticulocytes from unstained red cells and, because the dyes also combine with DNA of nucleated cells, these cells must also be excluded. The threshold for this exclusion is determined by the intensity of fluorescence and particle sizing. Although the separation of reticulocytes from mature red cells is not always clear cut, automated reticulocyte counts correlate well with manual reticulocyte counts; however, absolute counts may differ because automated counts are dependent on the conditions of incubation and the method of calibrating the instrument.103 Precision is much superior to that of the manual count because many more cells are counted, which has allowed reliable flagging of reticulocytopenia and the subjective element inherent in recognizing late reticulocytes is eliminated. Potential sources of inaccuracy are the inclusion of some leucocytes and platelets and, less often, Howell-Jolly bodies or malarial parasites in the ‘reticulocyte’ count.
Immature Reticulocyte Fraction
The characteristics of reticulocyte output in different types of anaemias can be especially appreciated from an output bivariate graph relating fluorescent intensity to reticulocyte count.40 As described earlier, low total count with a relatively high immature reticulocyte fraction (IRF) is indicative of a repopulating marrow, whereas a reticulocytopenia with low IRF is typical of severe aplastic anaemia or renal failure A high total count with high IRF occurs in acute haemolysis and blood loss, whereas a low to normal total count with a high IRF occurs in dyserythropoiesis and in early response to haematinics.104–106 The appearance of reticulocytes with high fluorescence also heralds response when severe aplastic anaemia is being treated with immunosuppressive therapy,104 and is a reliable indication of haemopoietic regeneration after marrow ablative chemotherapy. A high IRF has also been found to be useful in predicting the optimal time for stem cell harvests in some but not all studies.107 A normal total count with an unexpectedly high IRF in athletes has been suggested as a method to detect ‘doping’ with erythropoietin.108 It may also be useful in deciding whether a macrocytic anaemia is megaloblastic or non-megaloblastic.109
Reticulocyte Counts in Health
The normal reticulocyte count in men or women is: 50–100 × 109/l (0.5–2.5%).
Measurement of Reticulocyte Haemoglobin
The reticulocyte count provides a quantitative measure of erythropoiesis but no information on the quality of erythropoiesis. With the development of flow cell haematology analysers it is now possible to measure the volume and haemoglobin content of reticulocytes. The parameter from Siemens is termed CHr (mean reticulocyte haemoglobin content) and from Sysmex the Ret-He, (the reticulocyte haemoglobin concentration). CHr is measured in the stained reticulocytes using two angle light scatter and Ret-He, is a measure of the forward scatter of stained reticulocytes and has a curvilinear relationship with CHr.110 The reticulocyte haemoglobin content provides an indirect measure of the functional iron available for new red blood cell production over the previous 3–4 days. More recently, other instruments have developed parameters that may give information equivalent to reticulocyte haemoglobin; these are based on a measure of mean reticulocyte volume (MRV). Reticulocyte haemoglobin and reticulocyte volume may have similar clinical utility, but the MRV produced by different instruments lacks standardization, which means numeric results from different manufacturers are not comparable. Red blood cell size factor (RSf) is a new parameter provided by Beckman Coulter, which relates to the volume of erythrocytes and reticulocytes. Good correlation between CHr and RSf has been reported.111
Point-of-care instruments
There are two types of technology to support point-of-care testing (POCT) (see p. 574), small bench top analysers and hand-held devices. The bench top systems are often smaller versions of laboratory analysers providing an FBC with red cell indices and either a five-part white cell differential or a partial three-part differential. Bench top analysers are equipped with automated calibration and quality control; however, they are too large for use at the patient’s bedside and are designed for use in clinics or small laboratories. It is recommended that instruments that employ primary sampling are used, rather than instruments that involve dilution of whole blood in the pre-analytical phase.112 The most widely used test with a hand-held device is the measurement of haemoglobin concentration, but another device, using a disposable cartridge, has recently been introduced that measures haemoglobin concentration, counts leucocytes and platelets and performs a three-part differential on capillary blood. The range of equipment available will inevitably expand as more POCT is implemented. POCT devices should generate results that are comparable to those of the local reference laboratory. Internal quality control (IQC) must be available for all POCT instruments to detect significant deviations from acceptable performance. The analysis of control material before analysing patient samples can provide reassurance that the system is working correctly. At regular intervals parallel testing of a patient sample may be carried out at the POCT site and the main laboratory to ensure comparable results.
Local haematologists/pathologists should encourage POCT users to participate in the supervising laboratory’s EQA.112
Haematologists should be aware of the potential for error if point-of-care blood gas analysers are used for estimation of Hb or Hct. Use of instruments that are based on conductivity measurements is not recommended since discrepancies of 20 g/l in the Hb and 0.04 l/l in the Hct can occur when the plasma protein concentration is low (e.g. if crystalloid has been used for blood replacement) and there is also a downward biases when the haematocrit is less than 0.30 l/l.112 Furthermore, the reproducibility of Hct measurements can be poor. As long as there is adequate quality control, instruments based on spectrophotometry/co-oximetry agree more closely with laboratory measurements of Hb.112
Calibration of automated blood cell counters
The following methods are recommended for calibrating an automated blood cell counter:113,114
Considerable care is required to ensure that the initial measurements on the fresh blood are as accurate as possible. Dilutions should be made with individually calibrated pipettes and grade A volumetric flasks. The cell counter should be calibrated as described on p. 39, with a signal-to-noise ratio of >100:1 and the count corrected for coincidence. Details of procedures to be used are described by the International Committee for Standardization in Haematology.115 Procedures for verification of the performance of multichannel analysers by the users have also been published by ICSH46 and in the USA, by the National Committee for Clinical Laboratory Standards.116
Flagging of automated blood counts
‘Flagging’117,118 refers to a signal that the specimen being analysed may have a significant abnormality because one or more of the blood count variables are outside specified limits (usually 2SD) or there is a qualitative abnormality that requires a quality control check and/or additional investigation. Abnormal cells have differing characteristics, such as nuclear size and granule content, from normal cells. The instrument detects a cell population as having an abnormal size or shape by cluster analysis. Under these circumstances, abnormal cell flags are generated to alert the user to the possibility of inaccurate results. Abnormal cells or interfering substances may render the automated differential inaccurate or unreportable. A blood film will need to be examined microscopically to verify the automated count and confirm the presence of abnormal cells. Most point-of-care bench top analysers have the ability to generate flags in the presence of abnormal cells or interfering substances; however, the range of alert flags available on these instruments is limited and their sensitivity and specificity may not be as good as those on more sophisticated laboratory haematology analysers. Although it is theoretically desirable for every blood count to include examination of a stained film, this has become impossible as a result of increasing workloads; time- and cost-effective rationalization has therefore been required. This has been helped by the availability of automated analysers that report differential leucocyte counts on every specimen. Consequently, significantly fewer blood films are now examined microscopically. Thus, a decision of when a blood film should be made, stained and examined should take account of flagging and the need to ensure analytic reliability. This includes a check of any significant changes from a recent previous count (delta check), as well as any specific clinical circumstances. There are previously published guidelines that describe blood film review criteria following FBC and differential analysis,119 which may be adapted to the individual laboratory’s needs. Box 3.1 is a guide to this selection.
Blood count request: Is it a first-time count or repeat count?
First-time count: Is it a routine screening test or special category?
If routine: Analyser report for blood count alone.
Film required if any flags are signalled.
Special category film required:
Microscopy
Microscope Components
The main components of most routine microscopes are illustrated in Figure 3.9. The objectives are usually marked with their magnifying power, but older lenses may be marked by their focal length instead. The approximate equivalents are in Table 3.5.
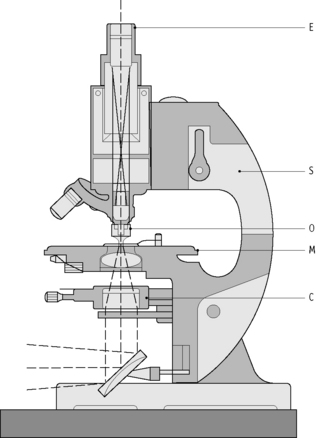
Table 3.5 Approximate equivalents of focal length to magnifying power
| Focal length (mm) | Magnification |
|---|---|
| 2 | ×100 |
| 4 | ×40 |
| 16 | ×10 |
| 40 | ×4 |
The working distance of the objective is the distance between the objective and the object to be visualized. The greater the magnifying power of the objective, the smaller the working distance (Table 3.6).
Table 3.6 Objective magnifying power and the associated working distance
| Objective | Working distance |
|---|---|
| ×10 | 5–6 mm |
| ×40 | 0.5–1.5 mm |
| ×100 | 0.15–0.20 mm |
Setting Up the Microscope Illumination
1 Zijlstra W.G., van Kampen E.J. Standardization of hemoglobinometry. I. The extinction coefficient of hemiglobincyanide at 1 = 540mm: e540HiCN. Clin Chim Acta. 1960;91:719-726.
2 International Committee for Standardization in Haematology. Recommendations for Reference Method for Haemoglobinometry in Human Blood (ICSH Standard 1995) and Specifications for International Haemiglobincyanide Standard. J Clin Pathol. 1996;49:271-274. 4th ed
3 Vanzetti G. An azide-methemoglobin method for hemoglobin determination in blood. J Lab Clin Med. 1966;67:116-126.
4 Oshiro I., Takenaka T., Maeda J. New method for hemoglobin determination by using sodium lauryl sulfate (SLS). Clin Biochem. 1982;15:83-88.
5 Lewis S.M., Garvey B., Manning R., et al. Lauryl sulphate haemoglobin: a non-hazardous substitute for HiCN in haemoglobinometry. Clin Lab Haematol. 1991;13:279-290.
6 Zander R., Land W., Wolf H.U. Alkaline haematin D-575, a new tool for the determination of haemoglobin as an alternative to the cyanhaemiglobin method. I. Description of the method. Clin Chim Acta. 1984;136:83-93.
7 Wolf H.U., Land W., Zander R. Alkaline haematin D-575, a new tool for the determination of haemoglobin as an alternative to the cyanhaemiglobin method. II. Standardization of the method using pure chlorohaemin. Clin Chim Acta. 1984;136:95-104.
8 Lema O.E., Carter J.Y., Arube P.A., et al. Evaluation of the alkaline haematin D-575 method for haemoglobin estimation in east Africa. Bull World Health Organ. 1994;72:937-941.
9 van Assendelft O.W., Zijlstra W.G. Observations on the alkaline haematin/detergent complex proposed for measuring haemoglobin concentration. J Clin Chem Clin Biochem. 1989;27:191-195.
10 Van Assendelft O.W., Buursma A., Zijlstra W.G. Stability of haemiglobincyanide standards. J Clin Pathol. 1996;49:275-277.
11 Davies B., Jungerius B. International Council for Standardization in Haematology technical report 1–2009: new reference material for haemoglobincyanide for use in standardization of blood haemoglobin measurements. Int J Hematol. 2010. E-pub ahead of print
12 Van Kampen E.J., Zijlstra W.G. Spectrophotometry of hemoglobin and hemoglobin derivatives. Adv Clin Chem. 1983;23:199-257.
13 Matsubara T., Okuzono H., Senba U. Modification of Van Kampen-Zijlstra’s reagent for the hemiglobincyanide method. Clin Chim Acta. 1979;93:163-164.
14 Morris L.D., Osei-Bimpong A., McKeown D., et al. Evaluation of the utility of the HemoCue 301 haemoglobinometer for blood donor screening. Vox Sang. 2007;93:64-69.
15 Osei-Bimpong A., Jury C., McLean R., et al. Point-of-care for total white cell count: an evaluation of the HemoCue WBC device. Int J Hematol. 2008;31:657-664.
16 Robertson L., Lewis D., Osei-Bimpong A. The utility of the DiaSpect Haemoglobinometry System as a point-of-care analyser, 2010. In press
17 Kinoshita Y., Yamane T., Takubo T., et al. Measurement of hemoglobin concentrations using the Astrim noninvasive blood vessel monitoring apparatus. Acta Haematol. 2002;108:109-110.
18 Rendell M., Anderson E., Schlueter W., et al. Determination of hemoglobin levels in the finger using near infra-red spectroscopy. Clin Lab Haematol. 2003;25:93-97.
19 International Council for Standardization in Haematology. Recommendations for reference method for determination by centrifugation of packed cell volume of blood. J Clin Pathol. 1980;33:1-2.
20 World Health Organization. Recommended method for the determination of packed cell volume by centrifugation (Prepared by Expert Panel on Cytometry of the International Council for Standardization in Haematology) Document WHO/DIL/00.2:1–9. Geneva: WHO; 2000.
21 Bryner M.A., Houwen B., Westengard J., et al. The spun haematocrit and mean red cell volume are affected by changes in the oxygenation state of red blood cells. Clin Lab Haematol. 1997;19:99-103.
22 International Committee for Standardization in Haematology. Recommended methods for measurement of red-cell and plasma volume. J Nucl Med. 1980;21:793-800.
23 Bull B.S., Fujimoto K., Houwen B., et al. International Council for Standardization in Haematology (ICSH). Recommendations for ‘surrogate reference’ method for the packed cell volume. Lab Hematol. 2003;9:1-9.
24 England J.M., Walford D.M., Waters D.A.W. Reassessment of the reliability of the haematocrit. Br J Haematol. 1972;23:247-256.
25 Pearson T.C., Guthrie D.L. Trapped plasma in microhematocrit. Am J Clin Pathol. 1982;78:770-772.
26 Expert Panel on Cytometry of the International Council for Standardization in Haematology. Recommendations for reference method for the packed cell volume (ICSH Standard). Lab Hematol. 2001;7:148-170.
27 Rothenberg M.E. Eosinophilia. N Engl J Med. 1998;338:1592-1699.
28 Uhrbrand H. The number of circulating eosinophils: normal figures and spontaneous variations. Acta Med Scand. 1958;160:99-104.
29 Brito-Babapulle F. The eosinophilias, including the idiopathic hypereosinophilic syndrome. Br J Haematol. 2003;121:203-223.
30 Gilbert H.S., Ornstein L. Basophil counting with a new staining method using Alcian blue. Blood. 1975;46:279-286.
31 Mettler L., Shirwani D. Direct basophil count for timing ovulation. Fertil Steril. 1974;25:718-723.
32 Mathy K.A., Koepke J.A. The clinical usefulness of segmented vs stab neutrophil criteria for differential leucocyte counts. Am J Clin Pathol. 1974;61:947-958.
33 Gombos M., Bienkowski R., Gochman R., et al. The absolute neutrophil count: Is it the best indicator for occult bacteraemia in infants? Am J Clin Pathol. 1998;109:221-225.
34 Clinical and Laboratory Standards Institute. Reference leukocyte differential count (proportional) and evaluation of instrument methods. Approved standard. Wayne PA: CLSI; 2007. CLSI document H20-A2
35 Hubl W., Wolfbauer G., Andert S., et al. Towards a new reference method for the leukocyte five-part differential. Cytometry. 1997;30:72-84.
36 Fujimoto H., Sakata T., Hamaguchi Y., et al. Flow cytometric method for enumeration and classification of reactive immature granulocyte populations. Cytometry. 2000;42:371-378.
37 Faucher J.L., Lacronique-Gazaille C., Frébet E., et al. ‘6 markers/5 colors’ extended white cell differential by flow cytometry. Cytometry. 2007;71:934-944.
38 Björnsson S., Wahlström S., Norström E., et al. Total nucleated cell differential for blood and bone marrow using a single tube in a five color flow cytometer. Cytometry B Clin Cytom. 2008;74:91-103.
39 Groom A.C., Schmidt E.E. Microcirculatory blood flow through the spleen. In: Bowdler A.J., editor. The Spleen: Structure, Function and Clinical Significance. London: Chapman and Hall; 1990:45-102.
40 D’Onofrio G., Zini G., Rowan R.M. Reticulocyte counting: methods and clinical applications. In: Rowan R.M., van Assendelft O.W., Preston F.E., editors. Advanced Laboratory Methods in Haematology. London: Arnold; 2002:78-126.
41 Wittekind D., Schulte E. Standardized azure B as a reticulocyte stain. Clin Lab Haematol. 1987;9:395-398.
42 Jahanmehr S.A.H., Hyde K., Geary C.G., et al. Simple technique for fluorescence staining of blood cells with acridine orange. J Clin Pathol. 1987;40:926-929.
43 International Council for Standardization in Haematology. Proposed reference method for reticulocyte counting based on the determination of the reticulocyte to red cell ratio. Clin Lab Haematol. 1998;20:77-79.
44 Clinical and Laboratory Standards Institute and International Council for Standardization in Haematology, 2nd ed. Methods for reticulocyte counting (automated blood cell counters, flow cytometry and supravital dyes): approved guideline, Vol. 24. CLSI, Wayne PA, 2004. Document H44-A2, (8)
45 Groner W., Simson E. Practical Guide to Modern Haematology Analysers. Chichester: Wiley; 1995.
46 International Council for Standardization in Haematology. Guidelines for the evaluation of blood cell analysers including those used for differential leucocyte and reticulocyte counting and cell marker applications. Clin Lab Haematol. 1994;16:157-174.
47 Bain B.J. Blood Cells: A Practical Guide, 4th ed. Oxford: Blackwell; 2006.
48 Simson E., Ross D.W., Kocher W.D. Atlas of Automated Cytochemical Hematology. Tarrytown, NY: Technicon; 1988.
49 Houwen B. The blood count. In: Rowan R.M., van Assendelft O.W., Preston F.E., editors. Advanced Laboratory Methods in Haematology. London: Arnold; 2002:19-44.
50 Coulter W.H. High speed automatic blood cell counter and cell size analyser. Proceedings of National Electronics Conference. 1956;12:1034-1040.
51 Thom R. Automated red cell analysis. Baillieres Clin Haematol. 1990;3:837-850.
52 England J.M., van Assendelft O.W. Automated blood counters and their evaluation. In: Rowan R.M., England J.M., editors. Automation and Quality Assurance in Haematology. Oxford: Blackwell Scientific, 1986.
53 Mohandas N., Kim Y.R., Tycko D.H., et al. Accurate and independent measurement of volume and hemoglobin concentration of individual red cells by laser scattering. Blood. 1986;68:506-513.
54 Tycko D.H., Metz M.H., Epstein E.A., et al. Flow-cytometric light scattering measurement of red blood cell volume and hemoglobin concentration. Appl Opt. 1985;24:1355-1366.
55 Evan-Wong L., Davidson R.J. Raised Coulter mean corpuscular volume in diabetic ketoacidosis and its underlying association with marked plasma hyperosmolarity. J Clin Pathol. 1983;36:334-336.
56 Holt J.T., DeWandler M.J., Arvan D.A. Spurious elevation of the electronically determined mean corpuscular volume and hematocrit caused by hyperglycemia. Am J Clin Pathol. 1982;77:561-567.
57 Bentley S.A., Ayscue L.H., Watson J.M., et al. The clinical utility of discriminant functions in the differential diagnosis of microcytic anemias. Blood Cells. 1989;15:575-582.
58 Lafferty J.D., Crowther M.A., Ali M.A., et al. The evaluation of various mathematical RBC indices and their efficacy in discriminating between thalassemic and non-thalassemic microcytosis. Am J Clin Pathol. 1996;106:201-295.
59 Green R., King R. A new red cell discriminant incorporating volume dispersion for differentiating iron deficiency anemia from thalassemia minor. Blood Cells. 1989;15:481-491.
60 Ross D.W., Bentley S.A. Evaluation of an automated hematology system (Technicon H-1). Arch Pathol Lab Med. 1986;110:803-808.
61 Horl W.H., Cavill I., MacDougall I.C., et al. How to diagnose and correct iron deficiency during r-huEPO therapy – a consensus report. Nephrol Dial Transplant. 1996;11:246-250.
62 Schaefer R.M., Schaefer L. The hypochromic red cell: a new parameter for monitoring of iron supplementation during rhEPO therapy. J Perinat Med. 1995;23:83-88.
63 Urrechaga E. The new mature red cell parameter, the haemoglobin density of the Beckman-Coulter LH750: clinical utility in the diagnosis of iron deficiency. International Journal of Laboratory Hematology. 2010;32:e144-e150.
64 Bain B.J., Cavill I. Hypochromic macrocytes – are they reticulocytes? J Clin Pathol. 1993;46:963-964.
65 Ballard B.C. Lysing agent for the Coulter S. J Clin Pathol. 1972;25:460.
66 Skinnider L.F., Musglow E. A stromatolysing and cyanide reagent for use with the Coulter Counter Model S. Am J Clin Pathol. 1972;57:537-538.
67 Bain B.J. An assessment of the three population differential count on the Coulter Model S Plus IV. Clin Lab Haematol. 1986;8:347-359.
68 Briggs C., Kunka S., Pennaneach C., et al. Performance evaluation of a new compact haematology analyser, the Sysmex pocH-100i. Lab Hematol. 2003;9:225-233.
69 Ansari-Lari M.A., Kickler T.S., Borowitz M.J. Immature granulocyte measurement using the Sysmex XE-2100. Am J Clin Pathol. 2003;120:795-799.
70 Bentley S.A. Automated differential white cell counts: a critical appraisal. Baillieres Clin Haematol. 1990;3:851-869.
71 Ceelie H., Dinkelaar R.B., van Gelder W. Examination of peripheral blood films using automated microscopy; evaluation of Diffmaster Octavia and Cellavision DM96. J Clin Pathol. 2007;60:72-79.
72 Briggs C., Longair I., Slavik M., et al. Can automated image analysis replace the manual differential? An evaluation of the CellaVision DM96 automated image analysis software. International Journal of Laboratory Haematology. 2007;31:48-60.
73 Cornbleet P.J., Myrick D., Judkins S., et al. Evaluation of the CELL-DYN 3000 differential. Am J Clin Pathol. 1992;98:603-614.
74 Silva M., Fourcade C., Fartoukh C., et al. Lymphocyte volume and conductivity indices of the haematology analyser Coulter GEN.STM in lymphoproliferative disorders and viral diseases. Clin Lab Haematol. 2006;28:1-28.
75 Miguel A., Orero M., Simon R., et al. Automated neutrophil morphology and its utility in the assessment of neutrophil dysplasia. Lab Haematol. 2007;13:98-102.
76 Chaves F., Tierno B., Xu D. Quantitative determination of neutrophil VCS parameters by the Coulter automated hematology analyser: new and reliable indicators for acute bacterial infection. Am J Clin Pathol. 2005;124:440-444.
77 Fourcade C., Casbas M.J., Belaouni H., et al. Automated detection of malaria by means of the haematology analyser Coulter GEN.S. Clin Lab Haematol. 2004;26:367-372.
78 Hänscheid T., Pinto B.G., Cristino J.M., et al. Malaria diagnosis with the haematology analyser Cell-Dyne 3500: what does the instrument detect? Clin Lab Haematol. 2000;22:259-261.
79 Linssen J., Jennissen V., Hildmann J., et al. Identification and quantification of high fluorescence-stained lymphocytes as antibody synthesizing/secreting cells using the automated routine hematology analyser XE-2100. Cytometry B Clin Cytom. 2007;72:157-166.
80 Furundarena J.R., Araiz M., Uranga M., et al. The utility of the Sysmex XE-2100 analyzer’s NEUT-X and NEUT-Y parameters for detecting neutrophil dysplasia in myelodysplastic syndromes. International Journal of Laboratory Hematology. 2009;32:360-366.
81 D’Onofrio G., Zini G., Tommasi M., et al. Anomalie ultramorpholigiche dei granulociti neutrofili nelle infezioni da virus HIV. Atti del V Incontro del Club Utilizzatori Sistemi Ematologici. Montecatini Terme: Bayer-Technicon; 1992.
82 Taylor C., Bain B.J. Technicon H1 automated white cell parameters in the diagnosis of megaloblastic erythropoiesis. Eur J Haematol. 1991;46:248-249.
83 van der Meer W., Mackenzie M.A., Dinnissen J.W., et al. Pseudoplatelets: A retrospective study of their incidence and interference with platelet counting. J Clin Pathol. 2003;56:772-774.
84 Briggs C., Harrison P., Grant D., et al. New quantitative parameters on a recently introduced automated blood cell counter – the XE 2100. Clin Lab Haematol. 2000;17:163-172.
85 Ault K.A. The clinical utility of flow cytometry in the study of platelets. Semin Hematol. 2001;38:160-168.
86 ICSH (Expert Panel on Cytometry) and International Society of Laboratory Hematology (ISLH). Platelet counting by the PLT/RBC ratio – a reference method. Am J Clin Pathol. 2001;115:460-464.
87 Parker-Williams J. Immunoplatelet counting: platelet transfusions. Br J Haematol. 2003;123:750-751.
88 Segal H.C., Briggs C., Kunka S., et al. Accuracy of platelet counting haematology analysers in severe thrombocytopenia and potential impact on platelet transfusion. Br J Haematol. 2005;128:520-525.
89 Bain B.J. Platelet count and platelet size in males and females. Scand J Haematol. 1985;35:77-79.
90 Morley A. A platelet cycle in normal individuals. Australas Ann Med. 1969;18:127-129.
91 Bain B.J., Seed M. Platelet count and platelet size in Africans and West Indians. Clin Lab Haematol. 1986;8:43-48.
92 Bessman J.D., Williams L.J., Gilmer P.R. Platelet size in health and hematologic disease. Am J Clin Pathol. 1982;78:150-153.
93 Bowles K.M., Cooke L.J., Richards E.M., et al. Platelet size has diagnostic predictive value in patients with thrombocytopenia. Clin Lab Haematol. 2005;27:370-373.
94 Khandekar M.M., Khurana A.S., Deshmukh S.D., et al. Platelet volume indices in patients with coronary artery disease and acute myocardial infarction: an Indian scenario. J Clin Pathol. 2006;59:146-149.
95 D’Erasmo E., Aliberti G. Platelet count, mean platelet volume and their relation to prognosis in cerebral infarction. J Intern Med. 1990;227:11-14.
96 Kaito K., Otsubo H., Usui N., et al. Platelet size deviation width, platelet large cell ratio and mean platelet volume have sufficient sensitivity and specificity in the diagnosis of immune thrombocytopenia. Br J Haematol. 2005;128:698-702.
97 Takubo T., Yamane T., Hino M., et al. Usefulness of determining reticulated and large platelets in idiopathic thrombocytopenic purpura. Acta Haematol. 1998;99:109-110.
98 Macchi I., Chamlian V., Sadoun A., et al. Comparison of reticulated platelet count and mean platelet volume determination in the evaluation of bone marrow recovery after aplastic chemotherapy. Eur J Haematol. 2002;69:152-157.
99 Robinson M.S.C., Mackie I.J., Machin S.J., et al. Two colour analysis of reticulated platelets. Clin Lab Haematol. 2000;22:211-213.
100 Briggs C., Kunka S., Hart D., et al. Assessment of an immature platelet fraction (IPF) in peripheral thrombocytopenia. Br J Haematol. 2004;126:93-99.
101 Abe Y., Wada H., Tomatsu H., et al. A simple technique to determine thrombopoiesis level using immature platelet fraction (IPF). Thromb Res. 2006;118:463-469.
102 Zucker M.L., Murphy C.A., Rachel J.M., et al. Immature platelet fraction as a predictor of platelet recovery following hematopoietic progenitor cell transplantation. Lab Hematol. 2006;12:125-130.
103 Riley R.S., Ben-Ezra J.M., Tidwell A., et al. Reticulocyte analysis by flow cytometry and other techniques. Haematol Oncol Clin North Am. 2002;16:378-420.
104 Sica S., Sora F., Laurenti L., et al. Highly fluorescent reticulocyte count predicts haemopoietic recovery after immunosuppression for severe aplastic anaemia. Clin Lab Haematol. 1999;21:387-389.
105 Davies S.V., Cavill I., Bentley N., et al. Evaluation of erythropoiesis after bone marrow transplantation: quantitative reticulocyte counting. Br J Haematol. 1992;81:12-17.
106 Davis B.H., Bigelow N., Ball E.D., et al. Utility of flow cytometric reticulocyte quantification as a predictor of engraftment in autologous bone marrow transplantation. Am J Hematol. 1989;32:81-87.
107 Gowans I.D., Hepburn M.D., Clark D.M., et al. The role of the Sysmex SE9000 immature myeloid index and Sysmex R2000 reticulocyte parameters in optimizing the timing of peripheral blood cell harvesting in patients with lymphoma and myeloma. Clin Lab Haematol. 1999;21:331-336.
108 Parisotto R., Gore C.J., Emslie K.R., et al. A novel method utilising markers of altered erythropoiesis for the detection of recombinant human erythropoietin abuse in athletes. Haematologica. 2000;85:564-572.
109 Torres Gomez A., Casaño J., et al. Utility of reticulocyte maturation parameters in the differential diagnosis of macrocytic anaemias. Clin Lab Haematol. 2003;25:283-288.
110 Thomas L., Franck S., Messinger M., et al. Reticulocyte hemoglobin measurement – comparison of two methods in the diagnosis of iron-restricted erythropoiesis. Clin Chem Lab Med. 2005;43:1193-1202.
111 Urrechaga E. Clinical utility of the Beckman Coulter parameter red blood cell size factor in the study of erythropoiesis. International Journal of Laboratory Hematology. 2009;31:623-629.
112 Briggs C., Guthrie D., Hyde K., et al. British Committee for Standards in Haematology General Haematology Task Force. Guidelines for point-of-care testing: haematology. Br J Haematol. 2008;142:904-915.
113 International Committee for Standardization in Haematology; Expert Panel on Cytometry. The assignment of values to fresh blood used for calibrating automated blood cell counters. Clin Lab Haematol. 1988;10:203-212.
114 Lewis S.M., England J.M., Rowan R.M. Current concerns in haematology 3: Blood count calibration. J Clin Pathol. 1991;44:881-884.
115 International Council for Standardization in Haematology. Reference method for the enumeration of erythrocytes and leucocytes. Clin Lab Haematol. 1994;16:131-138.
116 National Committee for Clinical Laboratory Standards. Performance goals for the internal quality control of multichannel hematology analysers; approved standard. Wayne PA: NCCLS; 1996.
117 British Committee for Standards in Haematology. Assessment of the need for blood film examination with blood counts by aperture-impedance systems. In: Roberts B., editor. Standard Haematology Practice. Oxford: Blackwell Scientific; 1991:34-42.
118 Koepke J.A. Instrument flagging and blood film review. In: Rowan R.M., van Assendelft O.W., Preston F.E., editors. Advanced Laboratory Methods in Haematology. London: Arnold; 2002:64-77.
119 Barnes P.W., McFadden S., Machin S.J., et al. The international consensus group for hematology review: suggested criteria for action following automated CBC and WBC differential analysis. Lab Hematol. 2005;11:83-90.