[level-membership-for-allergy-and-immunology-category]
Automated Procedures
At the conclusion of this chapter, the reader should be able to:
• Identify and give examples of the three phases in automated testing.
• Describe the principle, advantages, and disadvantages of nephelometry.
• Discuss the analysis and clinical implications of cryoglobulins.
• Explain the principle of flow cell cytometry and cite clinical applications.
• Discuss current trends in immunoassay.
• List at least three potential benefits of automated immunoassay.
• Analyze a case study related to immunoassay.
• Correctly answer case study related multiple choice questions.
• Be prepared to participate in a discussion of critical thinking questions.
• View and discuss questions related to videos about flow cytometry.
Characteristics of Automated Testing
The analytic phase involves the following areas:
The postanalytic phase includes adding to patient cumulative reports, workload recording, and networks to other systems. Quality assurance (QA) procedures, including the use of quality control (QC) solutions, are part of the analytic functions of the analyzer and its interfaced computer. The Clinical Laboratory Improvement Amendments of 1988 (CLIA ’88) regulations require the documentation of all QC data associated with any test results reported (see Chapter 7). Harmonization of analytes has been gaining momentum as an essential component of the outcomes of analysis. In the future, harmonized or normalized results may be mapped together and presented numerically and graphically to reduce data output.
Nephelometry
Nephelometry has become increasingly more popular in diagnostic laboratories and depends on the light-scattering properties of antigen-antibody complexes (Fig. 13-1).
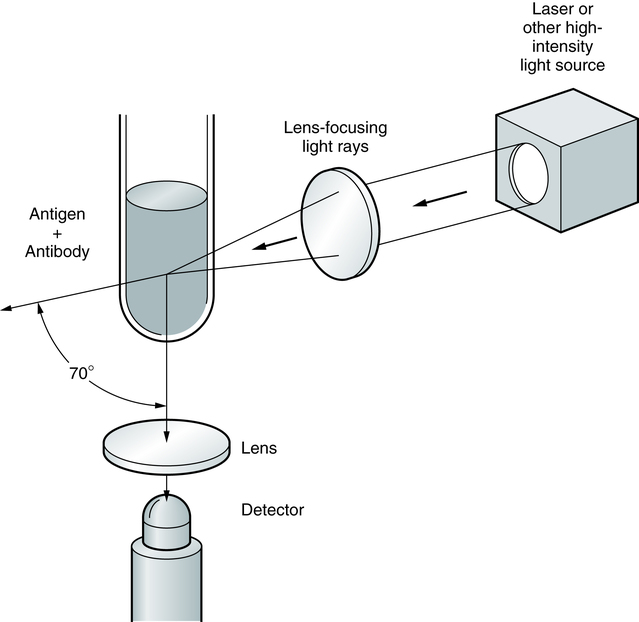
Light rays are collected in a focusing lens and can ultimately be related to the antigen or antibody concentration in a sample.
In immunology, nephelometry is used to measure complement components, immune complexes, and the presence of a variety of antibodies (Box 13-1).
Flow Cell Cytometry
Fundamentals of Laser Technology
The electromagnetic spectrum ranges from long radio waves to short, powerful gamma rays (Fig. 13-2). Within this spectrum is a narrow band of visible or white light, composed of red, orange, yellow, green, blue, and violet light. Laser (light amplification by stimulated emission of radiation) light ranges from the ultraviolet (UV) and infrared (IR) spectrum through all the colors of the rainbow. In contrast to other diffuse forms of radiation, laser light is concentrated. It is almost exclusively of one wavelength or color, and its parallel waves travel in one direction. Through the use of fluorescent dyes, laser light can occur in numerous wavelengths. Types of lasers include glass-filled tubes of helium and neon (most common), yttrium-aluminum-garnet (YAG; an imitation diamond), argon, and krypton.
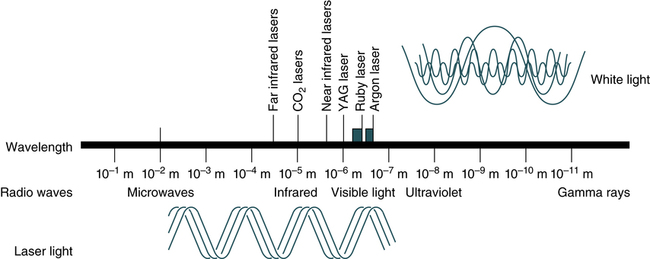
YAG, Yttrium-aluminum-garnet. (From Turgeon ML: Clinical hematology: theory and procedures, ed 5, Philadelphia, 2012, Lippincott, Williams & Wilkins.)
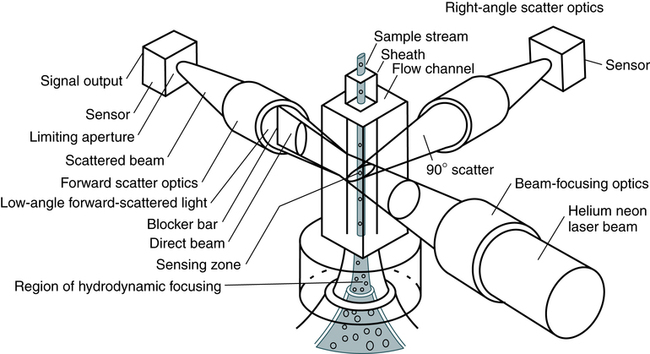
Principles of Cell Cytometry
A suspension of stained cells is pressurized using gas and transported through plastic tubing to a flow chamber within the instrument (Fig. 13-3). In the flow chamber, the specimen is injected through a needle into a stream of physiologic saline called the sheath. The sheath and specimen both exit the flow chamber through a 75-µm orifice. This laminar flow design confines the cells to the center of the saline sheath, with the cells moving in single file.
Immunophenotyping
Monoclonal antibodies, identified by a cluster designation (CD), are used in most flow cytometry immunophenotyping (Table 13-1). Cell surface molecules recognized by monoclonal antibodies are called antigens because antibodies can be produced against them or are called markers because they identify and discriminate between (mark) different cell populations. Markers can be grouped into several categories. Some are specific for cells of a particular lineage (e.g., CD4+ lymphocytes) or maturational pathway (e.g., CD34+ progenitor stem cells); the expression of others can vary, according to the state of activation or differentiation of the same cells.
Table 13-1
Commonly Used Monoclonal Antibodies in Flow Cytometry
| CD Designation | Cell Type |
| CD2 | Thymocytes, T lymphocytes, natural killer (NK) cells |
| CD3 | Thymocytes, T lymphocytes |
| CD4 | T lymphocytes (helper subset), monocytes (dimly expressed), macrophages |
| CD5 | Mature T lymphocytes, thymocytes, subset of B lymphocytes (B1) |
| CD8 | T lymphocytes (cytotoxic), macrophages |
| CD10 | T and B lymphocyte precursors, bone marrow stromal cells |
| CD19 | B lymphocytes, follicular dendritic cells |
| CD21 | B cells, follicular dendritic cells, subset of immature thymocytes |
| CD23 | B cells, monocytes, follicular dendritic cells |
| CD25 | Activated T lymphocytes, B cells, monocytes |
| CD34 | Progenitor (hematopoietic stem cells) |
| CD44 | Most leukocytes |
| CD45 | All hematopoietic cells |
| CD56 | Subsets of T lymphocytes, NK cells |
| CD94 | Subsets of T lymphocytes, NK cells |
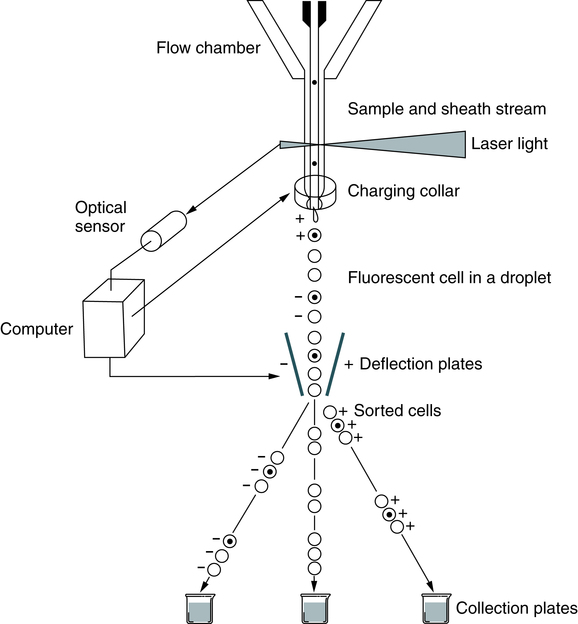
In flow cytometry, cells can be sorted from the main cellular population into subpopulations for further analysis (Fig. 13-4). Any fresh specimen that can be placed into a single-cell suspension is a valid candidate for immunophenotyping (e.g., T cells, B cells, CD34+ stem cells; detection of minimal residual disease in leukemia). Sorting is accomplished using stored computer information.
Multicolor Immunofluorescence
Eight-color immunofluorescence offers the advantages of greater sensitivity and specificity, with increased ability to identify and subclassify individual cells. Improvements in methods and probes may lead to fluorescence in situ hybridization (FISH) in suspension as a routine protocol (see Chapter 12) and enable flow cytometry to operate on a molecular level simultaneously to identify chromosomal abnormalities.
A system that uses a flow cytometer, specific data analysis software, and fluorescent latex particles, the Luminex 100 Total System, has been developed by Luminex Technology (Austin, Texas). This system combines advances in computing and optics with a new concept in color coding to create a simple, cost-effective analysis system (Fig. 13-5). Latex beads are coupled to various amounts of two different fluorescent dyes, which are analyzed by the flow cytometer and software to allow the distinct separation of up to 64 slightly different colored bead sets. The color-coded microspheres identify each unique reaction. Hundreds of microsphere sets can be identified at once in a single sample. Optical technology recognizes each microsphere and provides a precise, quantitative measure simply and in real time.
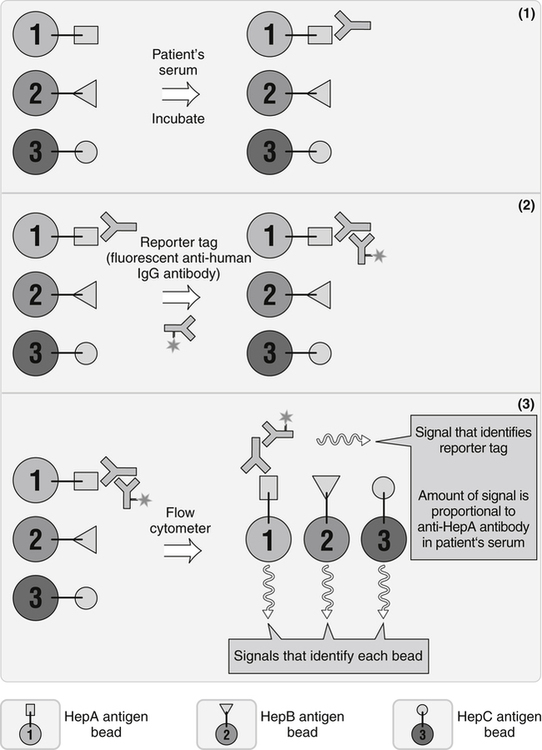
This approach is especially valuable when multiple tests must be done. It uses aspects of enzyme-linked immunosorbent assay (ELISA) and flow cytometry. A small amount of sample is known. Polystyrene microspheres are internally color-coded with two fluorescent dyes that can be detected after laser illumination. (From Nairn R, Helbert M: Immunology for medical students, ed 2, St Louis, 2007, Mosby.)
Clinical Immunology Applications
Lymphocyte Subsets
A six-color flow cytometry diagnostic application uses the BD FACSCanto II flow cytometer and BD Multitest six-color TBNK with BD Trucount tubes to determine the absolute counts of mature T, B, and natural killer (NK) lymphocytes (Fig. 13-6), as well as CD4+ and CD8+ T cell subsets in human peripheral blood, in a single tube.
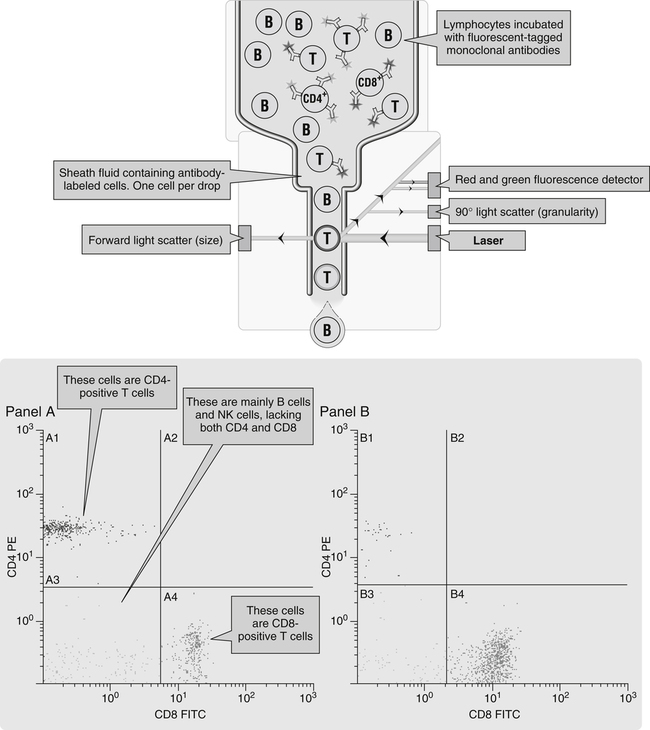
Panel A, Cells stained with the red CD4 antibody account for 59% of all lymphocytes; this is a normal sample. Panel B, There is a reduction in the number of red-staining CD4+ T cells; this sample is from a patient with HIV infection. FITC, Fluorescein isothiocyanate (emits green light); PE, phycoerythrin (emits red light); (From Nairn R, Helbert M: Immunology for medical students, ed 2, St Louis, 2007, Mosby.)
Trends in Immunoassay Automation
Technical advances in methodologies, robotics, and computerization have led to expanded immunoassay automation (Table 13-2; Box 13-2). Newer systems use chemiluminescent labels and substrates rather than fluorescent labels and detection systems, such as enzyme immunoassays (see Chapter 12). Immunoassay systems have the potential to improve turnaround time, with enhanced cost-effectiveness (Box 13-3).
Table 13-2
Representative Immunoassay Instruments
| Manufacturer | ||||
| Abbott | Beckman Coulter | Binding Site | Biomérieux | |
| Representative model | Architect ii2000 | Access/Access2 | SPA-PLUS | VIDAS Immunoassay Analyzer |
| Representative immunology assays (other analytes are available for testing) available in United States∗ | HIV, Ag/AbCombo, HE-4, CA-125, CA 15-3, CA 19-9XR, CEA, hCG (total β-hCG), anti-HAV IgM, anti-HBc IgM, anti-HBs, anti-HCV, HBsAg, HBsAg confirmatory | Total IgE, EPO, intrinsic factor ab, rubella IgG, toxo IgG, toxo IgM, total β-hCG, TPOAb, PSA, free PSA | Freelite kappa (free kappa light chain), freelite lambda (free lambda light chain), β2-microglobulin, IgG, IgA, IgM, IgD, IgG1, IgG2, IgG3, IgG4, C3, C4, IgA1, IgA2, t. tox plasma screening RUO only | HCG, measles IgG, mumps IgG, rubella IgG, varicella zoster virus IgG, Lyme IgG and IgM, toxo competition, toxo IgG, toxo IgM, toxo IgG avidity, CMVM, CMVG |
| Immunology assays not available in United States but available in other countries | AFP, anti-HAV IgG, anti-HAV IgG, anti-HBe, HBeAg, CMV IgG, CMV IgG avidity | HAV Ab, HA IgM, HBcAb, HBc IgM, HBsAb, HBsAg, HBsAg confirmatory, CMV IgG, CMV IgM, rubella IgM | CH50, albumin CSF, IgG CSF, IgA CSF, ASO | HBs Ag, anti- HBs total, anti-HBc total, anti-HBc IgM, anti- HBe, HAV IgG, anti-HAV total, HIV duo (ELISA IV) |
| Assay method(s)∗ | CHEMIFLEX (enhanced chemiluminescence) with five flexible protocols; magnetic microparticles | Chemiluminescence; magnetic particles | Turbidimetry | Fluorescence EIA, solid particles |
| Manufacturer | ||||
| BioRad | DiaSorin† | iNova | Ortho | |
| Representative model | Bioplex 2200 | LIAISON XL | DSX | VITROS 3600 |
| Immunology assays (other analytes are available for testing) available in United States∗ | — | EBV IgM, EBNA IgG, VCAIgG, EA IgG, toxo IgG, toxo IgM, CMV IgG, CMV IgM, Treponema IgG-IgM, VZV IgG, hGH, HAV IgM, HAV total antibodies, rubella IgG, HSV-1 type specific IgG, HSV-2 type specific IgG, measles IgG, mumps IgG | Autoimmune, infectious diseases | Total β-hCG, CEA, AFP, CA-125 II, CA 15-3, HBsAg, a-HCV, HBsAg (conf), aHBc, aHBc IgM, aHBs, CA 19-9, aHAV total, aHAV IgM, rubella IgG, HIV-1 and -2 |
| Immunology assays not available in United States but available in other countries | ANA screen, ENA Plus Screen, anti-dsDNA, anti-Jo-1, anti–SS-A, anti–SS-B, anti–Scl-70, anti-Sm, anti–SM-RNA, anti-centromere, antiphospholipid tests, toxo IgG | HSV-1 and -2 IgM, HSV-1 and -2 IgG, HCG, β2-microglobulin, AFP, hCG, rubella IgM | Any ELISA | aHBe, HBeAg, rubella IgM, toxo IgG, toxo IgM, CMV IgG, CMV IgM |
| Assay method(s) | EIA, microwell | Chemiluminescence, magnetic particle | EIA, coated microwell | Chemiluminescence, enhanced chemiluminescence/coated microwell |
| Manufacturer | |||
| Roche | Siemens | TOSOH | |
| Representative model | Cobas 8000/2010 | Dimension Vista 500 Intelligent Lab System | AIA-900/2011 |
| Immunology assays (other analytes are available for testing) available in United States∗ | Anti-CCP, anti-HAV IgM, anti-HAV total, CA125, CA 15-3, CA 19-9, CEA, hCG II state, HCF and + beta, hGH, IgE, rubella IgG | 20 immunoassays including CA 19-9 | AFP, CEA, CA 125, CA 19, 27, 29, β2-microglobulin, IgE II |
| Immunology assays not available in United States but available in other countries | Anti-HCV, free β-hCG, anti-HBc IgM, HBeAg, anti-HBe, HIV Ag, HIV Ag confirmatory test, HIV combi, toxo IgM, CMV IgG, CMV IgM, CA 72-4 | CA 15-3, CA 19-9 | HBsAg, ABsAb, HBcAb, HBeAv, HCVAb, hCG |
| Assay method(s) | Electrochemiluminescence, magnetic particle | Chemiluminescence, LOCI advanced chemiluminescence, EMIT, PETINIA, nephelometry, magnetic particle, homogeneous immunoassay | Fluorescence, enzyme immunoassay, bead |
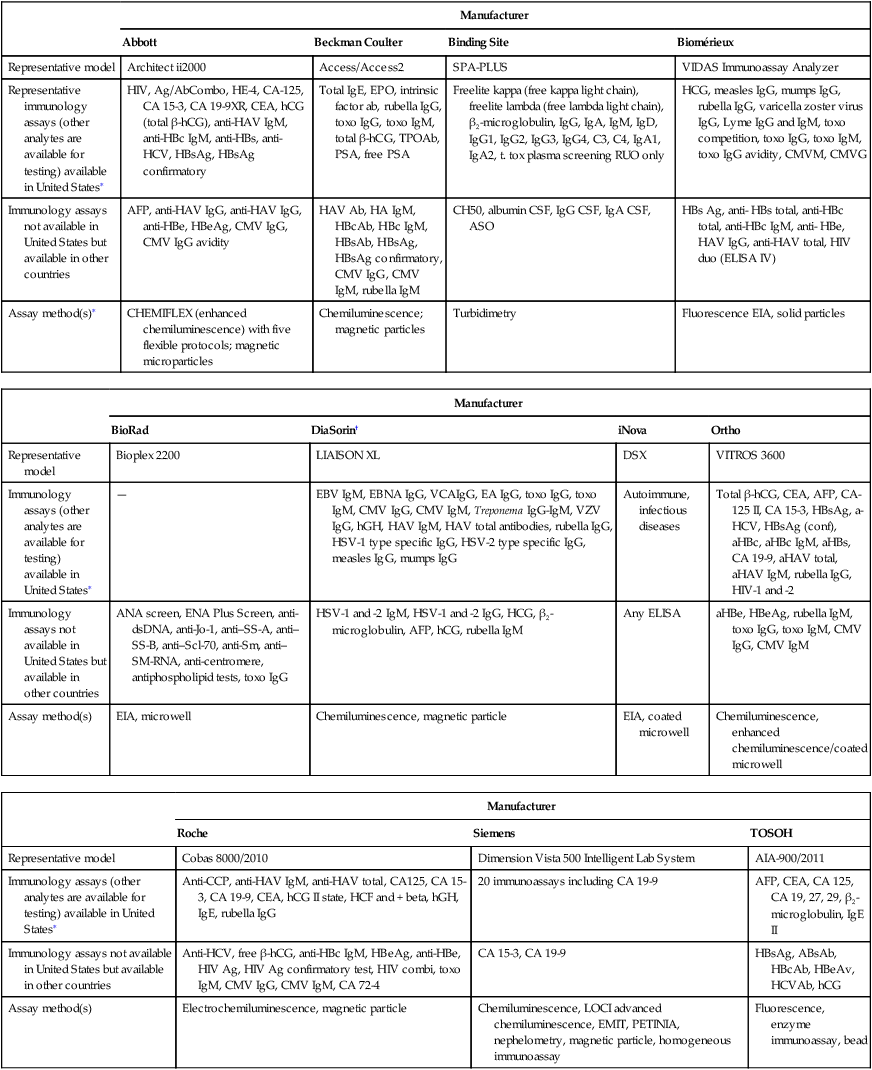
∗This is a partial list of immunology assays. It includes autoimmune, cancer-related, and infectious disease antibodies and/or antigens. Other analytes are not included in the list.
†DiaSorin tests not available on other manufacturers’ analyzers: Borrelia burgdorferi, VZV IgG, HSV-1 type-specific IgG, HSV-2 type-specific IgG, EBV IgM, EBNA IgG, VCA IgG, EA IgG.
Adapted from CAP TODAY: Automated immunoassay analyzers, Vol. 26, No. 7, July, 2012, pp. 18-54.
Fluorescent Polarization Immunoassay
Case Study
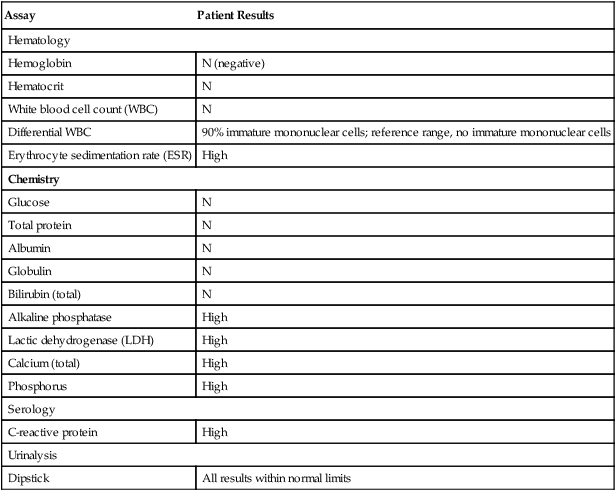
History and Physical Examination
| Assay | Patient Results |
| Hematology | |
| Hemoglobin | N (negative) |
| Hematocrit | N |
| White blood cell count (WBC) | N |
| Differential WBC | 90% immature mononuclear cells; reference range, no immature mononuclear cells |
| Erythrocyte sedimentation rate (ESR) | High |
| Chemistry | |
| Glucose | N |
| Total protein | N |
| Albumin | N |
| Globulin | N |
| Bilirubin (total) | N |
| Alkaline phosphatase | High |
| Lactic dehydrogenase (LDH) | High |
| Calcium (total) | High |
| Phosphorus | High |
| Serology | |
| C-reactive protein | High |
| Urinalysis | |
| Dipstick | All results within normal limits |
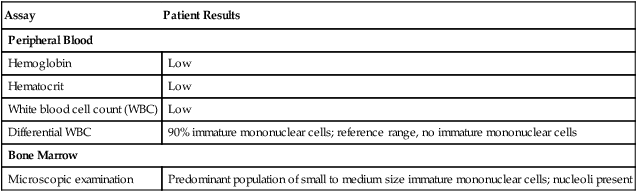
Hematology (4 days after admission)
| Assay | Patient Results |
| Peripheral Blood | |
| Hemoglobin | Low |
| Hematocrit | Low |
| White blood cell count (WBC) | Low |
| Differential WBC | 90% immature mononuclear cells; reference range, no immature mononuclear cells |
| Bone Marrow | |
| Microscopic examination | Predominant population of small to medium size immature mononuclear cells; nucleoli present |
Critical Thinking Group Discussion Questions
1. What is the significance of positive reactivity of CD45?
2. What is the significance of positive reactivity of CD34?
3. What is the significance of positive reactivity of CD19 and CD20?
4. What is the significance of a normal cytogenetic profile?
See instructor site  for the discussion of the answers to these questions.
 Procedure Laboratory Activities
http://www.coulterflow.com/bciflow/flowanimations/principles/a001_flowprinciples_content_objectives.html
Animated Flow Cytometry Theory—Theory #1
After completing this presentation you will be able to:
• Define the terms: sheath, hydrodynamic focusing, forward scatter, side scatter, fluorescence, peak, integral, amplification, noise discrimination, analog to digital, histogram, dotplot, gating, TOF (Gallios only), and analysis.
• Identify the hardware components: flow cell, laser beam, filters, and photomultiplier tubes.
• Identify the sequence of events in the sensing process.
• Describe the effect that pressure, high voltage, gains, and noise discrimination have on the signals.
• Identify region types and the use of regions for gating and analysis.
Chapter Highlights
• When specific antigen-coated latex particles acting as reaction intensifiers are agglutinated by their corresponding antibody, the increased light scatter of a solution can be measured by nephelometry as the macromolecular complex form.
• Nephelometry is a rapid and highly reproducible automated method.
• Cryoglobulins are proteins that precipitate or gel when cooled to 0° C (32° F) and dissolve when heated. In most cases, monoclonal cryoglobulins are IgM or IgG.
• Flow cytometry is based on cells being stained in suspension with an appropriate fluorochrome (immunologic reagent, dye that stains specific component, other marker with specified reactivity).
• Laser light is the most common light source used in flow cytometers.
• Color immunofluorescence uses monoclonal antibodies, each directly conjugated to a distinct fluorochrome, per tube of patient cell suspension. Eight-color immunofluorescence offers the advantages of greater sensitivity and specificity.
• Newer systems in immunoassay automation use chemiluminescent labels and substrates rather than fluorescent labels and detection systems.
[/level-membership-for-allergy-and-immunology-category][not-level-membership-for-allergy-and-immunology-category]
Automated Procedures
At the conclusion of this chapter, the reader should be able to:
• Identify and give examples of the three phases in automated testing.
• Describe the principle, advantages, and disadvantages of nephelometry.
• Discuss the analysis and clinical implications of cryoglobulins.
• Explain the principle of flow cell cytometry and cite clinical applications.
• Discuss current trends in immunoassay.
• List at least three potential benefits of automated immunoassay.
• Analyze a case study related to immunoassay.
• Correctly answer case study related multiple choice questions.
• Be prepared to participate in a discussion of critical thinking questions.
• View and discuss questions related to videos about flow cytometry.
Characteristics of Automated Testing
The analytic phase involves the following areas:
The postanalytic phase includes adding to patient cumulative reports, workload recording, and networks to other systems. Quality assurance (QA) procedures, including the use of quality control (QC) solutions, are part of the analytic functions of the analyzer and its interfaced computer. The Clinical Laboratory Improvement Amendments of 1988 (CLIA ’88) regulations require the documentation of all QC data associated with any test results reported (see Chapter 7). Harmonization of analytes has been gaining momentum as an essential component of the outcomes of analysis. In the future, harmonized or normalized results may be mapped together and presented numerically and graphically to reduce data output.
Nephelometry
Nephelometry has become increasingly more popular in diagnostic laboratories and depends on the light-scattering properties of antigen-antibody complexes (Fig. 13-1).
Light rays are collected in a focusing lens and can ultimately be related to the antigen or antibody concentration in a sample.
In immunology, nephelometry is used to measure complement components, immune complexes, and the presence of a variety of antibodies (Box 13-1).
Flow Cell Cytometry
Fundamentals of Laser Technology
The electromagnetic spectrum ranges from long radio waves to short, powerful gamma rays (Fig. 13-2). Within this spectrum is a narrow band of visible or white light, composed of red, orange, yellow, green, blue, and violet light. Laser (light amplification by stimulated emission of radiation) light ranges from the ultraviolet (UV) and infrared (IR) spectrum through all the colors of the rainbow. In contrast to other diffuse forms of radiation, laser light is concentrated. It is almost exclusively of one wavelength or color, and its parallel waves travel in one direction. Through the use of fluorescent dyes, laser light can occur in numerous wavelengths. Types of lasers include glass-filled tubes of helium and neon (most common), yttrium-aluminum-garnet (YAG; an imitation diamond), argon, and krypton.
YAG, Yttrium-aluminum-garnet. (From Turgeon ML: Clinical hematology: theory and procedures, ed 5, Philadelphia, 2012, Lippincott, Williams & Wilkins.)
Principles of Cell Cytometry
A suspension of stained cells is pressurized using gas and transported through plastic tubing to a flow chamber within the instrument (Fig. 13-3). In the flow chamber, the specimen is injected through a needle into a stream of physiologic saline called the sheath. The sheath and specimen both exit the flow chamber through a 75-µm orifice. This laminar flow design confines the cells to the center of the saline sheath, with the cells moving in single file.
Immunophenotyping
Monoclonal antibodies, identified by a cluster designation (CD), are used in most flow cytometry immunophenotyping (Table 13-1). Cell surface molecules recognized by monoclonal antibodies are called antigens because antibodies can be produced against them or are called markers because they identify and discriminate between (mark) different cell populations. Markers can be grouped into several categories. Some are specific for cells of a particular lineage (e.g., CD4+ lymphocytes) or maturational pathway (e.g., CD34+ progenitor stem cells); the expression of others can vary, according to the state of activation or differentiation of the same cells.
Table 13-1
Commonly Used Monoclonal Antibodies in Flow Cytometry
[/not-level-membership-for-allergy-and-immunology-category]
