[level-membership-for-internal-medicine-category]
Chapter 7 Attenuation Correction and Scatter Correction of Myocardial Perfusion SPECT Images
HISTORICAL PERSPECTIVE
The field of SPECT imaging was born out of pioneering work done at Duke University in the late 1970s under Ronald Jaszczak1 and John Keyes.2 It was demonstrated that three-dimensional radionuclide imaging could be obtained using an Anger camera rotating around a patient. As early as 1977, it was recognized that attenuation would be one of the major limitations of the new imaging modality.
The effort to solve the problem of attenuation artifacts in nuclear cardiology was carried forward by several groups around the world. Moore et al. demonstrated the feasibility of performing attenuation correction using x-ray computed tomography (CT),3 and Greer KL et al.4 demonstrated the feasibility of acquiring transmission data with a gamma camera system. A complete history of the development of attenuation correction can be found in King et al., 1995.5
The impact of attenuation was first quantitated in the work of Eisner et al. in 1988.6 In this work, differences between males and females were correctly identified as arising from differences in anatomy. This led to significant differences in the mean normal distribution patterns in the left anterior descending (10% to 15% higher in males than females) and right coronary artery (8% to 10% higher in females than males). Later work by Galt et al. demonstrated that with the application of attenuation correction methods, these normal distributions were similar.7 Depuey et al. developed techniques for identifying attenuation and presented algorithms for improving interpretive accuracy using deductive techniques.8
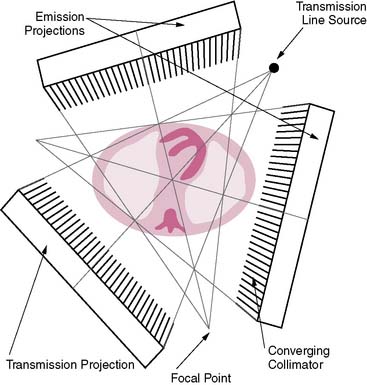
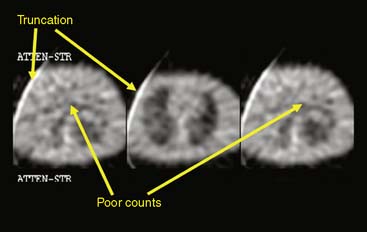
The first attempts at commercialization of attenuation correction were introduced by Picker with its STEP system (Fig. 7-1). This technique was based on the geometry proposed by Tung9 and Jaszczak.10 The system employed a fanning collimator design to collect photons from a fixed line source opposite the detector head on a triple-headed detector system. Early work using this system demonstrated that significant improvements in uniformity could be obtained using the fanbeam collimation system with attenuation correction.11,12 This system failed to received widespread acceptance, because it employed a triple-detector SPECT system and fanbeam collimation. The use of fanbeam collimation led to very extreme truncation artifacts, owing to the small field of view of the fanbeam geometry (~30 cm). Furthermore, the added cost of a third detector system and loss of clinical efficiency from the 120-degree angles of the triple-head systems made this system cost prohibitive.
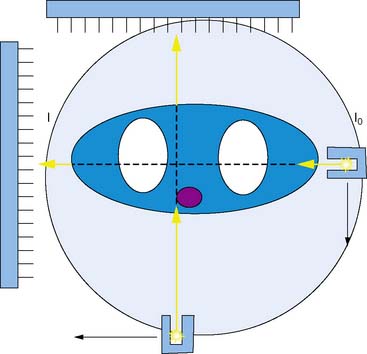
Other vendors introduced parallel-geometry scanning line source systems. The Vantage/ExSPECT system, introduced by ADAC laboratories, used a 90-degree parallel-hole geometry system for simultaneously acquiring emission and transmission data (Fig. 7-2).13 Using this approach, one of the few multicenter trials of attenuation correction was conducted, demonstrating significant improvement in specificity and normalcy. These results were also duplicated in several single and multicenter imaging trials using various vendor approaches.14–21
One of the major limitations of the first-generation systems was that though they work reasonably well in clinical trials, they did not always perform well in the clinical setting.22 Quality control (QC) of the attenuations correction systems was not well understood, and systematic QC procedures were not in place in most nuclear laboratories attempting to use attenuation correction. The result of this was a very uneven application of QC standards in the field and an eventual low rate of adoption by practitioners.
To address these limitations, ADAC laboratories introduced a second-generation processing suite for its Vantage scanning line source systems, the VantagePRO (Philips Medical, Milpitas, CA). This package used a combination of pre- and post-acquisition QC tools combined with a Bayesian iterative reconstruction algorithm to improve the consistency of the resulting images.23 Clinical trials using this approach demonstrated significant improvement in normalcy and specificity; however, because of the retrospective nature of the study, sensitivity did not show improvement over conventional non-attenuation-corrected imaging.
Another approach that was investigated was the use of x-ray computed tomography to derive the patient-specific attenuation map. Because of the high count flux, very high-quality transmission maps can be obtained. Clinical results from these systems have been reported, and they have been shown to produce significant improvement in interpreter accuracy over non-attenuation-corrected image approaches.24,25
The limitation of x-ray-based approaches is that they are inherently sequential acquisition protocols. Transmission/emission image registration issues, as well as clinical efficiency concerns, have limited the acceptance of these systems. The Hawkeye System, introduced by General Electric, was a departure from the conventional line source attenuation correction, insofar as it employed a low-dose x-ray tube (140 kVp, 2.5 mAs) to generate a patient-specific x-ray-based CT attenuation map referred to as hybrid imaging SPECT/CT. This technique was capable of producing transmission maps and attenuation-corrected images of higher quality (Fig. 7-3). As the need for diagnostic-quality transmission maps has arisen, vendors have introduced SPECT/CT hybrid systems capable of detecting and measuring coronary calcium and performing vascular and coronary CT angiography (Siemens [Symbia], Philips [Precedence]).
SCIENTIFIC FOUNDATION OF ATTENUATION: COMPTON SCATTERING AND THE PHOTOELECTRIC EFFECT (See Chapter 6)
This process is played out in a similar way in the high-energy regimen, albeit with different physical processes in play. Nuclear cardiology (and x-ray imaging as well) exists because of a very peculiar fact of nature: At these energies, the seemingly solid object of the human body is not nearly as solid as it appears. To understand this, we have to introduce an interesting concept, the wave-particle duality of photons.1 At higher and higher energies, photons act as if they have smaller and smaller sizes. In the gamma ray and x-ray ranges, photons could pass through a solid object with little effort. To a high-energy gamma ray, the body looks less like a solid object and more like a cloud of electrons.1
To be precise, attenuation is a misnomer. Most of what is referred to as “attenuation” in nuclear cardiology is in reality photon scatter. The dominant process for “attenuating” photon signal in the energy range used in nuclear cardiology is known as Compton scattering. This process, discovered by Arthur H. Compton in 1923 (resulting in Compton and his graduate student being awarded the Nobel Prize in physics26), is the quantum scatter of light off of matter and the transfer of significant amounts of energy from the photon to the electron.
The photon in a Compton scattering event can be thought of as a billiard ball striking the electron. The electron then absorbs some of the energy from the photon, lowering the energy of the photon (Fig. 7-4). The key parameters of a Compton scattering event are the incident energy of the photon (E0) and the scattering angle of the photon relative to its incident and (θ). The higher the incident energy, the more relative energy can be delivered to the electron. (Imagine a compact car–against-truck head-on collision versus a truck-against-truck collision: The second truck will fare worse in the latter scenario.) Furthermore, the larger the scattering angle, the more energy that can be delivered to the electron. Compton demonstrated that the exact energy of the scattered photon can be calculated from the following formula:
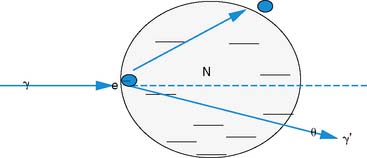
where E0 is the energy of the incident photon, mec2 is the resting energy of an electron (511 keV), and θ is the angle of the scattered photon relative to the incident photon. For a backscattered photon: θ = 180 degrees. Solving the Compton equation:
PHYSICS OF ATTENUATION AND SCATTER COMPENSATION

where I is the flux, μ is the linear attenuation coefficient, and  is the change in I over a small distance. In other words, the change in the number of photons over a small distance of material is proportional to the single physical parameter, μ. Solving this equation yields:
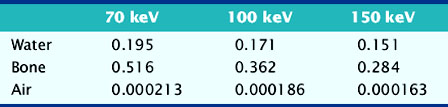
The value of μ is dependent on the characteristics of the material in question and the energy of the incident photons. Examples of linear attenuation coefficients are given in Table 7-1.
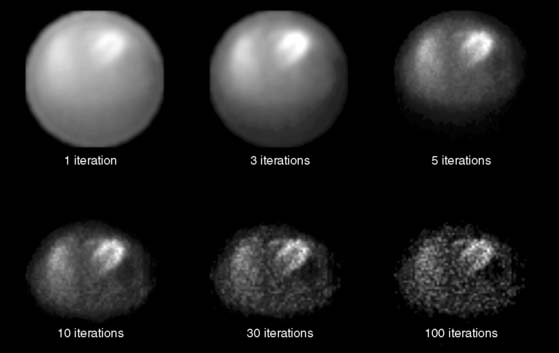
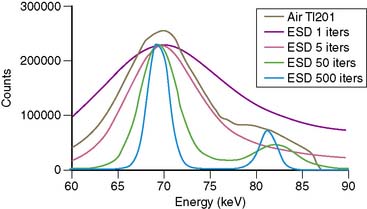
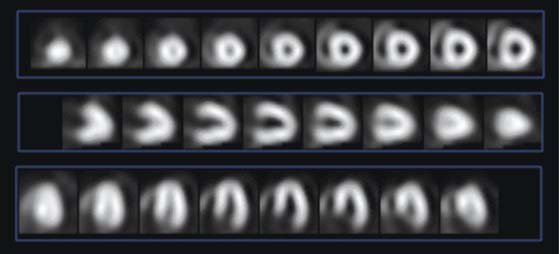
The most common iterative reconstruction algorithm is the maximum-likelihood expectation maximization (MLEM) algorithm.27,28 This model employs an iterative approach for searching for the most likely source of the projection data, based on a physical model of how photons get from the patient to the camera. As one might expect, if the data are bad and the model is wrong, MLEM will not converge to the correct solution. The main strength of MLEM is the ease of which physics of attenuation can be modeled into the reconstruction. An example of the convergence of MLEM is given in Figure 7-5.
There are other iterative algorithms in addition to MLEM. Ordered subset expectation maximization (OSEM) is also commonly used. While its origins are similar to those of MLEM, OSEM has much more rapid convergence properties. OSEM uses pieces of the data to create each update of the data (subset). Each iteration of OSEM can result in several updates of the reconstruction map. This has the effect of greatly increasing the convergence time of the algorithm.29
where d is the thickness of the slab, I0 is the flux of the incident beam, and I is the resulting flux.
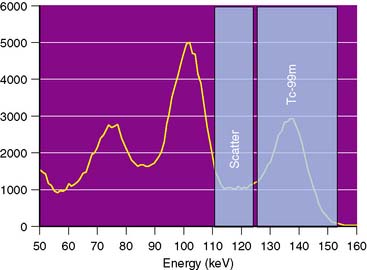
Similar to attenuation correction, scatter correction relies on acquiring a patient-specific estimate of photon scatter. The most common technique for scatter estimation is the acquisition of adjacent energy windows to subtract the scatter component from the photo peak component (Fig. 7-6). These techniques typically use a secondary energy window placed at a lower energy from the primary photo peak to measure the distribution of Compton scatter photons.30 These techniques can be effective in removing the scatter from 99mTc, but they have been less successful in correcting Tl-201 images. Furthermore, these techniques have been unable to demonstrate measurable improvements in sensitivity.
One possibility for the failure to observe improvement in sensitivity is that scatter window subtraction techniques do not model the smaller-angle scatter events responsible for defect fill-in (Fig. 7-7).31 Several techniques have been described for more accurately modeling photon scatter. These techniques rely upon acquiring several energy windows and using multispectral techniques for modeling the large- and small-angle scattering events.32
TECHNIQUES OF ACQUIRING THE PATIENT-SPECIFIC ATTENUATION MAP
Line Source Attenuation Correction
Tung et al. and Jaszczak et al. proposed one of the first line source systems using a converging fanbeam collimation system.9,10 This system used a triple-detector system with one of the heads dedicated to acquiring the transmission data. This system did not reach widespread acceptance, owing to the added expense of the third detector head and the need for having a second set of collimators.
Another approach was advanced by Tan et al., using a system of scanning line sources.11 This system utilized a set of moving line sources to “scan” the patient. Though this system did require the purchase of robotic housings to contain the line sources, it was more widely accepted because it was more easily retrofitted to the 90-degree detector configuration used in cardiology.
APPLICATIONS FOR ATTENUATION CORRECTION
The American Society of Nuclear Cardiology and the Society of Nuclear Medicine recommend the routine use of attenuation correction as an important adjunct to traditional filtered backprojection images.33 These recommendations are based on the preponderance of evidence that demonstrates that superior specificity can be achieved using attenuation correction. Though anecdotal evidence exists for the improvement of sensitivity, study selection bias and suboptimal scatter correction techniques have been unable to demonstrate improvements in sensitivity.
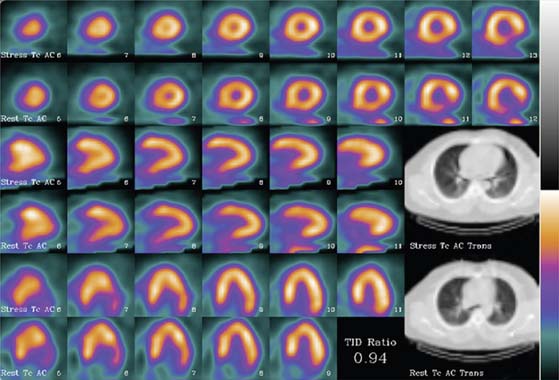
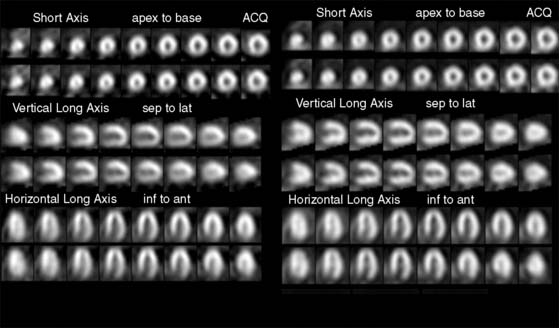
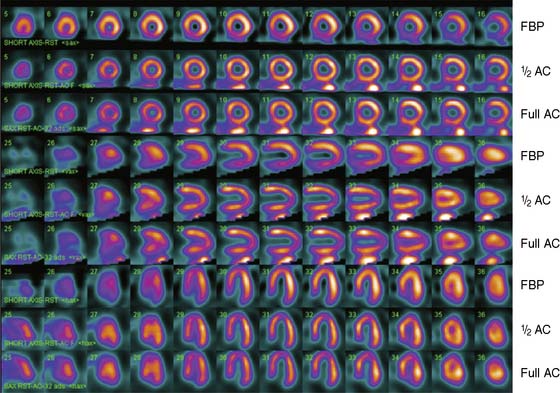
The most common application of attenuation correction is as supplementary data for rest/stress 99mTc- imaging. In these studies, a transmission data set is acquired in conjunction with the emission data set. The data are then reconstructed using a filtered backprojection algorithm for the non-attenuation-corrected data set and an iterative reconstruction for the attenuation-corrected data set. The filtered backprojection images can then be compared to the attenuation-corrected data sets to assess the significance of attenuation on the filtered backprojection images (Fig. 7-9).
Stress Only
Another application that has been promoted is the use of attenuation correction for assessing myocardial perfusion images in the absence of a resting study. In this application, patients presenting with a relatively low pretest likelihood for disease are tested with a stress-first myocardial perfusion test. The physician then will make a determination of the normalcy of the study based on the stress perfusion. If the stress images are normal, the patient is not brought back for rest testing (Fig. 7-10).34
Heller et al.35,36 demonstrated that reader confidence was greatly improved when attenuation correction was applied. Other studies have demonstrated comparable accuracy in the normalcy rate when compared to full-rest stress studies.
Acute Imaging
There has also been considerable work on attenuation correction in the acute setting (during a chest pain episode). In this application, upon admission to the chest pain center or emergency department, the patient is immediately injected with the radiotracer. Studies have demonstrated a high degree of positive predictive value for acute resting imaging if the patient can be injected before the chest pain resolves.37 These studies are almost always performed as a single study (no true rest imaging). Because of the confounding problem of attenuation and the lack of a resting control study, attenuation can render non-attenuation-corrected images of little value.
Quantitative Single-Photon Emission Computed Tomography
As pressure builds for more and more accurate tests for myocardial perfusion imaging, the assessment of large epicardial disease may no longer be sufficient. Myocardial perfusion PET has already seen widespread interest in assessing true myocardial blood flow in terms of mL/g/min. These measurements, in principle, would be independent of the resting perfusion pattern, more sensitive to triple-vessel disease, and capable of measuring serial changes in perfusion.38
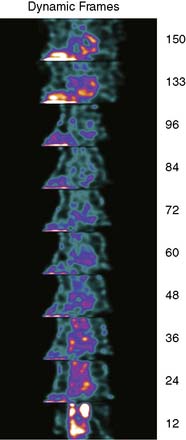
To obtain a quantitative measurement of myocardial perfusion, it is necessary to obtain a measurement in mCi/cc, the dynamic arterial tracer concentration, and the dynamic uptake of the tracer within the myocardium. To achieve this, it is necessary to acquire serial images of the input bolus in SPECT mode with attenuation. These rapid tomographic images must be acquired at such speed as to allow quantification of the input bolus to time less than 6 seconds (Fig. 7-11).
CHALLENGES FOR ATTENUATION CORRECTION
The story of attenuation correction in SPECT is best looked at as both a glass half empty and a glass half full. Most treatments of attenuation and scatter correction focus on either one or the other of these paradigms, best illustrated by the publications of dueling opinions in the Journal of Nuclear Cardiology, 2005.22,39 Though there is little argument that specificity is improved with attenuation correction as is, there is also little argument that attenuation correction has not seen widespread adoption. A more appropriate question is “Why isn’t the glass completely full?”—that is, what is missing to make attenuation correction an unquestionable necessity for SPECT? In fact, the “recommendation” for attenuation correction presented by the American Society of Nuclear Cardiology and the Society of Nuclear Medicine is qualified so as to relegate the attenuation-corrected images to adjunctive information to the patently incorrect noncorrected images.33 This is hardly a ringing endorsement.
The most commonly cited limitation of attenuation-corrected SPECT is the lack of uniformity in some studies. This lack of uniformity is often referred to as overcorrection or undercorrection of the emission data.22 The mathematics of attenuation correction is straightforward,27–29 and its implementation within computer programs is straightforward. Attenuation correction is “working” when a high-quality transmission map is available. However, this may not be all that is going on. Poor scatter correction, partial volume effects, and distance-dependent blur all produce artifacts that are patient and protocol specific.
Significant advances have been made in the implementation of resolution recovery and advanced scatter correction. Flash3D (Siemens, Hoffman Estates, IL), Astonish (Philips, Milpitas, CA) and Wide Beam Reconstruction (UltraSPECT, Haifa, Israel) all use a model for the blurring of the collimator. The results are higher-resolution images with fewer partial-volume artifacts (Fig. 7-12). Improvements in scatter correction will also be necessary for improving the sensitivity of myocardial perfusion SPECT images to smaller defects.31
1. Jaszczak R.J., Murphy P.H., Huard D., Burdine J.A. Radionuclide emission computed tomography of the head with Tc-99m and a scintillation camera. J Nucl Med Inst Phys. 1977;18(4):373-380.
2. Keyes W.I. The fan-beam gamma camera. Phys Med Biol. 1975;20:489-491.
3. Moore S.C., Ell P.J., Holman B.L. Attenuation Compensation in Computed Emission tomography. New York: Oxford University Press, 1982.
4. Greer K.L., Harris C.C., Jaszczak, et al. Transmission computed tomography data acquisition with a SPECT system. J Nucl Med Tech. 1987;15:53-56.
5. King M.A., Tsui B.M.W., Pan T.S. Attenuation compensation for cardiac SPECT imaging. J Nucl Cardiol. 1995;2(6):513-523.
6. Eisner R.L., Tamas M.J., Cloninger K., et al. Normal SPECT Thallium-201 bull’s eye display: Gender differences. J Nucl Med. 1988;29(12):1901-1909.
7. Galt J.R., Arram S.M., Case J.A., Cullom S.J., Habboush I., Shao L., Hines H., Bateman T.M., Garcia E.V. and the multicenter trial investigators. Multicenter evaluation of automated quality control of transmission scans for attenuation correction in myocardial perfusion SPECT. J Am Coll Card. 2001;37(2):425A.
8. Depuey G.E., Garcia E.V., Berman D.S. Cardiac SPECT Imaging, 2nd. Lippincott: Williams, and Wilkins, 2001.
9. Tung C.H., Gullberg G.T., Zeng G.L., Christian P.E., Datz F.L., Morgan H.T. Non-uniform attenuation correction using simultaneous transmission and emission converging tomography. IEEE Trans. Nucl Sci. 1992;39(4):1134-1143.
10. Jaszczak R.J., Gilliand D.R., Hanson M.W., Jang S., Greer K.L., Coleman R.E. Fast transmission CT for determining attenuation maps using a collimated line source, rotatable air-copper-lead attenuators and fanbeam collimation. J Nucl Med. 1993;34:1577-1586.
11. Ficaro E.P., Fessler J.A., Shreve P.D., et al. Simultaneous transmission in emission myocardial perfusion imaging. Circulation. 1996;93(3):463-473.
12. Case J.A. A clinical Protocol for attenuation and scatter correction of Tl-201 and Tc-99m Sestamibi myocardial perfusion SPECT images [PhD dissertation]. Amherst: University of Massachusetts, 1998.
13. Tan P., Bailey D.L., Meikle S.R., Eberl S., Fulton R.R., Hutton B.F. A scanning line source for simultaneous emission and transmission measurements in SPECT. J Nucl Med. 1993;34:1752-1760.
14. Ficaro E.P., Fessler J.A., Shreve P.D., Kritzman J.N., Rose P.A., Corbett J.R. Simultaneous transmission/emission myocardial perfusion tomography. Diagnostic accuracy of attenuation-corrected 99mTc-sestamibi single-photon emission computed tomography. Circulation. 1996;93(3):463-473.
15. Kluge R., Sattler B., Seese A., Knapp W.H. Attenuation correction by simultaneous emission-transmission myocardial single-photon emission tomography using a technetium-99m-labelled radiotracer: impact on diagnostic accuracy. Eur J Nucl Med. 1997;24(9):1107-1114.
16. Gallowitsch H.J., Sykora J., Mikosch P., et al. Attenuation-corrected thallium-201 single-photon emission tomography using a gadolinium-153 moving line source: clinical value and the impact of attenuation correction on the extent and severity of perfusion abnormalities. Eur J Nucl Med. 1998;25(3):220-228.
17. Hendel R.C., Berman D.S., Cullom S.J., et al. Multicenter clinical trial to evaluate the efficacy of correction for photon attenuation and scatter in SPECT myocardial perfusion imaging. Circulation. 1999;99(21):2742-2749.
18. Links J.M., DePuey E.G., Taillefer R., Becker L.C. Attenuation correction and gating synergistically improve the diagnostic accuracy of myocardial perfusion SPECT. J Nucl Cardiol. 2002;9(2):183-187.
19. Hendel R.C., Corbett J.R., Cullom S.J., DePuey E.G., Garcia E.V., Bateman T.M. The value and practice of attenuation correction for myocardial perfusion SPECT imaging: a joint position statement from the American Society of Nuclear Cardiology and the Society of Nuclear Medicine. J Nucl Cardiol. 2002;9(1):135-143.
20. Thompson R.C., Heller G.V., Johnson L.L., et al. Value of attenuation correction on ECG-gated SPECT myocardial perfusion imaging related to body mass index. J Nucl Cardiol. 2005;12(2):195-202.
21. Grossman G.B., Garcia E.V., Bateman T.M., et al. Quantitative Tc-99m sestamibi attenuation-corrected SPECT: development and multicenter trial validation of myocardial perfusion stress gender-independent normal database in an obese population. J Nucl Cardiol. 2004;11(3):263-272.
22. Germano G., Slomka P.J., Berman D.S. Attenuation correction in cardiac SPECT: the boy who cried wolf? J Nucl Cardiol. 2006;14:25-35.
23. Case J.A., Hsu B.L., Bateman T.M., Cullom S.J. A Bayesian iterative transmission gradient reconstruction algorithm for cardiac SPECT attenuation correction. J Nucl Cardiol. 2007;14(3):324-333.
24. Masood Y., Liu Y.H., Depuey G., et al. Clinical validation of SPECT attenuation correction using x-ray computed tomography-derived attenuation maps: multicenter clinical trial with angiographic correlation. J Nucl Cardiol. 2005;12(6):676-686.
25. Fricke E., Fricke H., Weise R., et al. Attenuation correction of myocardial SPECT perfusion images with low-dose CT: evaluation of the method by comparison with perfusion PET. J Nucl Med. 2005;46(5):736-744.
26. Nobel Lectures. Physics 1922–1941. Amsterdam: Elsevier, 1965.
27. Shepp L.A., Vardi Y. Maximum likelihood reconstruction for emission tomography. IEEE Trans Med Imaging. 1982;MI-1(2):113-122.
28. Lange K., Carson R. EM reconstruction algorithms for emission and transmission tomography. J Comput Assist Tomogr. 1984;8:306-316.
29. Hudson M.H., Larkin R.S. Accelerated image reconstruction using ordered subsets of projection data. IEEE Trans Med Imaging. 1994;13(4):601-609.
30. Ogawa K., Harata Y., Ichihara T., Kubo A., Hashimoto S. A practical method for position-dependent Compton scatter correction in single photon emission CT. IEEE Trans Med Imaging. 1991;10:408-412.
31. Case J.A., Hsu B.L., Cullom S.J., Bateman T.M. Importance of Tl-201 scatter compensation for resolution and contrast matching in rest Tl-201/stress Tc-99m myocardial perfusion SPECT imaging. J Nucl Med. 2005;46:173P.
32. Gagnon D., Todd-Pokropek A., Arsenault A., Dupras G. Introduction to holospectral imaging in nuclear medicine for scatter subtraction. IEEE Trans Med Imaging. 1989;8:245-250.
33. Hendel R.C., Corbett J.R., Cullom S.J., DePuey E.G., Garcia E.V., Bateman T.M. The value and practice of attenuation correction for myocardial perfusion SPECT imaging: a joint position statement from the American Society of Nuclear Cardiology and the Society of Nuclear Medicine. J Nucl Cardiol. 2002;9(1):135-143.
34. Gibson P.B., Demus D., Noto R., Hudson W., Johnson L.L. Low event rate for stress-only perfusion imaging in patients evaluated for chest pain. J Am Coll Cardiol. 2002;39(6):999-1004.
35. Heller G.V., Bateman T.M., Johnson L., et al. Clinical value of attenuation correction in stress-only Tc-99m sestamibi SPECT imaging. J Nucl Cardiol. 2004;11(3):273-281.
36. Heller G.V., Links J., Bateman T.M., et al. American Society of Nuclear Cardiology and Society of Nuclear Medicine joint position statement: attenuation correction of myocardial perfusion SPECT scintigraphy. J Nucl Cardiol. 2004;11(2):229.
37. Holly T.A., Toth B.M., Leonard S.M., et al. Incremental value of attenuation correction in SPECT myocardial perfusion imaging for patients with acute chest pain. Circulation. 1997;96:1735.
38. deKemp R.A., Yoshinaga K., Beanlands R.S.B. Will 3-dimensional PET-CT enable the routine quantification of myocardial blood flow? J Nucl Cardiol. 2007;14:380-397.
39. Garcia E. SPECT Attenuation correction: An essential tool to realize nuclear cardiology’s manifest destiny. J Nucl Cardiol. 2006;14:16-24.
[/level-membership-for-internal-medicine-category][not-level-membership-for-internal-medicine-category]
Chapter 7 Attenuation Correction and Scatter Correction of Myocardial Perfusion SPECT Images
HISTORICAL PERSPECTIVE
The field of SPECT imaging was born out of pioneering work done at Duke University in the late 1970s under Ronald Jaszczak1 and John Keyes.2 It was demonstrated that three-dimensional radionuclide imaging could be obtained using an Anger camera rotating around a patient. As early as 1977, it was recognized that attenuation would be one of the major limitations of the new imaging modality.
The effort to solve the problem of attenuation artifacts in nuclear cardiology was carried forward by several groups around the world. Moore et al. demonstrated the feasibility of performing attenuation correction using x-ray computed tomography (CT),3 and Greer KL et al.4 demonstrated the feasibility of acquiring transmission data with a gamma camera system. A complete history of the development of attenuation correction can be found in King et al., 1995.5
The impact of attenuation was first quantitated in the work of Eisner et al. in 1988.6 In this work, differences between males and females were correctly identified as arising from differences in anatomy. This led to significant differences in the mean normal distribution patterns in the left anterior descending (10% to 15% higher in males than females) and right coronary artery (8% to 10% higher in females than males). Later work by Galt et al. demonstrated that with the application of attenuation correction methods, these normal distributions were similar.7 Depuey et al. developed techniques for identifying attenuation and presented algorithms for improving interpretive accuracy using deductive techniques.8
The first attempts at commercialization of attenuation correction were introduced by Picker with its STEP system (Fig. 7-1). This technique was based on the geometry proposed by Tung9 and Jaszczak.10 The system employed a fanning collimator design to collect photons from a fixed line source opposite the detector head on a triple-headed detector system. Early work using this system demonstrated that significant improvements in uniformity could be obtained using the fanbeam collimation system with attenuation correction.11,12 This system failed to received widespread acceptance, because it employed a triple-detector SPECT system and fanbeam collimation. The use of fanbeam collimation led to very extreme truncation artifacts, owing to the small field of view of the fanbeam geometry (~30 cm). Furthermore, the added cost of a third detector system and loss of clinical efficiency from the 120-degree angles of the triple-head systems made this system cost prohibitive.
Other vendors introduced parallel-geometry scanning line source systems. The Vantage/ExSPECT system, introduced by ADAC laboratories, used a 90-degree parallel-hole geometry system for simultaneously acquiring emission and transmission data (Fig. 7-2).13 Using this approach, one of the few multicenter trials of attenuation correction was conducted, demonstrating significant improvement in specificity and normalcy. These results were also duplicated in several single and multicenter imaging trials using various vendor approaches.14–21
One of the major limitations of the first-generation systems was that though they work reasonably well in clinical trials, they did not always perform well in the clinical setting.22 Quality control (QC) of the attenuations correction systems was not well understood, and systematic QC procedures were not in place in most nuclear laboratories attempting to use attenuation correction. The result of this was a very uneven application of QC standards in the field and an eventual low rate of adoption by practitioners.
To address these limitations, ADAC laboratories introduced a second-generation processing suite for its Vantage scanning line source systems, the VantagePRO (Philips Medical, Milpitas, CA). This package used a combination of pre- and post-acquisition QC tools combined with a Bayesian iterative reconstruction algorithm to improve the consistency of the resulting images.23 Clinical trials using this approach demonstrated significant improvement in normalcy and specificity; however, because of the retrospective nature of the study, sensitivity did not show improvement over conventional non-attenuation-corrected imaging.
Another approach that was investigated was the use of x-ray computed tomography to derive the patient-specific attenuation map. Because of the high count flux, very high-quality transmission maps can be obtained. Clinical results from these systems have been reported, and they have been shown to produce significant improvement in interpreter accuracy over non-attenuation-corrected image approaches.24,25
The limitation of x-ray-based approaches is that they are inherently sequential acquisition protocols. Transmission/emission image registration issues, as well as clinical efficiency concerns, have limited the acceptance of these systems. The Hawkeye System, introduced by General Electric, was a departure from the conventional line source attenuation correction, insofar as it employed a low-dose x-ray tube (140 kVp, 2.5 mAs) to generate a patient-specific x-ray-based CT attenuation map referred to as hybrid imaging SPECT/CT. This technique was capable of producing transmission maps and attenuation-corrected images of higher quality (Fig. 7-3). As the need for diagnostic-quality transmission maps has arisen, vendors have introduced SPECT/CT hybrid systems capable of detecting and measuring coronary calcium and performing vascular and coronary CT angiography (Siemens [Symbia], Philips [Precedence]).
SCIENTIFIC FOUNDATION OF ATTENUATION: COMPTON SCATTERING AND THE PHOTOELECTRIC EFFECT (See Chapter 6)
This process is played out in a similar way in the high-energy regimen, albeit with different physical processes in play. Nuclear cardiology (and x-ray imaging as well) exists because of a very peculiar fact of nature: At these energies, the seemingly solid object of the human body is not nearly as solid as it appears. To understand this, we have to introduce an interesting concept, the wave-particle duality of photons.1 At higher and higher energies, photons act as if they have smaller and smaller sizes. In the gamma ray and x-ray ranges, photons could pass through a solid object with little effort. To a high-energy gamma ray, the body looks less like a solid object and more like a cloud of electrons.1
To be precise, attenuation is a misnomer. Most of what is referred to as “attenuation” in nuclear cardiology is in reality photon scatter. The dominant process for “attenuating” photon signal in the energy range used in nuclear cardiology is known as Compton scattering. This process, discovered by Arthur H. Compton in 1923 (resulting in Compton and his graduate student being awarded the Nobel Prize in physics26), is the quantum scatter of light off of matter and the transfer of significant amounts of energy from the photon to the electron.
The photon in a Compton scattering event can be thought of as a billiard ball striking the electron. The electron then absorbs some of the energy from the photon, lowering the energy of the photon (Fig. 7-4). The key parameters of a Compton scattering event are the incident energy of the photon (E0) and the scattering angle of the photon relative to its incident and (θ). The higher the incident energy, the more relative energy can be delivered to the electron. (Imagine a compact car–against-truck head-on collision versus a truck-against-truck collision: The second truck will fare worse in the latter scenario.) Furthermore, the larger the scattering angle, the more energy that can be delivered to the electron. Compton demonstrated that the exact energy of the scattered photon can be calculated from the following formula:
where E0 is the energy of the incident photon, mec2 is the resting energy of an electron (511 keV), and θ is the angle of the scattered photon relative to the incident photon. For a backscattered photon: θ = 180 degrees. Solving the Compton equation:
PHYSICS OF ATTENUATION AND SCATTER COMPENSATION
where I is the flux, μ is the linear attenuation coefficient, and is the change in I over a small distance. In other words, the change in the number of photons over a small distance of material is proportional to the single physical parameter, μ. Solving this equation yields:
[/not-level-membership-for-internal-medicine-category]
